
Abstract
BACKGROUND:
Vibration therapy (VT) causes an increase in motor unit activation tendency, an involuntary recruitment of earlier sedentary motor units, which increases the muscle fiber force generating capacity and muscle performance.
OBJECTIVE:
To evaluate the effect of vibratory massage therapy at 23 Hz and 35 Hz on grip strength, endurance, and forearm muscle performance (in terms of EMG activity).
METHODS:
Ten healthy and right-handed men participated voluntarily in this study. The experiment was characterized by the measurement of MVC (maximal voluntary contraction) grip strength and grip endurance time at 50%MVC, accompanied by the corresponding measurement of the EMG signals of the muscles viz., flexor digitorum superficialis (FDS); flexor carpi ulnaris (FCU); extensor carpi radialis brevis (ECRB); and extensor carpi ulnaris (ECU) in supine posture.
RESULTS:
MANCOVA results showed significant effects of VT frequency on endurance time (p < 0.001); but no significant effect on the grip strength (p = 0.161) and muscle performance (in terms of EMG activities of the forearm muscles). However, VT improves the MVC grip strength and grip endurance time (better at 35 Hz). The Pearson correlation was significant between: weight, palm length, palm circumference, and forearm length with MVC grip strength; and the palm length with the endurance time. In addition, the palm length, palm circumference, and forearm circumference generally serve to better predict MVC grip strength and grip endurance time.
CONCLUSIONS:
Vibration therapy at 35 Hz for 10 minutes on the forearms had a significant positive effect on the neuromuscular performance to enhance muscle performance of upper extermitites and can be used as the optimal range to study the effect of VT. Findings may be used to prepare guidelines for VT in rehabilitation, healthcare, sports, and medical for therapists.
Keywords
Introduction
Vibration therapy (VT) stimulates the muscle spindles, which reinforces its afferent activities. This creates a synchronization of the motor neuron: more force generation of the muscle group [1]. In addition, VT increases the tendency for activation of motor units, the involuntary recruitment of anterior sedentary motor units, which results in a greater force gen-erating capacity of muscle fibers: increased muscle performance [2]. Recently, vibratory intervention has been used to improve: electromyography (EMG) activity; strength; flexibility; and power [3–8]. These have been observed wherever the excitatory response of the muscle plays a vital role in improving muscle activation [6, 9]. When vibrations are applied to the muscle or tendon, they induce involuntary muscle contraction, called the Tonic Vibration Reflex (TVR) [3].
The application of direct and indirect VT has been widely used as a significant approach in the cli-nical and rehabilitation fields. Direct (applied to the specified area) and indirect (whole body or part of the body) applications have been used to increase the force generation capacity and power [6, 9], which are essential for injury prevention, rehabilitation and the reduction of pain/fatigue [10]. In addition, vibratory massage therapy produces mechanical stress on muscle tissue fibers, thereby decreasing muscle tissue adhesion. Massage therapy may reduce pressure or tension on the belly or tendon muscles, which could affect the viscoelastic factor of the muscle tissue. It helps to build muscle force generating abi-lity, improve muscle flexibility and reduce muscle stiffness [6, 11]. Therefore, the activation and len-gthening of the muscle tissue shortened, which event-ually increases tendon muscle compliance and results in improved muscle flexibility, muscle strength and the ability to generate force [6, 7].
Vibrations transmitted to the whole body or to a part of the human body have been taken into account according to the risks to the health and safety of the workers. However, in the short term, exposure to VT may have a beneficial effect on musculoskeletal disorders (MSDs). Specifically, there is a lack of understanding of the physiological phenomenon: indulge in adaptive response, exposure to VT; and the most appropriate vibration parameters (frequency, amplitude and method of application) to choose to in-crease muscle performance and improve safety [12]. MSDs of the upper limbs have been a catalyst for researchers to determine the main risk factors inv-olved: associated with grasping tasks. Vibration massage therapy can be helpful in reducing the risk of MSDs. Therefore, the study of the controls, which are necessary in therapeutic massage, is important.
Grip strength is widely accepted as an indicator of maximum exertion hand force [13] and contraction of the active muscles of the hand and forearm. Grip strength was significantly correlated with upper limb function in the disabled and/or injured [14]. Although the posture affects the grip strength and endurance time [15–18]. Fiebert et al. [19] reported that the supine position of the forearm was the most effective gripping posture [15]. Kattel et al. [17] found that the maximum grip strength was reached at 0° upper arm abduction and 135° elbow flexion, with a neutral wrist. In addition, the grip strength has a curvilinear correlation with age [20]: it increases from childhood to puberty, reaches its maximum between 20 and 40 years and decreases slowly with age [14, 20].
In this study, muscle spindles were stimulated by simultaneously applying VT and massage therapy to improve the afferent activities of the forearm muscles. This may result in greater force capacity due to the involuntary recruitment of earlier sedentary motor units. Therefore, an optimal protocol of vibration exposure to improve forearm muscle performance was needed with the specific combination of exposure frequency, duration, and training days. If the positive effects on the muscles are significant during the experiments and analyses, the recommendations can be used by the physiotherapists. Therefore, the assumed alternative hypothesis for this investigation was:
“Vibration therapy frequency and days of exposure had a significant effect on grip strength, endurance time, and forearm muscle performance (in terms of EMG activities).”
Methods
Design of the experiment
A full factorial design (7 days×3 levels (without vibration exposure (WVE), after vibration exposure at 23 Hz, and 35 Hz) ×10 subjects) was used in this study. Independent factors were the frequency of exp-osure to vibration and the number of days of exposure. Performance was evaluated in terms of dependent variables: MVC grip strength; grip endurance time; and features of EMG signals (%normalized EMG, median frequency and slope based on the regression line on the median frequency).
Vibration exposure frequency
Many investigators have used fixed frequencies for VT: 18 Hz [21], 26 Hz [22], 30 Hz [5, 23]; and 35 Hz [4, 24]. However, there has been no agreement on determining the optimal vibration frequency, which has been confounded by the different protocols used in research. In the trail run it was found that the minimum frequency of vibratory massager may be controlled at 23 Hz. Therefore, the levels of vibration exposure for VT were kept at 23 Hz and 35 Hz.
Participants
Ten healthy and right-handed men participated voluntarily in this study. They did not report any history of dysfunction of the hand, wrist or forearm, or any other neuromuscular problem. The subjects were called from the campus of the university through notices and were explained in detail about the experimental protocol and the risks. All subjects gave their written consent. Subjects were also allowed to terminate the experiment at any stage, if they wished. Anthropometric measurements of the forearm and hand of the participants were recorded, as well as the recording of their age, height and weight, in accordance with the previous study [4]. These anthropometric measurements are presented in Table 1.
The anthropometric measurements of the participants
The anthropometric measurements of the participants
A rig was designed to support the forearm in the supine position (Fig. 1) and was fabricated in-house. The vibratory massager (Model: Max JS113; Make: M/s Manipol Massager Medicare Products Inc. India) was attached to the rig. This massager consisted of a small DC motor with an eccentric head enclosed in a metal case whose frequency was between 15 Hz and 65 Hz. The slightly curved plastic disc of diameter 5 cm was attached to the head massager for hand contact. The grip Jammer dynamometer (Model: G100; Brand: M/s Biometrics Ltd.UK) was also attached to the rig to record the MVG grip strength and grip endurance time.
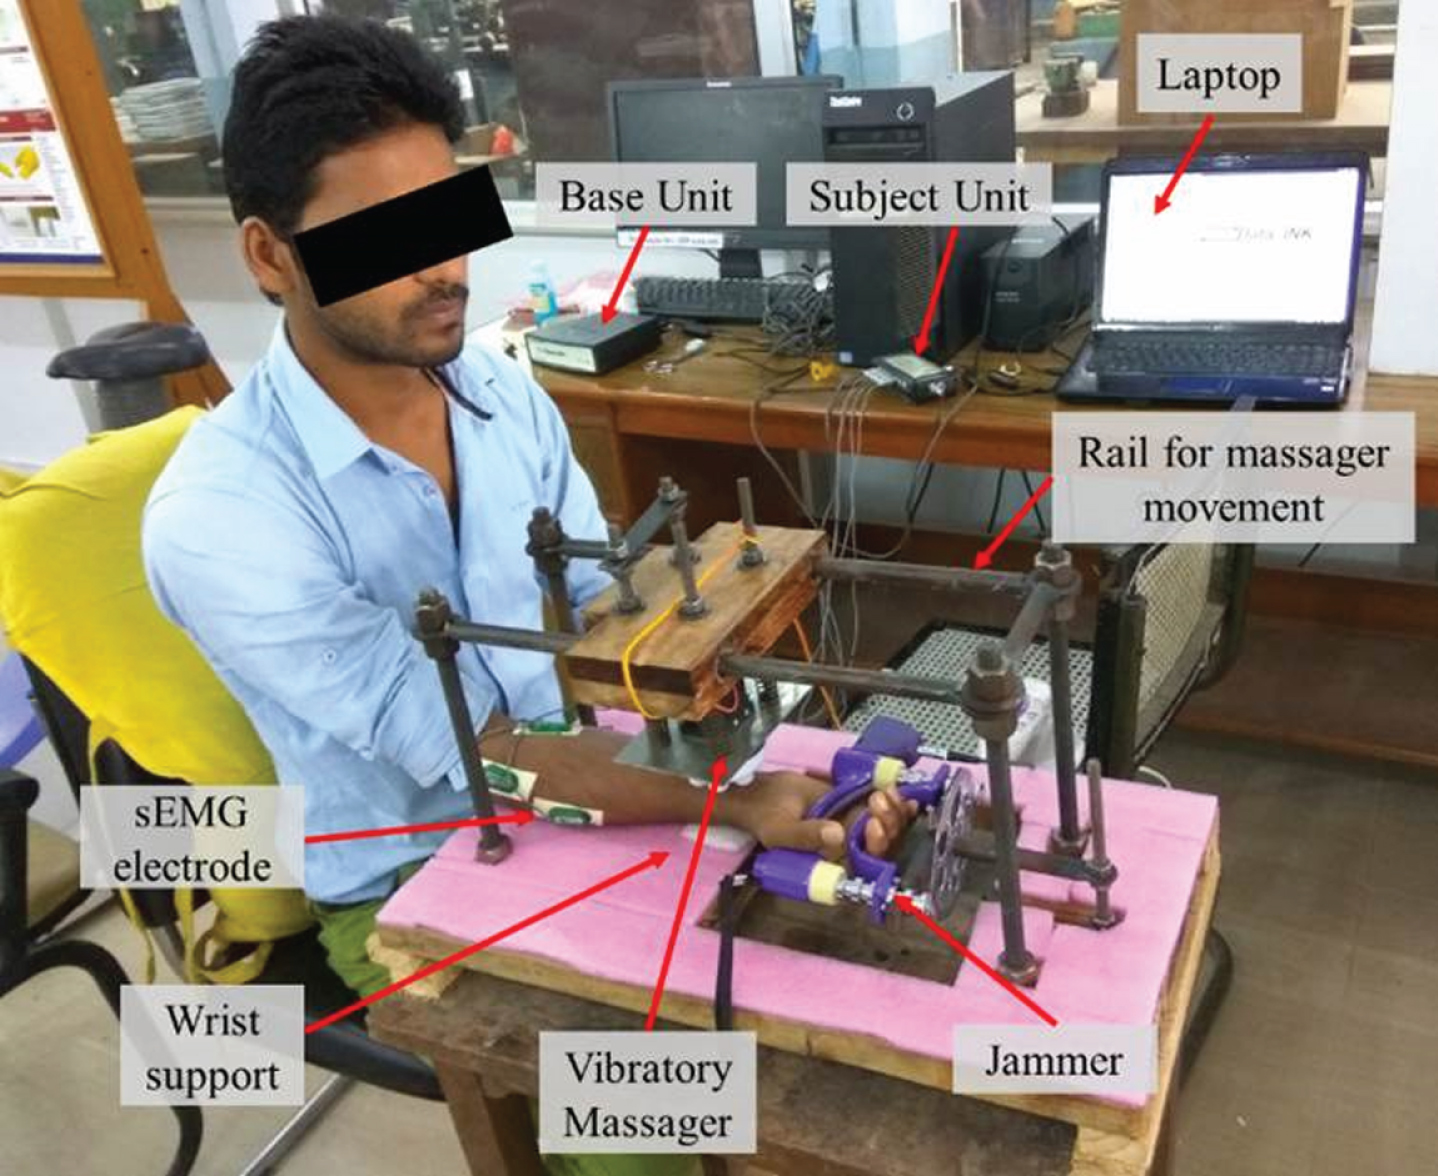
Experimental rig.
In this study, subjects were asked to sit on a fixed-height chair with the forearm lying horizontally on the wooden platform with an adjustable wrist support (Fig. 1). The height of the platform has been adjusted to the postures of the elbows, shoulders and trunk. The upper right arm of the subject was in the coronal plane with a 0° abduction ensuring a 90° elbow angle. However, because of the inconsistency in the height of certain subjects and the fixed height of the chair, shorter subjects could not remain seated with their elbows bent at 90°; they were therefore allowed to flex their forearms further up to about 30° [16].
The following steps were followed for the vibration exposure to forearm and for the assessment of the muscle performance:
Identifying the muscles for placement of EMG sensors and then marking the positions with permanent marker. Attaching the EMG sensors to the selected muscles and asking the subjects to squeeze the grip meter, in supine posture at the beginning of the experiment without vibration exposure with a fixed grip span. Taking initial recording of grip MVC and after 5 minutes of rest measuring the grip endurance time at 50%MVC (taking reference as maximum value of both trials) along with the EMG recordings (see sections 2.5.2 and 2.5.3). The detaching of the EMG sensors and the grip meter. Applying VT at 23 Hz frequency for a duration of 10 minutes (see section 2.5.1). A rest period of 15 minutes. Repeat point No. 2 & 3. The detaching of EMG sensors and grip meter. Applying VT at a frequency of 35 Hz for a duration of 10 minutes (see section 2.5.1). Repeat point No. 6 & 7.
Exposure to Vibratory Massage Therapy (VMT)
The following steps were followed to apply VMT:
A VMT was administered for 10 minutes based on the usual duration of massage therapy [11]. The VMT was applied directly to the flexor side of the forearm muscles, in a supine posture, as shown in Fig. 1. During the VMT, ten movements of back and forth [6] were given between olecranon processes to the styloid process of the ulna. A small amount of mustard oil has been placed on the skin of the forearm to reduce the friction and heat produced between the massager’s head and the skin.
MVC grip and grip endurance time recording
The subject was asked to squeeze the grip dyn-amometer at maximum capacity (twice, with a 2-minute rest period to record the MVC) [6, 25] until they felt intolerable discomfort and cannot keep the effort up to the target level. The grip Jammer (model: G100; M/s Biometrics Ltd. UK) has been directly interfaced with a laptop using Data LINK. Then the endurance time has been recorded at 50%MVC and simultaneously the EMG signals were obtained using Data LINK for subsequent analyzes.
sEMG recording
Active differential surface EMG electrodes (SX230, M/s Biometrics Ltd. UK) were used to record surface EMG signals at a sampling frequency of 1024 Hz. To reference and attenuate the noise of EMG signals, an electrode was attached to the wrist of the non-dominant hand of the subject. In accordance with the SENIAM protocol [26], the electrodes were placed on flexor carpi ulnaris (FCU), flexor digitorum superficialis (FDS), extensor carpi radialis brevis (ECRB), and extensor carpi ulnaris (ECU) muscles of the right forearm. These muscles were selected according to their functional importance in the gripping task. Prior to the placement of the electrodes, the skin and electrodes have been cleaned with a cotton swab soaked in alcohol (the skin may be shaved before cleaning, if necessary) [27].
Recording of vibration levels
The vibration level on the vibratory massager was recorded after the VMT at 23 and 35 Hz to unde-rstand the vibration level patterns. To measure the vibration level, a tri-axial accelerometer (model: SEN041F, manufacturer: piezo-electronic PCB, New York, USA) was mounted on the massager (Fig. 2). The acceleration signal recordings were acquired via a data acquisition card (National Instrument, DAQ Card-9234), which was interfaced with a laptop (Samsung Core i3 processor) via a USB cable and a LabVIEW12.0 program was written to acquire, record and analyze the vibration signal. Several trail runs were performed at the frequency of interest and the reliability of the experimental setup was found to be approximately (97±1.27%) [6]. In addition, it was found that at 23 Hz the average RMS values of the vibration exposure were μ= 4.75 with σ= 0.51 m/s2 in X-direction, μ= 3.77 with σ= 0.37 m/s2 in Y-dir-ection and μ= 5.21 with σ= 0.51 m/s2 in Z-direction while at 35 Hz RMS value of the vibration exposure were μ= 8.789 with σ= 0.64 m/s2 in X-direction, μ= 6.79 with σ= 0.47 m/s2 in Y-direction and μ= 8.13 with σ= 0.72 m/s2 in Z-direction.
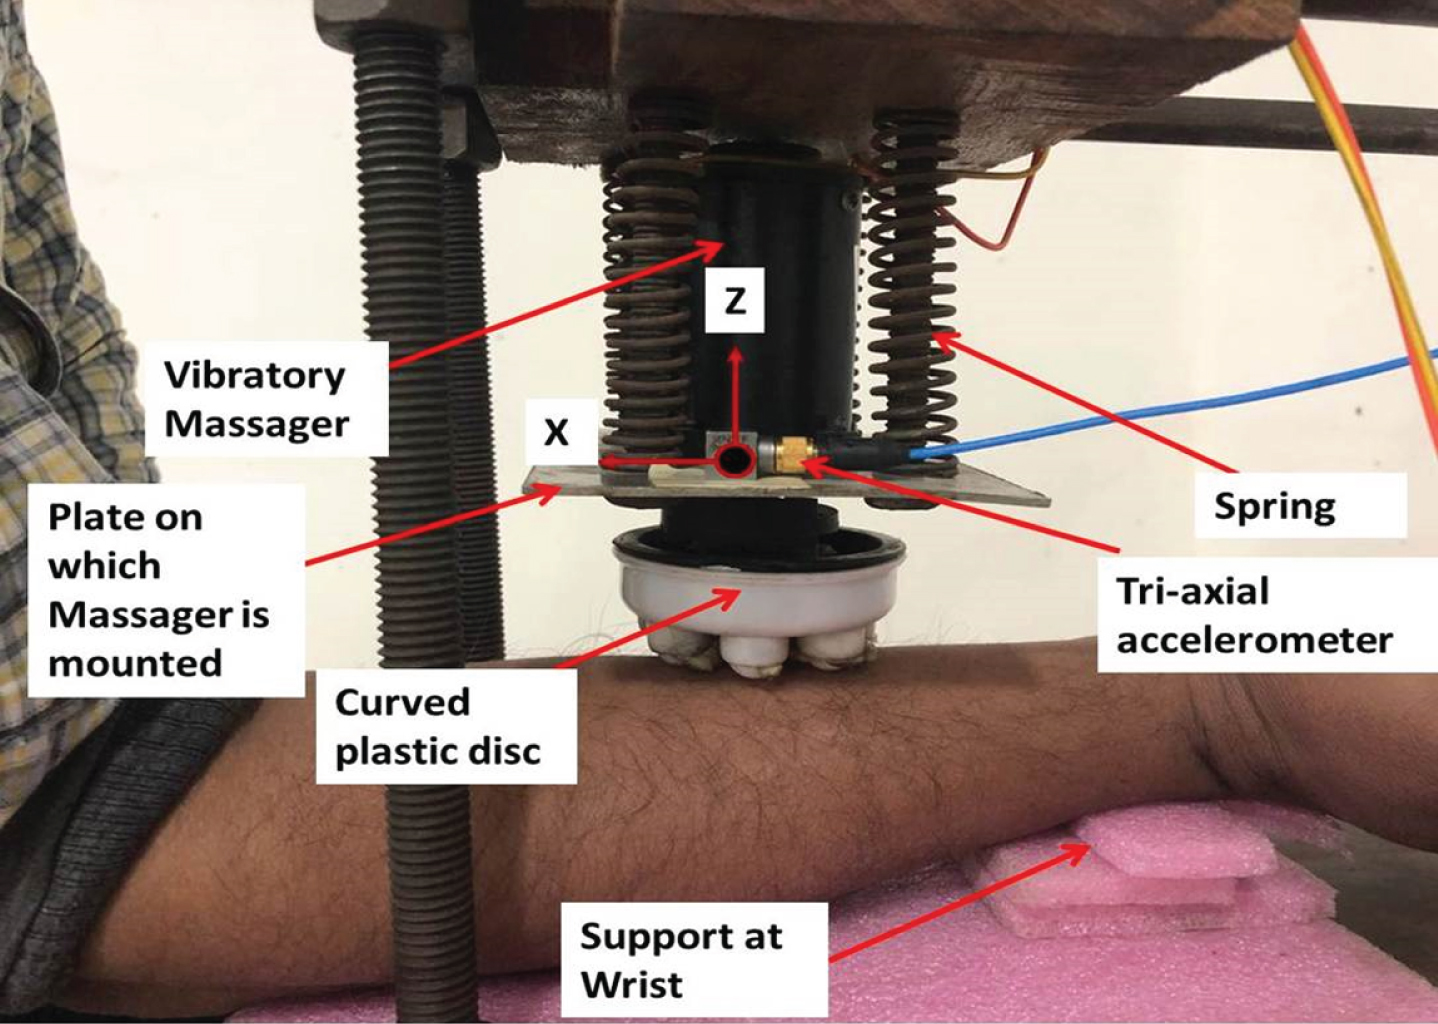
Tri-axial accelerometer fixed on a plate on which vibratory massager is mounted.
Summary of data on MVC grip strength, grip endurance time and %normalized EMG values relative to experimental conditions was presented in Table 2. The EMG RMS was calculated using the Triangle-Bartlett windowing method, then normalized (nRMS) using maximum dynamic normalization, then expressed as a percentage of maximum voluntary exertion (%MVE). The muscle EMG RMS for all conditions and subjects were normalized acc-ording to the formula used by Strasser [28]. A multivariate analysis of co-variance (MANCOVA) was also performed with SPSS 20.0 to investigate the effect of key factors and their interaction and covariates (age, weight, height, palm length, palm circumference, forearm length and forearm circumference) on dependent variables (see Table 3 for p-values). In addition, Pearson correlations were also performed to evaluate the relationship (linear or non-linear) between the dependent variables and the cov-ariates (see Table 4 for correlation coefficients “r”).
Summary of data recorded on maximum voluntary contraction, endurance time and %normalized EMG values for experimental treatments
Summary of data recorded on maximum voluntary contraction, endurance time and %normalized EMG values for experimental treatments
Note: WVE- without vibration exposure, MVC- maximal voluntary contraction, EMG-electromyography, MVE-maximal voluntary exertion, FDS-flexor digitorum superficialis, FCU-flexor carpi ulnaris, ECRB-extensor carpi radialis brevis, ECU-extensor carpi ulnaris.
Results of multivariate analysis of co-variance (MANCOVA)
Note: *p < 0.05, **p < 0.001, #p > 0.05 (not significant).
Pearson’s correlation coefficient (r) between dependent variables v/s co-variate and independent variables
Note: *p < 0.05, **p < 0.001, #p > 0.05 (not significant).
MVC grip strength and grip endurance time
The effect of VT frequency was significant on grip endurance time (p < 0.001), while no significant effect on MVC grip strength (p = 0.161). In addition, days of exposure had a significant effect on MVC grip strength and grip endurance time (p < 0.001), as shown in Table 3. In addition, palm length (p < 0.001), palm circumference (p < 0.05), and forearm circumference (p < 0.05) had a significant effect on the MVC grip strength and grip endurance time. Age (p < 0.001) and weight (p < 0.05) had a significant effect on MVC grip strength, but not on grip endurance time. In addition, forearm length showed a significant difference in grip endurance time (p < 0.001), but not in the MVC grip strength (p = 0.356).
In addition, the Pearson correlation test (Table 4) showed a significant positive correlation between VT frequency and grip endurance time (r = 0.287, p < 0.001), but not on MVC grip strength (r = 0.106, p = 0.127). There was also a significant correlation between the days of exposure and the MVC grip strength (r = 0.302, p < 0.001) and the VT frequency (r = 0.531, p < 0.001). In addition, weight (r = 0.144, p = 0.037), palm length (r = 0.357, p < 0.001), palm circumference (r = 0.264, p < 0.001), and forearm length (r = 0.234, p < 0.001) had a significant correlation between MVC grip strength and only the palm length (r = 0.187, p = 0.007) with grip endurance time. Interestingly, there was more increase in MVC grip strength and grip endurance time at 35 Hz compared to WVE and 23 Hz VT frequency (Fig. 3 and Fig. 4).

MVC grip strength value (kgf) with respect to days-wise vibration therapy.
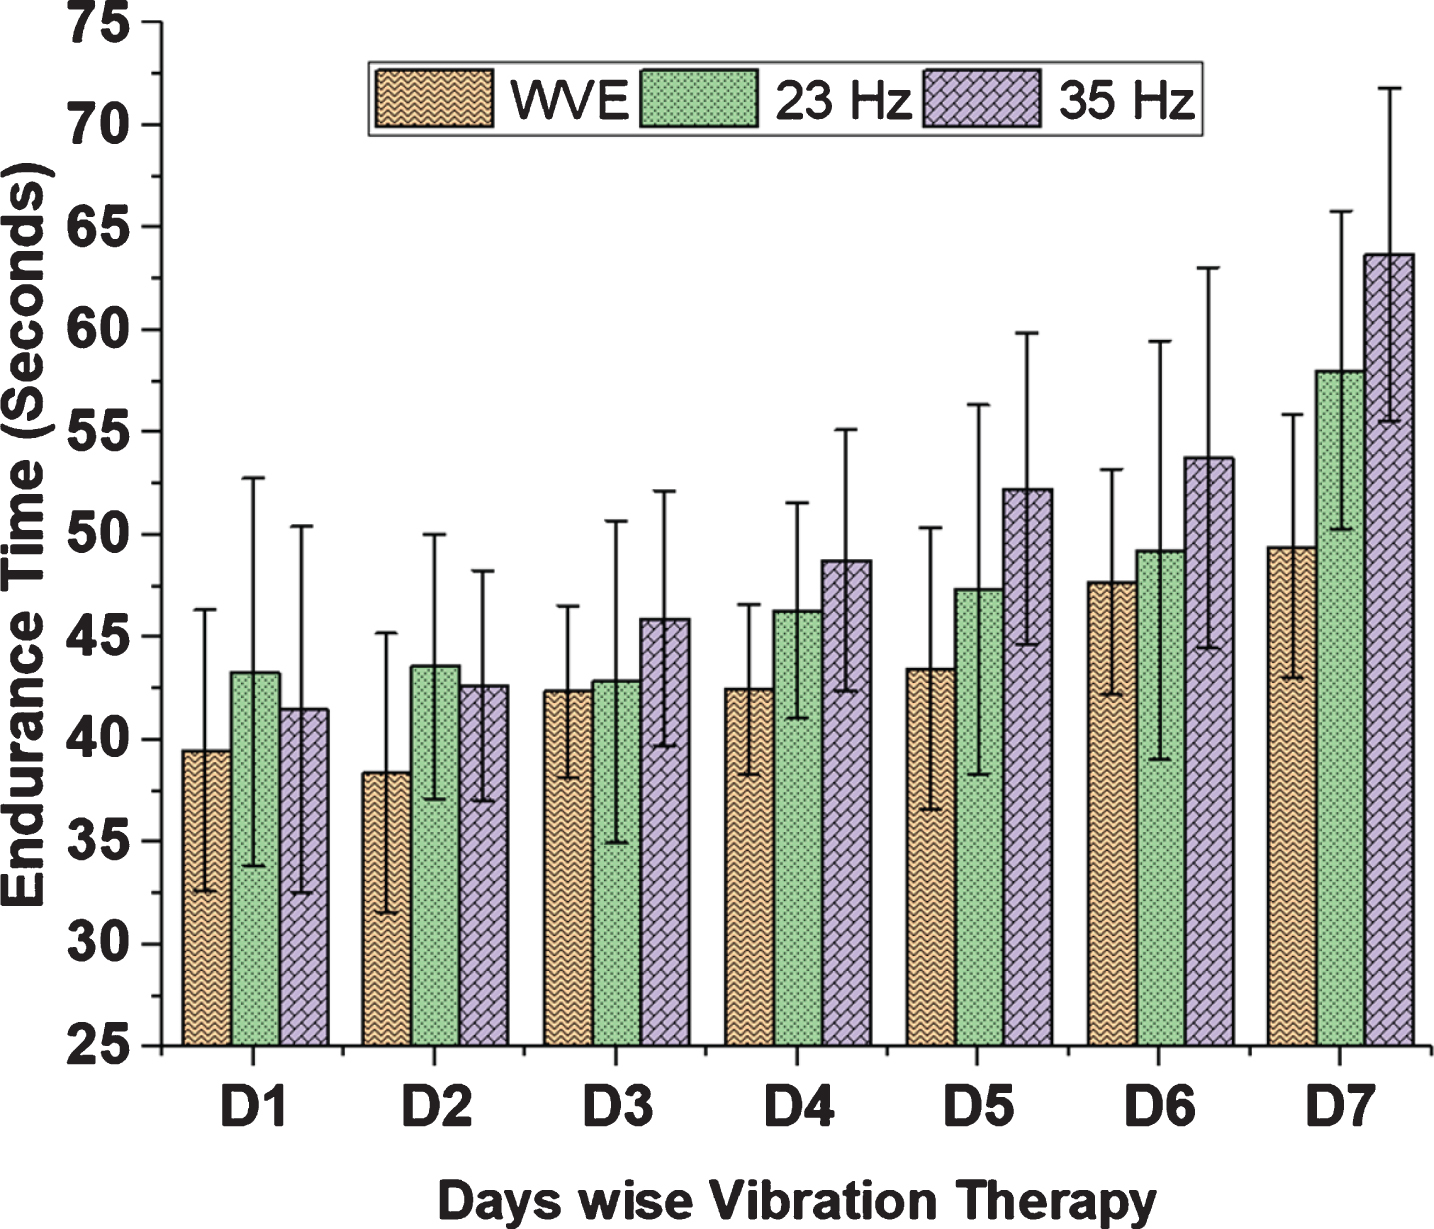
Grip endurance time (second) with respect to days-wise vibration therapy.
There was a significant effect of days of exposure and palm length (Table 3) on the %normalized EMG of FCU muscle (p < 0.05). In addition, there was also a significant effect of age and height on the %normalized EMG of FDS muscle (p < 0.001), weight on the %normalized EMG of FCU (p = 0.028) and ECRB muscles (p = 0.044). The palm circumference had a significant effect on the %normalized EMG of FDS (p < 0.001), FCU (p < 0.001) and ECRB muscles (p = 0.003). In addition, forearm length had a significant effect on the %normalized EMG of FDS (p < 0.001), FCU (p = 0.003) and ECU muscles (p = 0.002). Forearm circumference had a significant effect on the %normalized EMG of FDS (p < 0.001) and FCU muscles (p = 0.001).
Interestingly, the Pearson correlation test (Table 4) showed a significant negative correlation between days of exposure and the %normalized EMG of FCU muscle (r = –0.132, p = 0.05). In addition, there was also a significant correlation between the %normalized EMG of muscle ECRB and age (r = 0.239, p < 0.001), weight (r = 0.268, p < 0.001), forearm circumference (r = 0.212, p = 0.002) and palm circumference (r = –0.215, p = 0.002). In addition, there was a significant correlation between the %normalized EMG of FCU muscle and palm circumference (r = –0.257, p < 0.001), FDS muscle with height (r = –0.142, p = 0.04), and ECU muscle with forearm length (r = 0.203, p = 0.003).
In addition, the EMG activity was more in the extensor muscle, i.e., ECU muscle (maximal at 23 Hz), than that of the flexor muscle (Fig. 5) on the basis of the %normalized EMG value. Therefore, results shows that the ECU muscle was the most active, followed by the FCU muscle for all experimental treatments, while the ECRB muscle was the least active at the beginning of the experiment (WVE). However, EMG activity of ECRB muscle increased after VT (more at 23 Hz). An increase in muscle activation was also observed for all muscles after VT (except for FDS muscle, whose average %normalized EMG decreased at 23 Hz, and then increased further after 35 Hz of VT).
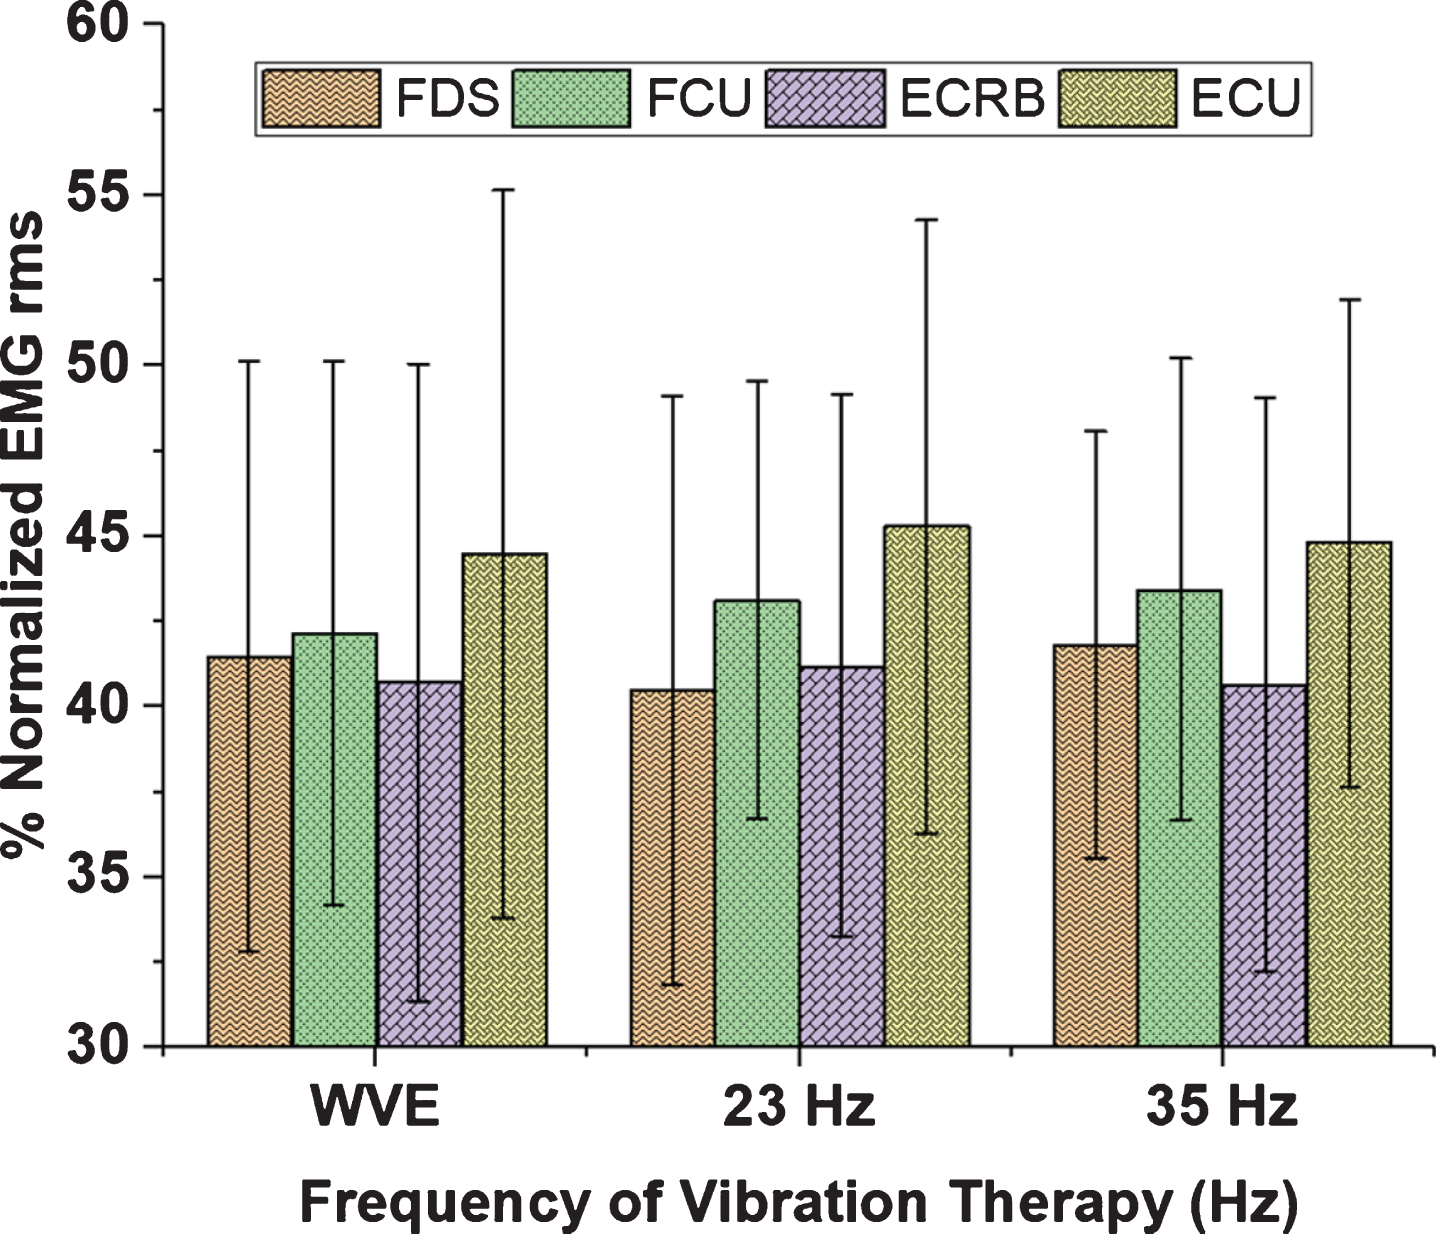
The %normalized EMG RMS value of the EMG signal of the respective muscles with respect to the VT frequency.
There was a significant effect of age and weight on the median frequency (MDF) for FDS, FCU and ECU muscles (p < 0.001). There was also a significant effect of height for FCU muscle (p < 0.001) and palm length for FDS (p = 0.018), ECRB (p = 0.05) and ECU muscles (p < 0.001) on MDF. In addition, palm circumference had a significant effect on the MDF for FDS (p = 0.038) and FCU muscles (p < 0.001). There was a significant effect of forearm length on MDF for FDS (p < 0.001) and ECRB muscles (p = 0.009); and forearm circumference for FDS and FCU muscles (p = 0.001). In addition, Fig. 6 suggests that the FDS and FCU muscles had firing frequency lower than ECRB and ECU muscles.
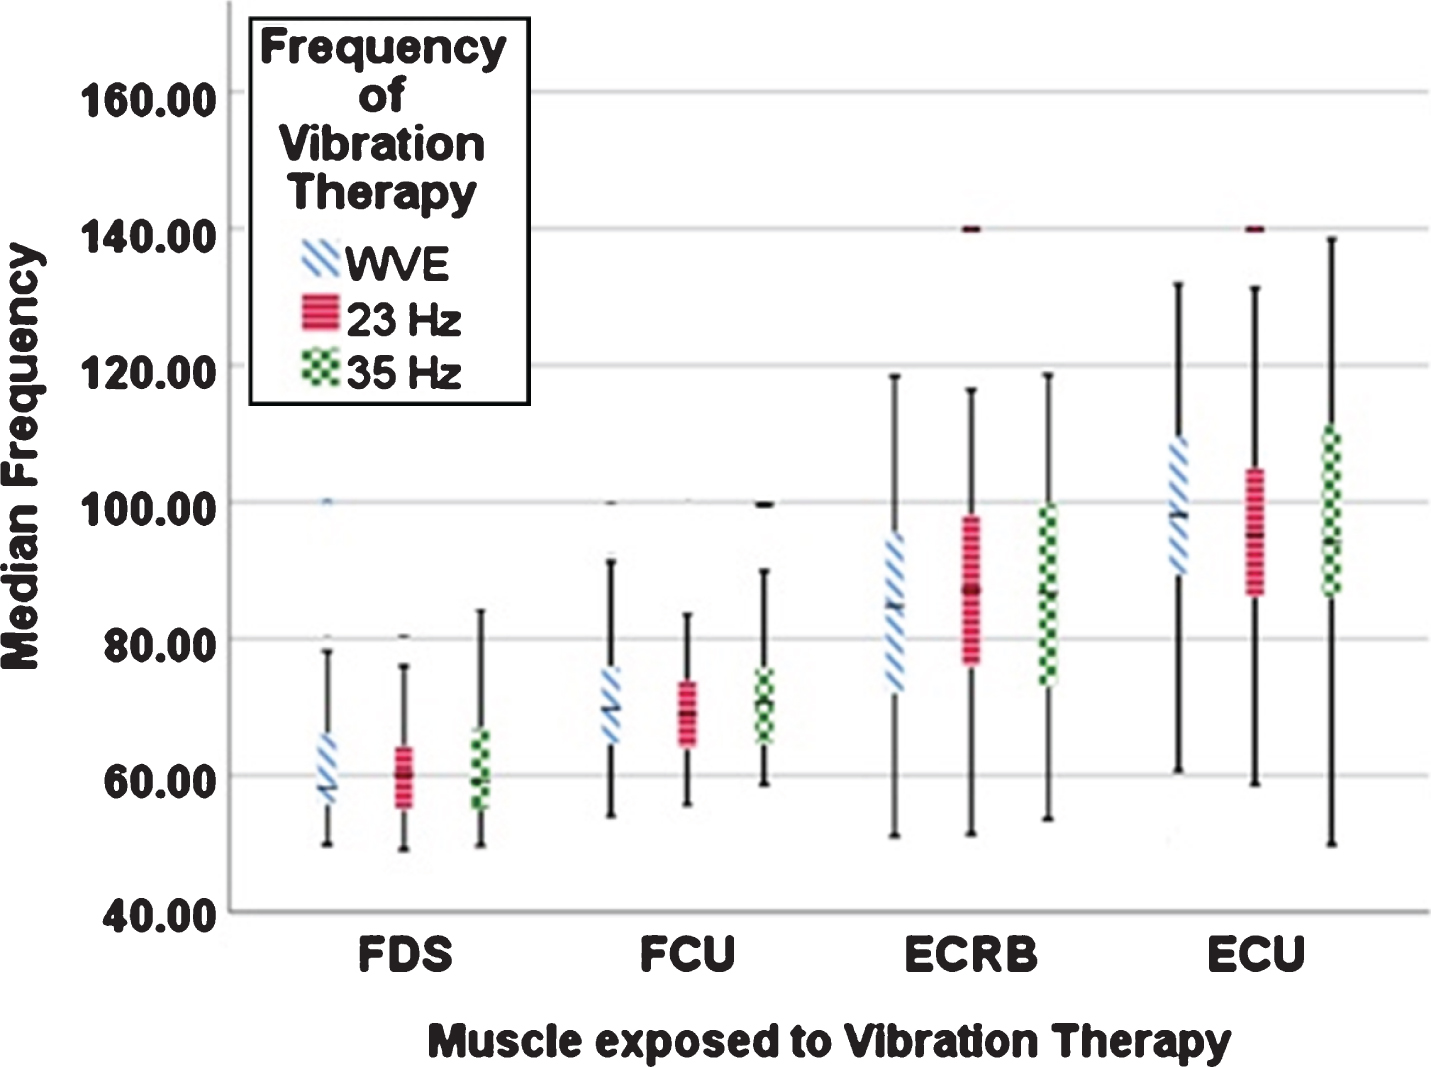
Median frequency (over the spam of EMG recording during grip endurance test) of the EMG signal of the respective muscles with respect to the VT frequency.
The Pearson correlation test (Table 4) showed a significant correlation between MDF of FDS muscle and weight (r = 0.383, p < 0.001) and with palm length (r = 0.307), p < 0.001). In addition, age (r =–0.227, p < 0.001), palm circumference (r = –0.290, p < 0.001) and forearm circumference (r = –0.165, p = 0.016) had a significant negative correlation with MDF of FCU muscle; age (r = 0.335, p < 0.001), weight (r = 0.301, p < 0.001), palm length (r = 0.179, p = 0.009), forearm circumference (r = 0.285, p < 0.001) and forearm length (r = –0.226, p = 0.001) with MDF of ECRB muscle; age (r = –0.255, p < 0.001), weight (r = –0.230, p = 0.001), palm length (r = –0.392, p < 0.001), palm circumference (r = –0.226, p = 0.001) and forearm length (r = –0.197, p = 0.004) with MDF of ECU muscle.
The present study (Table 3) showed that days of exposure had a significant effect on the slope based on regression line on the median frequency (SMDF) of the FCU muscle (p = 0.006). In addition, there was significant effect of age, weight, height and palm circumference on the SMDF of all muscles (p < 0.05); palm length on FDS (p = 0.003) and ECRB muscles (p < 0.001); and forearm length and forearm circumference on ECRB (p < 0.001) and ECU muscles (p < 0.001).
The Pearson correlation test (Table 4) showed a significant correlation between SMDF of FCU muscle and days of exposure (r = –0.19, p < 0.001); SMDF of FDS with age (r = 0.292, p < 0.001), height (r = –0.208, p = 0.002), and palm circumference (r = 0.146, p = 0.034), forearm circumference (r = 0.242, p < 0.001) and forearm length (r = –0.165, p = 0.017); SMDF of FCU muscle with age (r = 0.219, p < 0.001), palm circumference (r = 0.357, p < 0.001) and forearm circumference (r = 0.271, p < 0.001); SMDF of ECRB muscle with weight (r = –0.211, p = 0.002), palm length (r = –0.263, p < 0.001) and forearm length (r = –0.216, p = 0.002) and ECU muscle with age (r = 0.196, p = 0.004), palm circumference (r = 0.206, p = 0.003), forearm circumference (r = 0.207, p = 0.003) and forearm length (r = –0.164, p = 0.017).
In addition, ECRB muscle (Fig. 7) was found to have a higher fatigue response, followed by ECU muscle. However, this response to fatigue was greater when the vibration exposure was delivered at low frequency (23 Hz), for all muscles. It is interesting to note that when vibration therapy was administered at a higher frequency (35 Hz), the response to fatigue decreased, but this occurs more frequently after the 4th day of vibration exposure in all the muscles.

The slope based on the linear regression analyses performed on median frequency of the signal over the spam of EMG recording during grip endurance test of the respective muscles with respect to the VT frequency.
%normalized EMG values
In the present study, there was a significant effect of days of exposure on %normalized EMG of FCU muscle (p = 0.026), but no significant effect of VT frequency on %normalized EMG of muscles. The results also show an increase in %normalized EMG after vibration exposure (at 23 Hz and 35 Hz) for all muscles compared to WVE, except after VT at 23 Hz for the FDS muscle (Fig. 5). In line with present results Moras et al. [29], reported an increase in the EMG rms value after vibration exposure compared with WVE for all muscles, except after 25 Hz for the deltoid and pectoralis muscles. In addition, they reported no significant effect on muscles at 45 Hz and 25 Hz. Alam et al. [6] also reported an increase in the mean EMG RMS value for the FCU and ECRB muscles and a decrease in the mean EMG RMS value for the FDS and ECU after 35 Hz of VT. In addition, our other study showed that, days of exposure and VT protocols had a significant effect on the %normalized EMG rms of all muscles (p < 0.05) immediately and after post-treatment in both groups [7]. Contrary, Cardinale and Lim [9] reported that there were significantly different effects of vibration exposure at 30 and 50 Hz on EMG activity in the vastus lateralis muscle, but that 40 Hz was no different than 30 Hz. Hazell et al. [23] also reported significantly different effects of vibration exposure at 25 Hz to 30 Hz and at 40 to 45 Hz on normalized EMG activity in the vastus lateralis muscle. In addition, they found significantly different effects of 25 Hz and 40 to 45 Hz on the biceps femoris muscle.
Mogk et al. [18] reported that activation of the flexor muscles was greater than activation of the extensor muscles with supine posture, whereas activation of the extensor muscles was greater than activation of the flexor muscles in a pronated posture. In addition, Alam et al. [7] also suggested that the activation of the flexor muscle was greater than that of the activation of the extensor muscle in supine posture and the combination of a higher frequency with a low amplitude induced a greater activation of muscle EMG activity with a longer duration of exposure. In contrast, present results shows that the supination posture had the highest %normalized EMG activity in the ECU muscle (highest activation at 23 Hz), followed by the flexor muscle FCU (highest activation at 35 Hz) during the gripping task. It was also found that (with respect to %normalised EMG values), the ECU was the most active followed by the FCU muscle for all experimental treatments, while the ECRB muscle was the least active at the beginning of the experiment (WVE). After the administration of vibrations, muscle activity of the ECRB muscle increased (more at 23 Hz than at 35 Hz) (Fig. 5). On the contrary, Loren et al. [30] reported that the muscular activity of the ECRB was greater than that of the ECU muscle in the supine posture. In support of current findings, Bano et al. [31] reported that the ECU muscle was the most active muscle for all experimental conditions in supine posture. In addition, Mogk et al. [18] concluded that muscle activation was mainly dependent on forearm posture, with the highest activation of the flexor muscles (0.5–6.4%MVE) in the supine posture and the greater activation of the extensor muscles in pronation posure (3.5–8.8%MVE).
In addition, fatigue in the extensor muscle has been reported to be attributed to constant activation, specified by fewer pauses in extensor muscle activity than in the flexor muscle [32]. As a general rule, a muscular load expressed as EMG activity of 2 to 5%of the MVE for a static load and 10 to 14%for a dynamic load was suggested as a threshold value for an uninterrupted work task on a day [33]. However, Aaras and Westgaard [34] indicated that a 1%threshold of the MVE could be more appropriate for a “static” loading. The present results show maximal extensor muscle activity (2.5%MVE at 23 Hz and 2.4%MVE at 35 Hz) in ECU muscle and in FCU (flexors muscle) (1.4%MVE at 23 Hz and 1.9%MVE at 35 Hz) during the supine posture after VT. In addition, Alam at al. [7] reported that highest %normalized EMG rms was found for FDS (40.99%of MVE) after VT (f = 45 Hz, a = 3±0.5g, 60 Sec) in sedentary life style group and 36.14%of MVE in group of construction workers after VT (f = 45 Hz, a = 9±0.5 g, 60 Sec). The differences in the results can be attributed to the difference in vibration exposure method, the apparatus used for the vibrations, the duration of exposure, the frequency, the different muscles and the gripping characteristics. In addition, current results indicate that prolonged exposure in the same postures during treatment may limit muscle relaxation and contribute to fatigue, mainly in the extensor muscles. In addition, the level of muscular effort depends on the grip strength of the individual, which may predispose some to an increased risk of forearm injury.
Median frequency
The results showed an increase in the MDF of the EMG signal of all muscles, suggesting increased muscle discharge rate during the endurance test after VT. A similar result was obtained by Griffin et al. [35] where an increase in the rate of discharge of the triceps brachii muscle was observed after exposure to vibration during sustained contraction. Figure 6 suggests that the FDS and FCU muscles had lower firing frequency than that of the ECRB and ECU muscles. Rittweger et al. [22] reported a significant increase in the MDF of vastus lateralis after exhaustive squat exercise (349 seconds) with vibration exposure (f = 26 Hz, A = 12 mm). Doheny et al. [36] also found an increase in the MDF and suggest an increase in muscle strength. Kalra et al. [37] found no significant effect of age on the MDF of EMG signal of the biceps brachii muscle. In addition, the present study showed that the MDF of FDS, FCU and ECU muscles is significantly influenced by age and weight (p < 0.001). In the present study, MDF increased more for extensors than for flexors during the endurance task at 50%MVC. In contrast, Stulen [38] recalled that in the first dorsal interosseous muscle and the deltoid muscle, the largest decrease in MDF occurred at 50%MVC.
Slope based on linear regression line on the median frequency
Jackson and Turner [5] investigated the acute residual effect of vibration on the strength of knee extensors by performing a vibratory intervention directly on the muscle belly for 30 minutes at a vibration frequency of 30 Hz and 137 Hz, indicated that low frequency vibrations (30Hz) could induce muscle fatigue, probably by activating the muscle more effectively. In addition, present results showed that the fatigue response was greater in the extensor muscles (ECRB followed by the ECU muscle) than in the flexor muscles during the endurance task at lower frequency, i.e., at 23 Hz, for all muscles (Fig. 7). Also, our previous study showed that, based on regression line of median frequency, there was more fatigue in extensor muscle (ECRB) for most VT protocols in both groups [7]. According to current findings, Bystrom et al. [39] and Hagg and Milerad [32] also reported that, during gripping tasks, extensor muscles fatigued more quickly than the flexors muscles.
Hagg and Milerad [32] reported that the ECRB muscle had a higher fatigue response than FDS and FCU muscles. Therefore, it can be suggested that fatigue in the ECRB muscle was more obvious, as an increase in the EMGrms value showed that additional motor units were recruited to compensate for fatigue during treatment. The present study also revealed that, when vibration therapy was administered at a higher frequency, i.e., 35 Hz, the fatigue response decreased, but this response occurred more predominantly after the fourth day of vibration exposure. This decrease in fatigue response after a vibration massage therapy at a higher frequency (35 Hz) may be due to the fact that the massage therapy decreases the pressure or tension on the belly or tendon muscles, which may affect the viscoelastic factor of muscle tissue. As a result, it contributes to the improvement of the muscular strength generation capacity as well as the improvement of muscle flexibility by reducing muscle stiffness.
Anthropometric effects on MVC grip strength and grip endurance time
The interaction of the human body with the app-lied vibratory therapy strongly depends on the characteristics of the subject: anatomy, positioning, muscle stiffness and the mechanical properties of the individual tissues. In this study, the effect of VT fre-quency was significant on the grip endurance time (p < 0.001), but no significant effect on MVC grip strength (p = 0.161). In addition, days of exposure had a significant effect on MVC grip strength (p < 0.001) and grip endurance time (p < 0.001). However, our previous study showed a significant effect of the VT frequency and days of exposure on MVC grip strength and grip endurance time [7]. Contrary to current findings, a significant difference between the vibration therapy and non-vibration therapy groups has been reported on the grip strength [2].
Our previous study revealed a significant difference between days of exposure, vibration frequency, palm length, and forearm length on the grip strength and endurance time [4]. Wu et al. [15], in their research on the grip strength of 482 adults in Taiwan, reported that the gender, age and palm length showed a significant difference on grip strength. In addition, they added that the palm length, after gender and age, was the most influential factor affecting grip strength. Lee and Hwang [40] also showed that grip strength differed statistically by gender, handedness, and posture. Interestingly, present result also showed that the palm length and age had a significant effect on grip strength and the palm length was the most determining factor for grip strength (r = 0.357, p < 0.001). Fiebert et al. [19] found that palm length was strongly correlated with grip strength. The palm length provides for larger bulk of thenar musculature, which may be the reason for the strong correlation.
Nicolay and Walker [16] concluded that, in contrast to strength, anthropometric variations remained unrelated to grip endurance time. In addition, they found that forearm and hand measurements were better predictors of grip strength than height and weight. Eidson et al. [41] showed that gender and palm circumference were uniquely and significantly related with participants’ grip strength for dominant and non-dominant hand. Interestingly, present results suggest that weight, palm length, palm circumference and forearm length are significantly (p < 0.05) correlated with grip strength, whereas the endurance time was only significantly correlated with the palm length (r = 0.187, p < 0.05). In agreement with present findings, Crow and Ship [42] found a significant difference between age and grip strength (p < 0.001) and no significant correlation between age and endurance time (r = –0.13, p = 0.38). Similarly, Petrofsky and Lind [43] reported a significant improvement (p < 0.01) in the grip strength, but no significant correlation (r = 0.11, p > 0.05) of endurance time with aging in men. The results of this study showed that forearm length showed a significant difference on endurance time (p < 0.001), but not on grip strength (p = 0.356). These discrepancies in findings may be due to the differences in experimental approaches, grip strength measuring devices, or the methods used in measuring the anthropometric variations.
In summary, several studies have been reported on the intermittent use of vibratory treatment with a 60-second exposure time with a 60-second rest period, while some studies were conducted continuously from 90 seconds to 10 minutes. However, there is in particular a lack of understanding of the physiological phenomenon related to the adaptive response to exposure to vibration therapy, and the most appropriate optimal vibration parameters (frequency, amplitude and method of application) to choose to increase muscle performance in acute and long-term studies. Therefore, future research should focus on the optimal dosage (frequency of vibration, amplitude and duration) during treatment.
Limitations and future scope
The most important limitation is the small size of the sample, while a larger size could have had a better and stronger influence. Only a short-term effect (7 days) of VMT has been studied. The effect of the surface or the shape of the massager has not been taken into account. During the experiments, the mild discomfort or pain reported was overlooked, which may have inhibited muscle performance. Further investigation is needed to define the best VMT treatment, indicating the optimal parameters of frequency, duration and amplitude.
Conclusions
From this study, we can conclude the following:
Vibration massage therapy improves both MVC grip strength and grip endurance time (better at 35 Hz compared to 23 Hz). Days of vibration exposure (7 days) had a significant effect on MVC grip strength and grip endurance time, while VT frequency had a significant effect on grip endurance time only. The palm length, palm circumference and forearm circumference had a significant effect on MVC grip strength and grip endurance time, thus indicating a better predictor. The EMG activity was more in the extensor muscle, i.e., in ECU (maximum at 23 Hz), than the flexor muscle, i.e., FCU (maximum at 35 Hz). The fatigue response was more frequent at low frequency (23 Hz) for all muscles. However, when vibration therapy was administered at a higher frequency (35 Hz), the fatigue response decreased, but this response occurs more predominantly after the fourth day of vibration exposure. The median frequency and slope based on the regression line on the median frequency could be used to assess muscle fatigue.
A sample guidelines for the therapist
Vibration therapy has been recognized as a potential modality in the areas of sport, exercise and health. Therefore, after administering a VT, the strength-producing capacity, power and flexibility of athletes, aged and the person suffering from any neurological disorders increased. VT is a safe modality to improve the physiological responses of reflex and muscular activity in athletes, the elderly and people with neurological disorders. However, there is contradictory evidence regarding the optimal dose rel-ationship, such as the VT frequency, amplitude and duration of exposure. In addition, based on the findings, it can be suggested that if vibration massage was administered (at 23 Hz and 35 Hz for 10 minutes) to older athletes and person with neurological disorders, their grip strength and endurance time can change positively (better at 35 Hz). The chosen VT frequency and days of exposure can be used as the optimal range to study the effect of VT on neuromuscular performance. Finally, this study can be used as a sample guidelines for professional sports, rehabilitation, medical use and may be useful to therapists. However, further investigations may reinforce the guidelines for therapists.
Conflict of interest
The authors declare that they have no conflict of interest.
Footnotes
Acknowledgment
Council of Scientific & Industrial Research (CSIR), Human Resource Development Group, New Delhi, India, for awarding Senior Research Fellowship (SRF), (F. No. 141530/2K15/1, File No. 09/112(0553)2K17-EMR-I). The grant provided by CSIR, India was a significant support for this research work, for which authors are grateful.