
Abstract
BACKGROUND:
Aircraft passengers’ physical activity levels are often limited during flight for extended periods of time, which can have serious impact on health, comfort, and passenger experience. However, several factors, such as limited personal space and social factors, can make movement difficult.
OBJECTIVE:
The study aimed to identify participant behaviour and postures during medium to long-haul flights and their effect on location and severity of physical discomfort. This work investigated how aircraft passengers’ comfort ratings changed over time and explored the association between postures and comfort ratings during flight. The study also explored the association between performing in-flight exercises and factors limiting participants’ abilities to complete these exercises.
METHOD:
Twenty-nine participants sat in an aircraft simulated cabin for 180 minutes and periodically performed in-seat exercises. They also completed a questionnaire providing data on demographic information, self-reported discomfort scores for multiple areas of the body, which types of exercises participants performed, and qualitative comments about discomfort. Self-reported comfort ratings were measured at 20 min intervals and posture identification was conducted by analysing the video recordings.
RESULTS:
Six postures were identified, and it was observed that individual participants changed posture at least once and up to nine times during the three-hour period. Body part areas with the highest reported scores of discomfort ratings were: back of the neck, back-left shoulder, back-right shoulder, back-left buttock, and lower back. Participants reported that they had difficulty in performing recommended in-flight exercises due to limited space.
CONCLUSIONS:
Limited space in aircraft seating restricts passenger movement. Some body areas are more prone to discomfort.
Introduction
Due to increasing amounts of air travel, developing new ways to improve passenger comfort in restricted physical spaces is crucial for aircraft manufacturers and airline companies [1]. Furthermore, aircraft passenger comfort is an important factor in passenger acceptance of the transportation system and therefore, their tendency to choose a flight with the airline again [2]. Comfort level has also been closely associated with passenger health during flight, with constrained cabin seating spaces being linked both to discomfort and negative health outcomes [3]. In order to reduce health risks during flight and to improve comfort, passengers are often advised to walk around the cabin [4] and do exercises to increase blood flow [4]. In this Paper, the authors investigated how aircraft passengers’ comfort ratings changed over time and explored the association between postures and comfort ratings during flight. The study also explored the association between performing in-flight exercises and factors limiting participants’ abilities to complete these exercises.
Comfort concepts in the literature
Comfort and discomfort have been investigated in several studies in the context of air travel [5]. Despite the fact that there are numerous definitions for comfort, the passenger decide whether he/she will feel comfortable or not, i.e. every person has a different sense of relative comfort. In order to have an overall view on the subject, a discussion on comfort and discomfort including factors which might affect aircraft passenger comfort will be presented.
There has been debate within the literature as to whether comfort is simply the absence of discomfort or if comfort and discomfort are separate but not distinct and might be experienced simultaneously [6].
Hertzberg [7] first argued that comfort is a neutral state occurring in the absence of discomfort. However, Ahmadpour et al. [8] criticized this view, defining comfort as: A pleasant state of wellbeing, ease, and physical, physiological and psychological harmony between a person and the environment”, and discomfort as: “A state where one experiences hardship of some sort which could be physical, physiological or psychological” [8].
Vink [1] defined the concept in relation to three states conditions of comfort: DISCOMFORT in which participants experience discomfort; NO DISCOMFORT in which participants experience no dis-comfort; and COMFORT in which participants experience outstandingly more comfort than expected. There are many factors which might affect passenger comfort and discomfort, including physical, psychological, object aspects which refers to the material to make the aircraft seat, environmental and contextual factors [9]. Passenger interaction with the aircraft environment can be associated with high levels of comfort but it can also generate discomfort which is typically associated with pain [10].
The difference between passenger comfort factors and discomfort factors
De Looze et al. [11] presented a theoretical framework to explain comfort and discomfort and to demonstrate hypothetical associations with underlying factors. The framework was based on a review of twenty-nine different studies which explored measures of an objective parameter (for instance, posture analysis or pressure measurement) and a subjective rating of comfort or discomfort. They mentioned that pressure distribution has the clearest relationship with subjective ratings in car seat design [11]. However, it is yet undetermined if there is any ass-ociation between them in other kinds of seats. For example, an even pressure distribution on the seat pan positively affected the seated participant’s comfort level. For office seats, only the correlation between lumber pressure and local discomfort have been investigated. With their research, it was not clear how other objective variables such as posture, movement, muscle activity and spinal load are associated with comfort or discomfort. Ahmadpour et al. [8] conduc-ted two studies to explore differences in passenger perceptions of factors influencing comfort and discomfort. In the first study, 27 adults in Montreal, Canada were asked to complete an online questionnaire consisting of five demographic questions, and then provide an open-ended description of one flight experience characterised by a sense of comfort and one flight experience characterised the sense of discomfort. They were also asked to add and rate unlisted factors which influenced their comfort. Participants mentioned many concerns which related to their comfort levels, such as security, tranquillity, relief, bodily support, energy, autonomy and control, privacy, accessibility, adequacy, quality, ambience, stimulation, anticipation, tolerance, connectedness, neatness, style, recognition and evocation, imagination and symbolism. The analysis categorised these concerns into eight factors including peace of mind, physical wellbeing, proxemics, satisfaction, pleasure, social, aesthetics and association.
In a second study, Ahmadpour et al. [12] validated seven of the eight factors. They combined the comfort and discomfort concept. On the next step, they asked participants to rate the relevancy of the items. Passenger comfort descriptors collected and classified into eight factors using PCA and investigated for their representation of the mentioned comfort factors. From the results seven factors corresponded to the pre-determined factors. Therefore, the remaining factor, proxemics, should be omitted but it was disputed that it was because of the lack of context and the factor should be taken into account regardless in order to address the aspects of privacy and control in comfort experience.
As previously mentioned, many factors can affect comfort and discomfort. Menegon et al. [10] investigated the multidimensional nature of comfort and discomfort and also the interaction existing between them in aircraft seating. More than 1500 passengers responded to their questionnaire at the international airport in Hercilio Luz, Brazil. They conducted three different analyses: 1) factor analysis to evaluate multi-dimensional nature of comfort and discomfort, 2) the estimation scores given by participants according to Item Response Theory (IRT), 3) correlation analysis between the scores of comfort and that of discomfort. Findings indicated that comfort and discomfort were conceptually different and had a strong negative correlation.
Aircraft passengers’ feedback
Vink and Brauer [13] argue that making people feel comfortable is difficult as long as each person has their own perception of comfort and it is likely to change. They stated that passengers either feel comfort or discomfort or none of them. A variety of factors were identified that may affect these feelings such as visual input, smell, temperature, humidity, pressure, posture and movement. In addition, a passenger’s previous flight experience might affect their perceived level of comfort.
Vink and Brauer [1] believed that legroom and interior comfort are strongly correlated together. They presented some characteristics which are important for passenger comfort such as which airline they are flying with, flight duration, comfort score, direct flight or stoppage, knee space, seats, delays, IFE (In Flight Entertainment), lost luggage, the crew attitude and hygiene of the plane.
Comfort and aircraft cabin design
Comfort is considered to be a factor that might lead passengers to accept the transportation system and accordingly alter their eagerness to fly again with the same airline [6, 15].
Vink and Brauer [1] suggested that manufacturers and designers should introduce a product that generates a “Wow” experience. Not only a seat should be comfortable over a long period of time, but also it should look comfortable. First impression is another significant factor which affects comfort. For example, if passengers see colourful seats, they feel that they will experience more comfort. Therefore, a design should elicit a high comfort feeling at first sight. This finding has practical implications for aircraft cabin designers as the consideration of the seat’s aesthetic design may significantly enhance overall comfort when used in combination with physical product designs that promote comfort.
Comfort should be activity or task dependent [10]. They gathered information from end users about the requirements that TV chairs should have. They showed that end users like the chairs which enable them to support the body in a large variety of positions. For instance, individuals have the backrest pos-itioned rearward while reading. Preferred seats were smart seats which could adapt themselves. Rosmalen et al. [16] observed six different postures and found that the most comfortable position while watching TV is with the feet are off the ground.
Comfort plays an important role in passengers’ acceptance of the system and their willingness to use the system again [15]. Vink et al. [15] also found a correlation of 0.72 between comfort score and legroom. 26% of passengers indicated pitch, knee space and legroom as factors affecting comfort. Subsequently, they identified legroom and seats as the most influential factors in comfort and concluded that, in charter flights, 33 inches pitch was seen as most comfortable. Some special seats such as seats in the exit row or seats without any neighbours are reported as positive because they have more legroom. Lewis [6] also identified legroom as the main factor affecting comfort. However, Visser [17] stated that people’s everyday experience is like an umbrella term for all factors and all factors influencing comfort but the passengers are not aware of them.
Lewis [6] investigated the effect of two stimuli on a real flight experience. She identified two sources of discomfort including sounds of a crying baby and limited legroom. Participants were reported the number of ways in which these sources of discomfort would influence their comfort as well as the strategies they used to overcome these this comfort. A crying baby distracted them from their activities to varying degrees. Participants were unable to escape the sound, but they also had sympathy for parents and baby. They used some strategies to experience less discomfort including blocking out the sound, and asking parents or cabin crew to ease the situation and offer assistance. Restricted legroom had a negative influence on participants’ physical discomfort. Participants used several strategies such as adjusting body position or walking around the cabin to overcome discomforts. When both discomfort stimuli i.e. crying baby and restricted legroom were applied, participants distracted themselves by some activities such as reading, listening to music, sleeping, watching videos or make conversations.
Comfort assessment methods
A number of methods have been used to assess aircraft passenger comfort. The most common of which are self-report methods. In these methods, participants were asked to state location and severity of discomfort on body areas at specified time intervals. Lewis [6] investigated how comfortable the passengers were by dividing comfort and discomfort into categories including physical, social and psychological comfort/discomfort. A common method for assessing comfort/discomfort are body maps. Two body mapping techniques, including the Body Part Discomfort Scale (BPD) and Localised Musculoskeletal Discomfort (LMD) [18], were used to evaluate physical discomfort. These methods provide the participants with a human body map which is divided into different body parts and participants are asked to mark their comfort/discomfort. In BPD, participants are also asked to provide an overall comfort/discomfort in a scale from ‘extremely comfor-table’ to ‘extremely uncomfortable’. In LMD, participants used a scale from ‘no discomfort’ to ‘extreme discomfort’ [6]. Use of BPD has also been verified to assess passenger comfort in train context [19].
Other methods focused less on physical discomfort and included psychological and environmental issues that may affect participants’ sense of general comfort and wellbeing. For example, another scale to measure comfort/discomfort is the General Comfort Rating Scale was applied by Shackel, [20]. His rating scale has eleven comfort ratings, varied from ‘being completely relaxed’ to ‘feeling unbearable pain’.
Menegon et al. [9] developed and validated a scale for aircraft seat comfort using Item Response Theory (IRT). They considered five categories which affected aircraft seat comfort: psychological, physical, object, context and environment and developed a questionnaire based on these categories. 1500 passengers in the lobby of Florianopolis International Airport, Brazil responded to the questionnaire before their flight. These passengers had to have three criteria in order to ensure that they have some flight experience. These criteria were 1) passengers had exp-erience with flying 2) passengers had used the same airline before, and 3) passengers were able to remember their last flight. Their experiment was conducted using Balanced Incomplete Block (BIB) method which is appropriate when using IRT for analysing the data being categorised in blocks [9]. Then they analysed the items of the questionnaire using estimation parameters in Samejima’s Graded Response Model (GRM) of IRT. Full information factor analysis demonstrated that the presence of one assertive factor describing 34% data variance. Their scale covered all levels of comfort data from no comfort to maximum comfort. They showed that passengers’ perceived level of comfort is at the lowest level when they wanted to carry a specific activity and their seat neighbours do not bother them (minimum comfort 50 and maximum 90).
Method
The aim of this study was to identify participant behaviour and postures during a mid-range flight and to identify their association with location and severity of physical discomfort. This paper presents the findings from a study in which participants were asked to perform exercises at regular intervals during a three-hour flight simulation. It investigates how aircraft passengers’ comfort ratings change over time and whether there is any association between maintained postures and comfort ratings during the flight. It also presents the importance of having some in-flight exercises and describes participants’ difficulties while doing these exercises.
Participants
29 participants (18 male, 11 female) were recruited from a university and surrounding community in the East Midlands of the United Kingdom to take part in the study. The aim was to conduct each session with six participants but one session was completed with only five participants.
Participants were required to be at least 18 years old and not possess any musculoskeletal problems. The participants’ mean age was 27.58 years (σ= 8.64). Ethical approval for the study was granted by the University’s Faculty of Engineering Ethics Committee, and participants received a £30 voucher at the end of the study to thank them for their time.
Study environment and materials
The study took place in a controlled laboratory setting in a large, ventilated room. Six aircraft seats were employed for this study, arranged in two rows of three seats each. The seat pitch for this study was set as a typical seat pitch in economy seats of 31 inches [21], where seat pitch is the distance between a point on one seat and the same point on the seat in front.
In the area surrounding the seat setup, two video recording cameras were mounted on tripods in the laboratory to observe the participants. One of them was located on the right and front side of the seats and the other was located on the left side to have a complete view of all participants. The researcher also carried out limited observations during the study from behind. Configuration of the seats and cameras is shown in Fig. 1. Prior to the session, visible numbers were put to the back of each seat. A clipboard, pen, questionnaire, information sheet, consent form and in-flight brochure, labelled with the correct trial session, seat number and participants ID were placed on each seat.

Plan view and side view.
The questionnaire consisted of demographic questions followed by repetitions of requests for comfort and discomfort ratings, as well as several questions regarding the recommended in-flight exercises. Ratings were collected at 20-minute intervals during the study, during which participants were asked to indicate their level of agreement to the phrase: I feel comfortable. Participants were asked to rate this on a 1–9 scale where 1 was extremely comfortable and 9 was not at all comfortable. Participants were also asked to indicate their discomfort level in different body parts every twenty minutes. During the study, each participant gave a rating of 0 to 9 in which 1 referred to slight discomfort, 9 referred to extreme discomfort, and 0 indicated that the participant did not report discomfort in that body part. Following analysis, the data were visualized across all participants and body parts using a heat map visualization method [19].
The study took place over the course of three hours, during the majority of which participants remained seated. They were asked to complete the questionnaire at the beginning of the study and every 20 minutes during the three-hour period and were asked to read the aircraft health guide which consisted of seven different in-flight exercises (Fig. 2) and to try to do the exercises at least every forty minutes.

In-flight exercises.
Before the start or at the end of the study, the fol-lowing anthropometric measurements were taken for each participant: height, lower leg length, upper leg length, shoulder breadth, hip breadth and sitting eye/head height. Height measurements were taken with them wearing their shoes using a stadiometer. All other measurements were taken in a seated position, with them wearing the clothes they arrive in (coat re-moved) using an anthropometer, board and tape mea-sure. The data collected during the study were the relevant anthropometric dimensions of participants, user choice of seating position, periodic ratings of comfort and discomfort overall and per body part, frequency of performing the in-flight exercises, and qualitative feedback on aspects of discomfort. Anthropometric data were analysed to identify the sample’s fit within the broader population, whereas exercise frequency and postures were analysed descriptively. Lastly, the relationship between posture, time, and participant comfort levels was assessed with a linear mixed eff-ects modelling procedure.
At the beginning of the study, participants were given an information sheet and study goals were explained. Participants were then asked to sign a consent form. Participants were instructed to select a seat based on personal preference and that they were not permitted to change their selection at any point in the study. Participants were instructed that they could do whatever activities they preferred during the study, and in practice, this included activities such as reading books, talking to friends, sleeping, daydreaming, and using laptops, phones, or tablets for work or leisure. They were also provided with guidance on seated exercises recommended for in-flight use (see Fig. 2) and were instructed to select and perform these exercises during the course of the study as frequently as they needed to enhance their comfort. Anthropometric measurements were taken from most participants prior to beginning the three-hour seated trial and during the first few blocks for the remainder.
At twenty minute intervals, an alarm rang to ind-icate that the participants should complete the questionnaire, and those who were asleep or were wearing headphones were prompted by the researcher to complete the questionnaire. Although participants were not allowed to switch seats with other participants, they were permitted to leave their seats for refreshments or visiting the restroom. If they were away from their seat when the alarms rang, they would be asked to complete the relevant section of the questionnaire as soon as they returned to their seats. This process was repeated eight times, and at three hours into the trial, the participants were asked to stay in their seats and complete the final section of the questionnaire. After that, the questionnaires were collected and participants were free to leave.
During the study, researchers observed participa-nts’ seated postures and recorded their general activities (e.g. reading, listening to music, sleeping). If they left their seats, a researcher made a note of the time they got up, the time that they returned to their seat, and what they did while they were away from their seat. The recording cameras ran for the entire duration and were used to support posture and activity analysis following completion of the study. Videos were used to analyse data such as the postures participants adopted during different activities or at different times.
Analysis and results
Anthropometric measurement
In order to evaluate the sample’s representativeness, relevant body dimensions in standing and sea-ted positions were collected from each participant. Seated measures were taken with the participants sitting on a chair. The participants were measured wit-hout their outerwear such as coats and jackets. The measures included standing height, sitting height, shoulder breadth, hip breadth, upper leg length, lower leg length. Table 1 shows what percentiles the participants represented in alignment with the broader population. As shown in Table 1, the sample was representative of the broader population [22].
Anthropometric data representing 5th and 95th percentile values obtained from the participant sample, compared with respective population values in centimetres (20)
Anthropometric data representing 5th and 95th percentile values obtained from the participant sample, compared with respective population values in centimetres (20)
Video analysis was conducted with NVivo to ide-ntify participant postures, in-flight exercise perfor-mance, activities, and behavioural indicators of discomfort. Posture coding was conducted based on Groenesteijn et al., method [23]. In this method, they put the code for head and trunk [16].
Initially, 15 postures were identified. Following that, these postures were categorised into six major posture groups based on head and trunk position, shown in Table 3. Postures were categorized based on similar head and trunk position. As these areas were associated with the discomfort body parts. The count of all postures at each time period sampling time can be seen in Fig. 7.
Categorised postures
Categorised postures
Participants’ difficulties while doing exercises
In the questionnaire, participants were asked to report what kind of exercises and how frequent they did them. The number of times each exercise was performed during the study by all the participants is shown in Fig. 3. Analysis revealed that the most frequent in-flight exercises were foot pumps and neck roll manoeuvres.
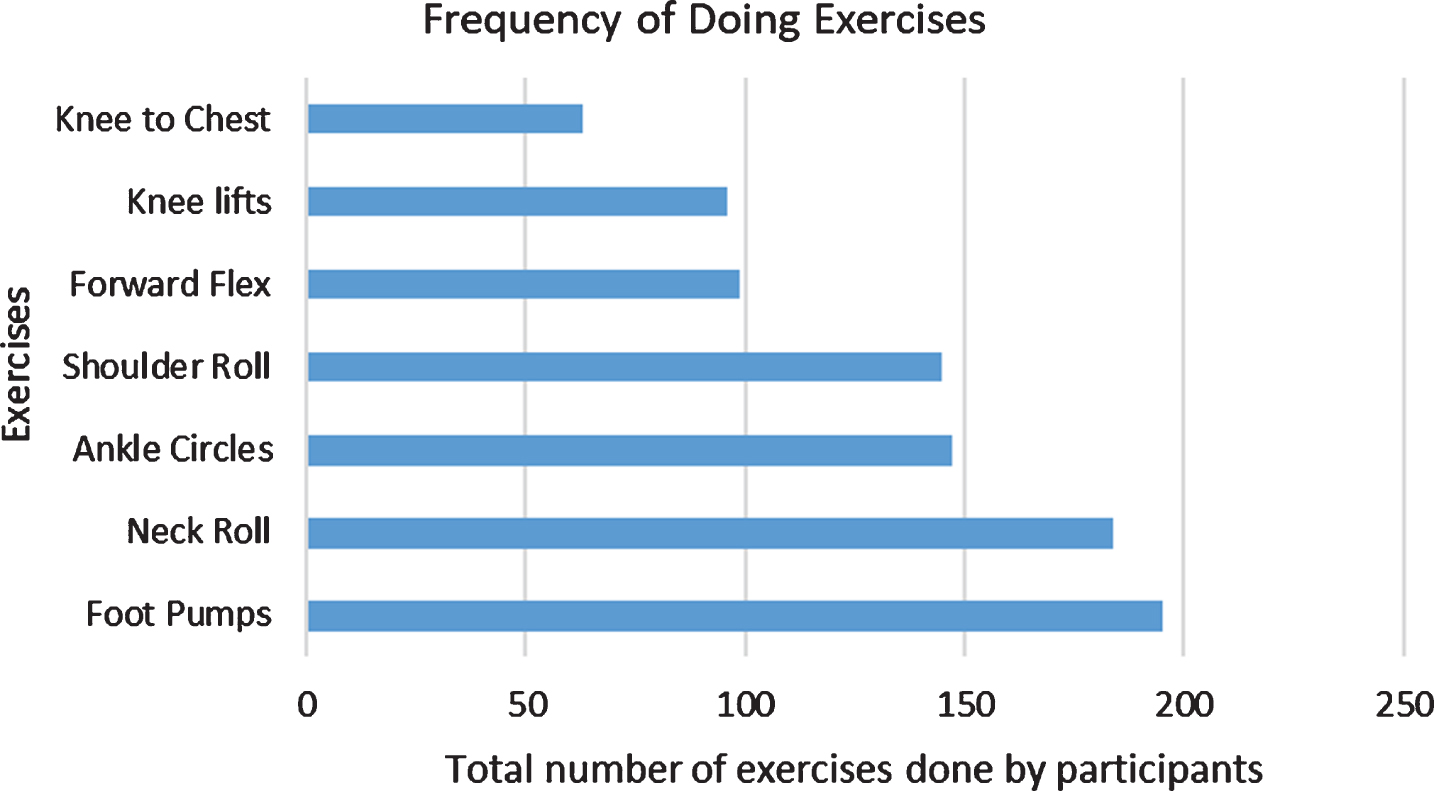
Most frequent exercises.
In open-ended responses, participants indicated that lack of physical space prevented them from doing several of the exercises. As Fig. 3 demonstrates, participants more frequently did the exercises which required less physical space. Comparison with the anthropometric measurements indicated that especially tall participants and those who were sitting in the middle seat may have also performed these space-constrained exercises more frequently, although further analysis would be needed for a more objective analysis.
In order to understand what participants did to dis-tract themselves from the physical discomfort, video recordings were analysed to find out more about the participants’ behaviour during the study. To illustrate the findings, behaviours of three participants are described as case studies; these participants include the tallest participant (P21), the participant who changed posture most frequently (P3), and a participant sitting in the middle seat of the back row (P5). These case studies comfort diagrams are shown in Fig. 4.
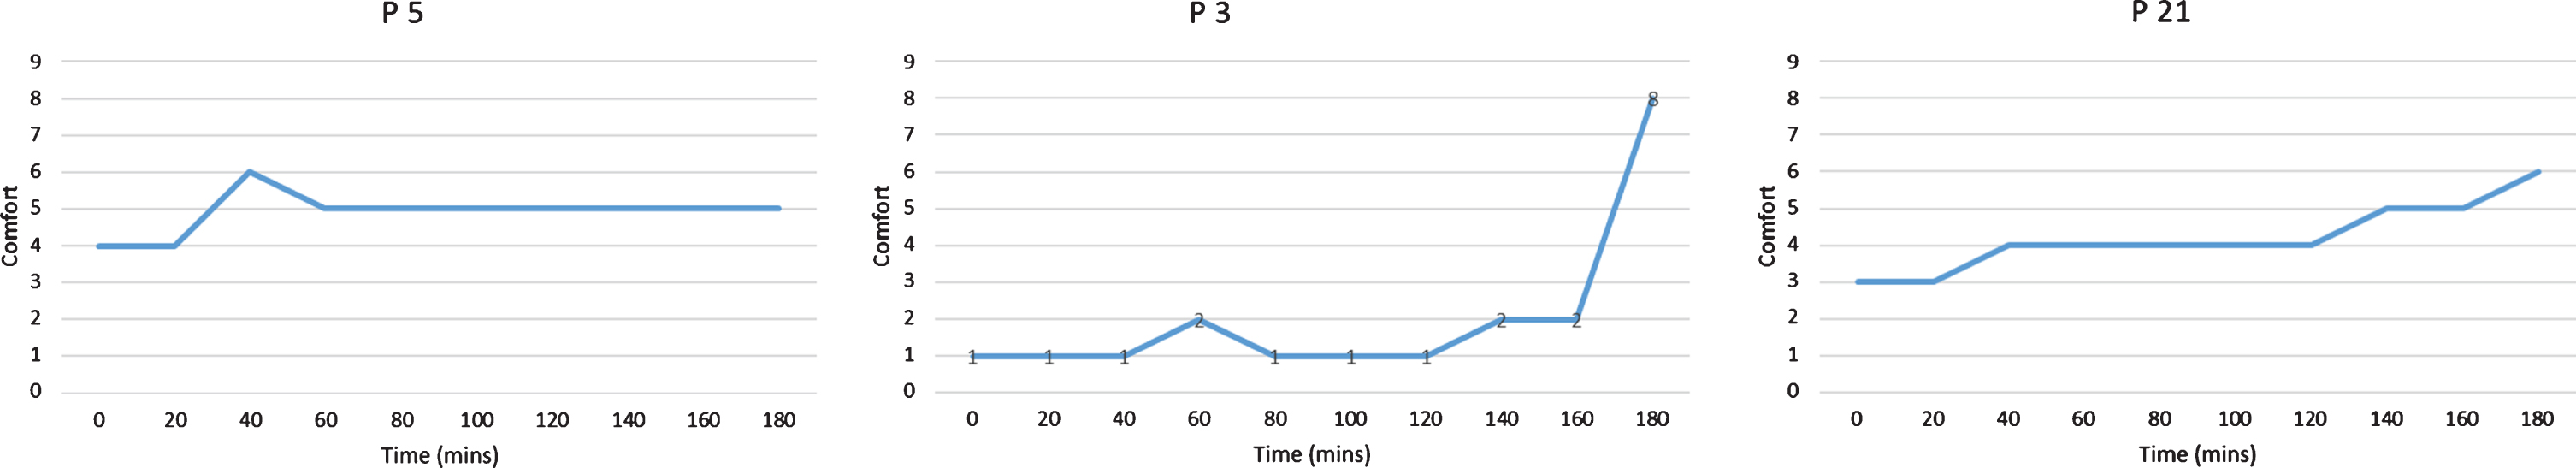
Case studies comfort diagram.
P3’s comfort levels over time, remained the same for the first 20 minutes. Between minutes 40 and 60, the participant performed many neck rolls, and between minutes 60 and 140, comfort level increased slightly. In the last period of the study, this participant performed forward flex exercises, shoulder rolls, and neck rolls; we hypothesize that this increase in activity may be related to the participant’s sharp rise in comfort level. This participant had completed several knee to chest exercises in minute 138 which also may have helped her to maintain her comfort level.
In the analysis of P5’s experiences in the study, it was apparent that this participant experienced a greater degree of discomfort than P3.As can be seen in the comfort rating timeline for P5 in Fig. 4, In the very beginning of the study, P5 reported some discomfort in his neck via the questionnaire. In terms of activity, P5 worked on his cell phone, and following this, he performed a series of neck rolls and shoulder rolls. Comfort ratings indicated that while his comfort level remained the same in the 0–20 minute interval, in the second interval (minutes 20–40), he started using his cell phone again, and this corresponded to a report of discomfort in the neck. Following this, P5 performed more neck rolls which corresponded to an increase in self-reported comfort level. In the third interval (minutes 40–60), P5 visibly demonstrated behaviours associated with tiredness and tried to stretch his body, however, his overall comfort level decreased and after minute 60 his overall level of comfort remained the same for the remainder of the study based on his self-reported ratings.
In the final illustration, the tallest participant (P21) was an interesting case to consider due to the reported variations in discomfort by body area compared to P3 and P5. The comfort rating timeline for P21 is shown in Fig. 4. From the very beginning of the study, P21 self-reported discomfort in his legs via the questionnaire, and behavioural evidence from the video seems to support this. Within the first 20 minutes, P21 frequently moved his legs and at minute 14, he performed a series of neck rolls, indicating discomfort in the neck. His overall comfort rating remained the same in the first 20 minute interval, but increased between minutes 20–40, potentially due to the shoulder rolls and neck rolls he performed during that time period. After this time period, P21’s self-reported comfort ratings fluctuated until minute 160, and during this time, he performed exercises including neck rolls and shoulder rolls approximately 10 times as well as a set of forward flexes. After this period of increased mobility, as well as after performing a set of knee to chest exercises in the final interval of the study his self-reported comfort ratings rose to their maximum in the final interval (minutes 160–180).
The number of times discomfort was reported by participants for different body parts is shown in Fig. 5. Participants experienced discomfort in the back of their necks most frequently (n = 172), followed by discomfort in the left and right shoulders (n = 119 and n = 105, respectively). The left and right buttock Participants also reported discomfort in the left and right buttock (n = 99) lower back (n = 91), and back right and left thighs (n = 57). Body part discomfort (BPD) of train passengers were analysed through the application of a novel data visualisation technique, heat mapping [19]. All participants’ self-reported discomfort ratings over the three-hour period are shown in Fig. 6, calculated by the mean rating per participant and body parts. Participants have reported their discomfort every twenty minutes over the period of the study which was three hours. In total, for each body parts they reported their discomfort 10 times. For creating the heat map, participants’ discomfort rating mean for each body area was calculated. After developing the heat map, we considered maximum discomfort for further analyses.
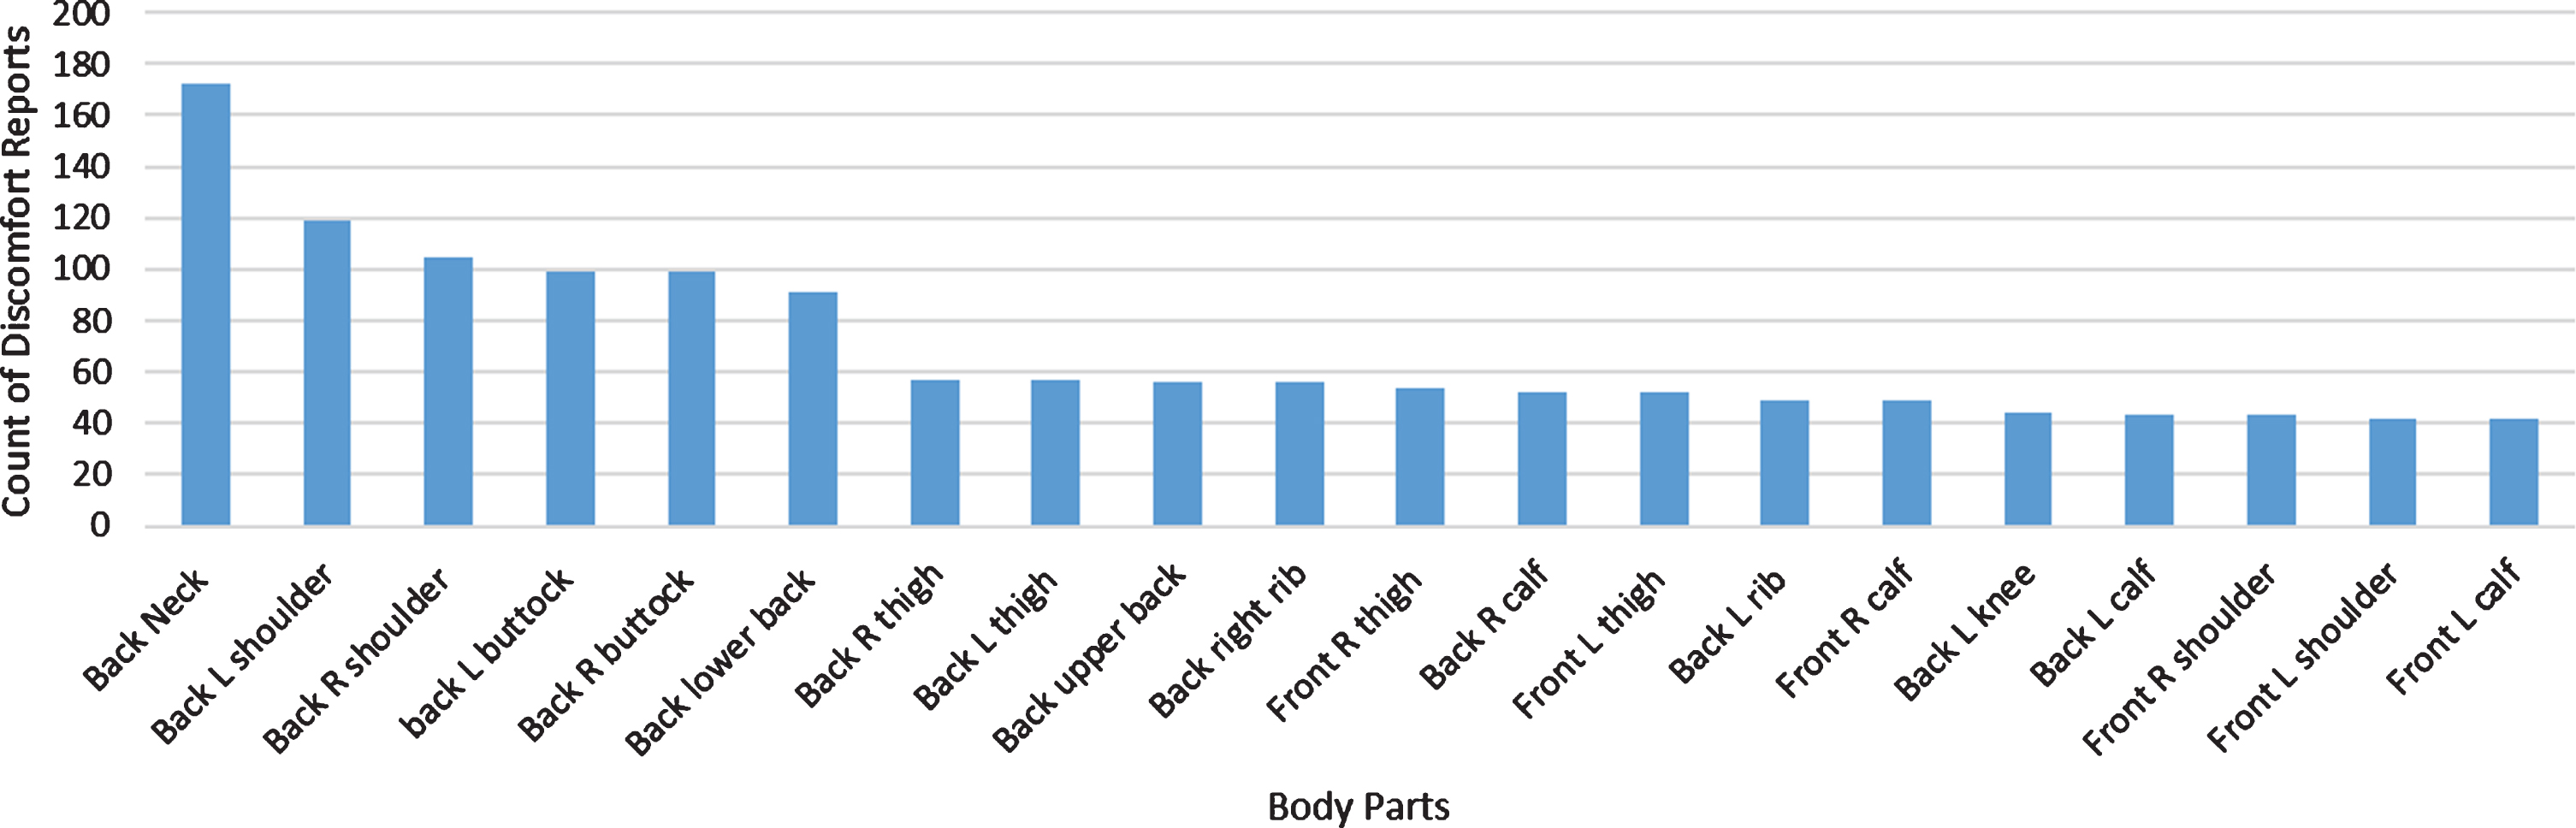
Body areas with most frequent discomfort.

Overall heat map visualization with body parts along the y-axis and participant ID along the x-axis.
In this heat map, the colour key is indicated with yellow corresponding to the lowest rating and red corresponding to the highest rating in the heat map. From the overall heat map, it can be seen that the higher ratings were more frequently associated with the back side of the body, including the back of the neck, the back-left shoulder, the back-right shoulder, the back-left buttock, the back-right buttock and the lower back.
The heat map visualization indicates that although there were individual differences in participant experiences during the study, several body parts were commonly associated with discomfort. After visual assessment, the six body parts that were associated with discomfort were identified. These BPDs consist of the back of the neck, the back-left shoulder, the back-right shoulder, the back-left buttock, the back-right buttock and the lower back.
A linear mixed effects model was used to explore the relationship between posture (6 levels), time (8 points at 20-minute intervals during the study), and participant comfort rating indicated in the que-stionnaires. The model identified a significant effect of time, suggesting that participant comfort decreased over the course of the study, (β= 0.168, 95% CI =0.0352–0.301, p = 0.013). There was also a significant effect of posture, indicating that participant comfort significant decreased for participants in Posture D compared to Posture A, (β= 1.23, 95% CI =0.337–2.116, p = 0.0071), in Posture E compared to A, (β= 1.55, 95% CI = 0.116–2.99, p = 0.034), and in Posture F compared to A, (β= 1.70, 95% CI =0.420–2.98, p = 0.0095). Compared to Posture A, though, Posture B was not associated with a signi-ficant difference in comfort, (β= 2.24, 95% CI =–1.37–5.84, p = 0.22), nor was Posture C (β= 0.879, 95% CI = –1.36–3.12, p = 0.44). Interestingly, there was a significant interaction between time and Posture F, indicating that perceptions of comfort slightly but significantly increased with time in this posture, (β= –0.237, 95% CI = –0.469— 0.00521, p = .045). However, none of the other time-posture interactions were significant predictors of comfort rating. Participant comfort ratings are visualized by posture in Fig. 8 and time in Fig. 9. Comparison to anthropometric measurements indicated that especially tall participants and those who were sitting in the middle seat may have also performed these space-constrained exercises more frequently.
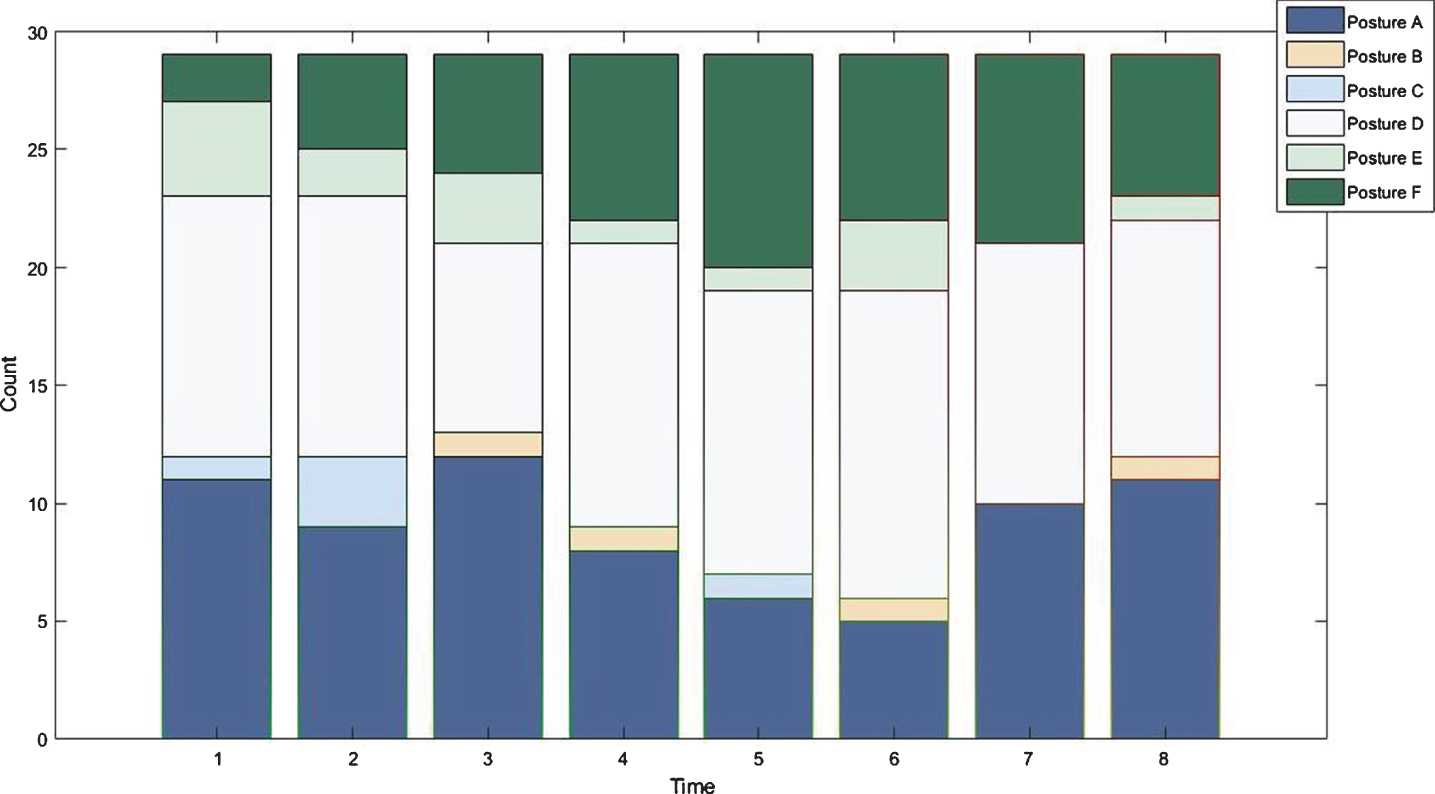
Count of all postures at each time period sampling point.
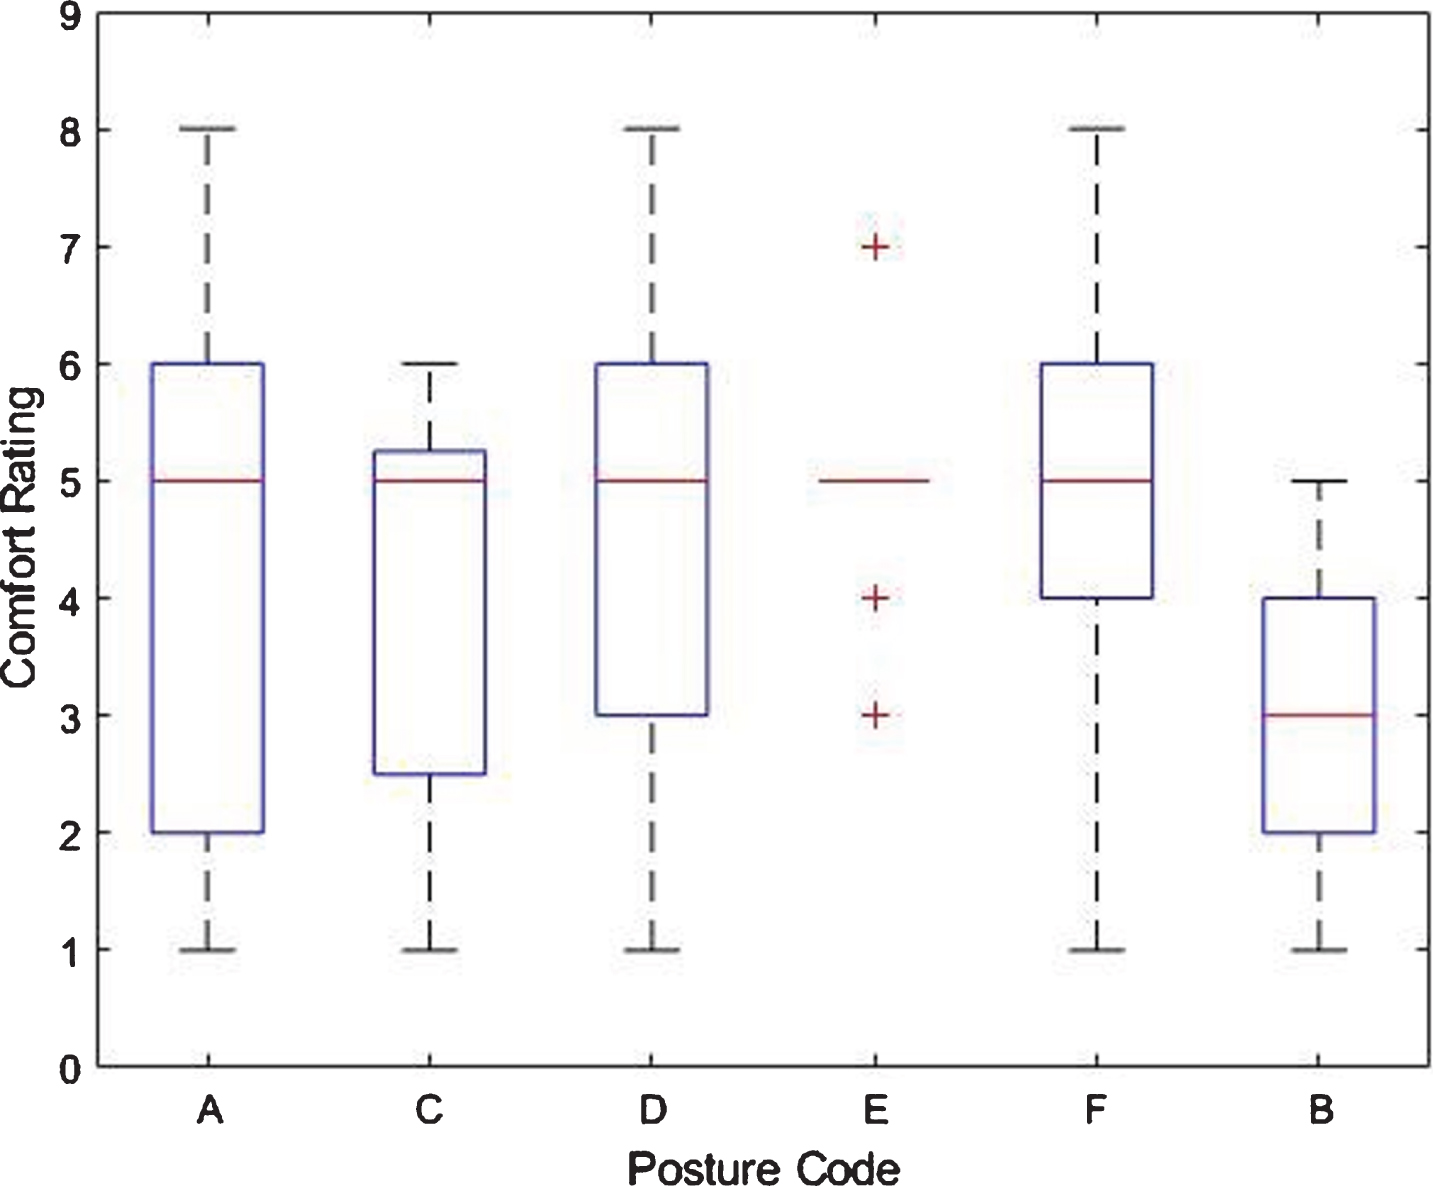
Boxplot of participant comfort ratings by the corresponding posture code, where the red line indicates the mean value (1 = extremely comfortable, 8 = not at all comfortable).
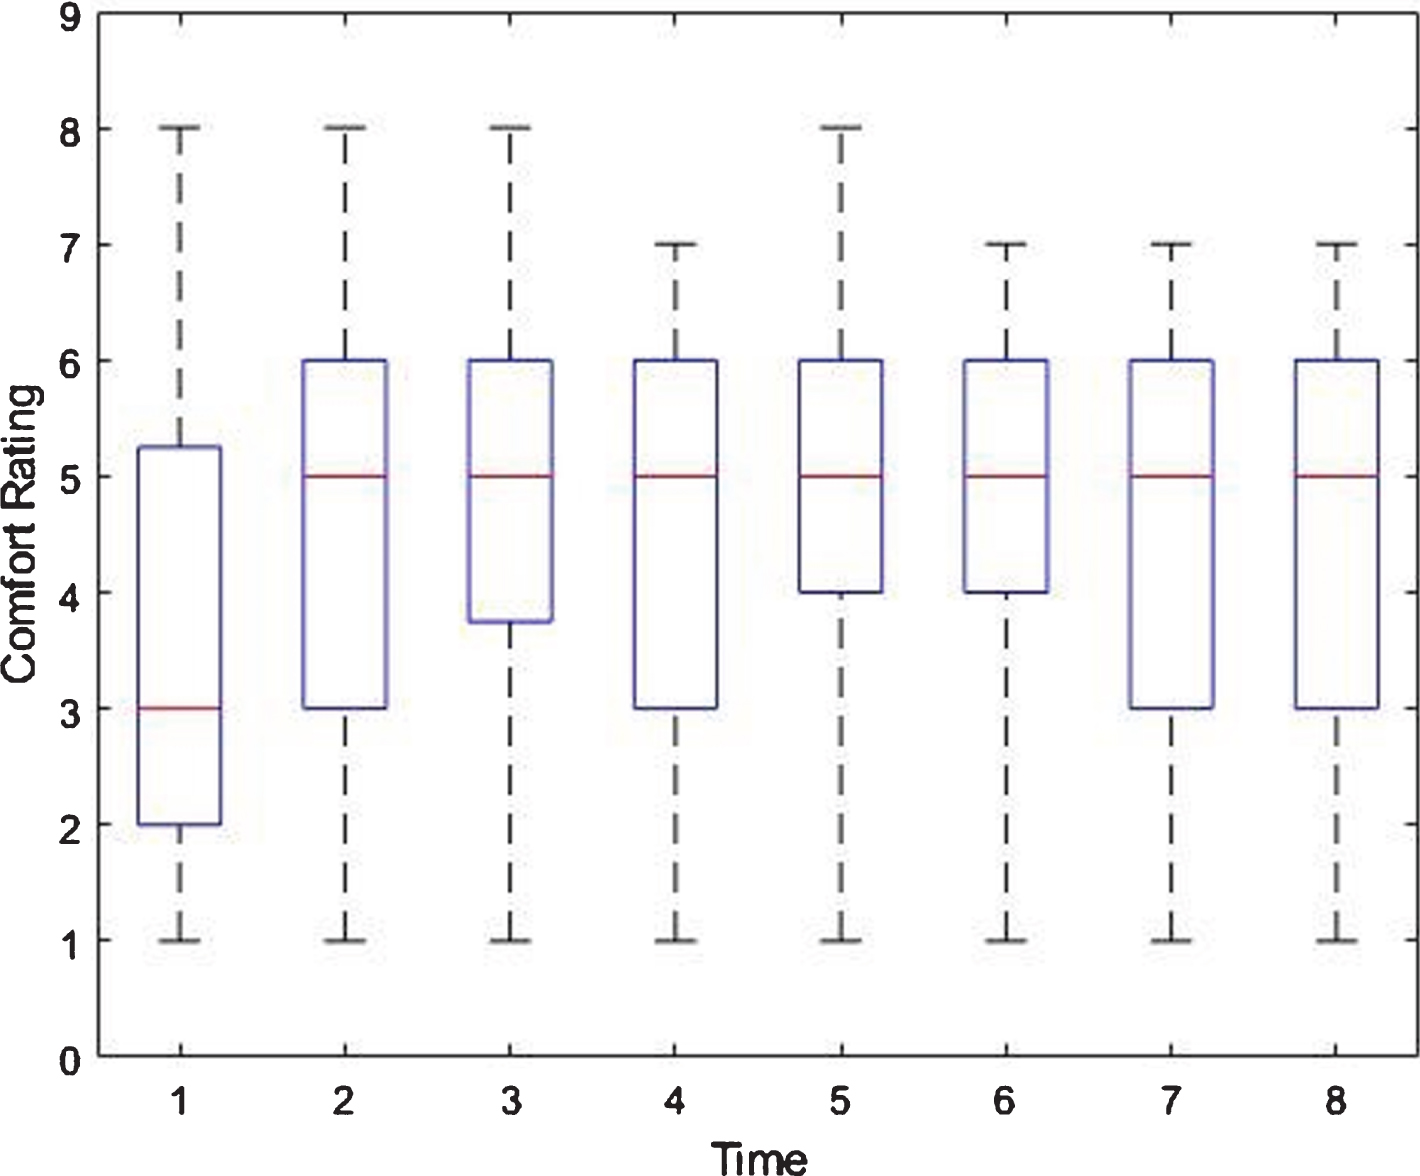
Boxplot of participant comfort ratings by time point (consecutive 20 minute intervals), where the red line indicates the mean value (1 = extremely comfortable, 8 = not at all comfortable).
The findings supported the initial hypothesis that posture would be associated with changes in participant comfort level over time, but it is important to note that conclusions may be limited due to the relatively small sample size and the variation within the frequency of certain postures (e.g. Postures B and C) being assumed by participants, as shown in Fig. 7. Closer inspection of the comfort ratings reveal the high degree of inter-participant variability, for example, in the widespread of participant ratings at each time point in Fig. 9 and in the relatively wide confidence intervals in the linear mixed effects model.
Comments made in the open-ended feedback section of the questionnaire were analysed by thematic analysis in order to understand participant experiences of discomfort during the study and challenges faced with completing the exercises. Analysis resulted in a count of the numbers of comments about these challenges, shown in Table 4. As Table 4 indicates, the majority of comments related to limited space. Participants reported that the confined space limited their ability to do the exercises effectively. Many participants mentioned their personal space was extremely limited for doing these exercises, and it was even more difficult to do when the participant was using the seat-back tray or if the person in front of them was leaning back.
Others reported pain and stiffness during the study. In their comments, participants mentioned neck pain, shoulder pain, ankle and joint stiffness and muscle fatigue. Some comments described that some of the exercises were difficult to do, such as knee to chest, forward flex and knee lifts. There were a couple of comments reporting embarrassments while doing these exercises. In addition, some participants got bored and tired of doing these exercises.
As can be understood from the comments, the main problem for doing these exercises was the limited physical space. In future work, we will explore the effect of perceived increased space on reported comfort levels.
Discussion
In this study, we aimed to explore the association among passengers’ comfort levels, posture, and performance on seated exercises during a simulated medium haul flight. Furthermore, specific areas of the body associated with discomfort during this study were identified. Participants most frequently performed exercises which were easy to achieve in the confined space, and subjective feedback indicated that reasons for not engaging in movement included limited space and embarrassment, a finding that is in line with previous research [24]. Among the recommended in-flight exercises, foot pumps, neck rolls, ankle circles and shoulder rolls were the most frequently chosen, likely because they did not need much space. As the exercises that participants chose to perform reflected the range of motion available to them in the cabin seat environment, these findings can be used to indicate the spatial envelope available for comfort- and health-promoting activities during flight. This is envisioned to be of particular use in the design of interventions, such as virtual reality applications, where exploiting the alignment between the physical and virtual world can be used to influence sensory perception [25].
The exploratory nature of this work provided in-sight into the physical experience of discomfort during medium haul flights while identifying the range of movements frequently selected by passengers. The body mapping analysis indicated that, although experience varied widely across individuals, discomfort reports were frequently associated with the back of the neck, the left and right shoulders, the lower back, and the left and right buttock. As such, this suggests an opportunity for interventions to support passengers in improving their comfort in these specific areas. Building upon this work, future research will explore participants’ behavioural patterns and postures associated with discomfort during the study.
Comparison to anthropometric measurements in-dicated that especially tall participants and those who were sitting in the middle seat may have also performed these space-constrained exercises more frequently. Furthermore, based on participants’ self-reported discomfort ratings over the three-hour per-iod and the heat map analysis, it is concluded that the main BPDs are located on the back side of the body such as the back of the neck, the back-left shoulder, the back-right shoulder, the back-left buttock, the back-right buttock and the lower back. The main postures which represented participants maintained during the three-hour study were the postures with neck down and trunk backward positions. Thus, it causes pain and discomfort in the associated parts.
Finally, this work had several limitations, primar-ily related to sample size and limited ability to make inferences between seated exercise performance and participant comfort level. In terms of sample size, it appeared that data saturation was met with 29 participants with regard to identifying common postures throughout the three-hour study. Nevertheless, the sample size may limit the ability to draw strong con-clusions from the statistical analyses, and in future research, a larger sample would be needed to explore the relationships among posture, time, and comfort in greater depth. Secondly, the ability to draw conclusions on the relationship between performance of in-flight exercises and comfort are limited by the study design. The exploratory nature of the study allowed the work to identify the types of exerci-ses that participants would perform in constrained environments; however, this type of design resulted in a trade-off between understanding naturalistic behaviour and maintaining a level of control needed to quantitatively evaluate the effects of specific exercises on comfort. While outside the scope of the current work, a more tightly controlled study of in-flight exercise and passenger comfort would provide valuable insight into cabin design to support passenger comfort and would enhance understanding of the phenomena reported in the current work.
Conclusion
The aim of the current work was to identify the association between posture, performance of in-flight exercises and aircraft passengers’ comfort over time, with an additional objective of identifying challenges that limit passengers’ abilities to perform such exercises.
Analysis revealed that the most frequent in-flight exercises were foot pumps, neck rolls, ankle circles and shoulder roll manoeuvres. Participants indicated that lack of physical space prevented them from doing several of the exercises, and they tended to perform exercises which required less physical space than other exercises. Analysis in relation to anthropometric measurements indicated that especially tall participants and those who were sitting in the mid-dle seat may have also performed these space-con-strained exercises more frequently. Furthermore, based on participants’ self-reported discomfort ratings over the three-hour period and the heat map analysis, it was concluded that the main BPDs were located on the back side of the body such as the back of the neck, the back-left shoulder, the back-right shoulder, the back-left buttock, the back-right buttock and the lower back. The main postures which participants maintained during the three-hour study were those involving neck-down and trunk-backward positions. Statistical analysis indicated that posture and time were both significant factors in influencing participant comfort rating, a finding which lends support to the observation that certain body parts were more frequently associated with higher levels of discomfort in flight.
This study provides several insights for future research on cabin design to support passenger comfort in flight. Here, postures were analysed and exp-lored in relation to participants’ experiences of comfort and discomfort. From this study, the data suggest that doing some small, seated movements and exercises can help passengers to enhance their perceived level of comfort.
Conflict of interest
None to report.
Footnotes
Acknowledgments
This work is funded by the INNOVATIVE Doctoral Programme. The INNOVATIVE programme is partially funded by the Marie Curie Initial Training Networks (ITN) action (Project Number 665468) and partially by the Institute for Aerospace Technology (IAT) at the University of Nottingham.