
Abstract
BACKGROUND:
More and more people choose to travel by high-speed railway. The seats in these vehicles are an important contact point and comfort of the seat cushions needs attention.
OBJECTIVE:
The aim of this study is to choose among three seat cushions, the one that creates most comfort for a high-speed train.
METHODS:
Twelve healthy volunteers were selected to participate in the experiment. Three different surface shape models of high-speed railway seat cushions were used. The Seat Pressure Distribution Index (SPD%) was calculated and analysed. A 7-point Likert scale questionnaire was applied for subjective evaluation.
RESULTS AND CONCLUSION:
The evaluation is based on subjective and objective data. The results showed that the front protruding cushion made the pressure distribution more even, while the flat cushion had the smallest SPD% and the static pressure was most evenly distributed. This knowledge was beneficial for the design of comfortable high-speed railway seat cushions.
Introduction
The high-speed railway market, in terms of volume, is projected to grow at a CAGR (Compound Annual Growth Rate) of 5.54% from 2018 to 2025. The market was valued at 3,261 Units in 2017 and is projected to reach 5,287 Units by 2025 [1]. It means that the trains are becoming a competitive alternative for air travel. The high-speed train is preferable as it has a lower environmental impact than the aircraft [2]. To attract more passengers to the high-speed rail, seat comfort plays an important role and comfortable seat cushions should be preferred [3]. During trip, the seat comfort affects the passenger’s travel experience. It is assumed that a better seat attracts more passengers. In the airline industry it is shown that more comfort is strongly related to choosing for the same airline again [4]. Many studies have investigated how to test and improve seat comfort. The measurement methods described in the literature concern not only questionnaires recording local postural discomfort, but also measurement methods like surface electromyography and pressure distribution. It was pointed that body pressure distribution is useful in explaining the link between experienced comfort and seat characteristics [5]. The Automotive Seating Discomfort Questionnaire (ASDQ) could be helpful as well in improving seat comfort. The ASDQ was developed and showed statistically significant effect of readability, scale reliability, and face validity, using proven methods for questionnaire development. It might provide a comprehensive objective measure of occupant discomfort in train seats based on the automotive seating results [6]. As comfort is subjective, passenger experience is indispensable to the sitting posture comfort test [3]. The research on comfort of high-speed railway seats is limited. It is complex as the studies should be done dynamically as well as statically as trains drive and stand still. Static comfort is mostly related to the seat characteristics, such as dimensions, size ratio, material selection, structure and so on [7]. Dynamic comfort is linked to the sitting impression of the passenger while being exposed to movement and vibration [8]. This is influenced by structure of the train and seat and environment of the high-speed railway. Drummond et al. pointed out that while seated, 18% of the occupant’s body weight is taken up by each ischial tuberosity [9]. A comfortable seat cushion will produce pressure distributions that show peaks in the area of the ischial tuberosities with gradual decreases in pressure toward the front and sides of the cushion, which is described by Kilincsoy [10] as well. This study focuses on the seat cushion and three cushion models are specifically made for this study. The research is done to indicate which seat cushion model is preferred regarding experienced comfort and discomfort. This is done to support high-speed railway seat manufacturers in choosing seats.
Materials and methods
Subjects
Twelve participants were selected from a population of 96 persons to participate in the experiment. The selection criteria were a good spread in anthropometry, equal distribution male/female and no history of musculoskeletal problems. All six females and males participated voluntarily. The anthropometric characteristics of the subjects are summarized, see Table 1. Every participant was informed of the precautions of the test, and a consent with signature was obtained.
Descriptive statistics of selected variables for the participants
Descriptive statistics of selected variables for the participants
A pressure sensor system called Tactilus was used for data collection, as shown in Fig. 1. A simple seat bracket (no armrest, no knee support) was fixed to the floor; a photo/video-graphic device was also prepared.
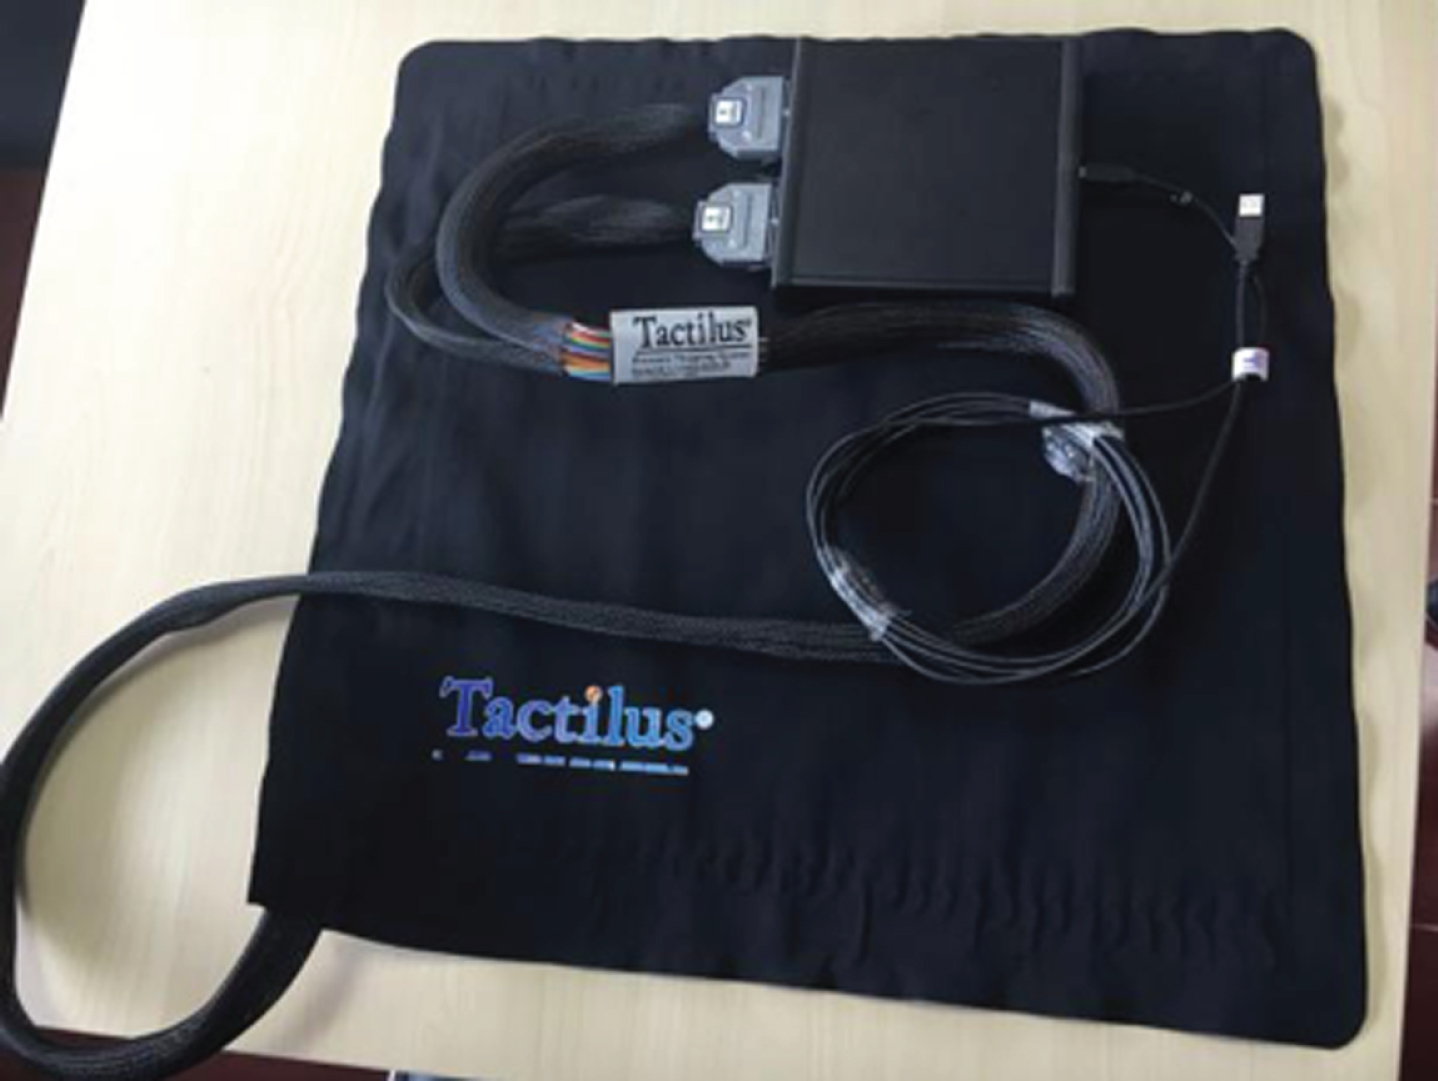
The hardware of Tactilus.
To study the influence of the cushion surface, the parameters of a second-class seat on current Chinese high-speed railway were used to design the backrest. The seat height, seat depth and seat width are 430 mm, 450 mm and 480 mm. The literature [10] shows that the general angle between the seat cushion and the backrest is about 115 degree so 115 degree was applied to design the backrest. Three different surface shape models of high-speed seat cushion were made for the experiments, which were a bilateral protruding cushion (S1), a front protruding cushion (S2) and a flat cushion (S3), as shown in Fig. 2. The thickness of the cushions is 100 mm, which are made of soft poly foam, and the hardness is 45 kPascal. A layer of cotton mesh is covered on the surface of the model to protect the model from deformation. In a real seat also the foam is covered. The bulge height of both ends of S1 cushion is 50 mm, and S2 front edge is 50 mm. The temperature and humidity of the experimental environment were controlled. More specifically, the test temperature is 23°±2, and the relative humidity is 60% ±4. Before the start of the experiment, it was needed to make sure that the seat pressure sensor cushion was wrinkle-free and had been connected to the recording equipment.

Three kinds of experimental cushion models (From left to right, the order is S1, S2, S3).
The recording time of Tactilus was 5 minutes and the sampling frequency was 5 frames per second. There were 1500 frames of pressure distribution experimental data on each cushion. The data were derived in the form of TXT file. Before conducting the experimental analysis, it was pretreated to reduce the human control error in the data collection. In addition, the Tactilus pressure sensor system shows the maximum pressure Pm, average pressure Pv, two-dimensional pressure distribution of contact area A, mass center C.
For the questionnaire part, the buttock and lower limbs are divided into eight regions, as shown in Fig. 3. Participants were asked to rate their perceived (dis)comfort on a 7-point Likert scale for each region and give a score from 1 to 7 for overall (dis)comfort.
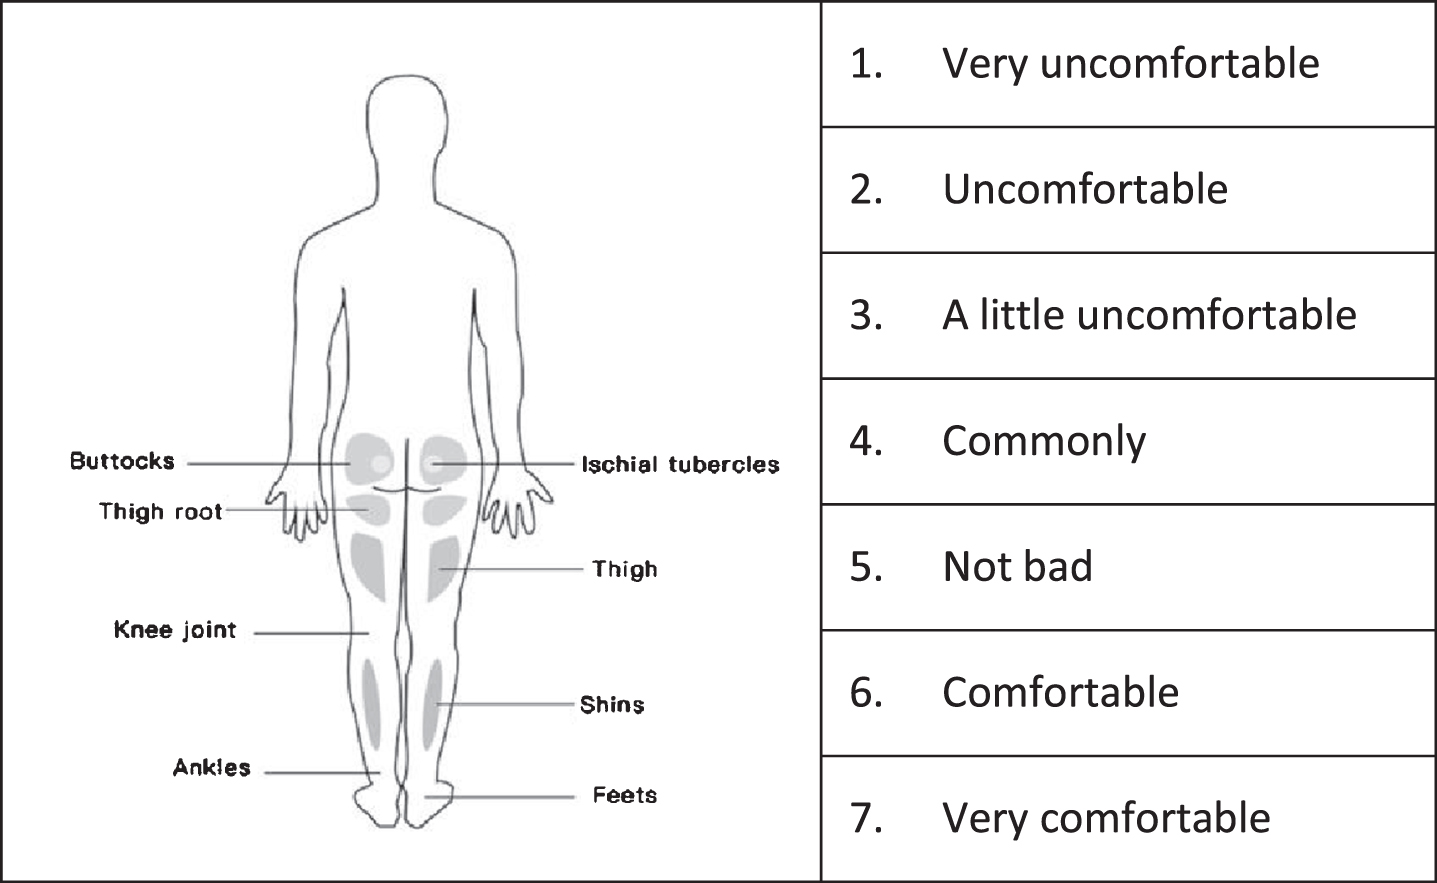
Body regions (dis)comfort questionnaire.
Before the experiment, the location of the regions represented by the body parts in the questionnaire were explained as well as the 7-point Likert scale. After adjusting the experimental seat, the participants would sit on the S1, S2 and S3 cushions for 5 minutes in the upright and natural relaxation postures respectively and they scored the comfort of human body parts of each cushion. After each cushion, they were asked to complete the questionnaires. The meaning of the values 1–7 were explained, as shown in Table 2.
Indexes of Comfort (IC) associated with each item of the questionnaire
Indexes of Comfort (IC) associated with each item of the questionnaire
The two-dimensional pressure distribution map of three cushions and the data of maximum pressure Pm, average pressure Pv, contact area A and mass center C were determined to compare the effects of two sitting postures with the same subject (a 23-year-old woman with a height of 160 cm and a weight of 45 kg). When testing the seat pressure distribution, the participants were reminded to take out the items from their pockets and were not allowed to wear shoes with soles thicker than 3 cm. During sitting, the buttocks of the participants had to contact the cushion completely (only a part of the buttocks contacting the cushion was forbidden). The participants were asked to be in the state of feeling relaxed when testing the pressure distribution, the participants were asked to maintain the sitting posture on the cushion S1. After 30 seconds, the pressure distribution recording started. During the test, participants were not able to see the data recordings. After resting for 10 minutes, another test was carried out with cushion S2 followed by cushion S3. The same procedure was followed for each cushion, including pressure distribution measurement.
The seat pressure distribution index in a static state can fully reflect the pressure distribution. In order to explore the distribution of seat pressure and the relationship, Ahmadian et al. [11] calculated the seat pressure distribution index (SPD%) [10]. The calculation formula is as follows:
In the formula, Pi refers to the pressure value of the unit i, n represents the total value of the pressure point in this area, and n is not equal to zero. The value of SPD% can be applied to dynamic and static train operation, which has a direct impact on the uniformity of the overall pressure distribution of the seat support surface. Generally, the smaller its value is, the more homogeneous the body pressure distribution of the support surface is, which could indicate more comfortable.
SPSS 26.0 was used for statistical analysis. In order to better distinguish the cushion data of two sitting postures, C-S1 is used to represent the situation of cushion S1 in upright sitting posture, and so on (C-S2, C-S3). R-S1 is used to represent the situation of cushion S1 in the relaxed sitting posture, and so on (R-S2, R-S3).
Objective data analysis
After sorting and analyzing the data, the two-dim-ensional pressure distribution diagrams of the subjects in two sitting postures are determined (see Fig. 4 and Fig. 5), the body pressure data of the cushions in two sitting positions were determined (see Table 3). A Kruskal Wallis test was used to analyze the influence of different surface cushions (between R-S1, R-S2, R-S3) regarding the static pressure dis-tribution index in relaxed sitting posture. The results showed that there was a significant difference in static pressure distribution among the three groups (H = 8.429, P = 0.015). Furthermore, after adjusting the significance level by the Bonferroni method a difference in SPD% between R-S1 and R-S3 (P = 0.034 after adjustment) was shown. R-S2 and R-S3 (P =0.037 after adjustment) was statistically significant as well, but there was no significant difference between the other groups. Besides, the relationship between body weight and static pressure distribution was also analyzed. There was no statisitical significant Pearson correlation found(sig = 0.742 > 0.05). The descriptive statistics of SPD% in relaxed posture are shown in Table 4.
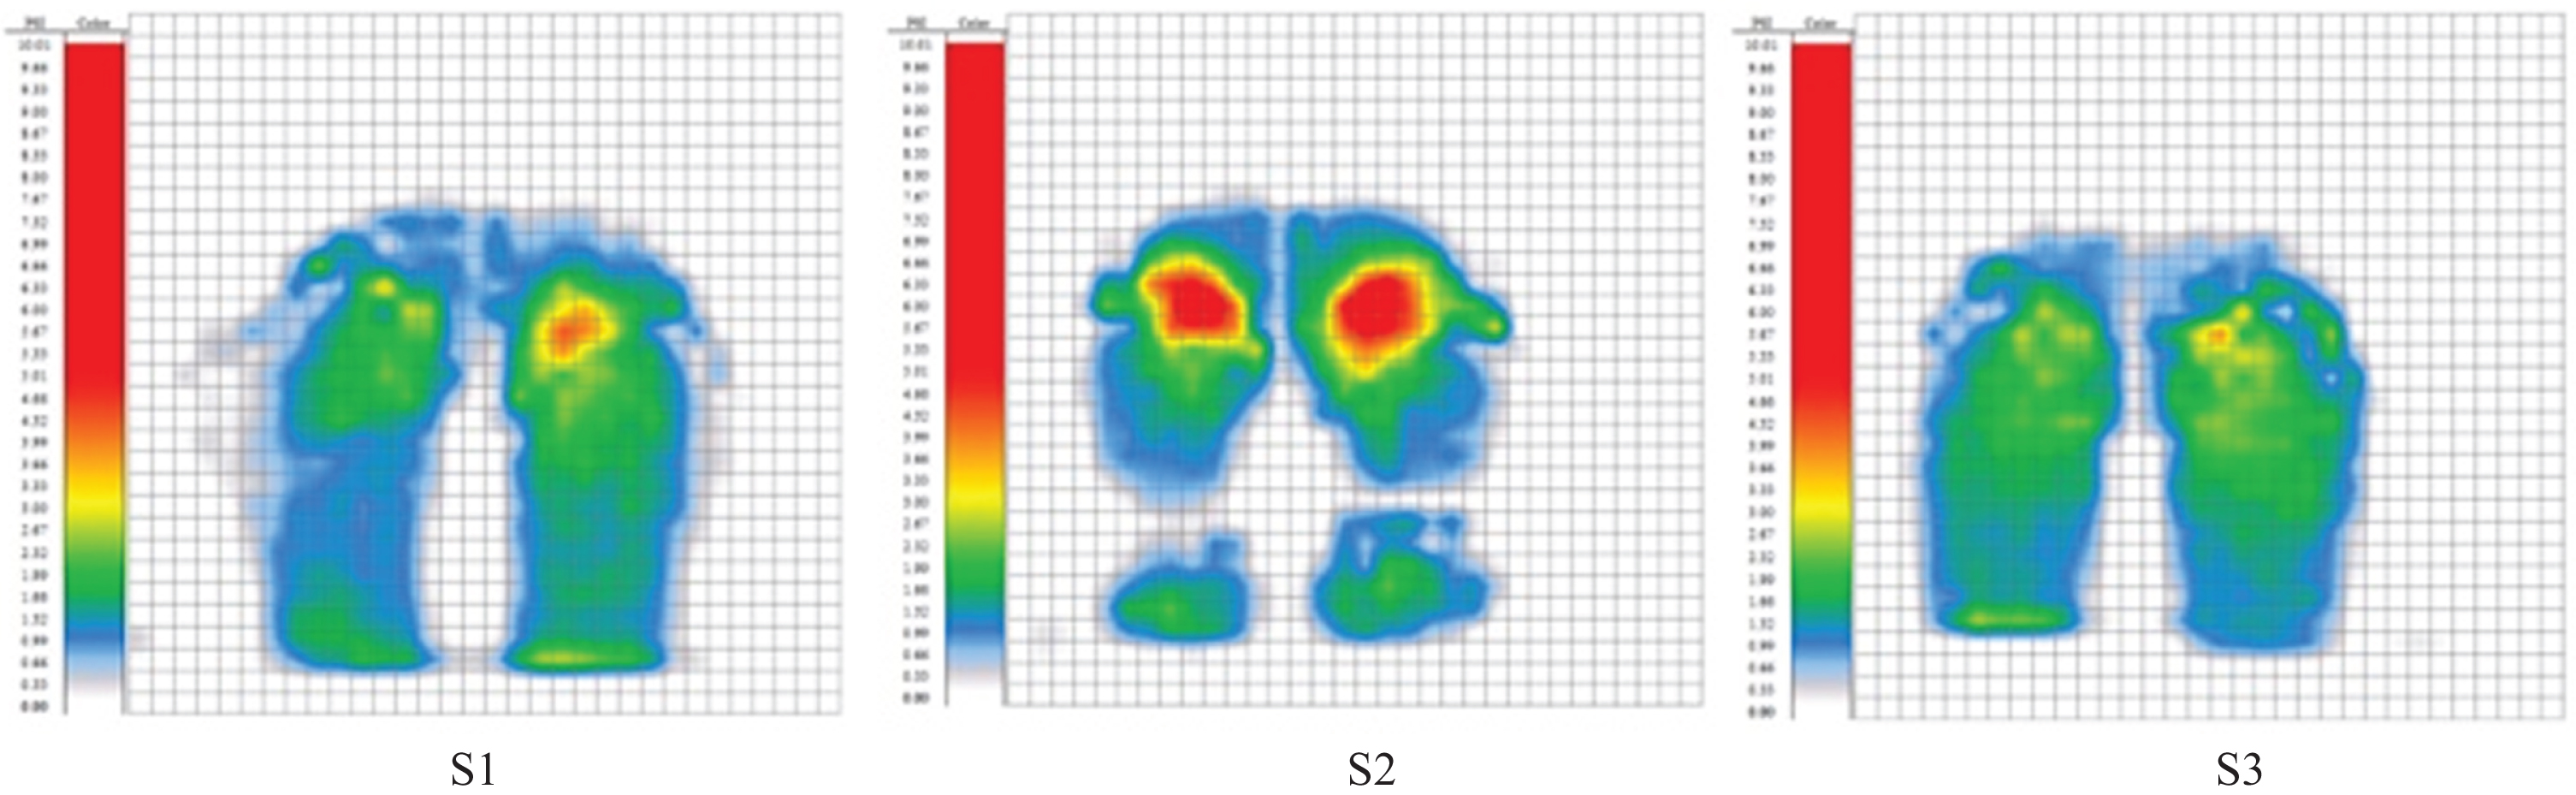
Two-dimensional pressure distribution map in upright posture.
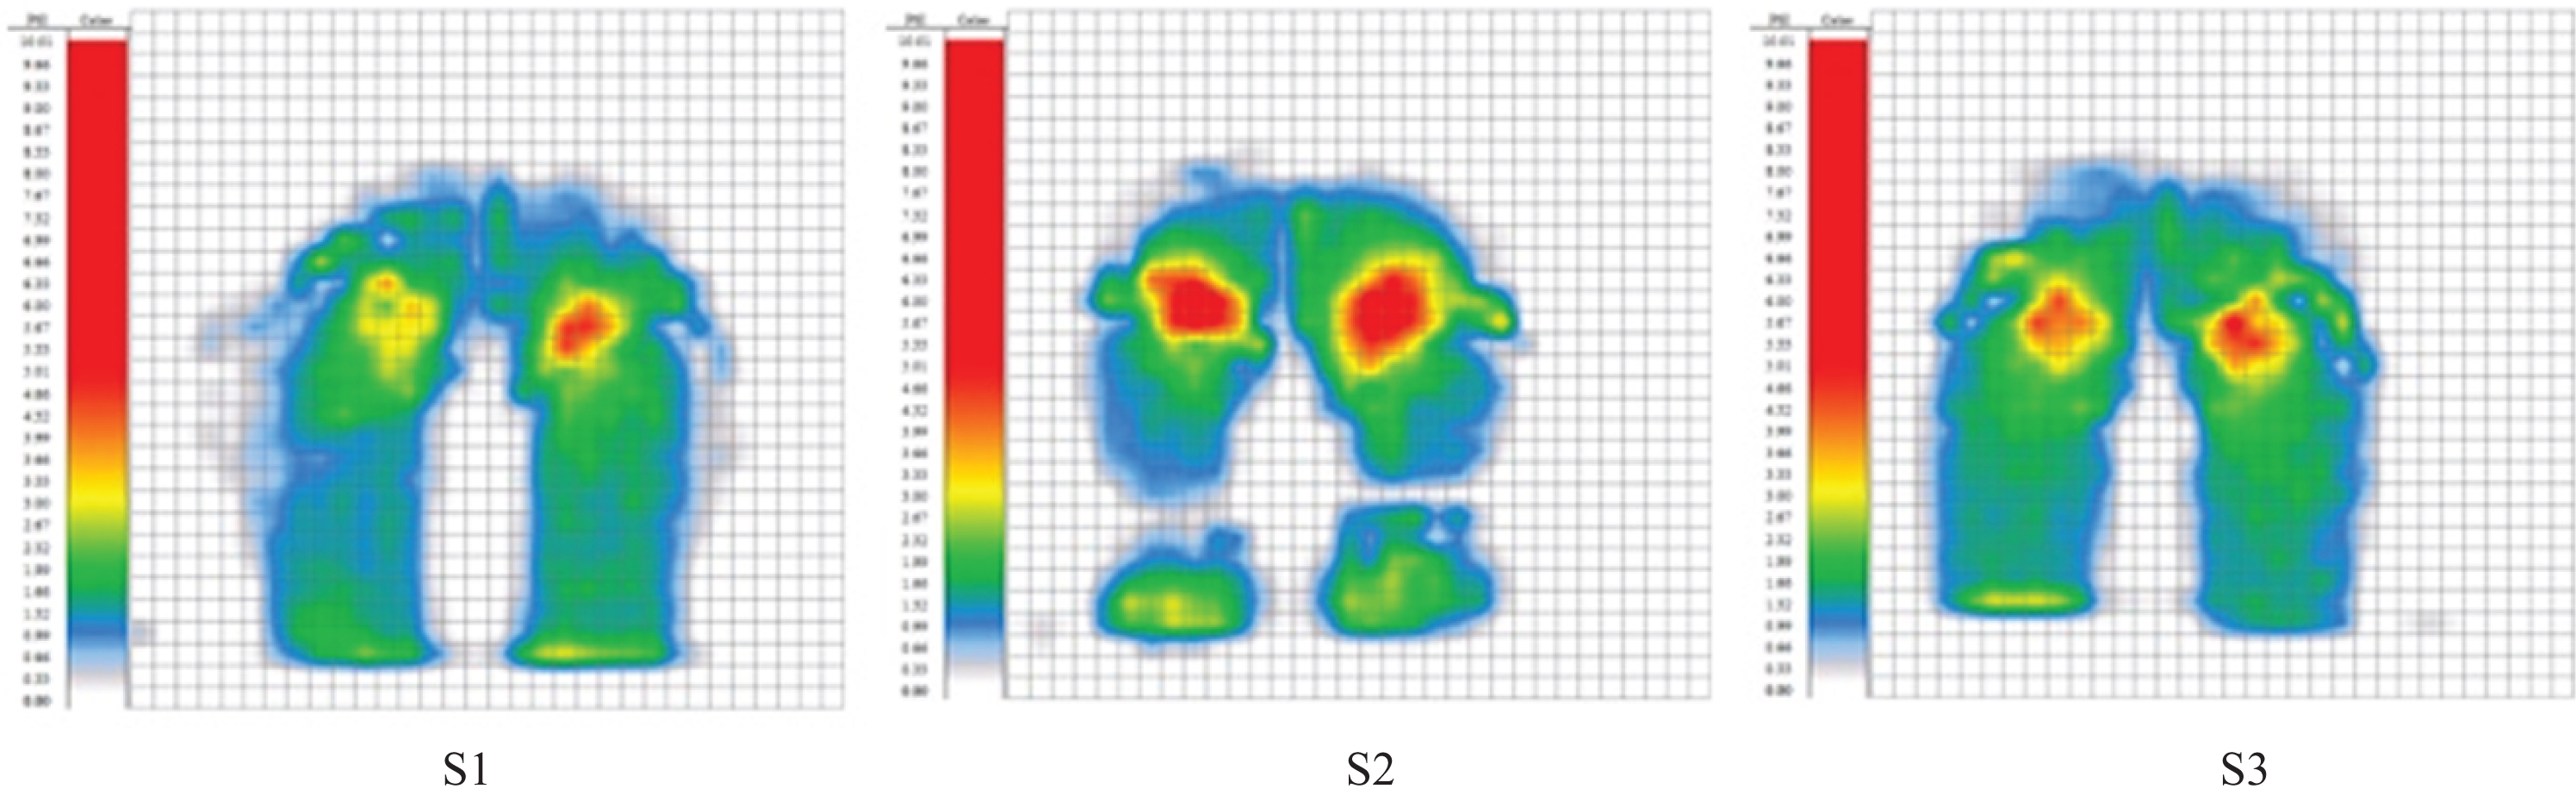
Two-dimensional pressure distribution map in relaxed posture.
Body pressure data of cushion in two sitting postures
Descriptive statistics of SPD% in relaxed posture
The average score of comfort of all parts of the human body was listed, and the standard deviation (SD) was in parentheses, see Table 5 and Table 6.
A list of average comfort scores for different parts of the human body in upright posture
A list of average comfort scores for different parts of the human body in upright posture
A list of average comfort scores for different parts of the human body in relaxed posture
According to the analysis of Table 5, the highest score of overall comfort is S3 cushion, followed by S2 and S1. The comfort of the body’s lower limbs on the S1 cushion is relatively average, and the comfort of the lower limbs is relatively balanced. Compared with the legs, the comfort of the hip area of S2 cushion is higher, which shows that the front bulge of the cushion is conducive to reducing the pressure of the hip area. S3 cushion has the best comfort effect in the hip and thigh area, and the comfort of the lower leg and knee joint is worse than the former two. Compared with S1 cushion, the S3 cushion cannot effectively disperse the pressure of various parts of the human body, nor can it improve the comprehensiveness of comfort.
According to the analysis of Table 6, under the condition of natural relaxed sitting posture, the highest score of overall comfort is S3 cushion, followed by S1 and S2. For S1 cushion, the comfort of large leg area of human body is better than that of buttocks, calves and feet. The overall comfort of S2 cushion is more balanced than the other two, and the comfort score of lower leg area is the highest. S3 cushion has the highest comfort score in the thigh area and the lowest pressure on the thigh, but the comfort of knee joint is worse than the other two.
Comfort analysis of high-speed railway seat surface
Table 5 shows that the highest overall comfort score was found sitting on the S3 flat cushion, followed by S2 and S1 in upright posture. For the S1 lateral convex cushion, the comfort of the lower limbs was evenly distributed, and the comfort of the lower limbs was more balanced; the comfort of the S2 front protruding cushion was higher in the buttock area than that of the legs, which indicates that the front protruding cushion is beneficial to relieve the pressure on the buttock area; the comfort of the S3 flat cushion buttock and thigh area was better than that of S1 and S2, but the comfort of calf and knee joint was lower than that of the former two. Table 6 shows that the highest overall comfort score was S3 flat cushion, followed by S1 and S2 in the relaxed posture, the comfort of thigh area was better than that of buttocks, calves and feet for the S1 lateral convex cushions. The overall comfort of the S2 front protruding cushion was more balanced than the other two, of which the comfort score of calf area was the highest. The comfort score of the S3 flat cushion thigh area was the highest, and the pressure of flat cushion was lower than the other two for thighs, and so was the knee comfort. The comfort score of the S2 front protruding cushion was the highest. In the upright posture, the overall comfort of C-S3 was the best in the subjective evaluation of the three cushions, the score of C-S1 was the lowest, the comfort of C-S2 and C-S3 related thigh area was obviously different, and the comfort of C-S3 was obviously better than that of C-S2. In the relaxed posture, the difference in the subjective evaluation scores of the three cushions is not obvious. The highest score is R-S3 and the lowest is R-S2. There is no significant difference in the average of the hip and foot regions. The R- S2 has the lowest average score in the thigh area, and R-S1 has the lowest average score in the calf area, indicating that in a relaxation state, the protruding edge of the cushion will affect the comfort of the thigh area, and the protrusion of the sides of the cushion will affect the comfort of the thigh and calf area, it can be found that in the two sitting positions, the overall comfort score of the front protruding cushion in the upright posture is the highest.
It is found that the overall contact area between the subject and the cushion is smaller in the upright posture than in the natural relaxation posture. The center of gravity of the relaxed posture did move downward, which corresponds to the observed increase of the contact area with the cushion. Due to the change of the sitting posture and the cushion surface, the center of gravity of the cushion in each sitting posture is different. The displacement indicates that both the sitting position and the cushion surface do affect the weight distribution of the subjects on the cushion. The average pressure of the C-S1 cushion is the lowest, it corresponds with the comfortable experience, which is better than in the other cushions in the single factor analysis state. The maximum pressure of the R-S2 cushion is the highest. The pressure at the nodule is the highest, and at the center, the pressure expands smoothly from high to low, so the pressure at the nodule of the sciatic bone of the cushion with protruding front is the highest in the relaxed posture. In the case of the upright posture, the pressure on the two sides of the cushion ischial tubercle is the lowest, which is more comfortable for the ischial tubercle. The contact area of the cushion is smaller than that of the whole body in the relaxation sitting posture, and the contact area of the man-cushion in the relaxed posture is larger than that in the upright posture in three different surface shapes. The bilateral protruding cushion in upright posture is more comfortable than the flat cushion.
Limitations
In this paper, the comfort of three high-speed railway seat cushions are studied. However, the dynamic comfort, vibration characteristics of human body, and the optimization of seat internal structure design are still to be explored. In order to comprehensively reflect the riding comfort of high-speed railway seats in the future study, other biological indicators (such as fidgeting, electromyography, skin electricity, etc.) are considered to analyze movement, muscle fatigue and skin temperature changes. Due to the limitations of experimental conditions, no complete limit value and closed value of body pressure index response discomfort can be obtained. It is suggested that in the future research, we should design the cushion whose shape can be changed freely and carry out more detailed research on the comfort of the seat. If conditions permit, the experimental research under the real high-speed railway running condition would solve the influence of other environmental factors and provide more scientific data support for the research of high-speed railway comfort.
Conclusion
Throughout the subjective and objective study on comfort of high-speed railway seat cushions, it was found that flat cushion is the most comfortable of the three different shaped cushions in the subjective evaluation, the front protruding cushion improves the pressure distribution in the sense that the homogeneity of the pressure distribution is better. The flat cushion has the smallest SPD% and the most uniform pressure distribution, which is the most comfortable. The upright posture seems to be more comfortable than the relaxed posture in the static state.
Conflict of interest
None to report.
Footnotes
Acknowledgments
This work was supported by National Natural Science Foundation of China [Grant No. 51775106], Shanghai Municipal Science and Technology Committee [Grant No. 18dz2301400], and Fundamental Research Funds for the Central Universities.