



Abstract
BACKGROUND:
Aircraft seat manufacturers are making efforts to reduce seat weight while continuously increasing seating comfort.
OBJECTIVES:
To verify if seats with an optimally pre-shaped foam support could improve seating comfort while reducing seat weight.
METHODS:
The optimally pre-shaped surface was obtained from a synthesis of 95% of individually optimized compressed seat pan surfaces of a target population. Two new seats were proposed with two different cushions, one slightly softer and the other harder. Nineteen differently sized volunteers tested the two new seats and an existing seat randomly. After an assessment of initial discomfort, participants were instructed to watch a TV series for 50 minutes. A same questionnaire was used to assess both initial and longer-term discomfort. Contact forces and pressure distribution were analysed as well in-chair movements (ICM) during sitting.
RESULTS:
The two new seats exhibited lower shear, lower peak pressure and larger contact area on the seat pan as well lower number of ICM during the 50 minutes sitting. They also had lower initial overall discomfort, though significant differences between the seats were not found after the long sitting.
CONCLUSIONS:
Properly pre-shaped surface could be used as foam support to reduce the amount of foam while reducing seating discomfort.
Introduction
An airplane passenger seat, like other seats in transportation, can be used by thousands or millions of people. The seat should be designed to accommodate the maximum number of a target population by taking into account the variability of body size as well as the environment’s constraints. Aircraft seat manufacturers are facing two strong requirements from airline companies: to reduce seat weight while continuously increasing seating comfort. Despite a large amount of investigations on seating comfort, a recent review by Hiemstra-van Mastrig et al. [1] showed that statistical evidence on the relationships between anthropometry, seat characteristics, passengers’ activities and comfort perception is still lacking for supporting seat designers and purchasers to make informed decision. In order to provide quantitative guidelines for improving seat design, data of the preferred seat profile and compressed seat pan surface were collected in function of seat pan and backrest angle from a sample of differently sized participants using a reconfigurable experimental seat we built recently [2]. Parametric models were obtained to predict optimal seat profile parameters in function of a sitter’s anthropometric characteristics, seat pan angle and seat back angle [3]. Using a population simulation approach, a sample of 500 males and 500 females were generated randomly based on the distribution of the CAESAR US civil population [4]. The distribution of the preferred seat profile parameters, such as seat height, seat pan length, back profile angle as well as optimal compressed seat pan surface (C-surface), was obtained by virtual population simulation [5]. We proposed a so-called 95% tile C-surface, which encompasses 95% of individually optimized compressed seat pan surfaces of a target sitter population, as foam support to reduce amount of foam while maintaining a good pressure distribution. We hypothesize that the optimal C-surface as foam support could: Reduce the amount of foam needed for reducing peak pressure (thus a more uniform pressure distribution) Use a uniform foam without varying foam thickness and stiffness, thus simplifying cushion man-ufacturing process
It should be noted that the idea of using a pre-shaped foam support is not new to reduce weight and to improve comfort. Reed [6] suggested the use of an initially contoured surface to reduce the amount of deflection required to achieve the overall target con-tour. Franz et al. [7] developed a lightweight and comfortable automotive seat with a minimum of materials by using the contour of the seated human. Smulders et al. [8] used similar approach to develop more comfortable and lightweight aircraft seats. As the optimal seat profile and C-surface were obtained from an initial comfort assessment with a very short sitting experience, it is therefore necessary to verify if the proposed optimal seat parameters are well perceived for a longer sitting duration.
In the present study, two new seat configurations were defined based on the proposed optimal seat par-ameters. The objective of the present study was to evaluate these two new seat configurations with res-pect to an existing reference seat REF. Our hypothesis was that the two new seats with an optimal profile and pre-shaped foam support surface should be better than REF in terms of both subjective perception and objective measurements.
Materials and methods
Participants
Nineteen subjects participated in the experiment. They were selected by stature and BMI (body mass index) 6 short females (3 with BMI <24 (FSH), 3 with BMI >30 (FSO)) 6 average height males (3 with BMI <26 (MAH), 3 with BMI >30 (MAO)) 7 tall males (4 with BMI <26, (MTH), 3 with BMI >29 (MTO))
Prior to the experiment, participants were screened using a health questionnaire. They should already have a long haul travel experience in an economics class and be in good health condition for air travel. Participants who experienced any back injury or pain in the previous 3-months were excluded. IFSTTAR (French Institute of Science and Technology for Transport, Development and Networks, now Univer-sité Gustave Eiffel) ethics committee approved the experimental protocol. Informed consent was obta-ined prior to experiment for all participants. Prior to experiment, main anthropometric dimensions such as stature, weight, sitting height etc. were measured for each participant. They were asked to dress with their own clothes and shoes pretending it was a real flight.
Three seat configurations
Two new seat configurations with a same pre-shaped foam support were defined with two different foams with a thickness of 45 mm Cushion N_Soft: slightly softer Cushion N_Hard: slightly harder
Compared to the existing reference seat REF, the form thickness was same everywhere for the two new seats, while REF had variable foam thickness with a maximum of more than 70 mm at the rear part of seat pan. A foam weight of about 100 g less was obtained for the new seats. A standard compression protocol [9] was applied to characterize the mechanical properties of the two cushions. A disc of 200 mm in diameter was used and positioned on the central line of the cushion at 200 mm from the rear edge. A compression speed was fixed at 100 mm/min. The deflections corresponding to a compression force at 200, 300 and 400N were 12.3, 17.6, 24.4 mm and 14, 20.9, 27.3 mm respectively for harder (N_Hard) and softer (N_Soft) cushions.
The back of the reference seat REF was used for all test conditions. For the two new seat configurations, a slightly more reclined seat pan was adopted with an angle of 4.1° (+3° considering the airplane pitch angle during a cruise, therefore 7.1° with respect to the horizontal) based on the preferred angles observed previously [3]. The back angle was 22.4° with respect to the vertical and slightly more reclined than REF. The seat back of REF was fixed on the upper support panel of the IFSTTAR experimental seat, which was instrumented with the force sensors to measure the contact forces at all contact surfaces [2]. Three different seat pans with their cushion could be fixed on the seat pan support of the experimental seat. The three seat cushions were covered with the same tissue. Once fixed on the experimental seat, two pressure maps were put on the backrest and seat pan cushions. Participants could not distinguish three seat cushions visually. Fig 1 shows the definition of the three tested seat configurations. The values of the adjustable parameters corresponding to the three seat configurations were pre-recorded prior to experiment so that they could be recalled later. In order to create a realistic environment, a simulated frontal seat was added with an iPad tablet. Its position was adjustable. A TV series of about 10 hours was uploaded in the iPad. An inclination angle of 3° was imposed to the whole seat to simulate the airplane pitch angle during a cruise. Fig 2 shows a participant sitting on a test seat with its surrounding environment.
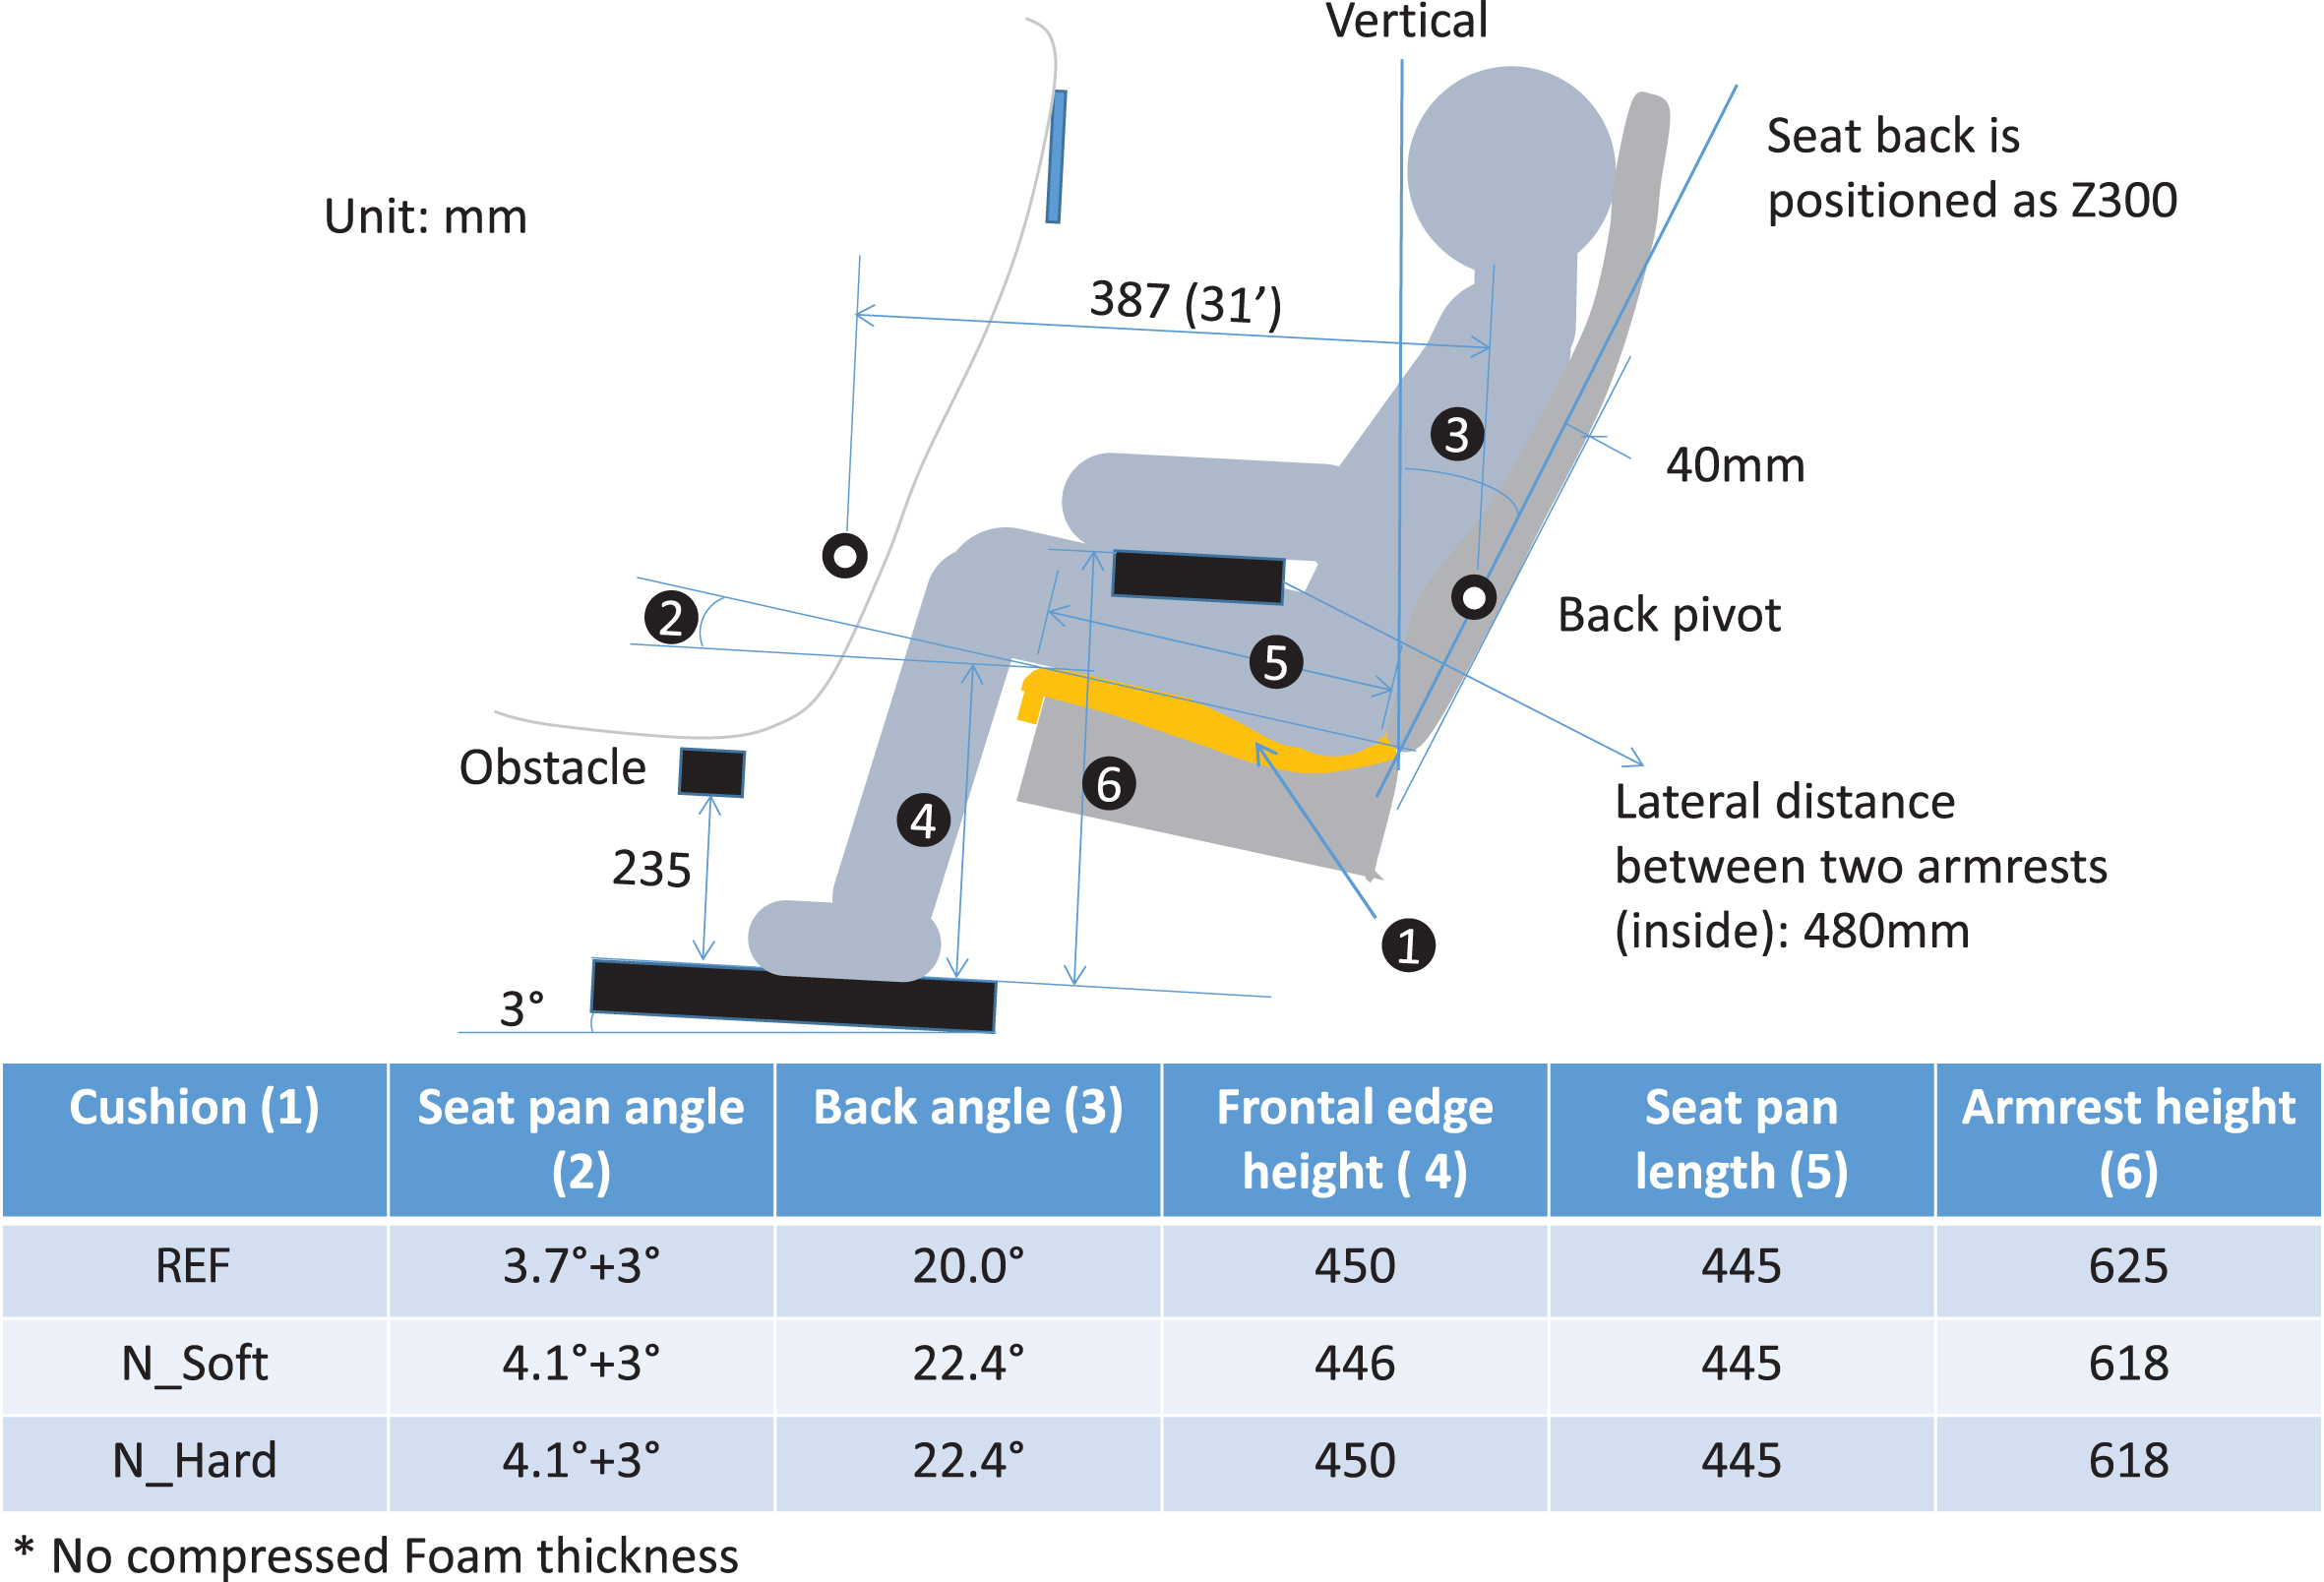
Definition of three seat configurations tested in the present study. A same seat back as the reference seat REF was used for all three configurations. Seat pan angle was defined according to the standard EN4723 : 2015E. Distance between two armrests was increased for some participants with high BMI.
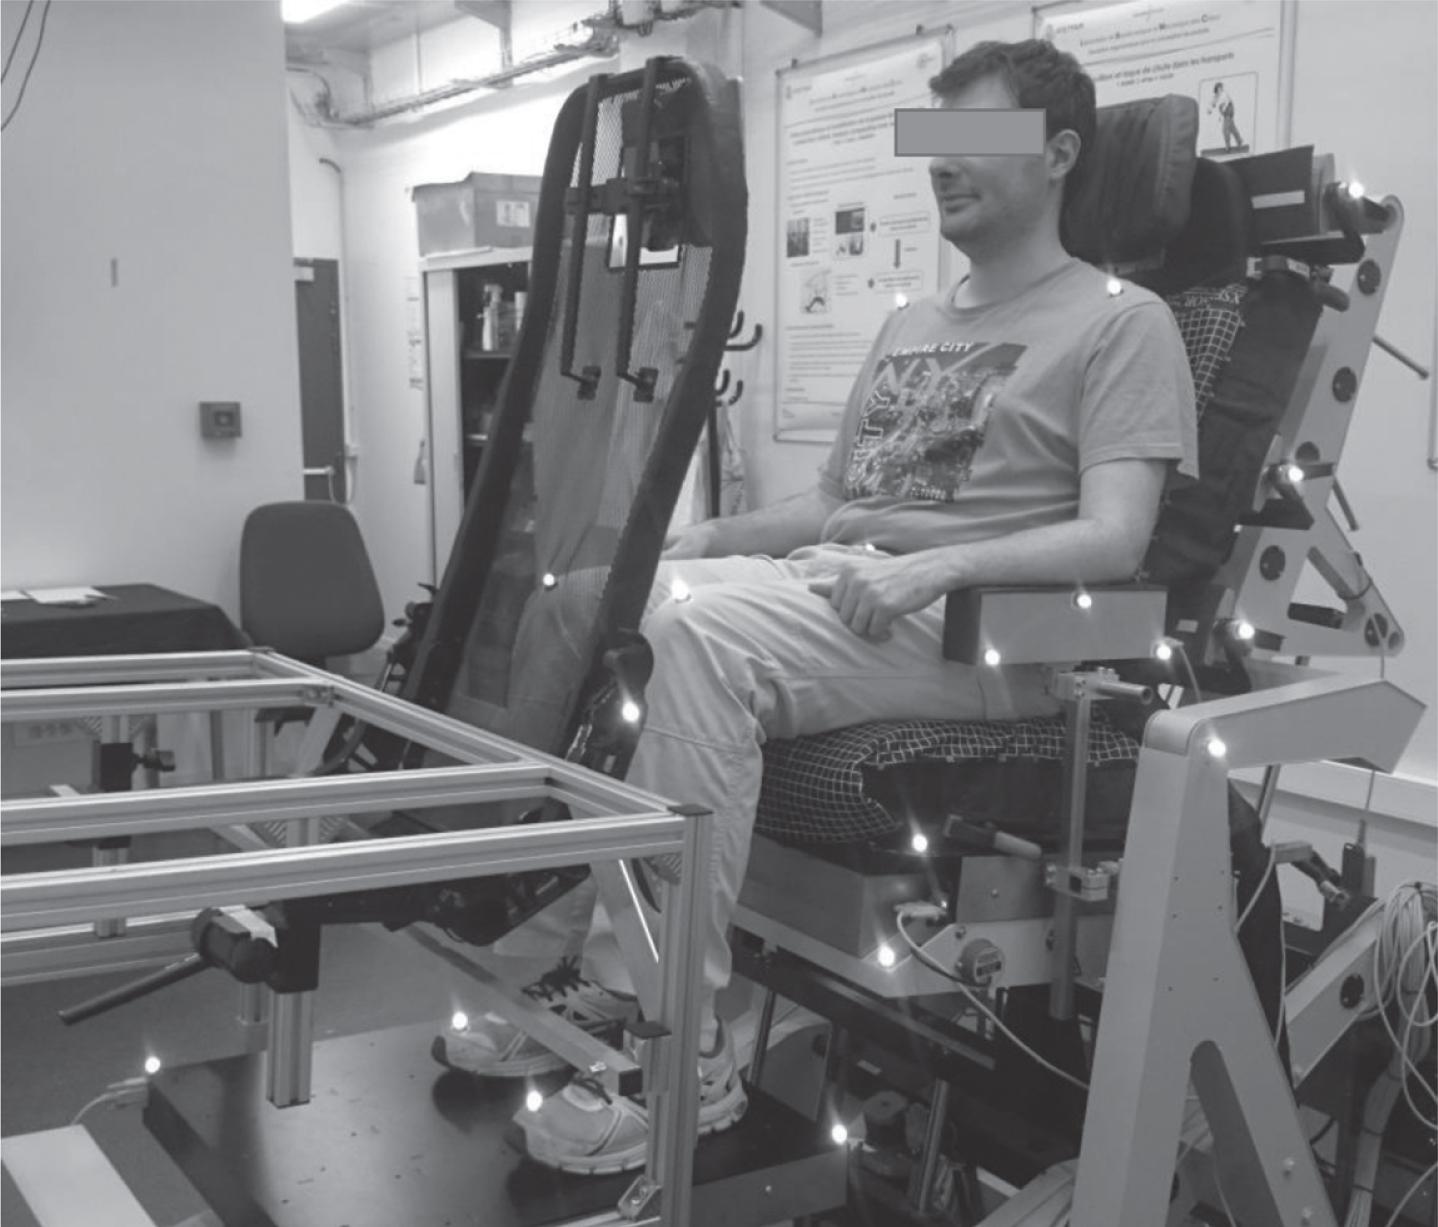
A participant testing a seat configuration while watching a movie.
The experiment was organized in two sessions for each seat configuration: initial and long term sitting assessment. An initial discomfort was assessed for the five postures (Neutral, Relaxed, Erect, Frontal Sleeping, and Side Sleeping, see the Appendix for the instructions) during a short duration for each position (<2 minutes). The ‘neutral’ posture was always tested the first and the responses from the questionnaire were collected. Only the global discomfort was rated for the four others, which were tested in a random order. After the initial comfort assessment, participants were instructed to watch a TV series for 50 minutes. No specific instruction was given regarding the posture to be adopted. After having watched the movie, the same questionnaire was proposed so that participants could assess the discomfort after the long term sitting experience.
Between two seat configuration tests, participants were asked to take a break of at least 10 minutes. They were encouraged to walk a little bit in the experimental room. Drinks and biscuits were proposed. The test order of these three conditions was randomized. The total duration including the welcoming and anthropometric measurements was about 4 hours.
The questionnaire was composed of two parts, one for assessing the seat and the other for assessing the body part discomfort (see Appendix). A multiple-choice question was designed for assessing the following seat parts: position of headrest and lumber support, seat pan length, seat pan cushion hardness, seat height, seat pan inclination, backrest inclination, space under the frontal seat, knee space, and armrest position. The categorical partition scale CP50 [11], from 0 (imperceptible) to 50 (extremely strong) or more was used for assessing the perceived discomfort of 8 body parts (neck, upper, middle and lower part of the back, buttocks, middle and distal part of the thighs, calf) as well as the overall discomfort perception. The scale was put in front of the participants and was visible all the time. They were instructed to first select a category among seven responses (imperceptible, very low, low, medium, high, very high, extremely high), then to refine their judgement by choosing a number from 1 to 10 within the selected category. The real scale from 0 to 50 and more (original CP-50) was hidden from the subject in order to give priority to the category choice and not to a numerical value.
In addition to the subjective responses from the questionnaire, the following objective variables during a trial were measured: contact forces at the foot support, seat pan, back support and armrests by the experimental seat, contact pressures at the back and seat pan by two Xsensor pressure-mapping systems (PX100.48.48.02, distance between two adjacent pressure cells 12.7 mm). The measurement frequencies for both experimental seat and pressure maps were respectively 25 and 2 Hz for initial and long sitting sessions. Nine markers were attached on the shoulder, the belt, the knees and the shoes. Their positions were measured by a Vicon motion capture system at 30 Hz. A trigger device was used to generate starting and ending analog signals that could be recognized by both Vicon and force sensors from the experimental seat. In addition, a wand equipped with two markers visible by Vicon was used to press a specific area of the seat pressure pad for synchronizing Vicon and Xsensor measurements. All trials were also recorded by a video camera for visual inspection.
Data processing and analysis
Questionnaire responses
The questionnaire responses were analyzed with help of STATGRAPHICS Centurion 18. Multi-factor ANOVA was performed on the CP50 ratings of global discomfort as well as those of body parts, with explicative factors being sitting duration, seat configuration, and subject group. For the initial discomfort assessment, effects of sitting posture were also analyzed. For the categorical responses on the assessment of seat and its surrounding, contingency tables were generated and Chi-square test was used for comparing the responses between different test conditions and subject groups. Effects were considered ‘significant’ when p < 0.05.
As the main differences between three seating configurations concerned the seat pan, only the results about the questions related to seat pan as well as the global discomfort ratings are reported in this paper.
Seat pan pressure distribution parameters
Some pressure cells failed. The missing pressures were interpolated with the measures of the surrounding cells at first. Then the pressures were smoothed using a moving average filter of 3 by 3. Similar to the ones proposed by Zemp et al. [12], pressure related parameters were calculated including total contact area (Area), peak (Max), mean, standard deviation (std) of pressures (P) and pressure gradients (Grd). In addition, four sub contact areas were defined from the pressure profile as illustrated in Fig. 3. The proportion of the sum of pressures applied at each of these four areas (P_I, P_II, P_III and P_IV) was calculated with respect to the sum of all pressures. The contact areas I to III approximatively corresponded to the areas under the pelvis, rear and frontal part of the thighs. Area IV is the distal half part of Area III close to the knees. The parameters extracted from the mean pressure distribution from each of the four symmetric postures (neutral, erect, relaxed, forward sleeping) during the initial comfort assessment session were analysed and used as pressure related candidate objective variables to correlate with discomfort.
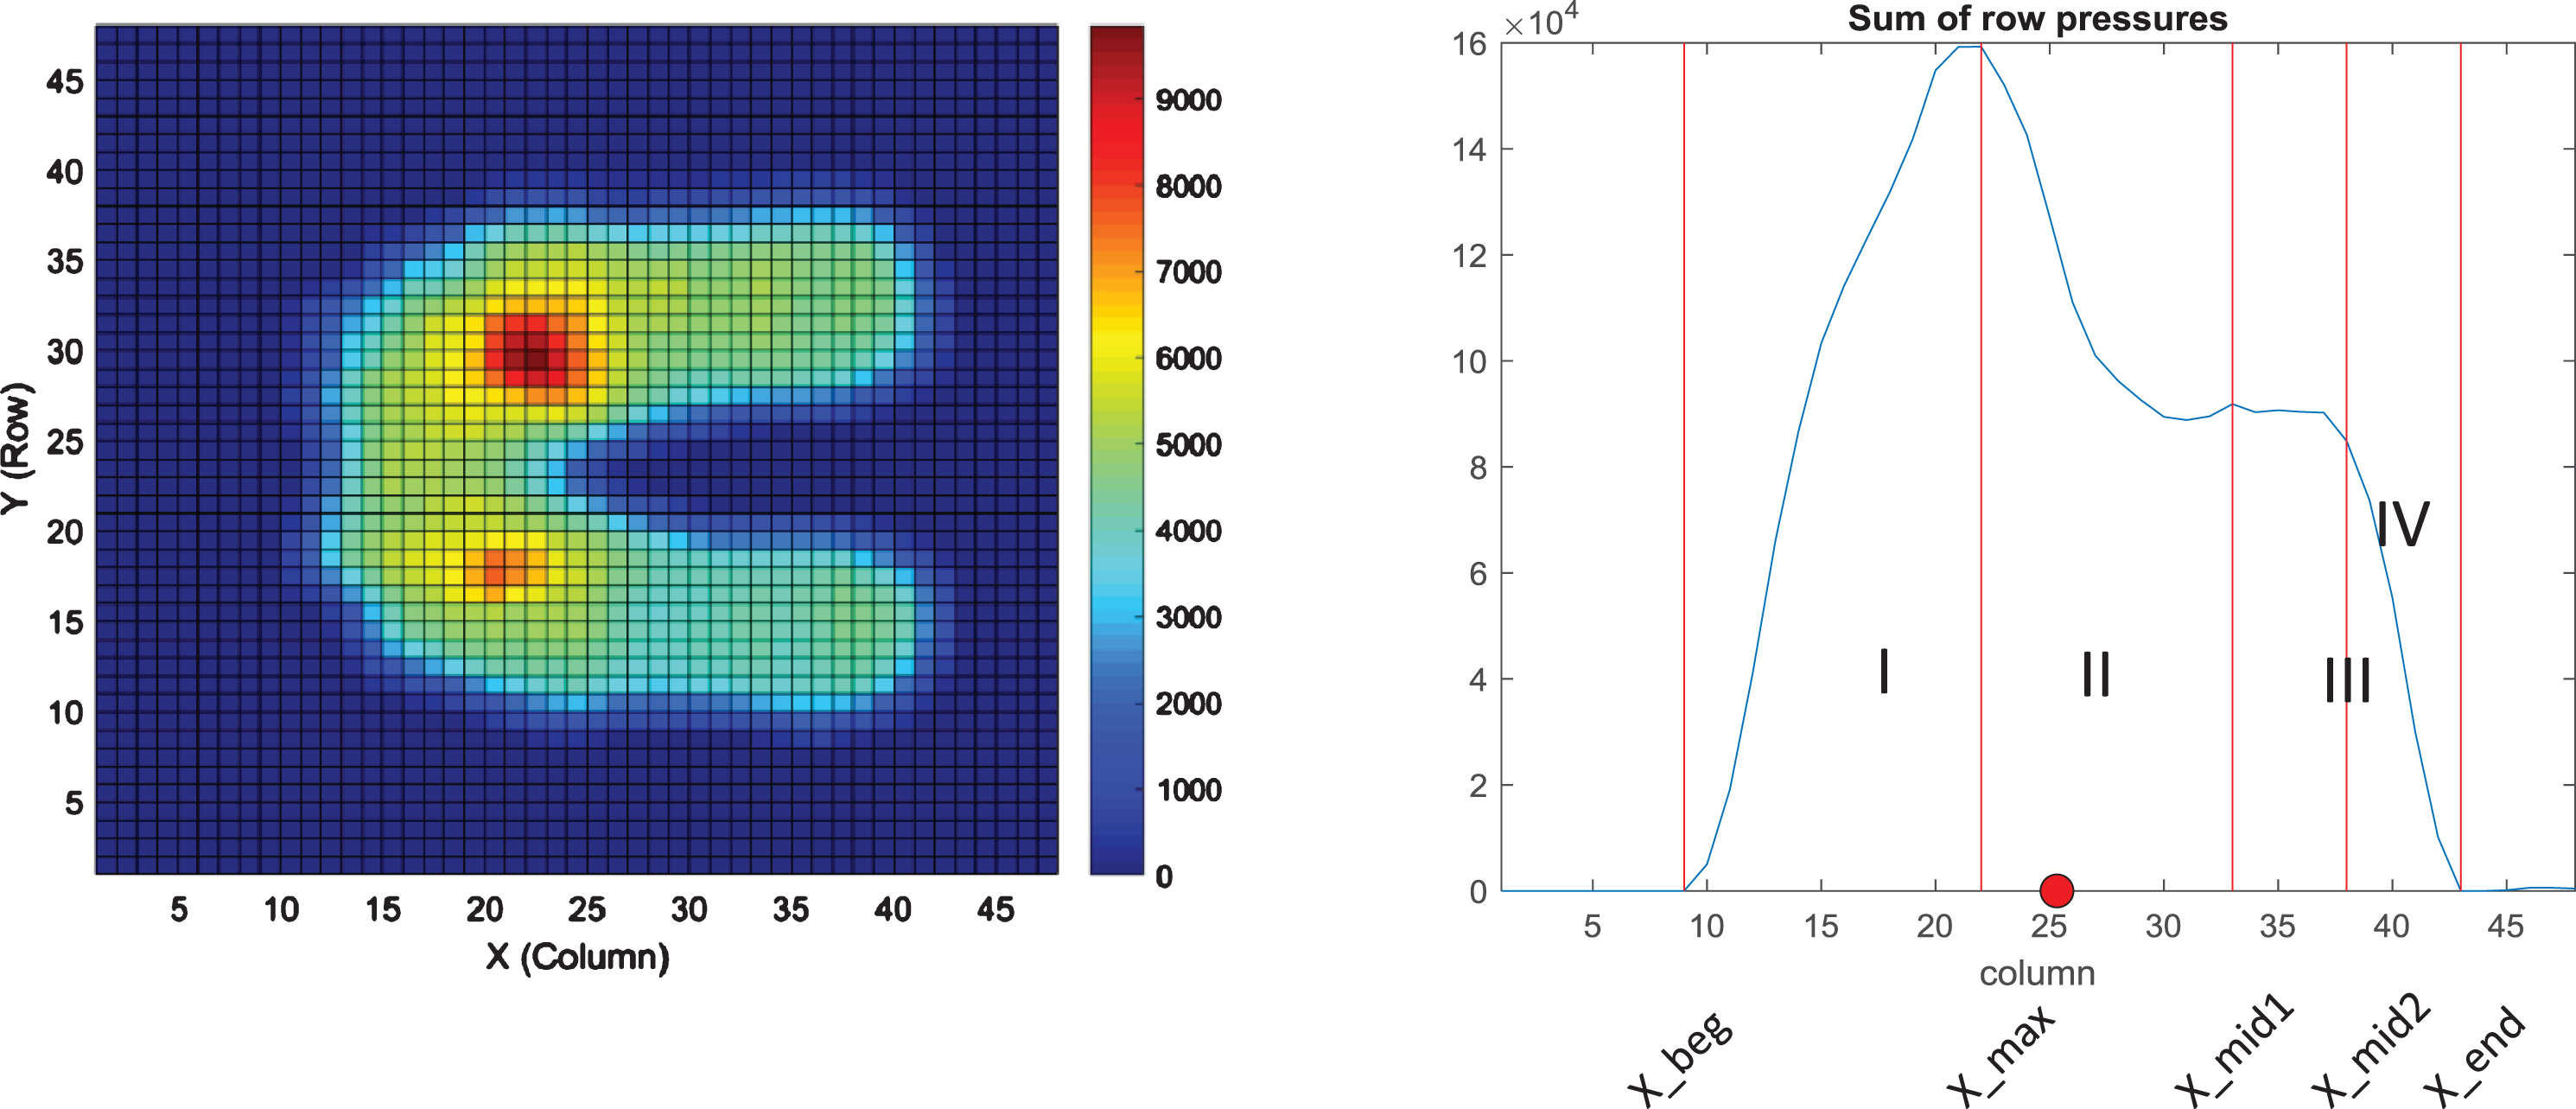
Definition of four sub contact areas from the pressure profile (sum of the pressures at the cells of a same column). X_beg and X_end are the beginning and end of contact area, X_max the column number corresponding to the peak of the pressure profile, X_mid1=(X_max+X_end)/2, X_mid2=(X_mid1 + X_end)/2.
Apart from pressure distribution, postural changes or in-chair movements (ICM) for a long sitting duration were also suggested as an objective measure for assessing seating discomfort [13, 14]. To detect in-chair movements (ICM) during the time of watching movie, the measurements by the pressure maps and the force sensors equipped in the experimental seat were synchronized and resampled at 2 Hz. An ICM was identified by comparing the contact forces measured at the feet support, seat pan, back and armrests as well as the row and column positions of centres of pressure (COP) on the seat pan and back between two adjacent frames. The back support force was the sum of the forces measured at the lower and middle panels. The force resultants were calculated and normalized by body weight. If one of these eight parameters had a change between two frames greater than their corresponding threshold, an ICM started until to the frame for which the changes of all eight parameters with respect to the previous frame became smaller than their respective thresholds. In the present work, the thresholds were fixed to 5% of body weight for the four contact forces and one pressure cell unit (12.7 mm) in both row and column directions for two COPs.
In order to distinguish sitting behaviours, three ICM types were defined according to the maximum change in the seat pan contact force during an ICM: Small: maximum seat pan force variation (ΔFsp)≤10% of body weight (BW). Moderate: 10% of BW< ΔFsp≤20% of BW. Large: ΔFsp>20% of BW
In a previous study [15], we observed that the contact forces on the foot support and armrests were respectively about 19.2% and 4.5% of body weight in the seating conditions similar to the present study. A small ICM may correspond to the position change of one foot or two hands, while a moderate ICM may correspond to both feet movement without moving the buttocks. It is highly probable that a change in seat pan force larger than 20% of body weight implies the position change of the buttocks.
For each trial during the movie watching session, the total number (N_move) and duration (T_move) of in-chair movements were calculated for all three ICM types.
Results
Global and body part discomfort ratings
Concerning the initial discomfort perception, no significant differences were found between 5 sitting postures, while there were significant differences between 6 subject groups and 3 seat configurations. The new seat configuration N_Hard had the lowest discomfort rating with an average of 16.2, significantly lower than REF with an average of 20.1 (Fig. 4b). The subject group MAO (average height male obese) had the lowest discomfort whereas the groups MTO (male tall obese) and FSO (obese short female) had the highest discomfort (Fig. 4a).
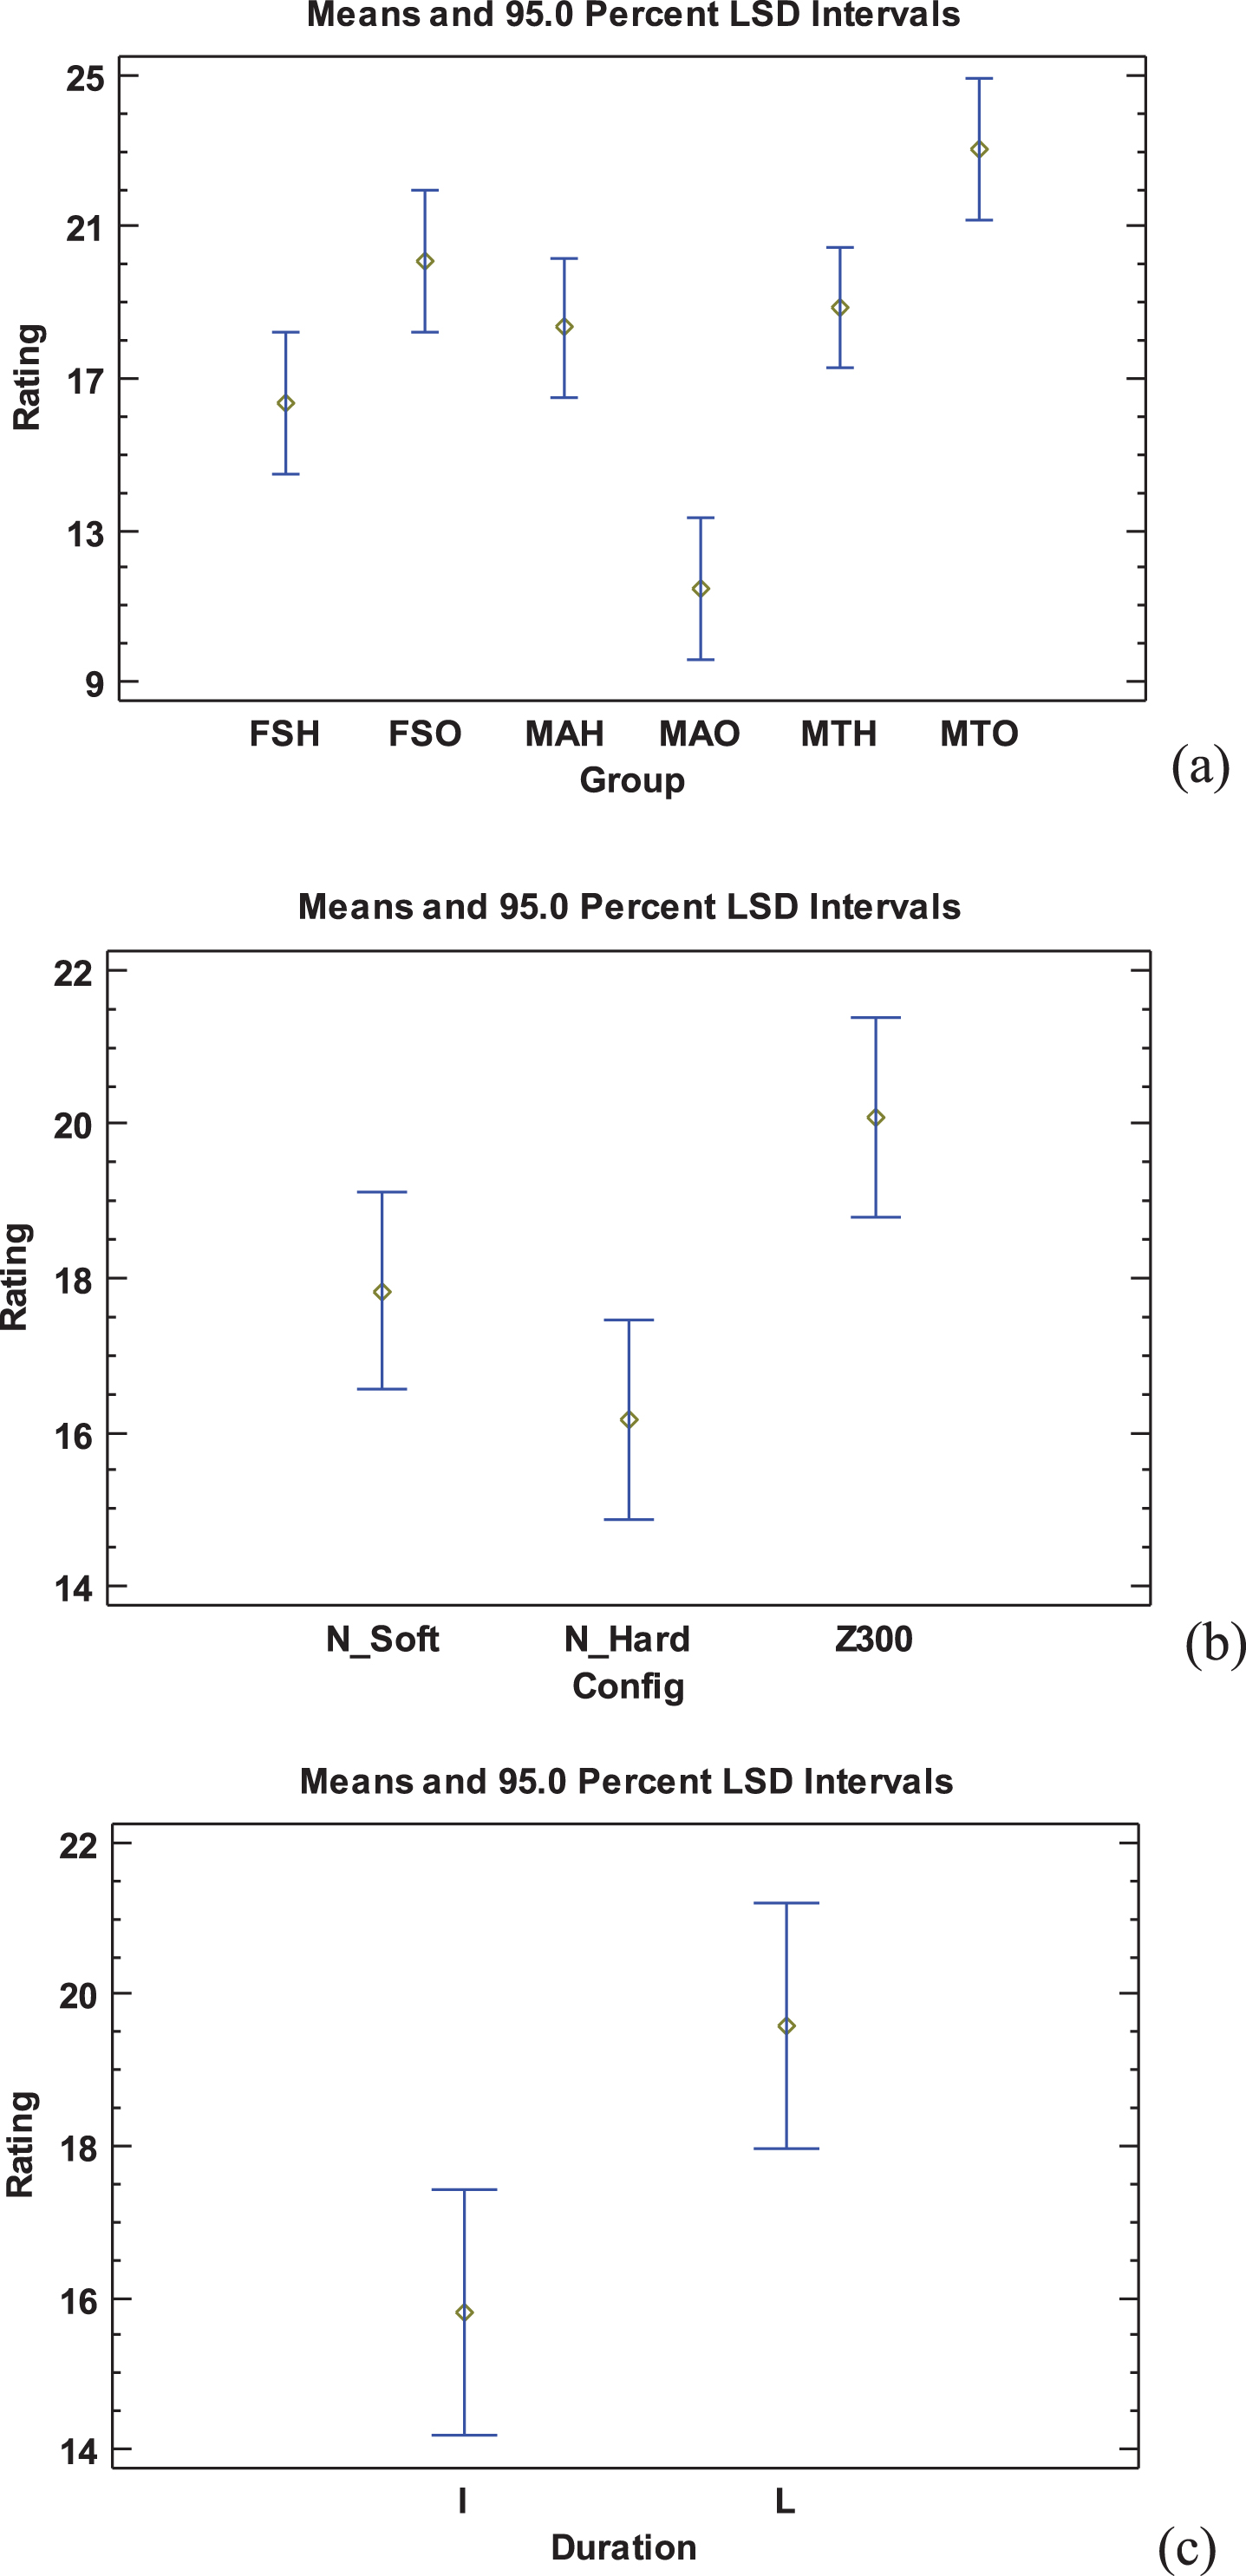
Effects of subject group (a), seating configuration (b) and sitting duration (c). Means and Fisher’s LSD intervals at 95% are shown. FSH: female short heathy, FSO: female short obese, MAH: male average heathy, MAO: male average obese, MTH: male tall healthy, MTO: male tall obese, I: initial assessment, L: long sitting assessment.
When comparing the initial CP50 ratings of the neutral posture with those after 50 minutes sitting; only sitting duration had a significant effect, whereas no effect was found for both subject group and seat configuration. Slightly but significantly higher discomfort rating was obtained after 50 minutes sitting. On average, the discomfort ratings were 15.9 and 19.7 respectively for initial and longer sitting assessments (Fig. 4c).
The CP50 ratings at eight body parts were also analyzed similarly. As for the global discomfort rating, sitting duration significantly affected the perception of all body parts except for the neck and calf. Higher discomfort was generally perceived after 50 minutes sitting. No significant differences between three seats were observed except for the neck. Significant differences between six subject groups were observed almost for all body parts except for the neck. Lower discomfort was perceived in the buttocks and thigh for the participants with higher BMI (Fig. 5).
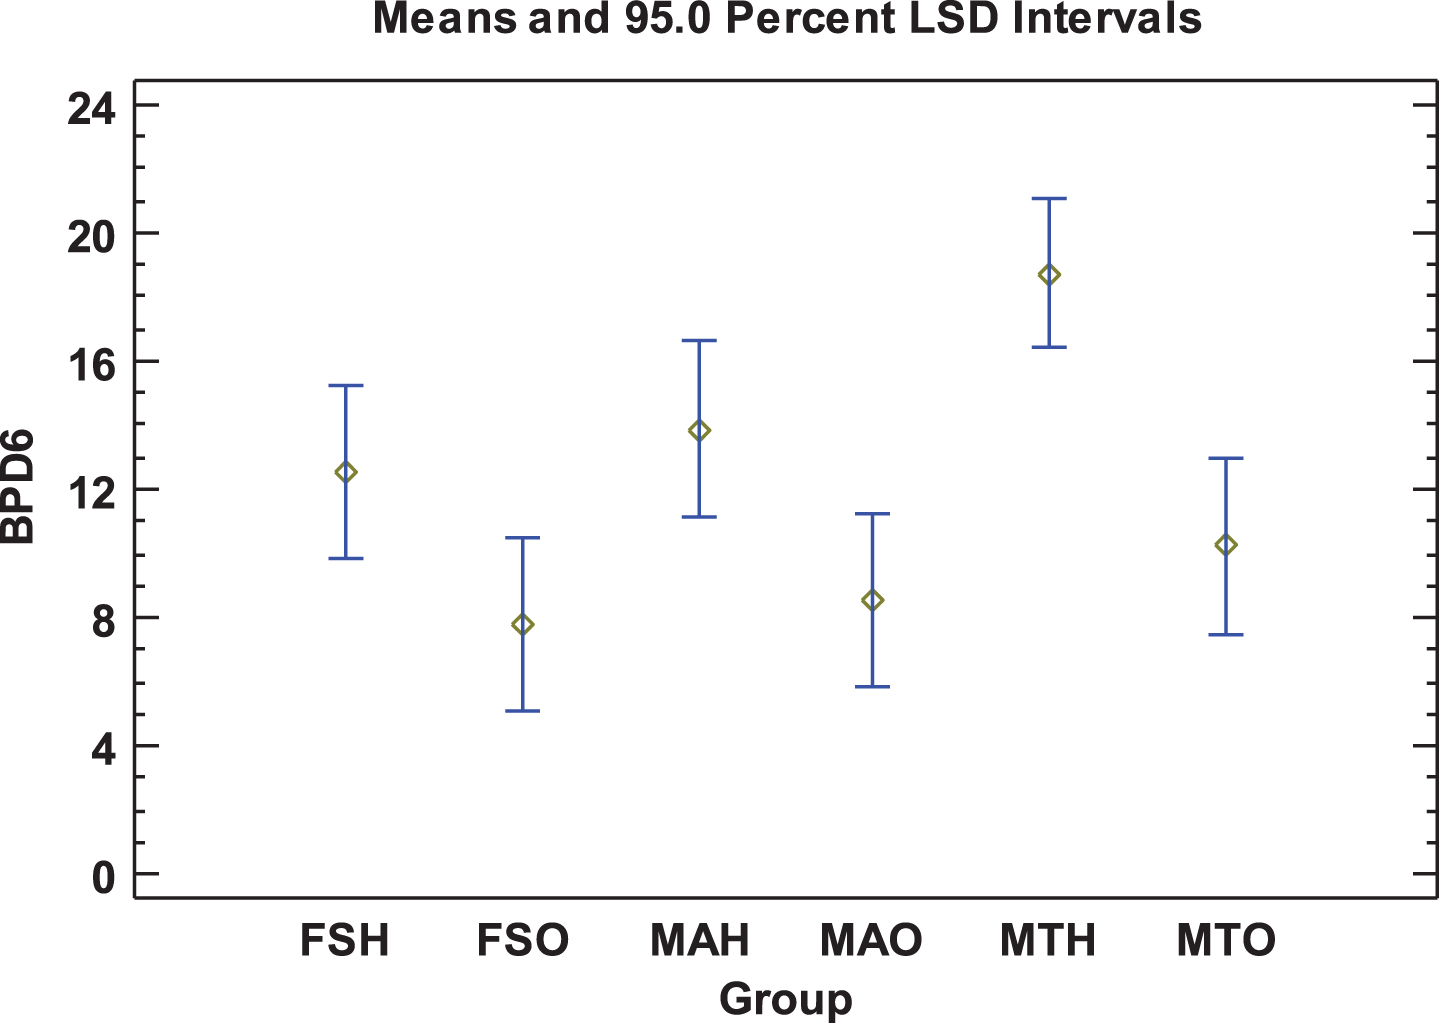
Means and Fisher’s LSD intervals at 95% of the CP50 discomfort ratings at the middle thigh area (Body part 6, see the questionnaire in the Appendix).
Summary statistics of stature, weight and body mass index (BMI) of the 19 participants
Summary statistics of stature, weight and body mass index (BMI) of the 19 participants
Main effects of sitting duration, seat configuration and subject group were analyzed by comparing the frequencies of the categorical responses to the questions posed in the questionnaire. Concerning the effect of sitting duration, only the responses regarding the seat hardness differed significantly (P-Value = 0.0193). Higher percentage of ‘a little bit too hard’ and ‘too hard’ were obtained after 50 minutes sitting. When comparing three seat configurations, only the responses concerning the seat hardness (P-Value = 0.023), seat height (P-Value = 0.006) and seat inclination (P-value = 0.0106) significantly differed (Table 2). The highest percentage of the responses ‘good hardness’ was obtained for N_Hard (27.19% of responses), followed by N_Soft (22.81%) and REF (16.67%). Higher percentage of ‘good seat height’ or ‘good seat pan inclination’ were also obtained for the two new seats than REF.
Number and percentage of the responses for Q4 (seat hardness), Q5 (seat height) and Q6 (seat inclination) by seat configuration and subject group. The responses of both initial and long term sitting assessments were analyzed together. P values by Chi square test on the effect of seat configuration (C) and participant group (G) are indicated
***P < 0.001, ** 0.001≤P < 0.01, * 0.01≤P < 0.05.
When comparing the responses between six subject groups, significant differences were found for most of the questions except Q2A (height of the lumbar support), Q4 (seat pan hardness) and Q6 (seat pan inclination). Note that among 14 responses (12.28%) perceiving the seat height ‘a little bit high’, 13 were from the short female participants.
Table 3 summarizes the means of seat pan shear force and pressure parameters from the measurements of the four symmetric positions (Neural, Erect, Relaxed and Forward Sleeping). A three-way ANOVA was also performed to examine the effects of seat configuration (C), posture (P) and subject group (G). As expected, contact force and pressure are highly dependent on sitters’ anthropometry and posture. Almost all variables listed in Table 3 were affected by subject group and posture. Some interactions between these three factors, especially between posture and subject group, were also observed.
Means of the shear force (fx_n, backward positive) and normal force (fz_n, upward positive) on the seat pan normalized by body weight and the parameters extracted from measured seat pan pressure. Data collected at the initial discomfort assessment for the neutral, erect, relaxed and forward sleeping positions were used. Pressure parameters are: contact area (Area), standard deviation of pressure (P_std), peak pressure (P_max) and mean pressure (P_mean), standard deviation of gradient (Grd_std), peak gradient (Grd_max) and mean gradient (Grd_mean). P_I, P_II, P_III and P_IV are the pressure proportions of the four areas under the pressure profile defined in Fig. 3. The effects of seat configuration (C), posture (P) and subject group (G) and their interactions are indicated.
Means of the shear force (fx_n, backward positive) and normal force (fz_n, upward positive) on the seat pan normalized by body weight and the parameters extracted from measured seat pan pressure. Data collected at the initial discomfort assessment for the neutral, erect, relaxed and forward sleeping positions were used. Pressure parameters are: contact area (Area), standard deviation of pressure (P_std), peak pressure (P_max) and mean pressure (P_mean), standard deviation of gradient (Grd_std), peak gradient (Grd_max) and mean gradient (Grd_mean). P_I, P_II, P_III and P_IV are the pressure proportions of the four areas under the pressure profile defined in Fig. 3. The effects of seat configuration (C), posture (P) and subject group (G) and their interactions are indicated.
***P < 0.001, **0.001≤P < 0.01, * 0.01≤P < 0.05
Seat configuration affected almost all variables except P_I (pressure proportion under the pelvis). Normalize shear forces were about 9% of body weight on average for the two new seat configurations N_Hard and N_Soft; significantly lower than REF, which had a shear of 12.2% of body weight. The two new seat configurations also exhibited a more uniform pressure distribution with larger contact area, lower peak and mean pressure, lower mean gradient. Compared to REF, higher pressure proportion was located at the frontal part of the thighs with higher P_III and P_IV and lower P_I and P_II for the configurations N_Hard and N_Soft.
Mean number of small, moderate and large ICM and their duration by seat configuration and subject group are summarized in Table 4. Globally, the number of ICM observed during the 50 minutes of movie watching was less than 10 times per trial on average, representing a total movement duration of 53 seconds. There were a large inter-participant and inter-subject group difference in sitting behaviour. When comparing three seat configurations, average number and duration of ICM for REF were (3.37 times, 18.53 seconds) and (1.53 times, 8.39 seconds) respectively for the moderate and large movements (implying a seat pan force change higher than 10% of body weight), higher than two new configurations. This is particularly true for the large ICM, for which the mean durations were 5.21 and 5.79 seconds respectively for N_Hard and N_Soft.
Means of number (N_move in times) and duration (T_move in seconds) of in-chair movements (ICM) during the movie watching for small, moderate and large movement types by seating configuration and participant group
Means of number (N_move in times) and duration (T_move in seconds) of in-chair movements (ICM) during the movie watching for small, moderate and large movement types by seating configuration and participant group
Correlation coefficients between CP50 discomfort ratings at the initial assessment for the four symmetric sitting positions and the seat pan contact force and pressure parameters were calculated and summarized in Table 5. Only a weak but significant correlation was found for Grd_max, P_III and P_IV. The pressure proportion at the frontal thigh area near to the knees (P_IV) had the strongest correlation with CP50.
Pearson product moment correlations between CP50 discomfort ratings and objective measures and P-values for testing the statistical significance of estimated correlations
Pearson product moment correlations between CP50 discomfort ratings and objective measures and P-values for testing the statistical significance of estimated correlations
In the present work, two new airplane seats with an optimally pre-shaped foam support were compared with a reference seat by 19 differently sized male and female volunteers. Both subjective and objective measures were investigated. The main observations are summarized as follows: Regarding the effect of sitting duration, higher discomfort score and harder seat cushion were observed after 50 minutes sitting than initial assessment. Concerning the effect of seat configuration, the new seat configuration with a more dense foam (N_Hard) had the lowest initial discomfort rating, significantly lower than REF. However, no significant difference was found after 50 minutes sitting. Most of the participants found that the seat N_Hard had a good hardness and seat height, followed by N_Soft and REF. When comparing the responses between six subject groups, significant differences were found for most of the questions except for seat pan hardness (Q4) and seat pan inclination (Q6). Concerning the seat pan contact force and pressure related variables, they were highly affected by participant group and posture. Two new seat configurations N_Hard and N_Soft had significantly lower shear force than REF. They also had lower peak pressure, larger contact area, lower pressure gradient and larger pressure at the frontal thigh area (III and IV). Lower number and shorter duration of moderate and large in-chair movements were observed for the two new seat configurations. Pressure proportion at the frontal thigh contact area near the knees seemed correlated with CP50 discomfort scores.
Globally, both objective measures and subjective ratings support that two new seat configurations with an optimized foam support are better than the reference seat REF. The new seat with slightly harder foam seemed better perceived with lower discomfort. The pre-shaped foam support was obtained from a synthesis of the simulated compressed surfaces (C-surfaces) from a virtual population of randomly generated 500 males and 500 females [5]. The raw C surfaces were obtained experimentally by controlling the height of the 52 cylinders; forming the seat pan surface, to distribute the contact force as evenly possible among these cylinders with a maximum displacement of 40 mm [3]. Therefore, it is not surprising that two new seat configurations had a more uniform pressure distribution with lower peak pressure and higher contact area. In addition, they had a slightly more reclined seat pan angle, leading to a smaller shear force as already found in our previous study [15]. If we refer to the general recommendations for improving seating comfort by Reed [16], lower peak pressure and lower shear force on the seat pan contact surface could contribute to reduce discomfort.
It should be noted that a reduced peak pressure (more uniform pressure distribution) on the seat pan surface for the two seat configurations was obtained by enlarging contact area and putting more pressure on the frontal thigh. However, Vink and Lips [17] recently observed that the body area in contact with the front of the seat pan, i.e. areas III and IV defined in Fig. 3, was more sensitive to pressure than rest of the body part touching the seat pan. This may suggest that the pressure proportion in this part should not be too high. Mergl et al. [18] suggested that the load at the front of thighs should be less than 6% of the total load applied on the seat pan. In the present study, the uncompressed frontal seat edge height (FSEH) was fixed to 450 mm for all three tested seats, corresponding to the reference height from REF. It approximatively corresponds to the 50th percentile of self-selected seat heights (434 mm, compressed FSEH) for a mixed virtual CAESAR US civil population of 500 males and 500 females we simulated [5]. This means that the seat height may be too high for short females and may result in a high compression under the frontal thigh. Actually, this was observed for the short female participants who complained the tested seats were ‘a little bit high’ (Table 2) and had the highest pressure proportion at the frontal thigh (P_III, Table 3). To better accommodate the short females, seat height should be lowered if we refer to the 5th percentile of the preferred compressed FSEH which is about 380 mm [5].
In addition to the seat pan contact force and pressure related parameters, in-chair movements during 50 minutes sitting for watching a movie were detected by examining the variation of contact forces at different supports between two adjacent frames at 2 Hz. More than 50% of ICM observed concerned small movements implying a change of seat pan force less than 10% of body weight. When comparing three seat configurations, almost same number of small ICM was observed, while participants tended to move less for the two new seats than REF for moderate and large ICM (implying a variation in seat pan force higher than 10% of body weight). Many researchers considered ICM as a good objective measure of seating discomfort [13, 14] based on the assumption that ICM are required to avoid undesirable static posture and to relieve pressure of compressed soft tissues during a prolonged sitting. Our results seemed to suggest that only the ICM implying a large variation of seat pan force could be used as an objective measure for seating discomfort assessment.
Large inter-participant variation even in a same group was observed in both objective and subjective responses. Due to small number of participants, there were only three volunteers in each participant group selected by stature and BMI, except for MTH (male tall healthy) which had four volunteers. Small number of observations made difficult the statistical comparison between test conditions, especially for the subjective responses after 50 minutes sitting. Small number of participants was clearly a limitation of the study. Nevertheless, if we refer the discomfort perception at the buttock and thigh (Fig. 5), the participants with a BMI >30 perceived lower discomfort than those with BMI <25. The group MAO (Male Average Obsese) had the lowest global discomfort (Fig. 4). This suggests that seating discomfort also depends on body size, and it is difficult/impossible to propose a same cushion to reach a same hardness/comfort perception level for all.
Another main limitation is that the sitting duration of only 50 minutes was imposed for assessing prolonged seating discomfort. By including the initial assessment session, the total duration of sitting experience for each seat configuration was about one hour for each seat. For automotive seating discomfort assessment, Gyi and Porter [19] suggested that at least 120 minutes of sitting was necessary to clearly differentiate between various seats. For long-haul flights, airplane passengers have to remain seated for much longer time than automotive drivers. Longer sitting tests have to be performed in the future.
It should be noted that two new seats were not significantly better rated than the reference seat after the long term sitting, while objective measures tended to support our hypothesis that the new seats should result in lower discomfort. One explanation could be that number of observations for longer sitting was smaller than initial assessment as 5 sitting postures were tested during the initial discomfort assessment, thus statistical test power was much reduced. As higher discomfort was observed globally after 50 minutes sitting, it could be possible that the effect of sitting duration was stronger than the difference between seats. Bouwens et al. [20] tested an airplane seat equipped with an interactive gaming system allowing passengers to do in-seat exercises. Compared to a normal seat without the interactive system, lower self-reported discomfort was only observed at intermediate assessments but not at the end after 3.5 h. They hypothesized that people were aware of approaching the end of testing, and therefore already felt relieved (and thereby experienced less discomfort) at the end of a test. This may suggest importance of intermediate assessments, while only initial and final discomfort perceptions were assessed in the present work. The positive point is that the new seats with the proposed pre-shaped foam support did not increase discomfort perception while using less amount of foam. There is now a large consensus that comfort and discomfort are two distinct concepts and they should be assessed separately since the work by Zhang et al. [21]. Comfort is associated with feelings of relaxation and well-being while discomfort is associated with biomechanical factors. As the objective measures used in the present work were derived from contact forces and pressure distribution, the questionnaire was designed only for discomfort assessment. It would be interesting also to assess comfort perception in the future.
Conclusion
In summary, the two new seats exhibited smaller shear force, lower peak pressure and larger contact area on the seat pan surface, as expected. Interestingly, lower numbers of moderate and large in-chair movements were also observed for the new seats during a 50 minutes siting. Lower overall initial discomfort was obtained for the new seats, though no significant differences were observed between new and existing seats after a longer sitting. Objective measures tended to show that the optimally pre-shaped foam support [5] and preferred seat profile [3] we obtained experimentally are useful for improving seat design. Further studies are needed to optimize foam characteristics (density, thickness etc.) in combination with the proposed pre-shaped foam support. Sitting duration longer than 50 minutes is certainly necessary for assessing proposed new seats. A larger sample size of participants should be tested for both discomfort and comfort assessment.
Conflict of interest
None to report.
Footnotes
Appendix
8.1 Questionnaire (translated from French)
8.1.1 Assessment of the seat and its environment
8.1.2 Body part discomfort
8.2 Instructions for five sitting positions
Comfortably seated Back in contact with the seat back Sitting as far back as possible until the buttocks touch the backrest Arms on the armrests Headrest can be used and its position can be adjusted
Sitting as upright as possible Back in contact with the seat back Sitting as far back as possible until the buttocks touch the backrest Arms on the armrests Headrest cannot be used Knee angle about 90°
Back in contact with the seat back Sitting as far back as possible until the buttocks touch the backrest, Arms on the armrests Headrest can be used Knee angle about 90°
The legs can be extended to be under the frontal seat Arms on the armrests Headrest can be used
Headrest can be used
Acknowledgment
The work is partly supported by Direction Générale de l’Aviation Civile (project n°2014 930818). We would like to thank the technical assistance of Richard Roussillon and Leila Ben Boubaker.