
Abstract
BACKGROUND:
Since the start of the COVID-19 pandemic, the number of people working at home has grown significantly.
OBJECTIVE:
This cohort study aimed to investigate whether the frequency of working at home was associated with changes in body mass index (BMI) and productivity from 2018 to 2020.
METHOD:
Frequency of working at home was self-reported. Participants were classified into three groups based on mean frequency of working at home per week (no working at home: ≦ 0.5 days, low frequency: 0.5 to 2.5 days, and high frequency: >2.5 days). Productivity was measured using a numerical rating scale, and BMI was calculated using height and weight. Changes in BMI and productivity were calculated by subtracting 2018 data from 2020 data. Linear regression analysis was performed by considering BMI and productivity change as outcomes and frequency of working at home as explanatory variable.
RESULTS:
BMI change in the high frequency group was significantly smaller than in the group that did not work at home (crude; coefficient: –0.27; 95% CI: –0.55––0.01, adjusted; coefficient: –0.30; 95% CI: –0.60––0.01). Frequency of working at home was not associated with productivity change.
CONCLUSION:
Working at home may be a solution for preventing BMI from increasing significantly.
Introduction
Working at home can offer several advantages to employees, such as reduced fuel consumption and improved productivity [1]. In 2020, people started working at home to prevent the spread of the coronavirus disease of 2019 (COVID-19). National statistics indicated that, in Japan, the proportion of individuals working at home increased from 14.8% before the pandemic to 34.5% during the pandemic. While 8.9% of the remote working population worked at home more than three times per week before the pandemic, this figure rose to 60% [2, 3] during the pandemic. Despite this increase, no consensus has been reached on how working at home affects the well-being and productivity of workers. Therefore, the effects of working at home frequency must be further investigated.
Several studies have investigated the productivity and health of workers in relation to whether they worked at home. Some cohort studies showed that people who worked at home had more leisure time and healthier eating habits than those who did not [4, 5]. Moreover, a systematic review revealed that people who worked at home displayed higher productivity than those who did not [6]. Additionally, a few cohort studies have suggested that a higher frequency of working from home was associated with greater psychological stress [7, 8].
However, most of these studies only investigated the difference between working at home at least once and not working at home at all [9]. As mentioned above, a higher frequency of working at home was associated with greater psychological stress. At the same time, it may lead to a better lifestyle, such as proper dinner timing and enough leisure time. Thus, the effect of working at home on people’s body mass index (BMI) and productivity might differ depending on its frequency. The BMI measures whether a person’s weight is healthy by dividing the weight in kilograms by their height in meters squared. Workers’ BMI and productivity level are crucial indicators of their health and the financial situation. For instance, an increase in BMI can increase the risk of metabolic syndrome and cardiovascular diseases [10, 11]. Thus, this study aimed to investigate whether frequency of working at home was associated with the BMI and productivity of office workers. The hypothesis was that a higher frequency of working at home is associated with positive changes in BMI and productivity.
Materials and method
Design and participants
This cohort study investigated whether the frequency of working at home positively affected BMI and productivity. Participants were recruited during their annual health check-up from June to July in 2018 and 2020. In the 2018 annual health check-up, 618 individuals consented to participate in the study. The inclusion criterion was that the participants were full-time office workers. Of the 618 participants, 8 were excluded because they were not full-time workers and 141 because they were not office workers. Participants were further excluded if they 1) did not participate in the 2020 annual health check-up, 2) did not answer the 2020 self-reported questionnaire, and 3) had missing data in their health records. Of the participants who met the inclusion criteria, 154 did not participate in the 2020 annual health check-up, 40 did not answer the self-report questionnaire, and 49 had missing data (20 had missing 2018 data, and 29 had missing 2020 data). Thus, the final analysis was conducted with 226 participants. Figure 1 shows the flowchart of this process.
First, the participants in the 2018 annual health check-up were individually recruited to participate in this study, and the self-report questionnaire was given only to the participants who provided their consent. Second, the participants answered the self-reported questionnaire during the 2020 health check-up. Finally, the annual health check-up data were collected after participants answered the self-reported questionnaires.
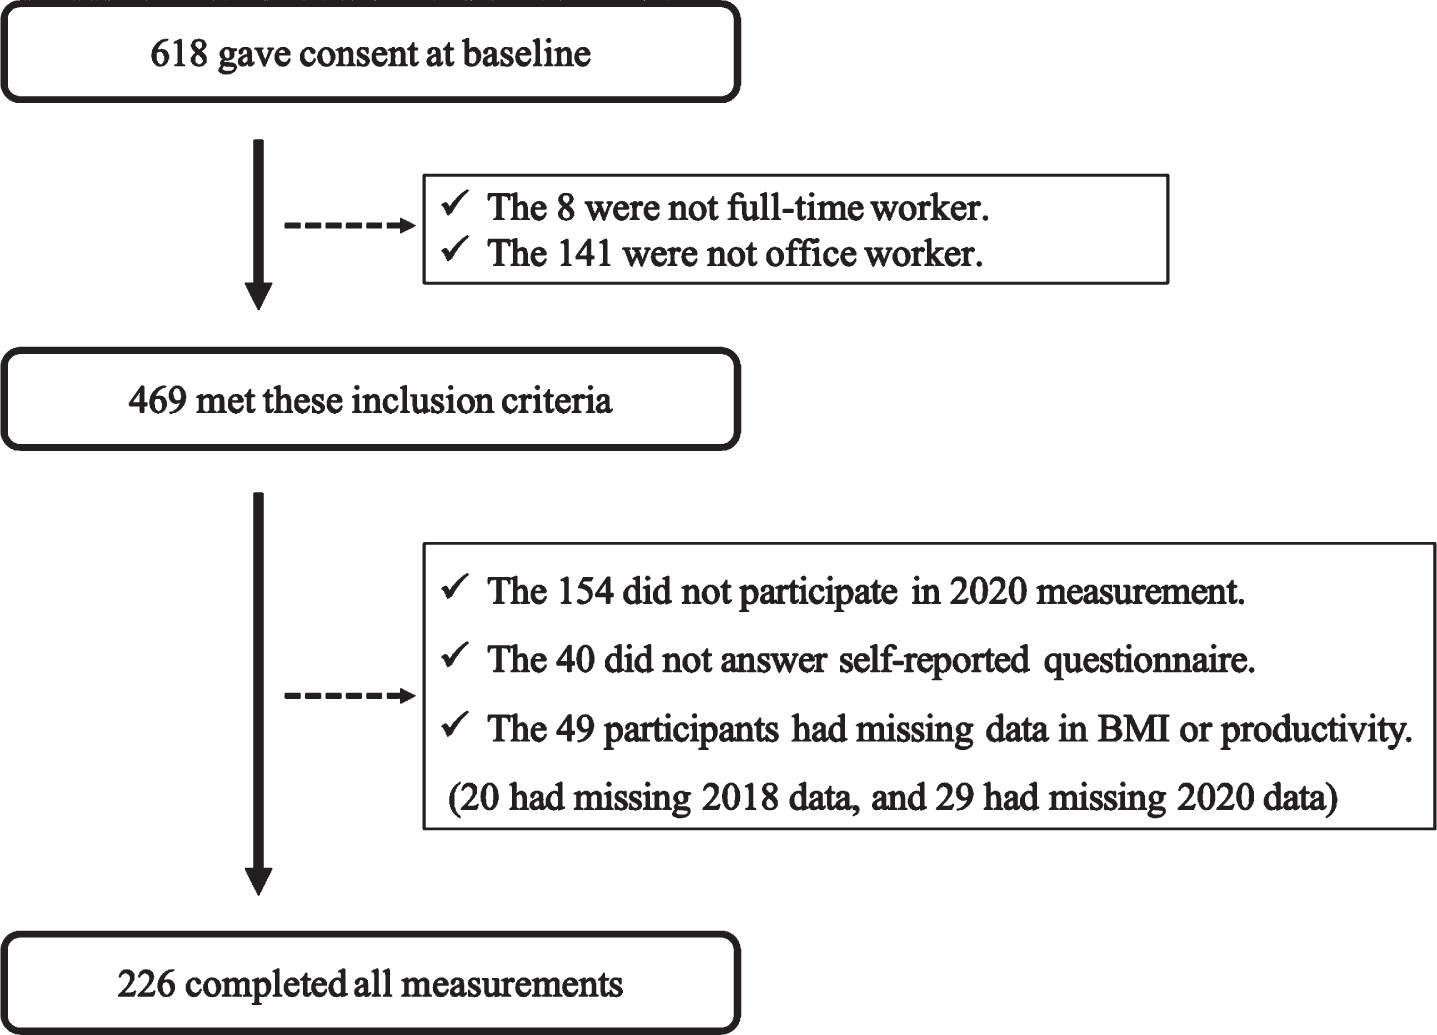
Flowchart showing process of recruiting participants.
This study was approved by the Ethics Committee of Kobe University, School of Medicine Faculty of Health Science, and conformed to the Declaration of Helsinki.
Frequency of working at home was self-reported. The data were collected during the 2020 annual health check-up. The question asked was, “On average, between April and May 2020, how many days did you work at home per week?” Based on their response, participants were classified into three groups according to the frequency of working at home: “no working at home” (the mean of frequency was 0.5 days or lower), “low frequency of working at home” (the mean of the frequency was more than 0.5 days but less than 2.5 days), and “high frequency of working at home” (the mean of the frequency was more than 2.5 days). In the companies, working at home was not introduced until March 2020, and none of the participants worked at home in 2018. Thirty-five participants were in the “no working at home” group, 132 in the “low frequency of working at home” group (henceforth referred to as the low frequency group), and 59 in the “high frequency of working at home” group (henceforth referred to as the high frequency group).
Outcome measurement
The BMI was calculated using height and weight data. Height and weight were objectively assessed using a height scale and weight scale. Productivity was measured using a numerical rating scale (NRS) which was used to rank working performance from 0 to 10 [12]. On this scale, 0 indicates “lowest imaginable productivity,” and 10 indicates “best imaginable productivity.” In this study, their productivity in the four weeks prior to answering the questionnaire was measured using the NRS. Changes in BMI and productivity were calculated by subtracting the 2018 data from the 2020 data.
Demographic data
We collected data regarding education, employment position, and number of preschool children through self-report questionnaires. Educational level was assessed using the number of years of education, and employment position was assessed based on whether the participant was a manager.
From the annual health check-up data, we extracted data regarding age, gender, exercise habits, and eating habits. Exercise habits were measured differently in the two facilities. Therefore, regardless of the measurement method, exercising at least twice per week was defined as “active,” while exercising once or not at all per week was defined as “non-active.” To collect data on eating habits, participants were asked, “Have you been eating regularly for the past month?” The answer “Yes” was labeled as “Good eating habits” and “No” as “Bad eating habits.”
Statistical analysis
In Table 1, for all three groups (no working at home, low frequency, and high frequency), categorical variables (gender, exercise habits, and eating habits) are described as numbers and percentages. Normally distributed continuous variables were described using means and standard deviations (SDs). Non-normally distributed continuous variables were described using medians and interquartile ranges.
The characteristics of participants according to the three groups (n = 226)
The characteristics of participants according to the three groups (n = 226)
†:Mean (Standard deviation); ‡:Median [Interquartile range].
Linear regression was used to determine whether the frequency of working at home was associated with BMI and productivity. The outcome variables were the changes in BMI and productivity. The explanatory variable was frequency of working at home, which divided the sample into three groups. The following variables were selected as confounding factors: age, gender, number of preschool children, education, exercise habits, eating habits, employment position, and baseline data. In addition to baseline outcome data (baseline BMI or productivity), the confounding factors were based on previous studies [5, 14]. Coefficients and 95% confidence intervals (95% CI) were calculated, and the statistical significance was set at P < 0.05. R-4.0.2 was used for all statistical analyses.
The BMI change was 0.55 kg/m2 (SD = 0.74 kg/m2) in the “no working at home” group, 0.48 kg/m2 (SD = 0.93 kg/m2) in the low frequency group, and 0.16 kg/m2 (SD = 1.01 kg/m2) in the high frequency group. These data are shown in Fig. 2. Productivity change was 0.35 (SD = 1.97) in the “no working at home” group, 0.46 (SD = 1.79) in the low frequency group, and 0.12 (SD = 1.97) in the high frequency group. These data are shown in Fig. 3.
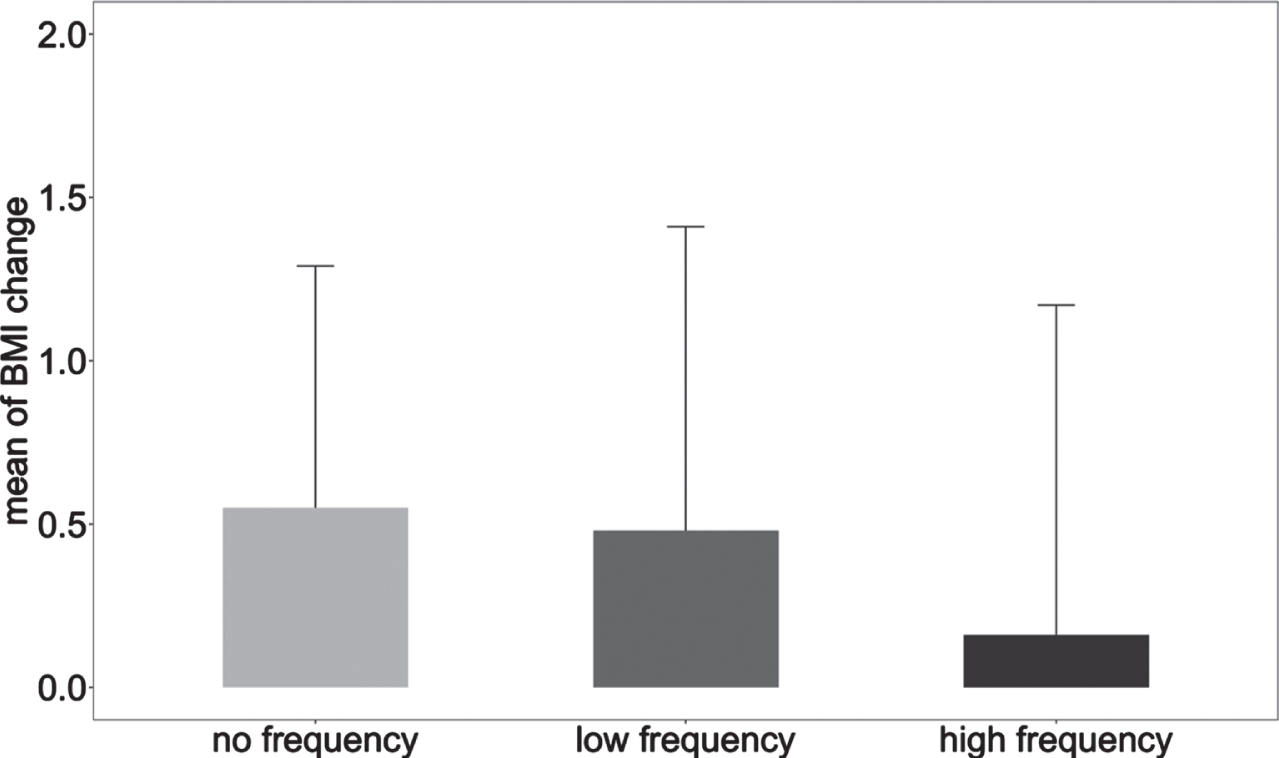
The mean and standardized deviation of BMI change in the three sample groups based on frequency of working at home.
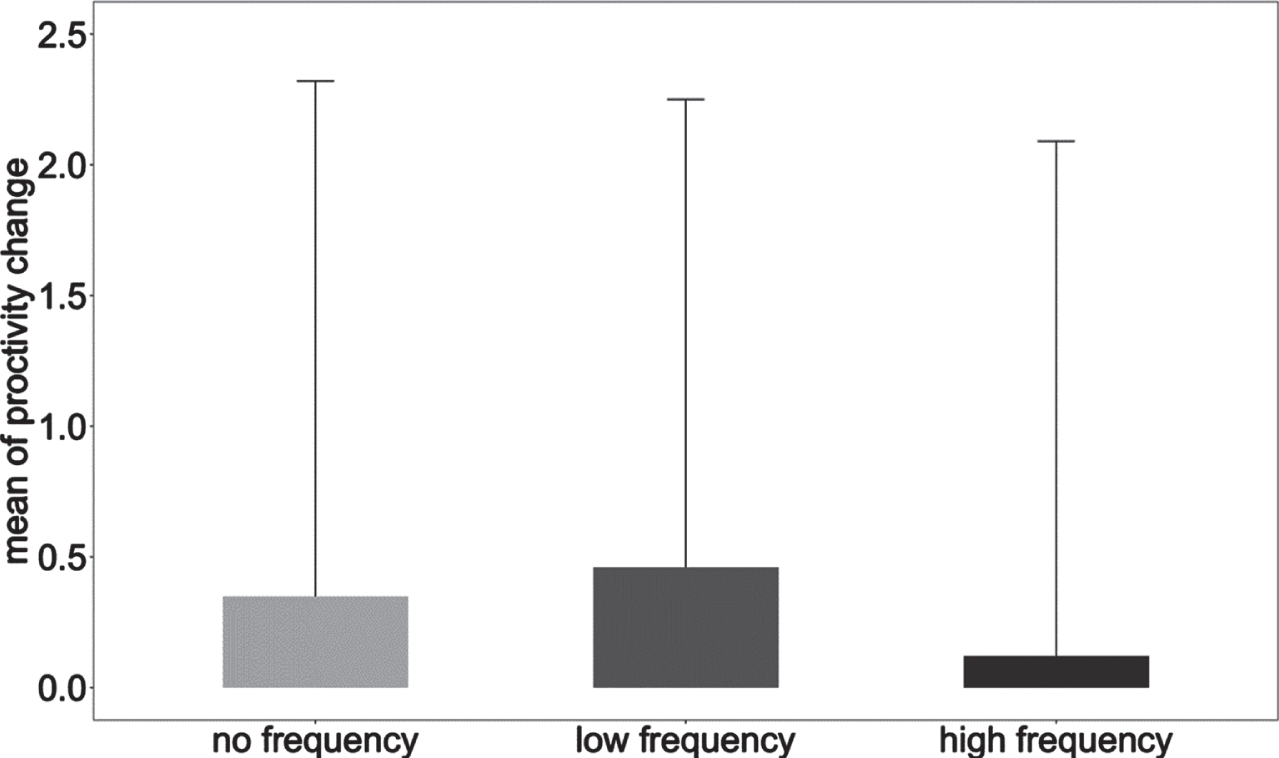
The mean and standardized deviation of productivity change in the three sample groups based on frequency of working at home.
Table 2 shows the results in BMI change. Single linear regression models found that the BMI change in the high frequency group was significantly smaller than in the “no working at home” group (coefficient: –0.27; 95% CI: –0.55 ––0.01). However, BMI change in the low frequency group did not significantly differ from the “no working at home” group (coefficient: –0.10; 95% CI: –0.30 –0.10). Multivariable linear regression models found that the BMI change in the high frequency group was also significantly smaller compared to the “no working at home” group (coefficient: –0.30; 95% CI: –0.60 ––0.01), while the BMI change in the low frequency group did not significantly differ from the “no working at home” group (coefficient: –0.06; 95% CI: –0.26–0.15).
The effect of frequency of working at home on BMI change
95% CI: 95% confidence intervals. In the adjusted model, confounding factors (age, sex, number of preschool children, education level, exercise habit, eating habit, manager or not, and baseline BMI) were adjusted.
Table 3 shows the results in productivity change. The single linear regression models showed that the productivity changes in the low frequency group (coefficient: 0.20; 95% CI: –0.21–0.64) and the high frequency group (coefficient: –0.34; 95% CI: –0.90–0.22) did not significantly differ from the “no working at home” group. Moreover, the multivariable linear regression models revealed that the productivity change in the “no working at home” group did not significantly differ from the low frequency group (coefficient: 0.16; 95% CI: –0.17–0.49) or the high frequency group (coefficient: –0.19; 95% CI: –0.68–0.29).
The effect of frequency of working at home on productivity change
95% CI: 95% confidence intervals. In the adjusted model, confounding factors (age, sex, number of preschool children, education level, exercise habit, eating habit, manager or not, and baseline productivity) were adjusted.
This study investigated whether the frequency of working at home was associated with BMI and productivity in 226 office workers. The results showed that BMI change in those who worked at home 2.5 days or more was significantly smaller than in those who did not work at home. Furthermore, working at home was not significantly associated with change in productivity.
This is the first study showing a significantly lower BMI increase in those with high frequency of working at home than those who did not work at home. This result can be explained through several studies. For example, a cohort study suggested that people who worked at home ate out less often than those who did not work at home [5], which may mean eating less junk food. Moreover, working at home has been shown to increase leisure time [4]. More leisure time may support the development of healthy behaviors, including higher frequency of physical activity or better nutrition and easy access to the right food amount [15, 16]. All of these factors were associated with preventing a BMI increase.
This is also the first study investigating the association between the frequency of working at home and productivity. The results showed that the frequency of working at home was not significantly associated with productivity. Our results differed from those of a prior systematic review suggesting that people who worked at home greatly improved their productivity compared to those who did not [17]. One possible reason for this discrepancy is that the effect of working at home on productivity may vary depending on the frequency. In other words, low frequency of working at home can improve productivity, whereas high frequency of working at home can decrease it. This could be because high frequency of working at home is linked to high work-family conflict [18], which has been associated with lower productivity [19]. Work-family conflict is defined as the imbalance between the demands of both work and family, which makes it impossible to fulfill both roles [20]. Notably, this study’s results showed that the low frequency group displayed higher productivity improvement than the “no working at home” group, whereas the high frequency group improved less than the “no working at home” group. However, data on work-family conflict have not been collected, so this conclusion was only speculation. Moreover, the correlation between working at home and productivity was not statistically significant. Therefore, further detail and larger sample research are required in the future.
The study has several limitations. First, although the outcome data collection was conducted in 2018 and 2020, the data of working at home from 2020, and not 2018, was used as the explanatory variable. Therefore, although the time of measuring the explanatory variable was close to the follow-up outcome measurement, there was still a time gap between the baseline outcome and explanatory variable measurement. This suggests that other factors could have influenced BMI and productivity between 2018 and 2020. Nonetheless, in the 73 workers whose BMI and productivity outcomes were measured in 2019, the association between the frequency of working at home and the difference between the 2018-2019 and 2019-2020 changes was also analyzed, and the same trend was found (data not shown). This indicates that our results could still be robust. Second, follow-up data were collected in 2020 during the COVID-19 pandemic. Owing to the pandemic, the lives of workers were affected dramatically, especially by the stay-at-home order. Thus, our findings should be generalized with caution, as we may have obtained different results in the absence of the pandemic. Third, we were not able to measure in detail whether the increased frequency of working at home had changed the participants’ lifestyle behavior. In other words, the association between the frequency of working at home and BMI, as described in the discussion, was speculative and not supported by the data. In the future, these mechanisms need to be investigated in more detail. Fourth, frequency was self-reported. Thus, the data collected may be biased; however, given that working hours from home were usually monitored by their managers or colleagues, the self-report bias may be small. Future studies should measure this factor more objectively.
Conclusion
This study investigated whether the frequency of working at home positively affected BMI and productivity. It found that BMI change in those with high frequency of working at home frequency was significantly smaller than in those who did not work at home. Furthermore, productivity was not significantly affected by the frequency of working at home. This study suggests that working at home more frequently may help prevent BMI from increasing significantly. This result may be caused by changes to the workers’ lifestyle, including better eating habits and more breaks and exercise. However, more detailed studies are needed in the future.
Footnotes
Acknowledgments
The authors thank the participants in this study. The authors also deeply thank the reviewers and editors for their valuable comments and advice.
Funding
None to report.
Conflict of interest
None to report.