



Abstract
BACKGROUND:
Developing reliable tools to tap into all the behavioral dimensions of individual job performance and identifying the right sub-dimensions is necessary for both research and practice.
OBJECTIVE:
This study aimed at developing and validating an IJPQ that addresses shortcomings of existing questionnaires.
METHODS:
After a comprehensive systematic literature review, a framework consisting of four dimensions, including task performance (TP), contextual performance (CP), counterproductive work behavior (CWB), and adaptive performance (AP) was structured for measuring IJP. As well, 45 sub-dimensions were identified for measuring IJP’s dimensions. Content and face validity were evaluated, and item impact score (IS), content validity index (CVI), Kappa, and content validity ratio (CVR) were calculated. For reliability and confirmatory factor analysis (CFA), 525 workers completed the validated questionnaire and Cronbach alpha and goodness of fit indexes were determined, respectively.
RESULTS:
Of the 62 items generated to measure dimensions, 53 were approved. Based on item-level CVI, of the 53 items, only 45 items were accepted. Finally, the results of item level CVR led to the extraction of 27 questions to evaluate IJP. The obtained scale level CVI and scale level CVR were 0.91 and 0.68, respectively. Based on the results obtained from 525 Iranian workers, values of Cronbach’s Alpha, X2/df, RMSEA, and P-value were in the acceptable range.
CONCLUSIONS:
Conclusively, a questionnaire containing 20 items was developed and validated for measuring IJP of Iranian worker’s culture. The four dimensions of TP, CO, CWB, and AP consisted of 6, 5, 5, and 4 items each, respectively. Overall, IJPQ is a theory-based, reliable, and valid instrument for assessing job performance.
Keywords
Introduction
Organizational performance relies on a set of factors relating to the organization (such as organizational structure, organizational policy and working environment) [1, 2] and individual employees (such as cognitive abilities and personality traits [3, 4]. Accordingly, any organization needs people with increased job performance, to achieve goals, and to enhance productivity [5]. Viswesvaran and Ones defined job performance as “the total expected value to the organization of the discrete behavioral episodes that an individual carries out over a standard period of time” [6]. Based on this definition, job performance as a multidimensional concept has focused only on the behavior related to the organization’s goal rather than outcomes [7].
Measuring performance due to its help in performance feedback, worker improvement, decision making, selecting appropriate employees, the need for personnel teaching, making occupational interventions and etc. is most valuable [8, 9]. The concept of job performance such as behavioral, dynamic, multidimensional, evaluative, and episodic arises the need for comprehensive tools for measuring job performance [10–12]. There are different appraisal methods for measuring individual job performance in a different field but these methods are somewhat job-specific or evaluate JP from different aspects such as behavioral aspect and outcome aspect [13–16]. Luo et al, constructed a framework qualitative and quantitative methods to evaluate soldiers’ performance. They found that job performance among soldiers can be evaluated through the task and contextual performance [17]. Olsen et al. also concluded that the job performance of nurses and physicians can be evaluated by dimensions such as local leadership quality, employee perceptions of hospital management quality and satisfactions of three psychological demands such as social support, competence development and autonomy [18]. Although job-specific questionnaires can assess the performance of individuals in that job, but the results cannot be compared with other jobs due to discrepancies in their conceptual frameworks. Also, it is observed that individual’s performance is measured based on objective dimensions [19, 20]. Due to great heterogeneity in the work processes, produced outcomes, work conditions, and applied technologies, comparison of individual’s job performance with each other are not logical and fair. This is the main reason for developing different tools for measuring job performance while they have focused on the behavioral aspect.
Individual job performance (IJP) is constructed from multiple dimensions and the dimensions are constructed from directly measurable indicators (sub-dimensions). Although the dimensions may be extensible to different occupations while indicators can change across jobs [21]. Many researchers attempt to identify optimum dimensions and indicators for measuring IJP, but so far, there is no overall consensus on which dimensions and indicators should be prioritized [22]. Campbell suggested eight dimensions for measuring individual job performance including: “job-specific task proficiency, facilitating peer, and team performance, maintaining personal discipline, non-job-specific task proficiency, management and administration, demonstrating effort, supervision, and written and oral communication” [21]. Philippaers et al. used task behavior, helping behavior and creative behavior as dimensions of IJP [23]. In 2014, Moreover, Fluegge et al determined task performance, organizational citizenship behavior, and creative performance as dimensions of job performance [24]. Koopmans et al reviewed existing models of individual work performance and categorized all dimensions in three categories including: task performance, contextual performance, and counterproductive work behavior [25]. Guan and Frenkel also considered task performance and organizational citizenship behavior for assessment of IJP [26].
Most the of developed instruments for measuring IJP have restrictions that may limit their effectiveness for different occupations and cannot be used generally for a wide range of jobs and are almost job-specific [27]. On the other hand, none of these instruments do fully address all dimensions of IJP. In addition, some of the existing methods have focused on objective measurement of job performance and have neglected other behavioral aspects of performance. In addition to these, it is stated that language, cultural traditions and beliefs, economic and political structures, and technologies may affect the effectiveness of the developed methods or tools [28]. Given the above-mentioned shortcomings and tips, developing a questionnaire to address all dimensions of a generic IJP and identifying the right indicators for the desired dimensions for Iranian worker’s culture is necessary. As stated above, the framework consist of four dimensions including task performance, contextual performance, adaptive performance, and counterproductive work behavior is very considerable due to its comprehensiveness. For this reason, in this study, this generic model is used as a basis for developing the questionnaire because the dimensions introduced in this model can cover all sub-dimensions, although, the method of selection of sub-dimensions by the researcher is substantially important. Therefore, this study aimed at developing and validating of an individual job performance questionnaire (IJPQ).
Methods
This study is part of a Ph.D. thesis aiming to develop an instrument for appraising individual job performance of workers occupied in an automobile production company. To achieve this goal, based on literature review, a generic model for evaluating IJP was constructed and indicators (sub-dimensions) were identified for each dimension. Then, the items were designed for each dimension and initial IQ was developed. To evaluate the validity and reliability of the constructed questionnaire, face validity, content validity, structural validity and reliability by Cronbach’s Alpha and test-reset method were performed. Details of the development and validation phases of the questionnaire are listed below:
Procedure for survey development
In this phase, a systematic literature review was conducted to construct a generic framework, and identifying and weighting the best dimensions and indicators (sub-dimensions) for measuring IJPQ [29, 30]. Viswesvaran and Ones defined job performance as “the total expected value to the organization of the discrete behavioral episodes that an individual carries out over a standard period of time” [6]. This definition is more applicable in the field of occupational health, industrial, and organizational psychology and industrial management [7]. Fuzzy Delphi method [31] and Fuzzy Analytic Hierarchy Process [32] was applied to selecting and weighting dimensions and indicators based on expert’s opinions [30]. To this, an expert panel consist of 74 experienced experts from different field of study, including Occupational Health, Ergonomics, Industrial and organizational psychology, Industrial management and Human resources was established. The results of these methods indicated that task performance (defined as “behaviors that directly or indirectly contribute to the organization’s technical core”) [8], contextual performance (“behaviors that support the organizational, social and psychological environment in which the technical core must function“) [33], counterproductive work behavior (“behavior that harms the wellbeing of the organization“) [34], and adaptive performance (“is defined as the extent to which an individual adapts to changes in a working system or work roles”) [35] can completely assess IJP [30]. Based on experts’ opinions analyzed by fuzzy Delphi method, 45 indicators were selected for measuring IJP. Of these, 12 indicators dedicated to task performance. As well, 11, 12, and 10 belonged to contextual performance, counterproductive work behaviors, and adaptive performance, respectively [30].
Generation of the items and choice of the response format and scoring method
In this step, the questionnaire items pool was created for all selected indicators. To generating items pool, each indicator was reviewed systematically in scientific databases and the appropriate questions were designed for each indicator. Then, based on opinion of the expert panel and sample of the target population, the items were selected for each indicator. For the indicators that their items were not found in the literature review, the questions were generated by the consensus of experts’ opinions. Finally, sixty-two items were generated that 16 items belonged to task performance, 20 items belonged to counterproductive work behaviors and, 13 items belonged to contextual performance and adaptive performance, separately. Questions were end-closed format and scored based on 5-points Likert scale from low (1) to very much (5) or never (1) to always (5). This scale was applied to enhance response quality and response rate and also decrease the frustration level of respondents [36].
Evaluation of face validity
Face validity is the extent to which a questionnaire is subjectively considered as addressing the concept it tends to measure [37, 38]. Face validity as a qualitative content validity approach refers to the clarity and relevance of a questionnaire to the participants. For face validity, 12 experts experienced experts from different field of study, including Occupational Health, Ergonomics, Industrial and organizational psychology, Industrial management and Human resources and 5 industrial workers were asked to review the items and by referring to the following questions, give their feedback about the transparency of items [37]: “What do you think this section is testing? Are you unfamiliar with any of the terms used in this question? Do you find this question confusing?”.
The top and experienced experts in the related fields were emailed to participate in the face validity of the questionnaire. The questionnaire and a guideline related to how to evaluate the questionnaire were attached to the emails and they were given two weeks to answer the questionnaires according to the guideline. To receive feedback from industrial workers, they were contacted in person and their opinions were collected.
After analyzing the comments and suggestions, essential revision of words and terminology of items were conducted and the questionnaire was re-sent to the respondent to confirm transparency of items.
Item impact score as a quantitative method for face validity was assessed by determining the impact of items [39]. To this, all 17 respondents were requested to assess the questions in terms of importance on a five-point Likert scale from 1 (not important) to 5 (very important). Impact scores (IS) of the items were calculated by:
Where, Frequency is the percent of respondents who give each item scores equal to 4 or 5 and, Importance is mean of importance score for each item. Items with an impact score higher than 1.5 remained and items that had a score of less than 1.5 were removed [40].
Evaluation of content validity and Kappa statistic coefficient
Content validity as a quantitative approach is the ability of an instrument to sufficiently address all aspects of the concept that is under measurement [41]. To conducting content validity, an expert panel including 12 experts from different fields of study including occupational health, ergonomic, industrial psychology, and industrial management, and also 5 individuals from a population study was established. Then the content validity of the amended questionnaire was assessed by computing the content validity index (CVI) and content validity ratio (CVR) base on respondents’ opinions [42].
CVI was calculated for items and overall questionnaire. To this, the respondents were asked to score the simplicity, relevance, and clarity of each items using a 4-point Likert scale from 1 (not simple, not relevant, and not clear) to 4 (very simple, very relevant, and very clear) [43, 44]. To obtain the item-level CVI (I-CVI), the proportion of respondents who assigned the values 3 and 4 for simplicity, relevance, and clarity to the total number of respondents was calculated. Scale-level CVI (S-CVI/Ave) was obtained by calculating the average of all values of I-CVIs. The minimum acceptable value for the I-CVI and S-CVI/Ave is 0.79 and 0.90, respectively [42].
Although the CVI is widely used, it cannot capture inflated values originated from the possibility of chance agreement. For this reason, the calculation of the Kappa coefficient gives a better comprehension of CVI as it eliminates any random chance agreement. Kappa statistic is a consensus index of interrater agreement [42]. Kappa coefficient alongside CVI ensures that the experts’ agreement was not based on chance.
To calculate Kappa, at the first, probability of chance agreement (PC) needs to be calculated by the following formula:
Kappa values higher than 0.74 are considered excellent and between 0.6 and 0.74 as good [45].
The CVR was computed for each item based on the Lawsche method [46]. To this, the abovementioned panel’s members were requested to study and rate the appropriateness of each item through a 3-point Likert scale. In this method, they awarded 1 point for “essential”, 2 points for “useful but not essential” and 1 point for “not necessary” option. In this method, the CVRs must be greater than the minimum value of 0.49, and questions that have CVR less than this must be removed [46]. The formulation of content validity ratio is as follows:
Where Ne is the number of experts those who selected “essential” and N is the total number of experts. The value of con CVR is specified by Lawshe and is equal and more than 0.49 for 15 experts. This means that items with CVR less than 0.49 should be removed [46]. To calculate I-CVI, I-CVR, S-CVI, S-CVR and IS, Microsoft Excel version 2016 was used.
Reliability
Internal reliability using Cronbach’s Alpha
After the above-mentioned steps, the modified questionnaire was spread among a sample of the target population. 525 industrial Blue-collar workers and white-collar workers from different departments of an automobile factory participated and completed the questionnaire. The inclusion criteria for participating in the study was having at least 1 year of experience at working in a specific job. These workers had different levels of education, from less than a diploma to a higher bachelor. Questionnaires were handed out to workers during the break between work and they were asked to read and answer the questions carefully. To evaluate the internal reliability, Cronbach’s Alpha was evaluated for the overall scale and its dimensions. The minimum acceptable coefficient for Cronbach’s Alpha was set at 0.7 [47]. Values of Cronbach’s Alpha and Pearson correlation was calculated using SPSS version 20.
Test-retest reliability
In order to check the reliability of the questionnaire test-retest reliability was assessed. Test-retest as a reliability test assesses the stability under repeated tests. To this, 30 individuals were asked to complete the questionnaire carefully (T1). After two weeks (T2) they were asked to fill out the questionnaire again [48]. The workers were from different parts of the factory such as office and security department, parts pressing operations department, assembly department, painting and polishing department and welding department. The mean±SD of age and experience was 41.6±6.4 and 17.1±6.5 years, respectively. In order to test the reliability of the questionnaire in this way, the correlation of dimensions in the T1 with T2 was checked by the Pearson correlation test.
Construct validity
After removing unreliable items based on Cronbach’s Alpha value, the construct validity of the questionnaire was evaluated using confirmatory factor analysis (CFA). The purpose of CFA is to check whether the gathered data is fitted an assumed measurement model and for this, the maximum likelihood method as the most popular method applied to estimate parameters in CFA models was used [49]. In the CFA, the fitness of the hypothesized model with real data is tested and the factor loading of each latent variable is determined. Several fit indexes including Goodness-of-fit index (GFI), Adjusted goodness-of-fit index (AGFI), Normed fit index (NFI), Comparative fit index (CFI), Incremental fit index (IFI), Root mean squared error of approximation (RMSEA) and Chi-square (X2/df) were selected to check the fitness of the model. It has been suggested that RMSEA values less than 0.05, values between 0.05 and 0.08, values between 0.08 and 0.1, and values greater than 0.1 are good, acceptable, marginal, and poor, respectively [50]. It has been suggested GFI, AGFI, NFI, CFI, and IFI should be over 0.9 for a good fit. For normed chi-square, values less than 3 is considered acceptable [51]. Amos version 24 was applied to performing construct validity (confirmatory factor analysis).
Results
Individual job performance was constructed of four components including task performance, contextual performance, counterproductive work behaviors, and adaptive performance. Based on results of fuzzy Delphi, 45 indicators were selected and 62 items were designed for these indicators.
Based on experts and worker’s comments in the face validity phase, a number of items merged due to similar content and out of the initial 62 items, only 53 items were extracted. In addition, some minor corrections were conducted.
After conducting face validity, the content validity of the revised questionnaire was evaluated by the experts ‘panel. Based on I-CVI, of the 53 items, only 45 items were accepted and 8 items were removed. Also, the S-CVI of this questionnaire was 0.91. I-CVIs and Kappa coefficients and impact score of final accepted items are presented in Table 1.
The results of face and content validity for accepted items (N = 17)
The results of face and content validity for accepted items (N = 17)
IS: Impact score. I-CVI: Item level content validity index. K: Kappa scores. I-CVR: Item level content validity ratio.
Finally, the results of I-CVR led to the extraction of 27 questions to evaluate IJP. The obtained S-CVI and S-CVR were 0.91 and 0.68, respectively. These items are presented in Table 1 along with, I-CVR, I-CVI, Kappa scores (K), and impact score (IS).
To assess internal reliability of items, dimensions, and the overall scale using Cronbach’s Alpha (α), the workers from different sections of the factory participated in this study. The results of this test showed that seven items due to having corrected item-total correlation (CIT) less than 0.3 were removed from the questionnaire. The results showed that the questionnaire was highly reliable (Cronbach’s Alpha = 0.90). More detailed results are presented in Table 2.
Results of reliability of the questionnaire (N = 525)
In this study, the items were generated for latent factors that cannot be measured directly. After determining the validity and reliability of the questionnaire, 20 questions were chosen to assess four latent factors of IJP including task performance (TP), contextual performance (CP), counterproductive work behavior (CWB), and adaptive performance (AP). Questions 1, 3, 4, 9, 14, and 16 were related to TP. Questions 2, 7, 10, 13, and 17 belonged to CP. Questions 5, 8, 11, 18, and 19 were related to CWB. Questions 6, 12, 15, and 20 were related to AP. The reliability of these factors was tested and the results showed that Cronbach’s Alpha of TP, CP, CWB, and AP was 0.86, 0.83, 0.92, and 0.84, respectively. Items are scored based on 5-points Likert scale from low (1) to very much (5) or never (1) to always (5). To determine the overall IJP score, the scores of all items are added together, while the scores of items 5, 8, 11, 18, and 19, which are related to the CWB dimension, must be reversed. Therefore, The IJP score range from 0 to 100 and the higher the score, the higher the job performance. Test-retest results showed high repeatability and reliability. Based on the results of the Pearson correlation test, the correlations of dimensions with each other’s was highly significant. Based on the results, Pearson correlation values between scores of IJP, TP, CP, CWB, and AP in T1 with scores of IJP, TP, CP, CWB, and AP in T2 were 0.98, 97, 0.98, 0.96 and 0.94, respectively.
To check the fitness of the hypothesized model with real data and determination of the factor loading of each latent variable CFA was conducted. The above-mentioned dimensions and their items were entered in the CFA model presented in Fig. 1.
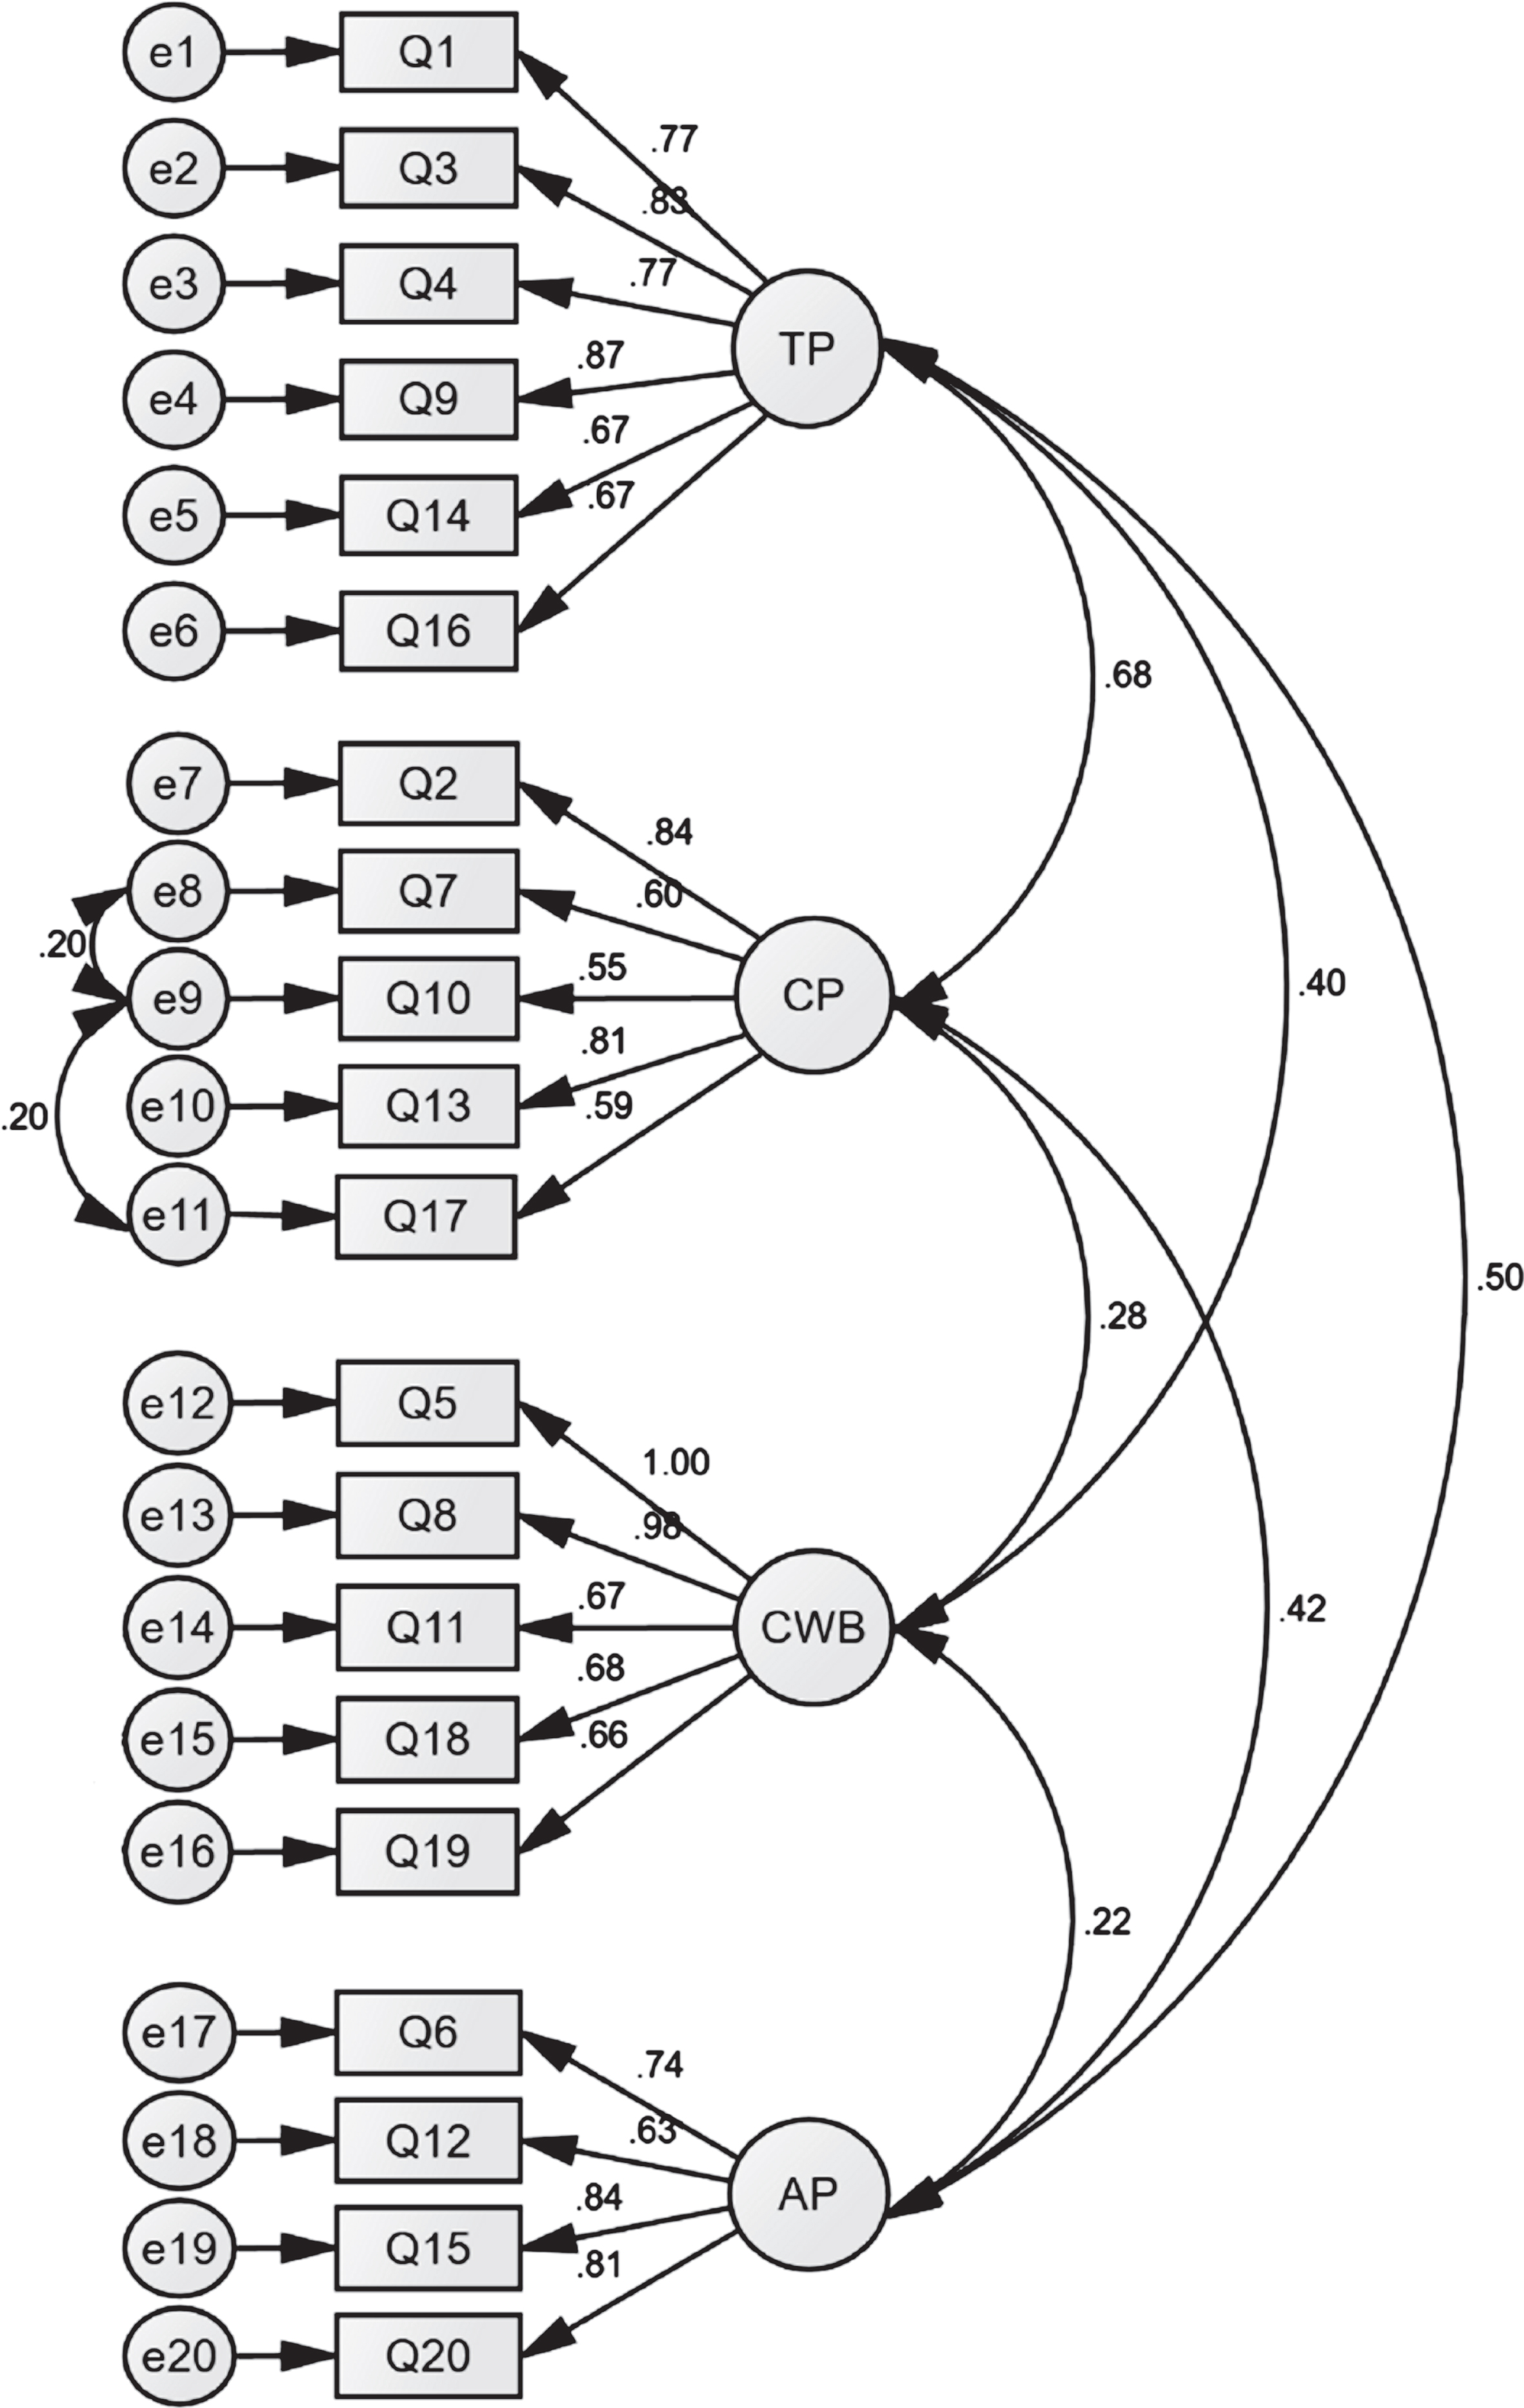
Confirmatory factor analysis model for IJPQ (N = 525). Explanation: Task performance (TP), contextual performance (CP), counterproductive work behavior (CWB), adaptive performance (AP), questions (Q), error (e), rectangular boxes indicate observable variables, circular boxes represent latent variables, the unidirectional arrows indicate the factor loadings, and double headed curved arrow indicate correlation between latent variables.
In Fig. 1, the factor loading of each dimension on items is presented. As well as, interactions of dimensions with each other is shown. The factor loading indicated on arrow refers to the correlation of Item with factor. According to Fig. 1, all variables show a high correlation with their respective structures. Based on the results, the highest and lowest factor loading is related to the load of Q5 on CWB and Q10 on CP, respectively.
Based on the goodness-of-fit indexes, the model was confirmed. The results are presented in Table 3.
Goodness-of-fit of the theoretical model (N = 525)
The results of Table 3 showed that the hypothesized model was matched with real data gathered from an industrial population (P-value = 0.076). It was hypothesized that there is a significant difference between the suggested model and the real data. Since the value of P-value is greater than 0.05, it can be concluded that there is no differences between hypothesized model and real data (P-value = 0.076).
Based on these results values of X2/df, RMSEA and GFI were 2.963, 0.063, and 0.912, respectively, and were in the acceptable range. Given that the values of these indexes and other indexes listed in the Table 3 were within acceptable limits, it can be acknowledged that the drawn model is statistically valid.
This study aimed at developing and validating an individual job performance questionnaire. The results showed that IJPQ is a valid and reliable scale to evaluate individual job performance. The validity and reliability of the IJPQ are checked and confirmed. Based on impact scores reported for items, it can be concluded that the face validity of IJPQ is acceptable. As well as, CVI and CVR indicated that IHPQ has an ability to sufficiently cover all aspects of individual job performance and Kappa values confirmed that experts’ agreement on items and dimensions is not based on chance. The reliability of valid items was checked by Cronbach’s Alpha method. Based on the results of this method presented in Table 2, final questions for the evaluation of individual job performance were screened.
This generic questionnaire due to its structure is applicable for a wide range of industrial jobs. Based on the results of CFA, this questionnaire has four dimensions including task performance, conceptual performance, counterproductive work behavior, and adaptive performance. Goodness-of-fit indicators presented in Table 3, showed that the assumed model was fitted with real data. Therefore, task performance can be measured by indicators including quality of work (Q1), planning and organizing (Q3), Self-efficacy (Q4), job knowledge (Q9), recognizing and solving problems (Q14) and adherence to the work rules (Q16). Reviewing the literature shows that obtained results are consistent with other researchers [52, 53]. That is, the framework and indicators are well selected. The six indicators selected for evaluation of TP are acknowledged by other studies [22, 54]. Indicators including cooperating with and helping others (Q2), doing extra tasks (Q7), oral and written communication (Q10), Basic Skill (Q13), and perseverance and motivation (Q17) were used to measuring contextual performance. Campbell has introduced some of these indicators as dimensions of contextual performance [21]. As well as, organizational citizenship behavior (OCB) introduced by Viswesvaran is another close concept for CP that is evaluated by selected indicators in this study [53–55]. Williams et al. stated that organizational citizenship behavior points out two classes of behaviors including, behaviors that benefit the organization and behaviors that benefit the specific individual [56]. These two aspects of OCB are measured by indicators of CP including, cooperating with and helping others and doing extra tasks, and also Basic skills and perseverance and motivation, respectively. Based on the results of this study, counterproductive work behavior as third dimensions of individual job performance can be assessed by presenteeism (Q5), destructive behaviors (Q8), absenteeism (Q11), fighting, or arguing with coworkers (Q18), and unsafe behaviors(Q19). It is well documented by Murphy [57], Escorpizo [58], and Hunt [59] that these indicators can indicate counterproductive work behavior. The following indicators also can evaluate the adaptive performance: being flexible and resilient (Q6), innovative ideas to solve problems (Q12), acting appropriately (Q15), and learning new skills and technologies (Q20). Pradhan et al. introduced adaptive performance as a key dimension for measuring IJP [8].
In addition to selecting the best indicators based on expert’s opinions using fuzzy Delphi method, results of validity and reliability and CFA analysis showed that designed questions can evaluate indicators well and in turn dimensions. In other words, it can be claimed that the present framework can measure IJP very well in industrial workers. Koopmans et al. introduced a generic model for measuring work performance that was consist of TP, CP, CWB, and AP [53]. They developed and validated a questionnaire based on their model and the results showed that AP considered as a part of the CP [25]. In the present study, AP was considered as a separate dimension. This is due to this fact that in developing countries like Iran, advances in technology and science-based improvement in industries and in turn, rapid changing of working conditions which is a key factor in adaptive performance, are very common. Rapid changing of working conditions can trigger greater job security and strain in workforces and in turn, may affect individual’s adaptive performance [60, 61]. On the other words, in developing countries, workers are expected to be able to adapt to technologies related to their job and rapid change of workstations [62]. Therefore, pay attention to the assessment of adaptive performance as the main dimension of IJP is very important. On the other hand, in the study by Pardhan et al., counterproductive work behavior was not specified as a dimension of IJP [8]. Although other dimensions are well structured, they ignore behaviors that can harm the organization for assessment of IJP can be an optimistic approach. This means that individual’s performance was evaluated only based on their positive behavior and other negative behaviors are not considered, therefore, it can overestimate individual performance.
In this study, indicators were selected by multi-disciplinary decision-making methods such as fuzzy Delphi technique. Given that, this method is based on the opinion of experts and mathematical calculations. It can remove the ambiguity and uncertainty of decisions by experts opinion and can be considered as one of the strengths of the article. On the other hand, according to the dimensions and their indicators, it can be claimed that this questionnaire can effectively measure the behavioral aspects of an individual’s performance in various occupations. Given that, this self-reporting questionnaire is developed and validated among Blue-collar workers and white-collar workers, so it can evaluate measure performance among these workers, subjectively. Due to the fact that the framework and dimensions of the questionnaire have been extracted from scientific papers and they are validated on real data, the application of the validated questionnaire is not limited only to the research field but also it can be used as a valid measure for evaluating personnel performance in the industries. However, using this questionnaire as a complementary tool along with the objective results of job performance evaluation can be more trusted.
Using the results of this questionnaire, the managers and supervisors can rank workers according to their average individual job performance. In addition, it may serve as a base for developing the reward and punishment system and guidelines for the workers’ rank promotion. Based on the individual rank and mean score achieved for each dimension, behavioral intervention courses can be established for improving individual job performance. Moreover, this instrument may be useful as an initial prognostic tool for some disorders such as communication disorders and other behavioral disorders.
As one of the limitations in this study, all participants were male. Therefore, it is recommended that this instrument should be used for females with precaution. Given that the study was conducted during the Covid-19, it may be possible that some items of the questionnaire such as communication and cooperation with others have been undergoing the effect of social distancing and quarantine. The criterion validity, responsiveness and sensitivity to change were not examined in this study. Thus, it is recommended that criterion validity, responsiveness and sensitivity of IJPQ be considered in future studies. In this study, only healthy workers were included and the effect of workers’ health status on job performance is not clear. As well as, application of this study for pink-collar workers requires further research and consideration.
Conclusion
In the present study, a questionnaire for the assessment of IJP was designed based on a validated framework. Based on the obtained results, a questionnaire consists of 20 questions was developed and validated. According to the content and features of this scale, it can be used to evaluate the individual’s job performance in various occupations. Although the steps of determining the validity and reliability of this questionnaire have been done, it is recommended to be careful in using it in different jobs, and if possible, its validity and reliability should be determined for non-industrial jobs. This questionnaire has been developed and validated according to the cultural and developmental conditions in Iran and it is recommended that its validity be re-evaluated for use in other countries.
Funding
This study is extracted from a Ph.D. thesis approved and supported in part by the Tehran University of Medical Sciences.
Conflict of interest
The authors have no conflict of interests to report related to this article.
Data availability statement
The data that support the findings of this study are available from the authors upon reasonable request.
Ethical approval
The ethics code of this study is IR.TUMS.SPH.REC.1398.304.
Footnotes
Acknowledgments
The authors appreciate all experts and workers who participated in this study.
Consent to participate
Voluntary subjects participated in this study.