
Abstract
BACKGROUND:
Since most global organizations adopted teleworking since the COVID-19 pandemic, measuring teleworking-related concepts and its implications have become vital.
OBJECTIVE:
The aim of the study consisted in the validation and the examination of the psychometric properties of the E-Work Life Scale (EWLS) which measures the relevant teleworking-related aspects: work-life interference, productivity, organizational trust, and flexibility.
METHODS:
To this aim, a group of teleworkers (N = 357; Mage = 38.90) completed the set of scales on which the study was based. The construct validity of the scale was examined by means of the confirmatory factor analysis (CFA) and the internal consistency by using Cronbach’s α, McDonald’s ω, and composite reliability (CR). Associations between the EWLS and the measures of life satisfaction, positive and negative affect and subjective well-being were also considered. A structural equation model is conducted to analyze the relationship between EWLS factors and life satisfaction.
RESULTS:
The findings obtained through CFA support the construct validity of the EWLS that is identical with the original version of the scale, which contains the four factors (χ2/df = 2.61; CFI = 0.93; RMSEA = 0.069; SRMR = 0.067). The internal consistency is good for the four factors, as well as for the total score of the scale (αs > 0.69; ωs > 0.75; CRs > 0.78). Work-life interference is the factor that is most associated with subjective well-being. The dimensions of the EWLS determine the life satisfaction.
CONCLUSIONS:
The results lead us to believe that EWLS is a promising instrument for the assessment of the factors involved in teleworking.
Introduction
Due to the COVID-19 pandemic, teleworking – remote work based on information and communication technologies – became more important than ever. According to a report of the International Labour Organization, one of the responses to this situation was the huge rise in the number of people who work from home [1]. In Romania, the number of teleworkers increased to 24% in 2020, that is 14% more in comparison with 2019 [2]. The employers had to face many challenges related to teleworking (or telecommuting, e-work, or mobile-work), such as maintaining good communication between managers and employees [3, 4], avoiding the employees’ feeling of isolation [5, 6], investigating the mental health of teleworkers [7], and keeping a balance between one’s personal and professional life [8]. Consequently, organizations had to adapt and they adopted measures for the implementation of teleworking as a security practice to counteract the crisis generated by COVID-19 [9]. At the same time, there was also a significant increase in the amount of evidence-based literature on teleworking. A simple research in Clarivate database shows that between 2020 and 2021, a series of studies on teleworking (more than 290 articles), e-work (210), telecommuting (146), and flexible work engagement (164) were published. However, there is little research on instruments that assess the effects of teleworking, and this research has its limitations [10]. The measurement of the concepts of teleworking, telecommuting, e-work and of the teleworking-related aspects are more relevant than ever. As far as we know, there are no Romanian studies on the development and/or the validation of instruments specific to teleworking. In this context, the aim of our study was to validate the E-Work Life Scale which assesses the employees’ experiences regarding their teleworking activity. The practical implications of the study are obvious, given that researchers, managers, and organizations can assess the employees who work online and have the possibility of intervening in order to render the latter’s online remote work more efficient.
E-Work Life Scale (EWLS)
The E-Work Life Scale (EWLS) is a recently developed and validated instrument in the English work environment, whose aim is to assess the relevant aspects related to remote work: work productivity, the relationship with the organization, work-life balance, and the teleworkers’ well-being [11]. The studies on the development and the validation of EWLS conceptualize remote e-work as an umbrella term for everything that means working away from the traditional office and it is based on information and communication technologies in order to access work [12]. The scale originates in the qualitative study carried out by Grant et al. [12] on 11 employees who spent one to two years in teleworking using semi-structured interviews with the purpose of identifying the topics that are relevant in teleworking. The initial version of the scale consisted of 104 items. After a panel of experts verified face and content validity, the scale underwent several consecutive item reductions, and it reached 28 items, out of which 17 were retained after a preliminary analysis. The next stage consisted in the administration scale on two independent samples of English subjects: 250 employees working in the economic sector and 219 university teachers and workers. Finally, the E-Work Life Scale is built as a 17-item instrument; five of these are reverse scored on a 5-point Likert scale from 1 – strongly agree to 5 – strongly disagree, each item with option 6 – not applicable. The factorial exploratory and confirmatory analyses led to the establishment of four factors, which correspond to the main research areas related to teleworking: Work-life interference (7 items) refers to the ability to integrate the requirements of work and private life, to switch between roles, and to manage boundaries between work-related and non-work-related activities. The factor score determinacies [13] tested the reliability of the obtained factors. Thus, for work-life interference, the factor determinacy score is 0.93. Productivity/effectiveness (4 items) refers to the abilities, the competencies, and the self-management needed for work performance. The factor determinacy score is 0.89. Organizational trust (3 items). It is a factor which has to do with how the employee perceives the relationship with their managers and the level of autonomy they have. The factor determinacy score is 0.86. Flexibility (3 items) refers to the schedule and the time spent at work. The factor determinacy is 0.84. The scores are calculated for each subscale.
In order to verify the characteristics of teleworking within the instrument, the authors of the scale associated EWLS with the indicators of mental and general health and of well-being. Thus, it was demonstrated that each of the four dimensions was associated with indicators of the teleworker’s health. More precisely, work-life interference, productivity, and organizational trust correlated significantly with vitality; work-life interference correlated negatively with general and mental health and with vitality, and flexibility is positively associated with mental health. Therefore, EWLS is considered a measure that can be applied in different organizational contexts and for all levels of the organization: individual, supervisor, organizational [14].
Methods
Linguistic adaptation of EWLS
In order to obtain the semantic equivalent of the items, the back-translation technique was used [15]. An English university teacher translated a first form of EWLS into Romanian. The form obtained was retranslated into English, and a team of two psychologists verified the resulting version. The pilot study was conducted on a convenience sample made of 21 students who were asked to give their opinion on the clarity of items. There was no considerable change of the initial version after the modifications. Thus, the Romanian version was then used in the validation study.
Participants and recruitment procedure
Between November and December 2020, we recruited 357 respondents from the online environment via specific Google Forms link. The link was distributed via e-mail campaigns and on social media. In order to avoid errors specific to online studies, the set of questionnaires was secured so as to allow it to be completed only once by a person who received the link from an official address and the link was accessible to each person only for three days. Due to the fact that 12 of the respondents chose the option not applicable for several items, they were eliminated since the option not applicable could not be used when scores were summed up. In the end, there were 345 respondents with Mage = 38.90; S.D. = 9.70 (the youngest respondent – 20 years old; the oldest – 69 years old) of which 232 females (Mage = 40.27±9.57) and 113 males (Mage = 39.35±9.87). We considered that this is an appropriate number of respondents, considering that an appropriate sample in test validation has a number of 5– 20 participants per item [16]. The data collecting instruments put forth a broad definition of teleworking. If the respondents considered their activity matched the definition, they filled in the questionnaire. At the same time, the respondents were informed about the purpose of the study, and there were no rewards for their endeavour. A consent form was also provided to the participants at the link which was distributed.
Ethical consideration
The study has been conducted in full accordance with ethical principles, including the Declaration of Helsinki from 1975 and its later amendments. The study was approved by the responsible body for research ethics from the University Politehnica of Bucharest (Reg. No. 19161/12.10.2020). The respondents who agreed to participate, after reading the consent form, had access to the full questionnaire and proceeded to completion.
Utilized instruments
The E-Work Life Scale – EWLS [12] (Appendix B) consists of 17 items assessed on a five-point Likert scale from 1 – strongly agree to 5 – strongly disagree (5 items are reverse scored) which aim at the following factors involved in teleworking: work-life interference – the efficient division of time between work and personal life (7 items – e.g. My social life is poor when e-working remotely), productivity – the efficiency with which tasks are carried out (3 items – e.g. When e-working I can concentrate better on my work tasks), organizational trust – the relation with the direct superiors, the support and the level of autonomy given by the organization (3 items – e.g. My organization trusts me to be effective in my role when I e-work remotely), and flexibility – the work schedule (3 items – e.g. My work is so flexible I could easily take time off e-working remotely, if and when I want to). The Satisfaction With Life Scale – SWLS [17] is a 5-item instrument, assessed from 1 – strongly disagree to 7 – strongly agree, which measures life satisfaction – the cognitive component of subjective well-being. Sample item: My living conditions are excellent. The scale was validated in multiple cultural contexts. Cronbach’s α values greater than 0.70 were reported [18, 19]. The validation studies proved that SWLS is negatively associated with work stress and burnout [20] while being positively associated with professional development, communication, and team collaboration [21]. For this study, Cronbach’s α value is 0.88 (95%CI: –0.85– 0.90) and χ2/df = 1.69; GFI = 0.99; CFI = 0.99; RMSEA = 0.045; SRMR = 0.012; p = 0.165. The Scale of Positive And Negative Experience – SPANE [22] assesses individual feelings felt over the last period, both positive feelings (subscale Spane-P – 6 items) and negative feelings (subscale Spane-N – 6 items). All the items are assessed from 1 – very rarely or never to 5 – very frequently or always, and each subscale has a score between 6 and 30. The studies showed that the two subscales are associated with happiness [23, 24], flourishing [25], and life satisfaction. In the present study, a Cronbach’s coefficient of 0.91 (95% CI: 0.89– 0.93) was obtained for Spane-P and 0.87 (95%CI: 0.85–0.91) for Spane-N. The CFA highlighted χ2/df = 2.40; GFI = 0.95; CFI = 0.94; RMSEA = 0.050; SRMR = 0.036; p < 0.001.
Subjective well-being was measured in accordance with the model proposed by Diener (2000) [26] and it consisted of the sum of the scores obtained with regard to the cognitive component (life satisfaction) and to the affective component (the balance between positive affect and negative affect).
The socio-demographic data of the respondents considered (i) self-identified gender, (ii) age, (iii) studies, (iv) the professional domain, (v) the time spent teleworking, (vi) the work sector, and (vii) the urban/rural environment where the activity takes place.
Data analysis
The main statistical strategy was confirmatory factor analysis (CFA) with structural equation model. The following statistics coefficients were used: χ2 (chi-square), df (degrees of freedom), χ2/df (criterion chi-squared/df), CFI (comparative fit index), TLI (Tucker-Lewis index), RMSEA (root mean squared error of approximation), SRMR (standardized root mean square residual), PNFI (parsimony normed fit index), PCFI (parsimony comparative fit index), and AIC (Akaike’s Information Criterion). The recommendation of Hooper et al. [27] shows that relative chi-square should have values between 2 and 5. CFI and TLI, values close to 0.90 or greater are acceptable to good [28]; parsimonious fit indices PNFI and PCFI should be over 0.50 [29]. According to Steiger [30], RMSEA should be under 0.07, and SRMR should be smaller than or equal to 0.08 [28]. The internal consistency was calculated by means of Cronbach's α and McDonald’s ω coefficients, as well as of composite reliability (CR). All these coefficients are considered high when they are over 0.70 [31]. The Average Extracted Variance (AVE), used for the measurement of the convergent validity, should be over 0.50 [32, 33], while square root AVE was used for the discriminant validity [32]. The association between the E-Work Life Scale, Satisfaction With Life Scale, and Scale of Positive and Negative Experience was also assessed. The partial least squares structural equation modeling was used to measure the relationship between the EWL Scale and life satisfaction. In this case, the SRMR and heterotrait-monotrait (HTMT) coefficients were used [34]. The programs we used were SPSS22, Amos22 (New York, USA), JASP 0.14.1.0 (https://jasp-stats.org) and ADANCO 2.2.1.
Results
The socio-demographic characteristics of the obtained sample
The sample consisted in a larger number of females, 68.60%, and 31.40% males, among whom 97.55% were university graduates and post-graduates, and only 2.36% of people with high-school studies. As for the professional domains, the largest number of people work in the educational system (24.55%) and then IT (14.79%) and Telecommunications (10.84%). The rest of the respondents work in Banking and Finance (8.87%), Transportation (5.9%), Medicine (4.73%), Sales and Online Sales (4.43%), and Public Administration (2.66%). The age groups are relatively equal, except for the people over 60 (2.00%). Most of the participants belong to the 40– 49 age bracket (7.20%). A percentage of 41.12 people works in the public sector, while 58.87% work in the private sector. All the participants live and work in the urban area. The time spent as teleworkers was assessed as subperiods of five months, given that teleworking was legislated in 2018 in Romania, while the maximum period spent teleworking in Romania is two years (Law 81, 30th of March 2018). Most participants (55%) have been teleworking for almost a year.
Factorial validity
We carried out the CFA defined as “a type of structural equation modeling (SEM) that deals specifically with measurement models” [35] with maximum likelihood estimation, based on the theoretical fundament proposed by Grant et al. [11], using the coefficients mentioned in the paragraph of the statistical analyses. Since the critical ratio of 14.45 is higher than the allowed value of 1.96, we applied bootstrapping with 5000 resamplings (95% confidence interval) in order to solve the non-normality. The result we obtained is good in terms of χ2/df, but with moderate values for comparative fit indices: χ2= 314.494; df = 113; χ2/df = 2.78; CFI = 0.91; TLI = 0.90; PNFI = 0.72; PCFI = 0.76; RMSEA = 0.073 (90% Confidence Interval – CI90 %: 0.063–.082); SRMR = 0.0678; AIC =428.494; p < 0.001. The examination of the modification indices led to the correlation of two errors between items 2 (When e-working remotely, I often think about work related problems outside of my normal working hours) and 6 (I feel that work demands are much higher when I e-work remotely) within the work-life factor interference and between items 13 (My organization trusts my efficiency when I e-work) and 14 (I trust my organization to provide good e-working facilities to allow me to e-work effectively) within factor 3, Organizational trust. The consequence was the improvement of the fit coefficients: χ2= 289.872; df = 111; χ2/df = 2.61; CFI = 0.93; TLI = 0.91; PNFI = 0.72; PCFI = 0.76; RMSEA = 0.069 (90% Confidence Interval – CI90 %: 0.059–0.079); SRMR = 0.0678; AIC = 407.872; p < 0.001 (Table 1). The differences between the two models were assessed by means of the Akaike coefficient (AIC) which is smaller in model 2 than in model 1 [28]. As a result, this model was retained in subsequent analyses. In this model, the items have a factor loading between 0.53 (item 2) and 0.93 (item 9) and they are all significant at p < 0.001 (see fig. Confirmatory factor analysis of the EWLS – Appendix A).
Confirmatory factor models
Confirmatory factor models
Tables 2 3 sum up the descriptive analysis per factors and per items. The reliability of the instrument was assessed by means of Cronbach’s alpha coefficients, McDonald’s omega coefficients, and composite reliability (CR). All categories of coefficients showed a good consistency for the global score of EWLS, the factors work-life interference, productivity and organizational trust, and acceptable for the factor of flexibility. The Cronbach α coefficients for the subsamples of males and females are consistent with those obtained for the general sample: Work-life interference (α = 0.84 – females; α= 0.85 – males); Efficiency (α= 0.86 – females; α= 0.87 – males); Organizational trust (α= 0.72 – females; α= 0.79 – males); Flexibility (α= 0.62 – females; α= 0.79 – males); total score EWLS (α= 0.87 – females; α= 0.89 – males). In addition, the Average Extracted Variance (AVE) calculated on the basis of factor loadings obtained from CFA for every factor is over 0.50, minimum recommended (Table 2). Moreover, CR in the case of every factor is over 0.70 [31] and the ratio between CR and AVE is observed: CR > AVE [36].
The descriptive statistics per factors
The descriptive statistics per factors
Means, standard deviations, skewness, kurtosis and corrected item-total correlation
*We kept the codification proposed by Grant et al. (2019) after the factorial solution of the 28-item version.
In order to verify the relationship between every item and the total scale, we used the corrected item-total correlations. Since the correlations were over 0.40, we considered that all the items represent good scale components. The lowest correlations are identified for items 15 (0.44) and 16 (0.48). The other items have correlations corrected with the scale, good and very good value. In addition, all the item-total correlations are higher within their own subscale than those obtained in other subscales (Table 3).
To test the discriminant validity of the scale, the square root of the AVE indicator in each construct was used through the Fornell-Larcker criterion [32] and was compared with its inter-construct correlation (Table 4).
Discriminant validity: Fornell-Larcker criterion
Discriminant validity: Fornell-Larcker criterion
The correlations between the EWLS and the two measures that assess subjective well-being show a significant and moderated relation between work-life interference and life satisfaction (r = – 0.26; p < 0.05), positive affect (r = – 0.42; p < .01), and subjective well-being (r = – 0.38; p < 0.01), implicitly, and a positive one with the negative affect (r = 0.32; p < 0.01) (Table 5). Surprisingly, there were no correlations between the rest of the factors from EWLS and life satisfaction. In addition, there were no correlations between subjective well-being and the other factors from EWLS. However, we noticed one weak negative significant correlation between productivity and positive affect (r = – 0.26; p < 0.05). It remains to be seen whether upon the future increase of the number of subjects in the sample, the respective correlation will stay the same. The result is consistent with studies that show that in the case of teleworkers, the stress generated by isolation can reduce performance [7]. This negative correlation could be accounted for by the fact that working from home is more taxing than working in the office, at least for certain categories of people.
The intercorrelations between EWLS and subjective well-being
The intercorrelations between EWLS and subjective well-being
**p < 0.01; *p < 0.05.
The values of the intracorrelations of the EWLS are between 0.20 and 0.53 (p < 0.01). The highest correlation is the one between the work-life interference and productivity dimensions (r = 0.53; p < 0.01), which highlights the importance of maintaining a balance between work and personal life in view of high productivity.
Next, we investigated a less explored relationship in the literature between the dimensions of telework and employee’s life satisfaction. A structural equation model using a partial least squares approach (ADANCO 2.2.1) is used to assess this relationship (Fig. 1). The investigation of a first model obtained led first of all to the elimination from the model of the constructs that have values of coefficients below 0.50 [37]. After this exclusion, three items were retained in the work-life interference variable, with the rest of the number of items remaining unchanged. The measurement of the model was evaluated to determine the reliability and validity of the operationalized scales (all the values of the coefficients Dijkstra-Henseler (ρ
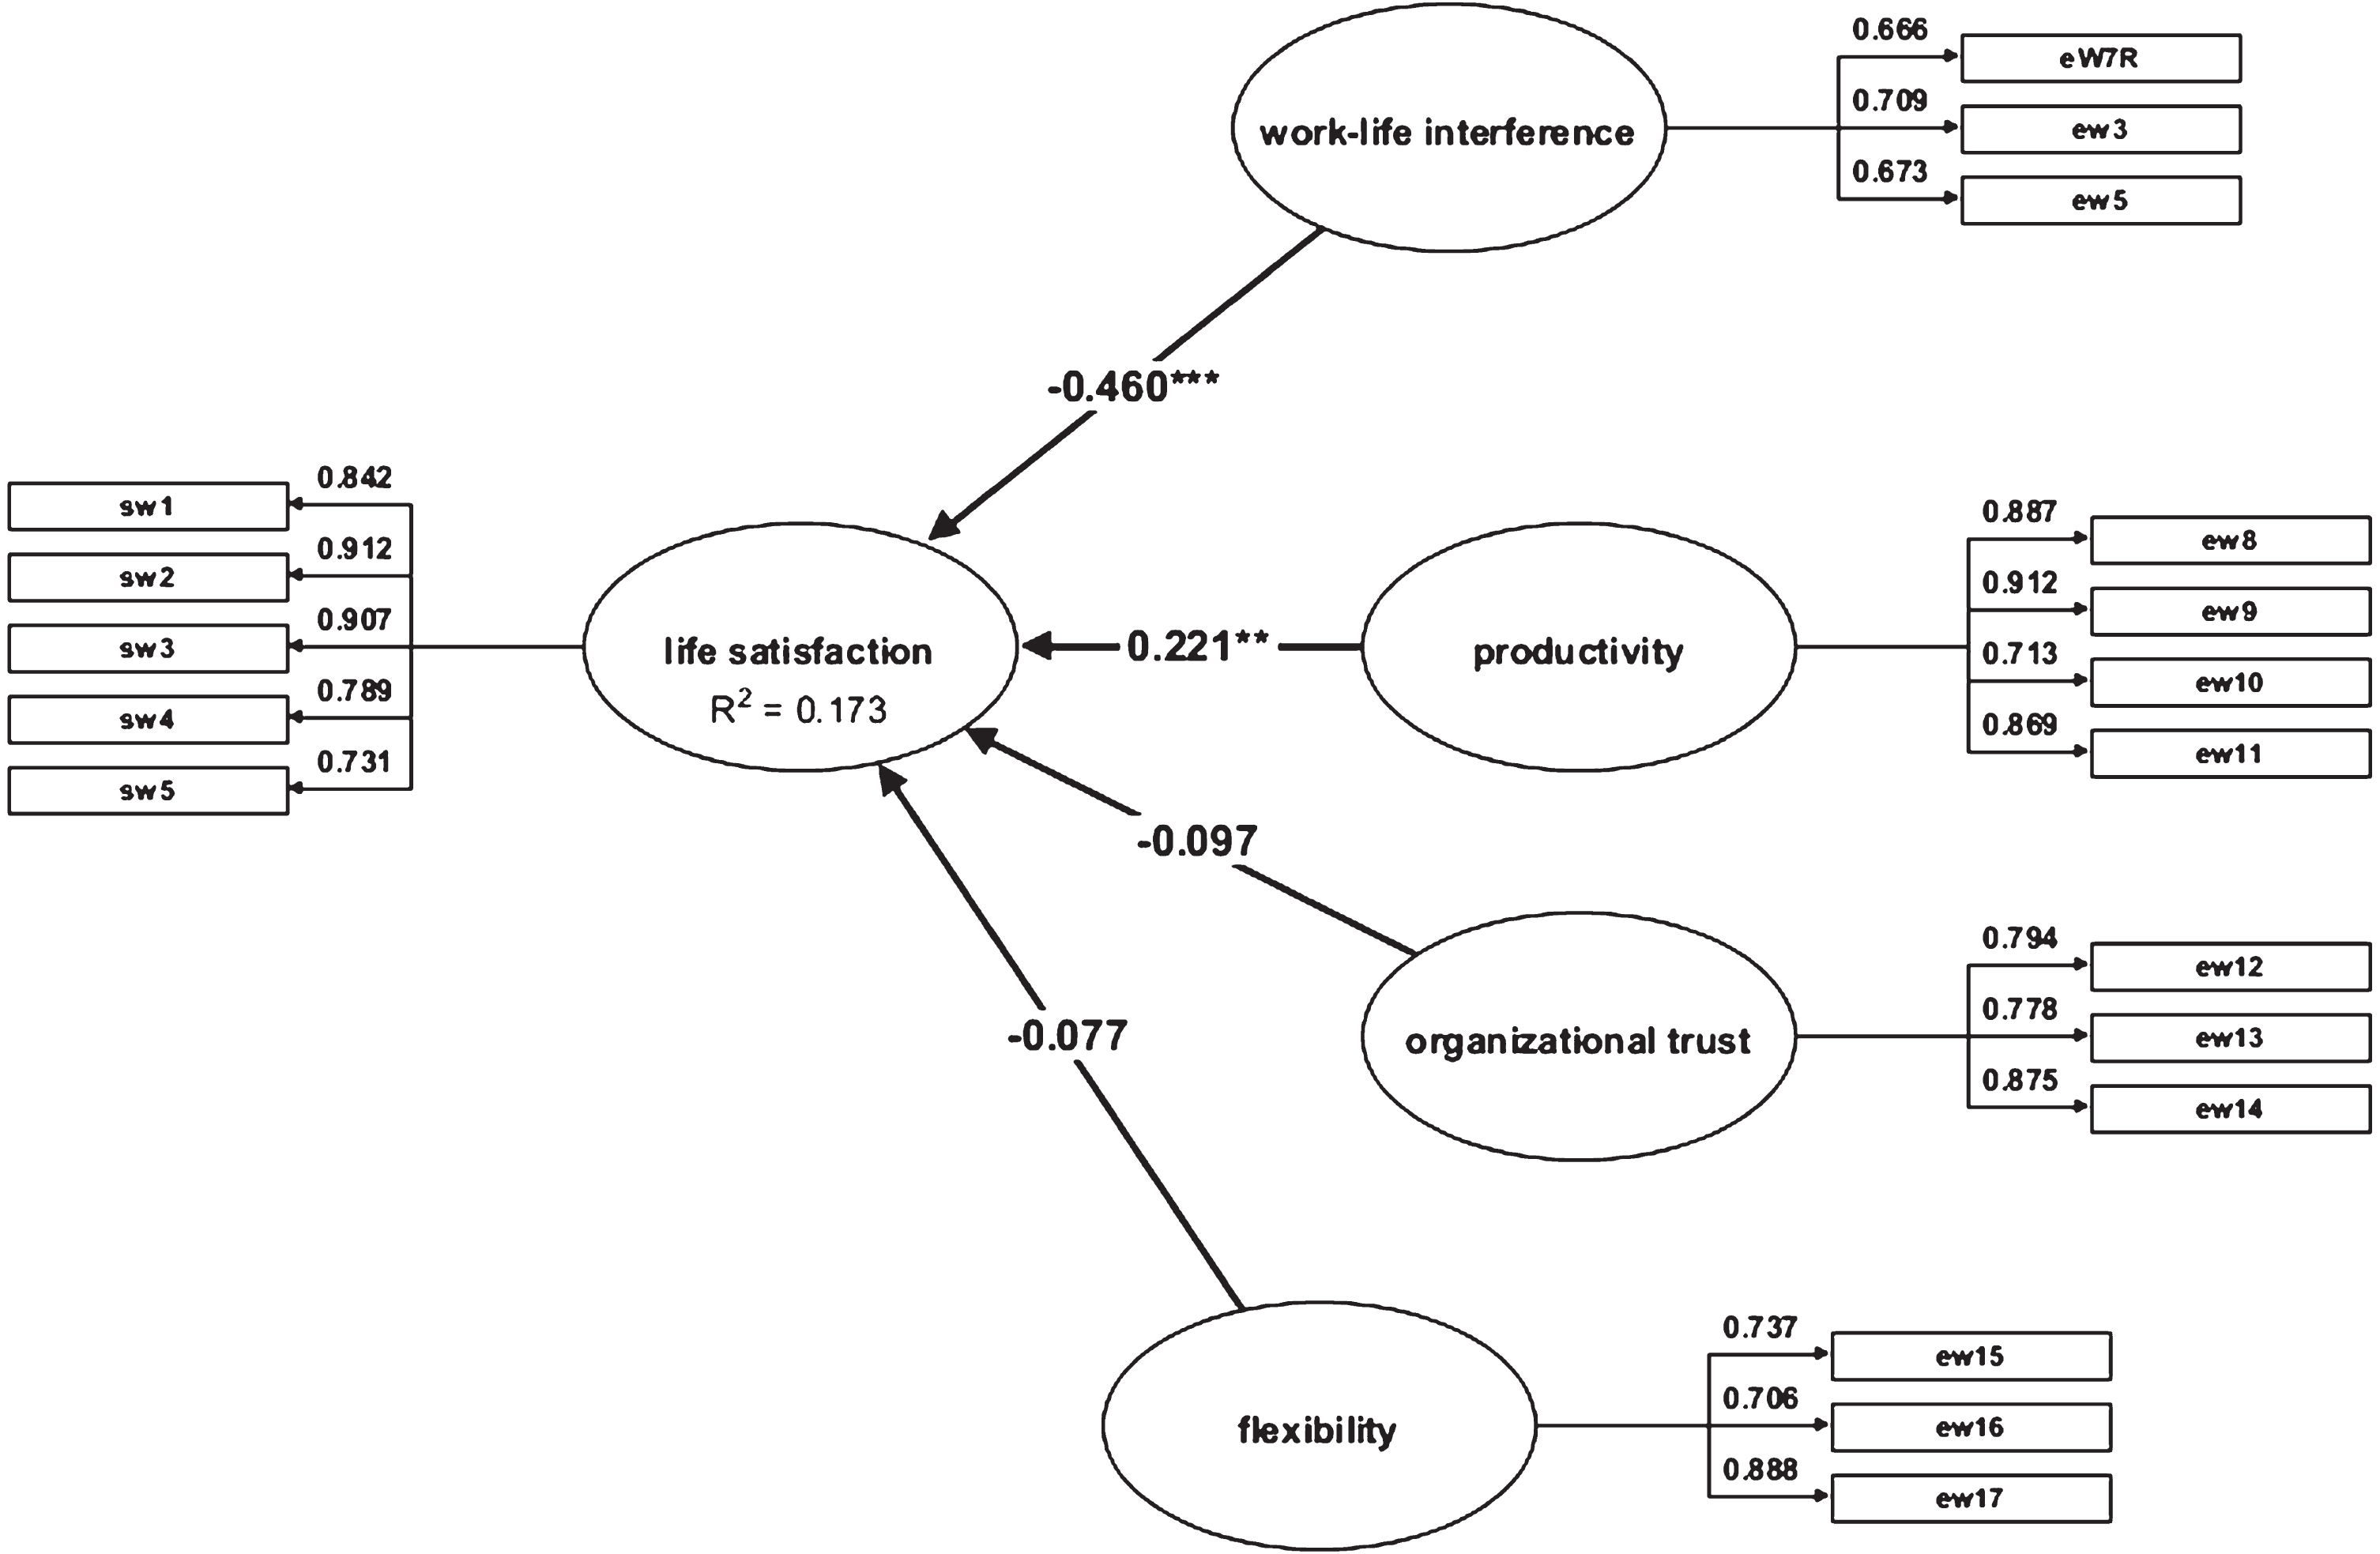
Structural equation model and coefficient of determination (R2).
Discriminant validity of the structural equation model: HTMT ratio of correlations
We opted for the validation of EWLS in the Romanian context because there was no specific instrument for the assessment of the relevant teleworking-related aspects. To this purpose, the study focused on the translation and the test of the validity and of the reliability of EWLS in the case of a population of teleworkers. The confirmatory factor analysis supported the 4-factor structure scale (work-life interference, productivity, organizational trust and flexibility) and the integral presence of the 17 items but with two correlated errors. The Romanian version of the scale has good fit indices for this present sample. The 17 items have good factor loading: 5 items have factor loading between 0.53 and 0.60, 5 items between 0.61– 0.70, 2 items between 0.71 and 0.80, and the other 5 items between 0.81 and 0.92. The CFA reveals that the four EWLS factors had associations with each other suggesting that factors are related but measure different concepts. The result for the obtained Cronbach’s alpha coefficients, McDonald’s omega coefficients, and composite reliability (CR) demonstrate good internal consistency for the EWLS; the lowest reliability was that of flexibility (α= 0.69); otherwise, all factors have consistency indices α and ω above 0.74. The findings provide good levels for convergent and discriminant validity: Fornell-Larcker criterion.
Regarding the relationship between EWLS and subjective well-being and its components it was obtained a negative relationship between work-life interference and subjective well-being, which shows that when the employees consider that teleworking interfere with their private life, subjective well-being decreases. This result suggests that it is difficult for the employees we examined to establish clear boundaries between work and private life. Additionally, it is difficult for them to manage their time. The result is consistent with the study of Grant et al. [11], who found a negative relation between work-life interference and well-being in terms of vitality (r = – 0.34), mental health (r = – 0.38), and general health (r = – 0.28) (all p < 0.01). The respective authors suggest that the latter is due to the teleworkers’ tendency to overwork and to their inability to establish boundaries between their workspace and their private life. The result corroborates studies which show that the interference between professional life and private life makes the employees answer promptly to any work requirements and to interrupt other activities dedicated to their family life, which leads to stress and to unpleasant feelings [8, 38]. The negative relationship between the two variables is once more accounted for by the pandemic period when the data were collected, when, due to the fact that the schools were closed, the parents got more involved in their children’s education [39].
Against all expectations, we did not obtain the envisaged positive relations between the other dimensions of the scale (productivity, organizational trust, and flexibility) and subjective well-being. As shown, the study of Grant et al. [11] found positive weak significant correlations between two dimensions of the scale: productivity and organizational trust and vitality, and mental health, respectively. Nevertheless, in the variance-based SEM in the current study, we obtained the determination relationship that the productivity dimension has on life satisfaction (β= 0.22; t = 2.73; p = 0.00) which shows that obtaining productivity in telework increases the employee’s life satisfaction (Fig. 1). The result is consistent with research that concludes that telework has an impact on employee life satisfaction [40, 41]. On the other hand, differences in results can be sought in the context of studies. For example, the study by Grant et al. [11] was constructed in the pre-pandemic period, while the present study was conducted in the state of emergency of the pandemic, given that employees went into fortuitous telework. As Arefi et al. [42] show in emergency situations, a too high work performance cannot be expected. Despite the benefits of telework, in a pandemic situation it can have a negative impact on workers’ mental health.
This is the reason why we consider it important to continue the study, evaluating the period worked in telework, increasing the number of participants and using different tools in measuring the well-being of employees.
Limitations
This research has certain limitations. In addition to the size of the sample which in subsequent studies should increase, a possible limitation comes from the fact that the latter is made of knowledge workers – teleworkers who apply and create knowledge, who operate with theoretical notions and abstractions. This limitation is shown by the large number of graduates and post-graduates. Secondly, it is important to make sure that the subjects included in the sample come from various geographical areas of the country. Thus, subsequent validations should be made on samples of individuals with various professional backgrounds and from various geographical areas. Finally, since there is a certain proof concerning the difference in the perception and the meaning attached to teleworking across categories, it is only reasonable to test the invariance of the assessment of the questionnaire for gender, age group, and the size of the company. In the present study, the size of the sample was not appropriate for these analyses to be carried out. Also, another limitation comes from the fact that the studied group was described socio-demographically but the respective characteristics were not associated with the four dimensions analyzed in the telework.
Conclusions
The results suggest that EWLS and its subscales are valid and they have high reliability, which makes them fit for the assessment of teleworkers. The study is the first of its kind in Romania that validates a scale for measuring the teleworking experience, thus enriching the portfolio of tools that assess the relevant aspects of teleworking. The E-Work Life Scale is a quality instrument for researchers, managers, and the organizations whose aim is to assess the teleworkers’ activity and they propose to find strategies to support the latter and to help them obtain better results.
Footnotes
Acknowledgments
The author thanks all study participants.
Conflict of interest
None to report.
Funding
The author does not have any funding to disclose.
Appendix A: Confirmatory factor analysis of the EWLS.