
Abstract
BACKGROUND:
Handgrip strength is considered an important interpreter of general health, and hand functions in children. It is mainly influenced by anthropometric determinants and hand dimensions.
OBJECTIVE:
To assess the handgrip strength and their association with anthropometric determinants, hand circumference, hand span, and hand length among school children in both the dominant and non-dominant hand.
METHODS:
Anthropometric measurements, hand circumference, hand span, hand length, and grip strength measurements were obtained from 133 school children of both genders aged 6–12 years. A Jamar hand-held dynamometer was used to measure handgrip strength and the hand dimensions with a tape measure in cm.
RESULTS:
Significant differences were found between the handgrip strength among boys and girls. The dominant hand was found to be sturdier than the non-dominant hand in both genders. We also found a significant correlation of anthropometric determinants and hand dimensions with handgrip strength. Age, BMI, hand circumference, hand span, and hand length had a strong correlation with grip strength (p < 0.01).
CONCLUSIONS:
The study revealed the reference values and concluded its correlations with hand dimensions among school children aged 6–12 years and this information can serve as a manual for interpretation of handgrip strength measurements in children.
Introduction
The hand is the utmost dynamic and collaborative part of the upper limb [1]. Functional shape of the hand can incidentally or ultimately reflect the growth of the hand, especially hand circumference, hand span, hand length, and palm length [2]. These measurements can be measured effortlessly, along with the handgrip strength (HGS), which assess the children’s growth and functional assessment [3]. Specifically in children, the reference values remain crucial for understanding the data and founding precise management consequences. In addition, assessing handgrip strength by utilizing a hand-held dynamometer is noninvasive, economical, and very simple to apply.
Various factors such as age, height, weight, body mass index, gender, hand dominance, body size, and hand dimensions commonly influence the handgrip strength. Gender-related variances were witnessed in relation to grip strength [4], with the reference values stated more for boys contrasted to girls, and even the non-dominant hand has less grip strength compared to the dominant one [5]. Along with these, the variations will be different in various working population [6]. Few research studies have also revealed that, along with gender, both height and weight are positively associated with handgrip strength, but the influence of these determinants is significantly lesser than that of either sex or age [7].
Hand dimensions such as hand circumference, hand span, hand length, and palm length of the hand have been termed as better predictors of handgrip strength [8]. Hand circumference was evaluated subsequent to the hand arch at the extreme palm level of the dominant hand, just below the knuckles excluding the thumb. Hand span was measured from the tip of the last finger to the tip of the thumb while the hand was outstretched. Palm length was evaluated from the distal wrist wrinkle to the base of the middle finger [9]. In addition, when evaluating the handgrip strength, the hand dimensions, such as hand circumference, hand span, hand length, and palm length, play a key role. However, to our understanding, there is no research conducted regarding measurement of hand circumference, hand span, hand length, and palm length in both the dominant and non-dominant hand in non-Saudi children.
Grip strength measurement was generally done using the hand-held Jamar dynamometer; moreover, assessing HGS by means of a dynamometer is economical, noninvasive, and very easy to implement [10]. Its usage is appropriate and simple, as it is the person who himself controls his power, while applying the pressure. The American Society of Hand Therapists (ASHT) clearly mentions the second handle position is the ideal position for evaluation of maximum force measurement. This position is the suggested principle for research studies pursuing to find the normative data [11].
In the meantime, a decrease in HGS can cause substantial functional restrictions, which can lead to a reduction in activities of daily living and distresses the quality of life. This is primarily because the proper hand function is vital for the majority of the activities concerning the upper limbs [12, 13]. A number of factors impact handgrip strength, which include age, sex, muscle strength and endurance, pain, constrained movement, and anthropometric determinants [14, 15]. Acknowledged as an accumulative variable, handgrip strength commences during childhood and advances until maturity, and touches an extreme value. As the age increases, the grip strength steadily declines and decreases the performance of manual tasks that involve the upper limbs [15]. Therefore, the grip strength measurements provide appropriate scientific data intended to apply in rehabilitation process. Additionally, the reference values for a definite population from one country to another may change over time due to changes in nutritional status, occupation, lifestyle, and other factors. Hence, the purpose of the present study was to measure the reference values of handgrip strength among school children and to find the correlation of anthropometric determinants and hand circumference, hand span, hand length, and palm length which will be beneficial to offer significant information for practice.
Materials and methods
Subjects
This cross-sectional study randomly included 133 school children (India = 57, Pakistan = 42, Bangladesh = 14, Sri Lanka = 11, and Afghanistan = 9) from different international schools in the Asir region. All contestants were invited to the physical therapy out-patient department for evaluating demographics, handgrip strength and hand dimensions. All the necessary permissions were obtained from these schools for conducting the research. Before execution, the therapist described the process and determination of this research.
The inclusion criteria were (1) non-Saudi children aged between 6 and 12 years, (2) no noticeable joint deformities, (3) healthy school children, and (4) willingness to participate in the study. The exclusion criteria were (1) any joint problems of hand, (2) congenital abnormalities, (3) any history of recent fracture of upper extremities, (4) any recent surgery of upper limb, and (5) any neurological disorders. All subjects involved in this study signed informed, written consent. All the children and their parents signed a well-versed consent form after getting a brief explanation of the study. This study was reviewed and approved by Research Ethics Committee Board at, King Khalid University (ECM # 2021-5802).
Demographic data
Basic demographic data, including age, gender, height, and weight were documented. Height with a stadiometer (Pelstar, USA) to close 0.1 cm, body weight using a portable digital weighing scale (Krypton, model KNBS5115, UAE) to the nearest 0.1 kg, and body mass index (BMI) were calculated.
Hand dimensions
In relation to hand dimensions, hand circumference was measured around the palm just below the knuckles excluding the thumb (Fig. 2.A), hand length from the tip of the longest finger to the crease under the palm (Fig. 2.B), and hand span from the tip of the thumb to the tip of the little finger when the subjects stretch and extend out their hand placing it on a measuring scale (Fig. 2.C). All these measurements were accomplished with a tape measure [16].
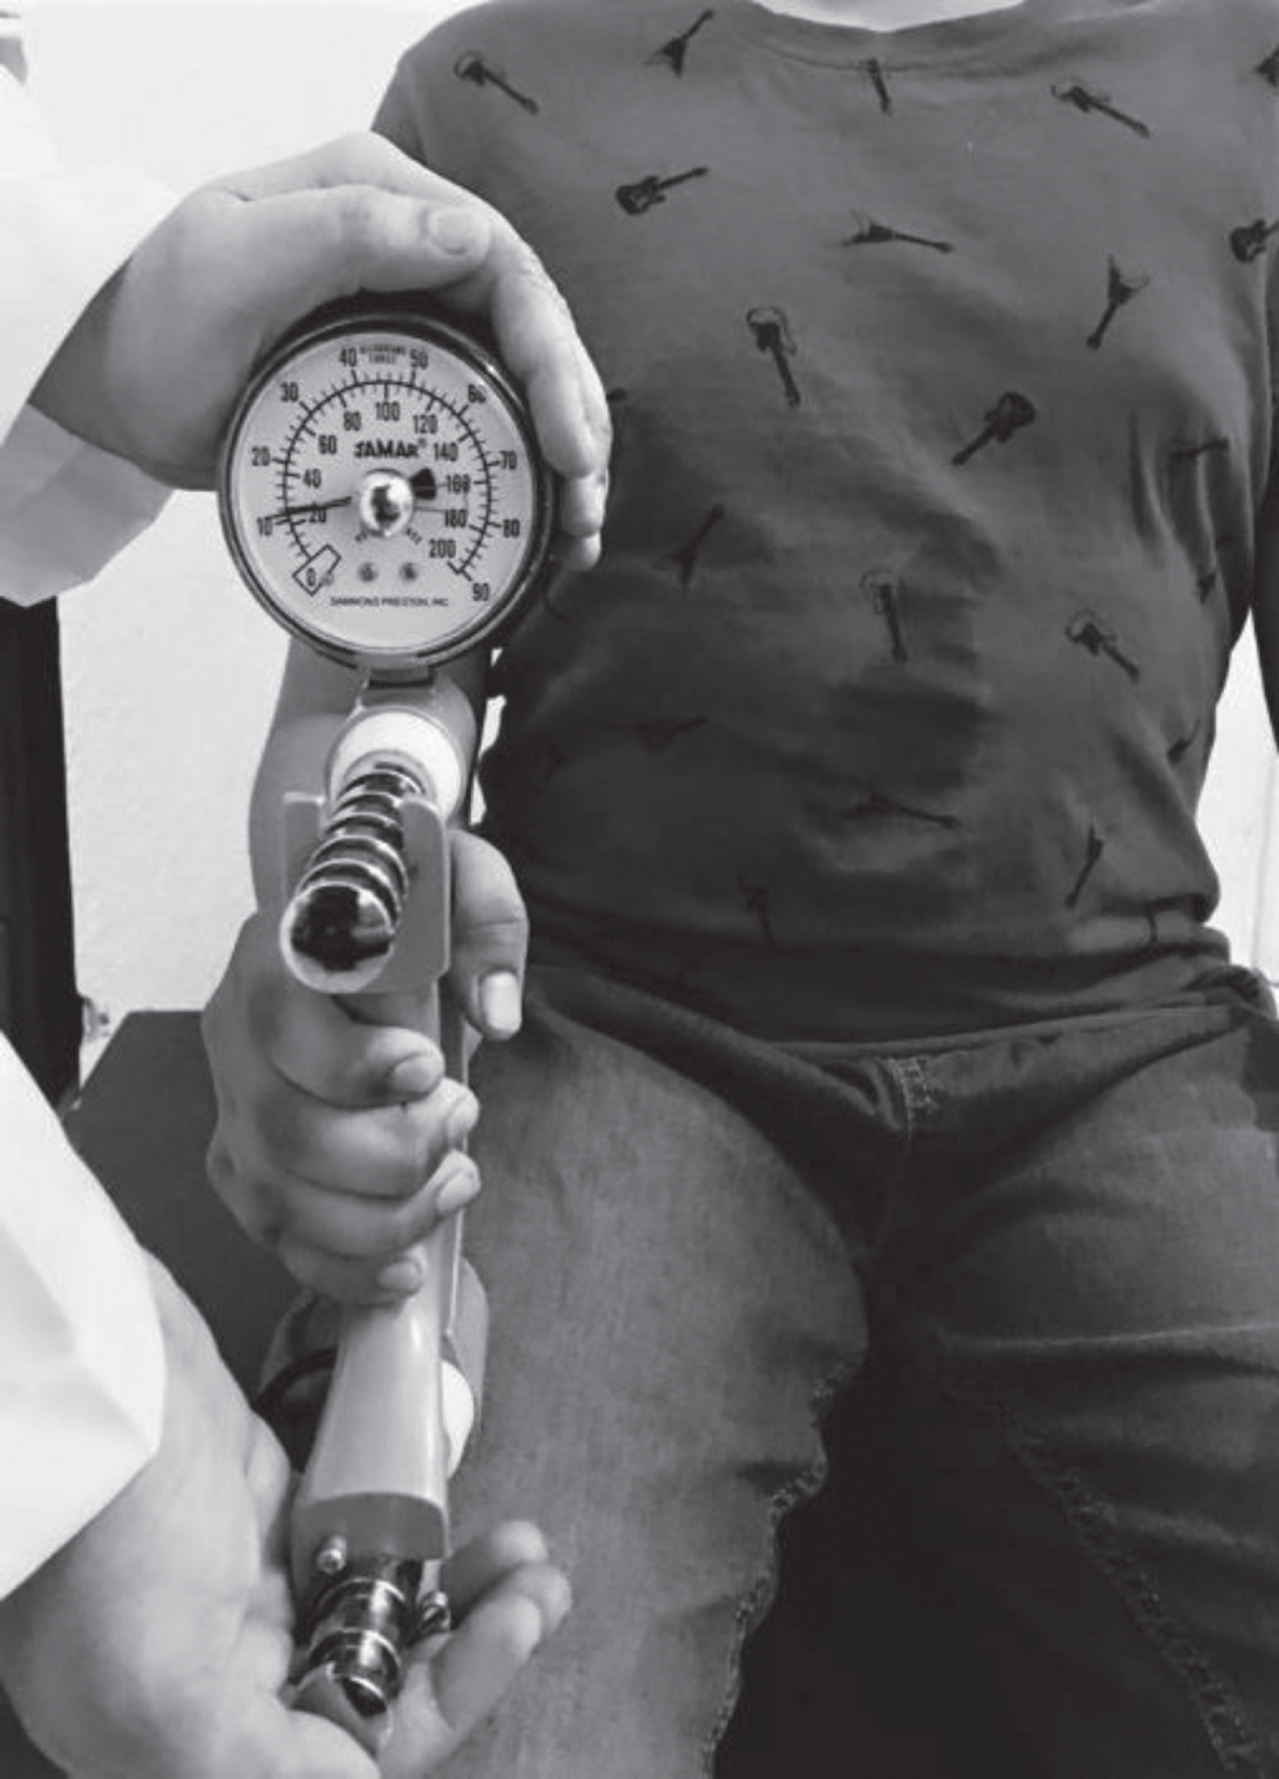
Handgrip strength measurement.
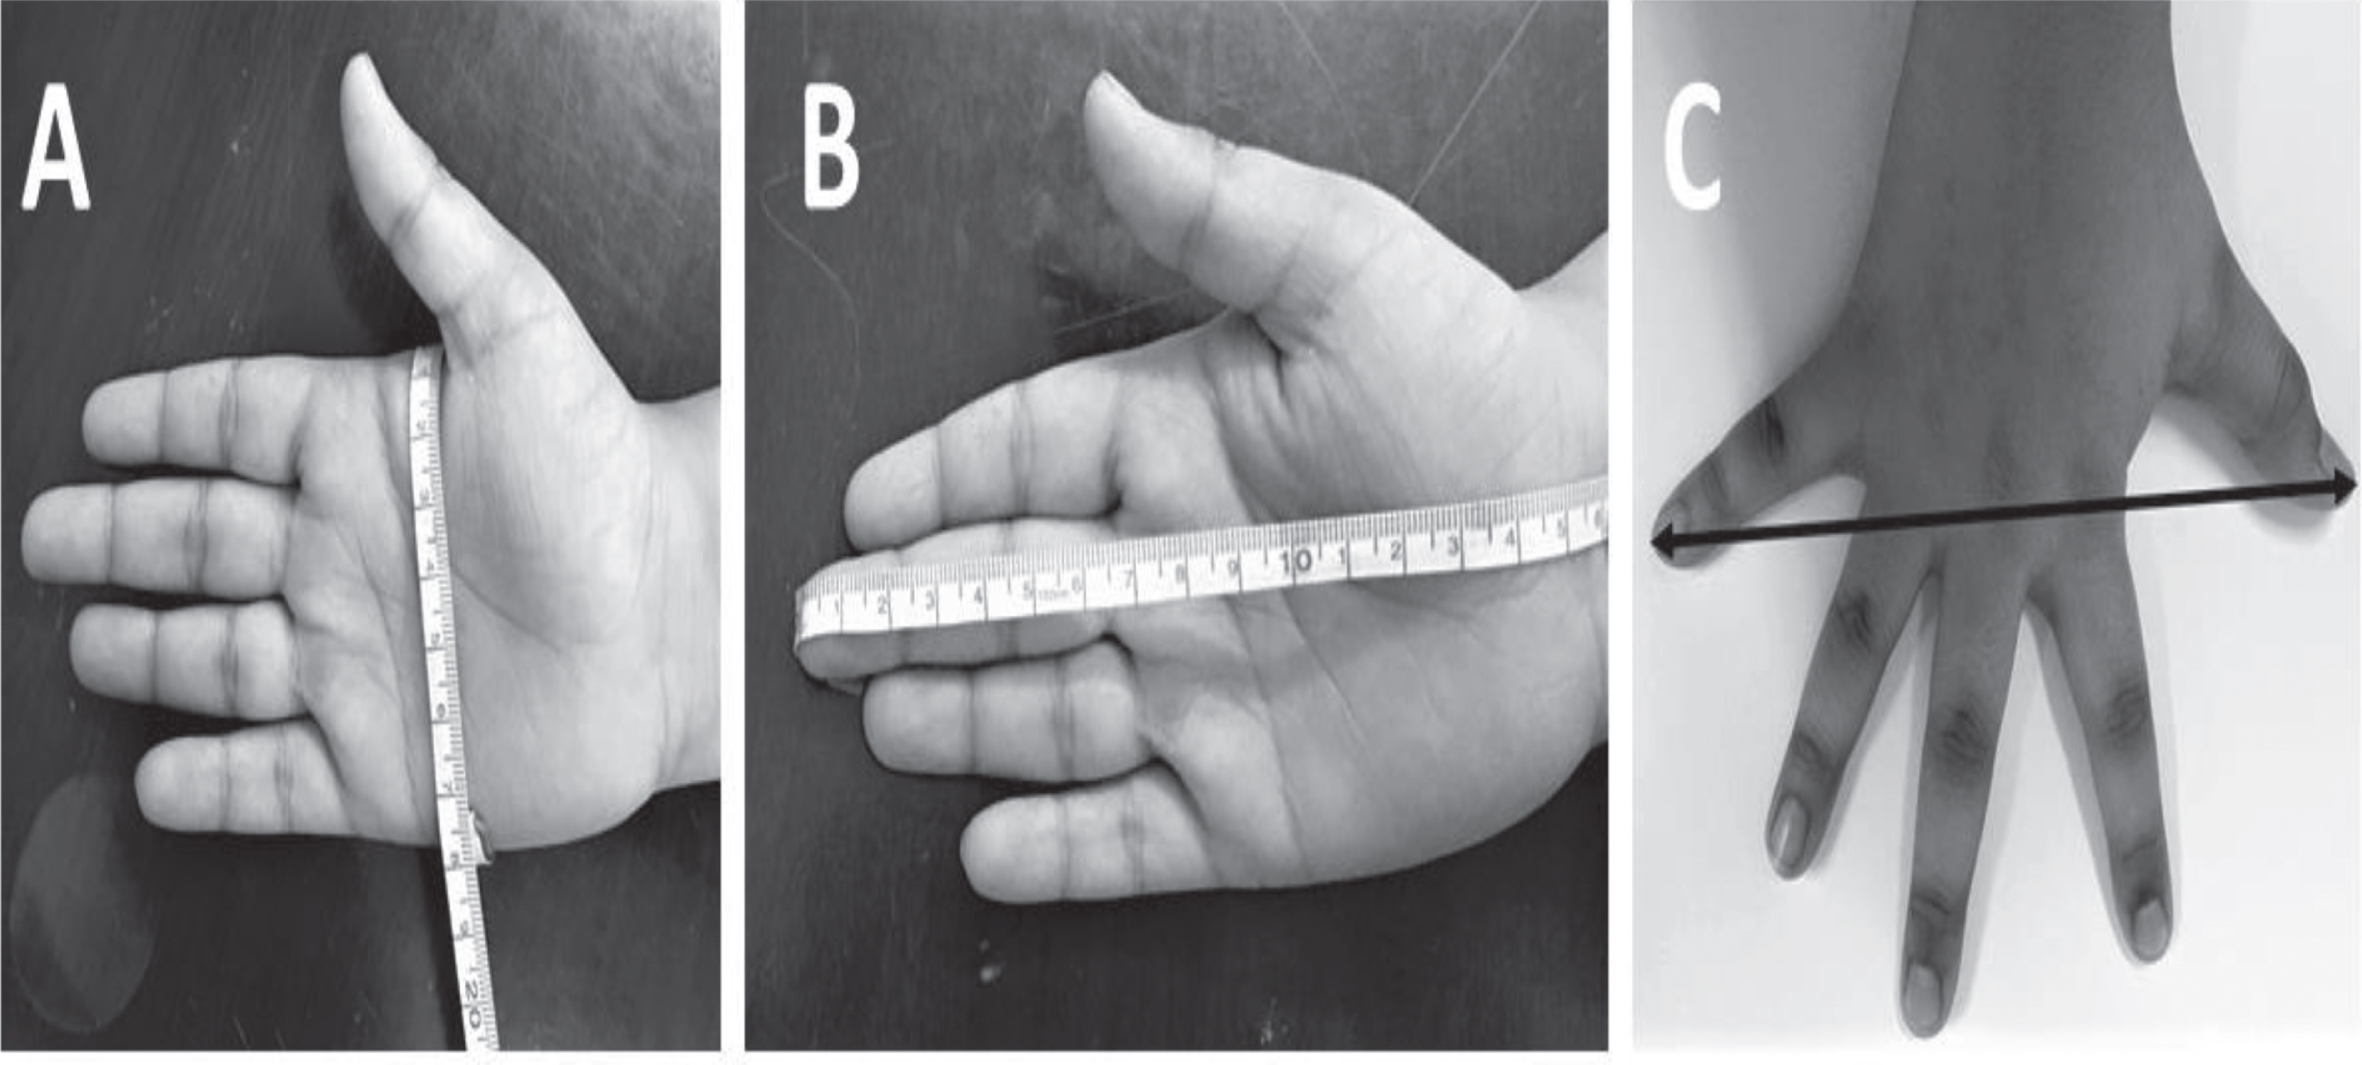
(A): Hand circumference measurement, 2 (B): Hand span measurement, 2 (C): Hand length measurement.
In this study, all the children were allowed to practice using the dynamometer to become familiar with the measurement procedures and perform 3–5 testing trials. The American Society of Hand Therapists guidelines suggested the technique for grip strength measurements accompanied in this study. Grip strength was measured by means of a Jamar hydraulic hand dynamometer (Hydraulic Hand Dynamometer Fabrication Enterprises Inc., USA) fixed at second handle position. To measure handgrip strength, the participant continued securely placed in a chair with proper back support, sitting straight, by keeping shoulder in neutral position, elbow in 90° flexion, forearm in mid-prone position (in 0°), wrist in 0–15° of ulnar deviation, and feet supported comfortably on the ground (Fig. 1). The hand preference was assessed by requesting the subjects which hand was commonly used to grasp a pencil while writing and which hand was preferred for doing the actions of daily living. The proper analysis of handgrip strength was initiated after 5–7 minutes after the acquaintance procedure by all children.
Each participant was encouraged verbally and given proper instructions to apply maximum strength during each trial. Three trials were implemented interchangeably for each arm starting with the dominant hand followed by the non-dominant one. To decrease tiredness, especially in the children, about a 2–3 minute break was given for every attempt. The assessor documented the average of the three trials for further valuation. The verbal instructions before each test were given to try a maximal exertion for each trial by squeezing the dynamometer as firmly as possible for 10 seconds. During testing, if children felt pain or uneasiness during evaluation, they were instructed to stop squeezing. All the measurements were accomplished by the same evaluator. In this study, prominently, all children seemed interested during the handgrip strength measurements.
Statistical analysis
The data collected were summarized by using descriptive statistics to describe the sample. To compare the age, height, weight, BMI, hand circumference right side (HCRT), hand circumference left side (HCLT), hand span right side (HSRT), hand span left side (HSLT), hand length right side (HLRT), hand length left side (HLLT), dominant side hand grip strength (DHGS) and non-dominant side hand grip strength (NDHGS) according to gender the independent sample “t” test was used. Along with this, we also did sub-group analysis comparing the mean handgrip strength values in different populations. Pearson correlation coefficient was used to find the relationship between age, height, weight, BMI, HCRT, HCLT, HSRT, HSLT, HLRT, HLLT, DHGS and NDHGS. To compare differences in proportion, the likelihood ratio test was used.
Results
Study population
Table 1 (a) and (b) exemplifies age, gender, height, weight, and BMI of overall subjects in the sample.
(a): Demographic characteristics of the overall participants in the sample
(a): Demographic characteristics of the overall participants in the sample
(b)
Comparison of age, height, weight, and BMI according to gender
Table 1(c) presents the comparison of age, height, weight, and BMI according to gender. The independent sample t-test of the data revealed a significant difference in weight, and BMI between both genders (p < 0.01). These factors ranged from 38.66 % to 48.76 % in boys and from 32.74 % in girls, respectively.
Hand dominance
Out of 133 subjects in this study, only two subjects were left handed and the remaining 131 were right handed.
Anthropometric determinants
Comparison of hand circumference right side (HCRT) to hand circumference left side (HCLT) according to gender
Table 2 shows a significant difference in HCRT and HCLT between boys and girls (p < 0.01). Moreover, the HCRT between boys and girls varied from 17.88±2.03 to 15.83±1.74 and demonstrated more values than HCLT side (p < 0.001).
Comparison of HCRT and HCLT (cm) according to gender by using “t” test
Comparison of HCRT and HCLT (cm) according to gender by using “t” test
HCRT: Hand circumference right side, HCLT: Hand circumference left side. (* Significant): Significant difference (p < 0.05) in HCRT and HCLT according to gender.
Table 3 shows a significant difference in HSRT and HSLT between boys and girls (p < 0.01). Furthermore, the HSRT between both genders differed from 10.88±1.65 to 9.0±1.75 and exhibited additional values than HSLT side (p < 0.001).
Comparison of HSRT and HSLT (cm) according to gender by using “t” test
Comparison of HSRT and HSLT (cm) according to gender by using “t” test
HSRT: Hand span right side, HSLT: Hand span left side. (* Significant): Significant difference (p < 0.05) in HSRT and HSLT according to gender.
Table 4 shows a significant difference in HLRT and HLLT between boys and girls (p < 0.01). Additionally, the HLRT between both genders differed from 16.3±1.65 to 13.9±1.76 and showed more values than HLLT side (p < 0.001).
Comparison of HLRT and HLLT (cm) according to gender by using “t” test
Comparison of HLRT and HLLT (cm) according to gender by using “t” test
HLRT: Hand length right side, HLLT: Hand length left side. (* Significant): Significant difference (p < 0.05) in HLRT and HLLT according to gender.
Comparison of dominant handgrip strength (DHGS) to non-dominant handgrip strength (NDHGS) according to gender
Table 5 reveals a significant difference in handgrip strength between boys and girls. Additionally, the handgrip strength in dominant side among boys and girls varied from 16.3±1.65 to 13.9±1.76 and 13.89±7.13, in which dominant hand was stronger than non-dominant hand (p < 0.01).
Comparison of DHGS and NDHGS (kg/m2) according to gender by using “t” test
Comparison of DHGS and NDHGS (kg/m2) according to gender by using “t” test
DHGS: Dominant hand grip strength, NDHGS: Non-dominant hand grip strength. (* Significant): Significant difference (p < 0.05) in DHGS and NDHGS according to gender.
Comparison of mean handgrip strength among sub-groups
Table 6 shows a significant difference in the mean handgrip strength among India, Pakistan, Bangladesh, Sri Lanka, and Afghanistan school children. Additionally, the handgrip strength in dominant side varied from non-dominant side, in which the dominant hand was stronger than the non-dominant hand (p < 0.01).
Comparison of handgrip strength (kg/m2) in dominant and non-dominant hand among India, Pakistan, Bangladesh, Sri Lanka, and Afghanistan school children
Comparison of handgrip strength (kg/m2) in dominant and non-dominant hand among India, Pakistan, Bangladesh, Sri Lanka, and Afghanistan school children
DHGS: Dominant hand grip strength, NDHGS: Non-dominant hand grip strength. (*Significant): Significant difference (p < 0.05) in DHGS and NDHGS according to gender.
Correlation of age, height, weight, BMI, HCRT, HCLT, HSRT, HSLT, HLRT, and HLLT with dominant and non-dominant handgrip strength in boys
Tables 7 (a) and (b) analyze the correlation of anthropometric determinants and hand dimensions with HGS among boys and girls. This study demonstrated age, height,weight, and BMI were significantly associated (p < 0.05) with handgrip strength in both dominant and non-dominant hands among both boys and girls. Additionally, all the hand dimensions were also significantly correlated (p < 0.05) with DHGS and NDHGS in both boys and girls. Variables such as age, height, weight and their correlation to HCRT, HCLT, HSRT, HSLT, HLRT, and HLLT are represented in Figs. 3 (a), (b), 4 (a), (b), and 5 (a), (b).
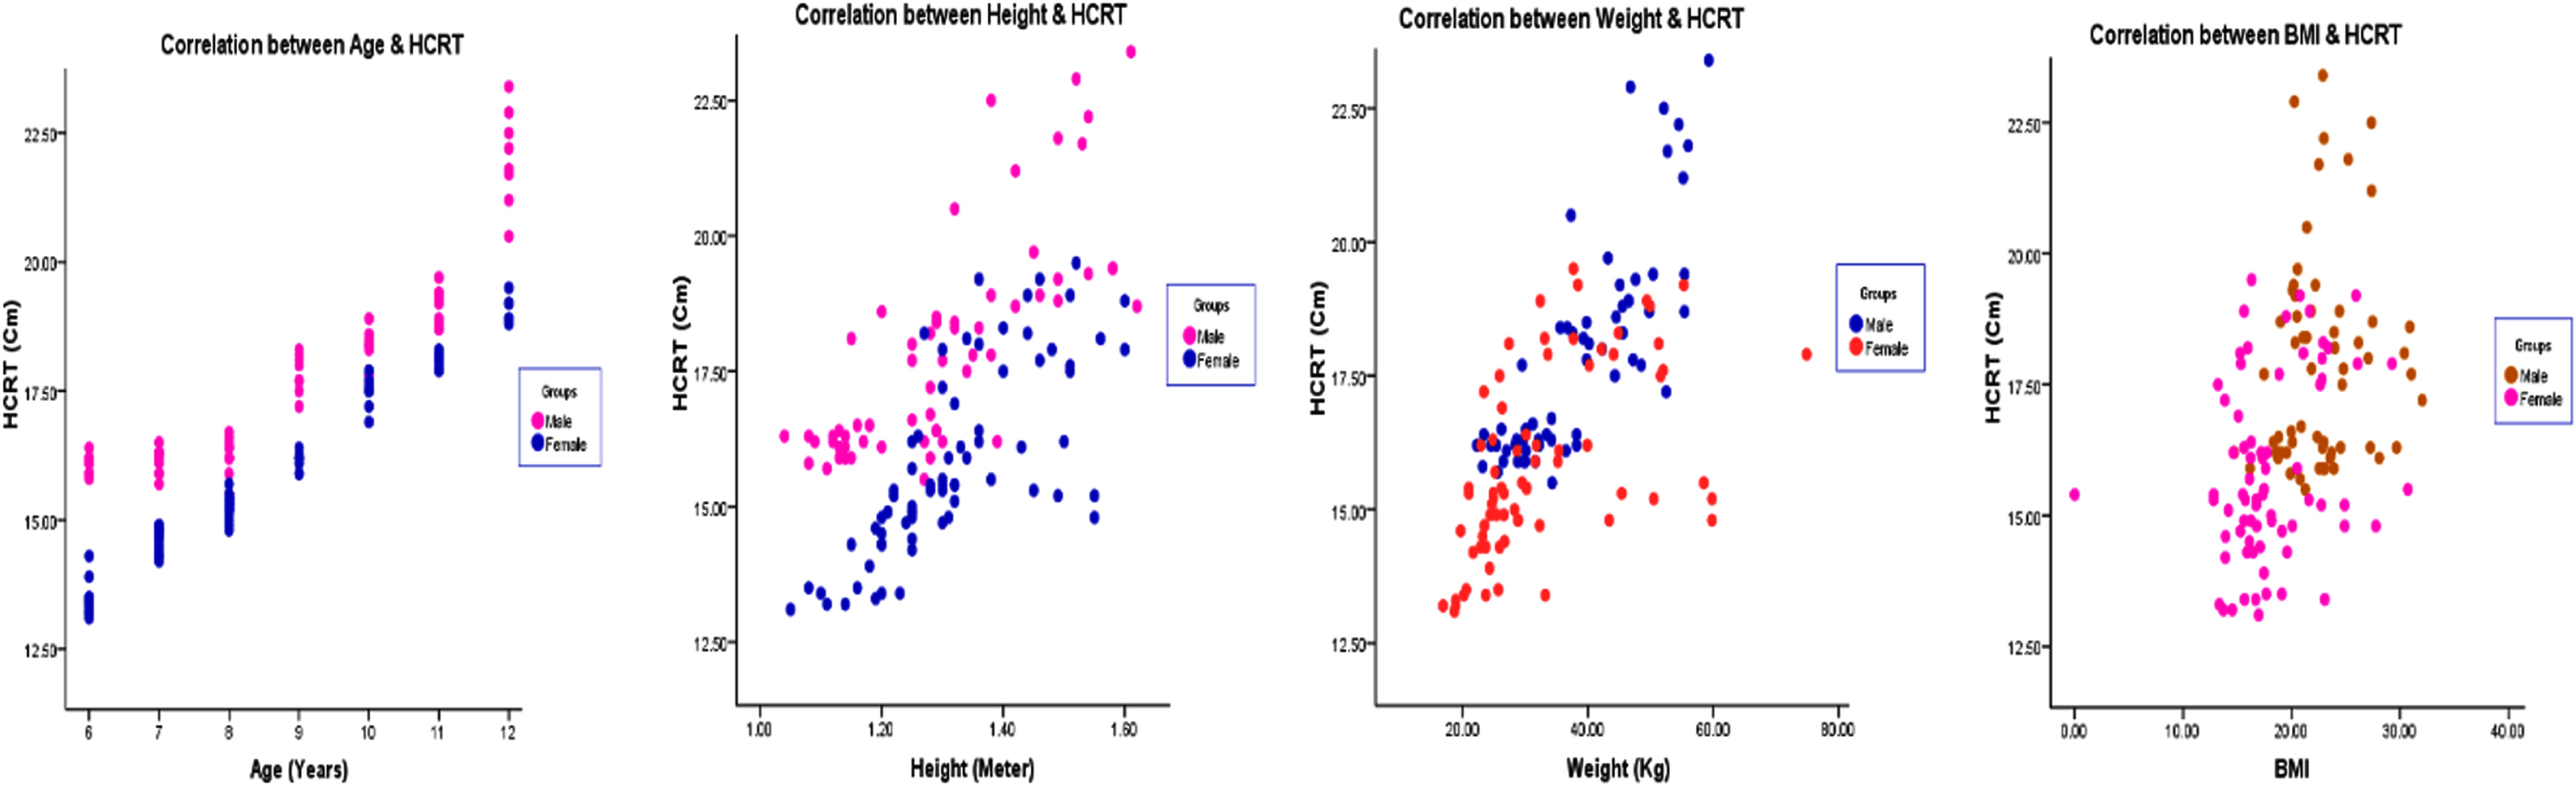
(a): Correlation of age, height, weight, and BMI with hand circumference right side among boys and girls. HCRT: Hand circumference right side.
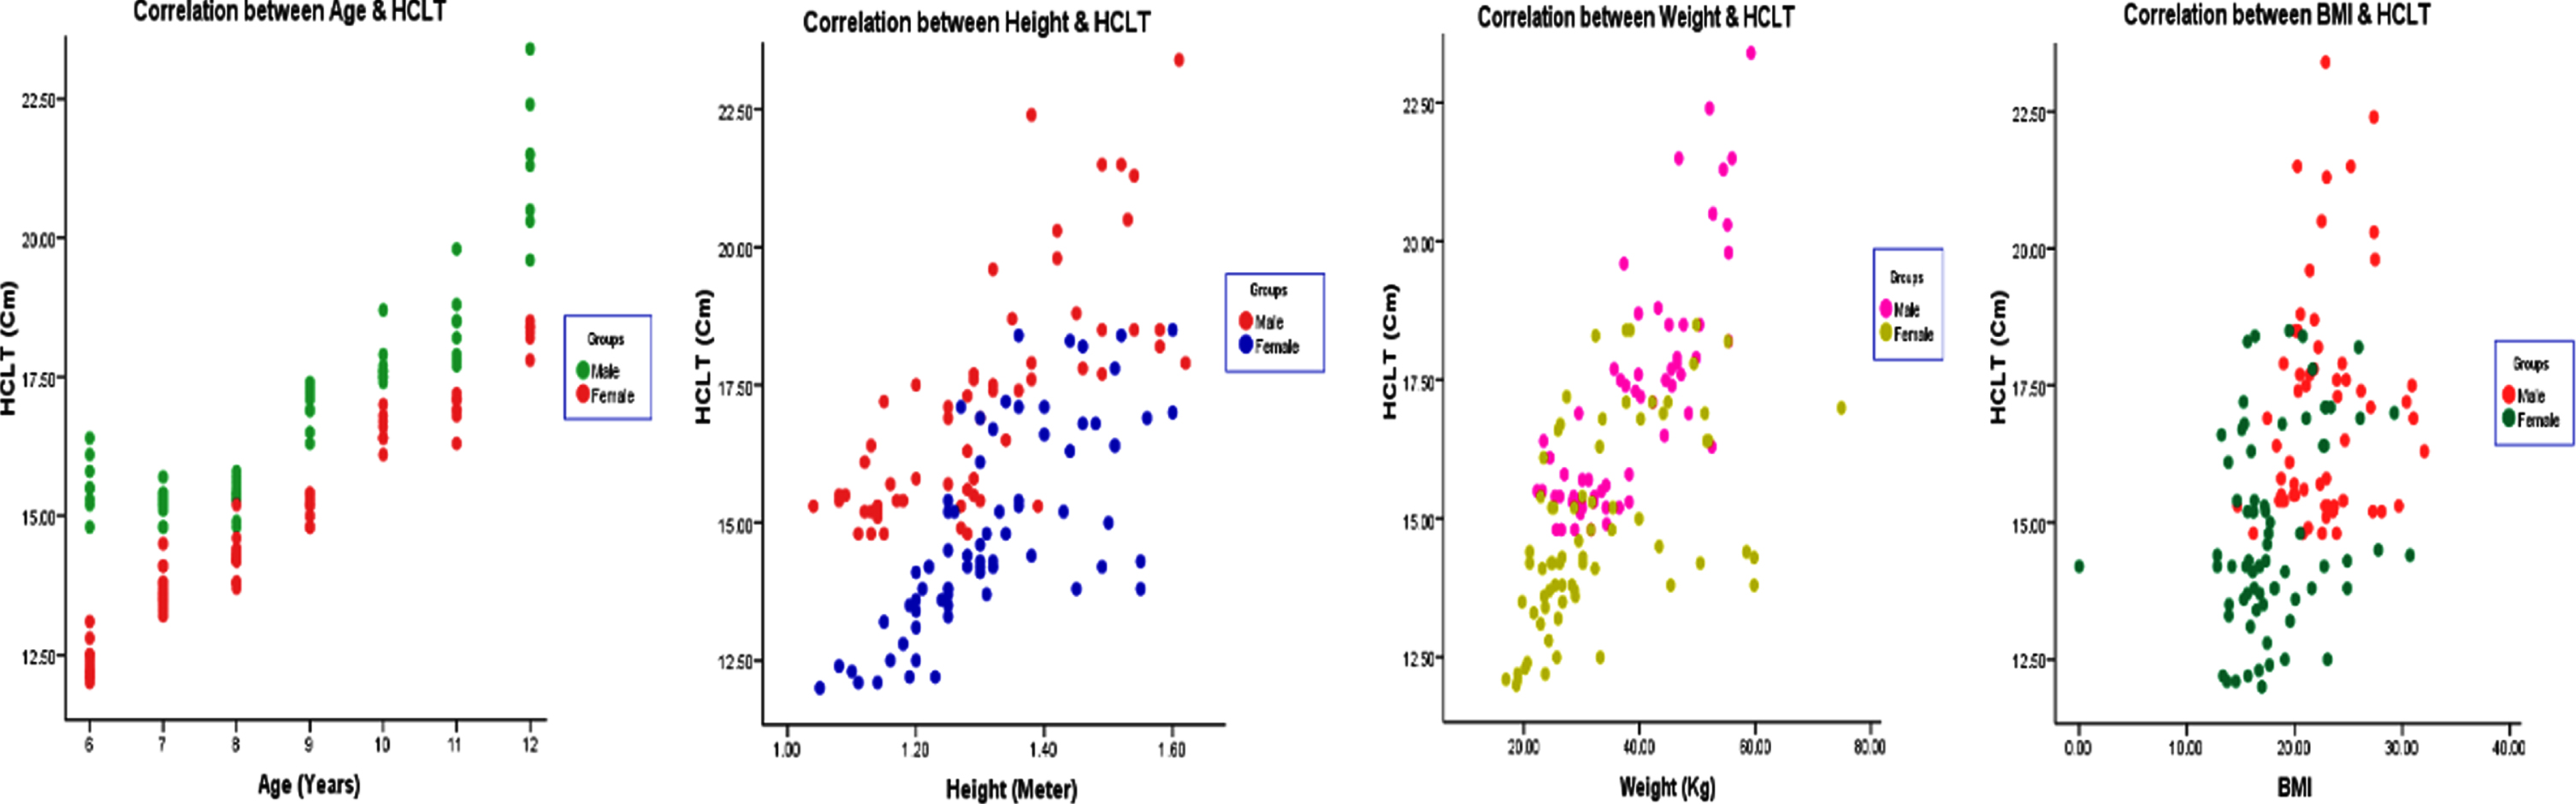
(b): Correlation of age, height, weight, and BMI with hand circumference left side among boys and girls. HCLT: Hand circumference left side.
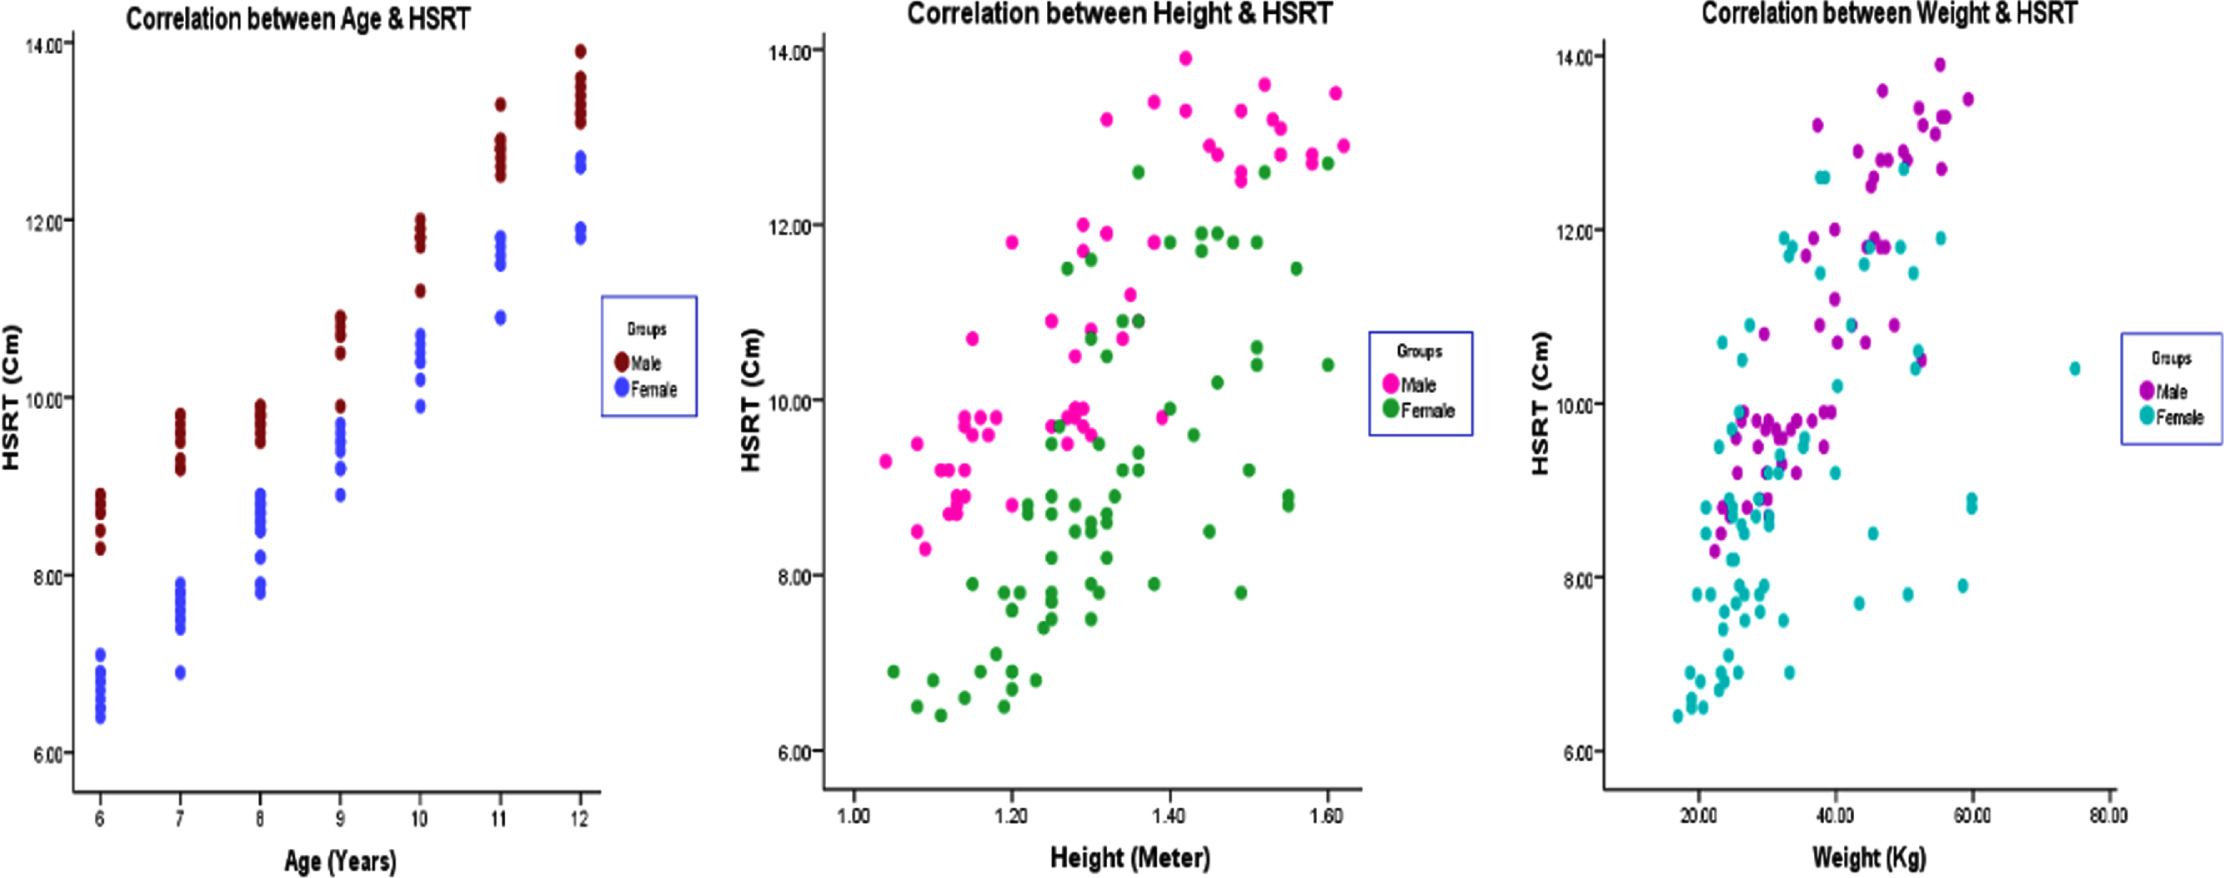
(a): Correlation of age, height, and weight with hand span right side among boys and girls. HSRT: Hand span right side.
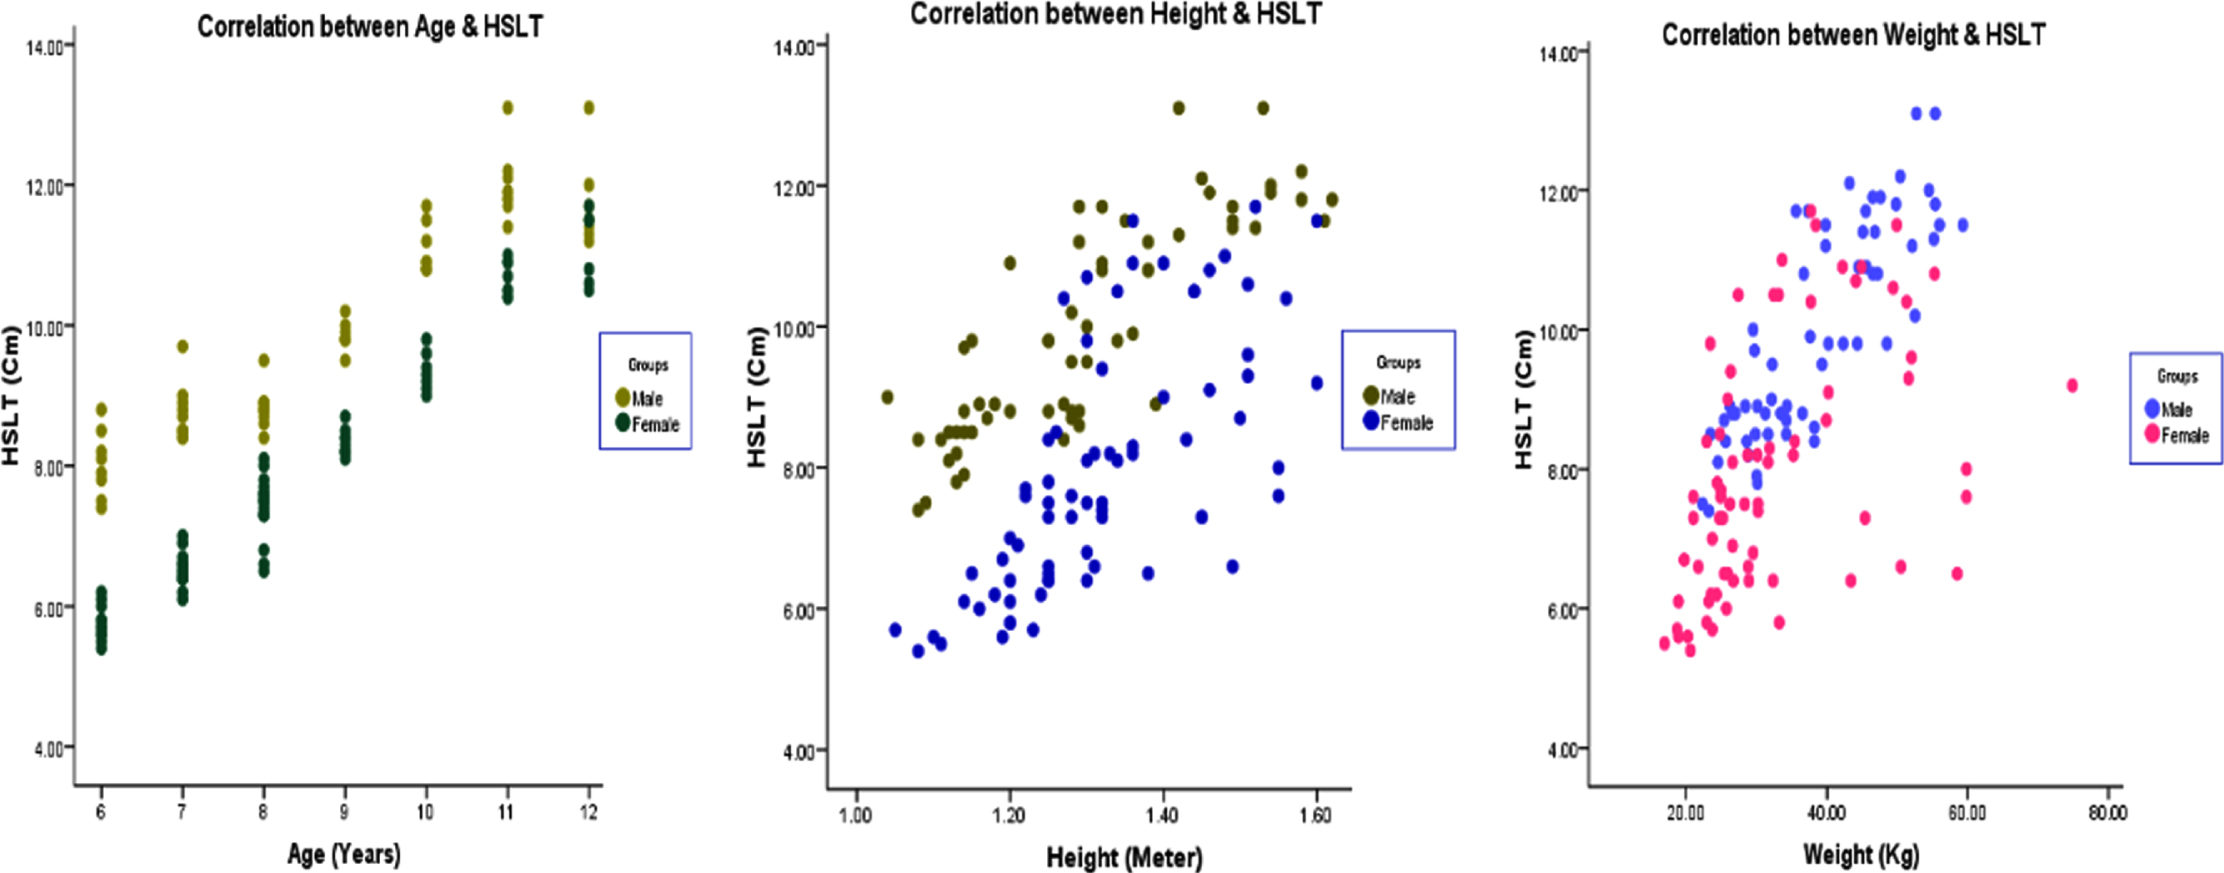
(b): Correlation of age, height, and weight with hand span left side among boys and girls. HSLT: Hand span left side.
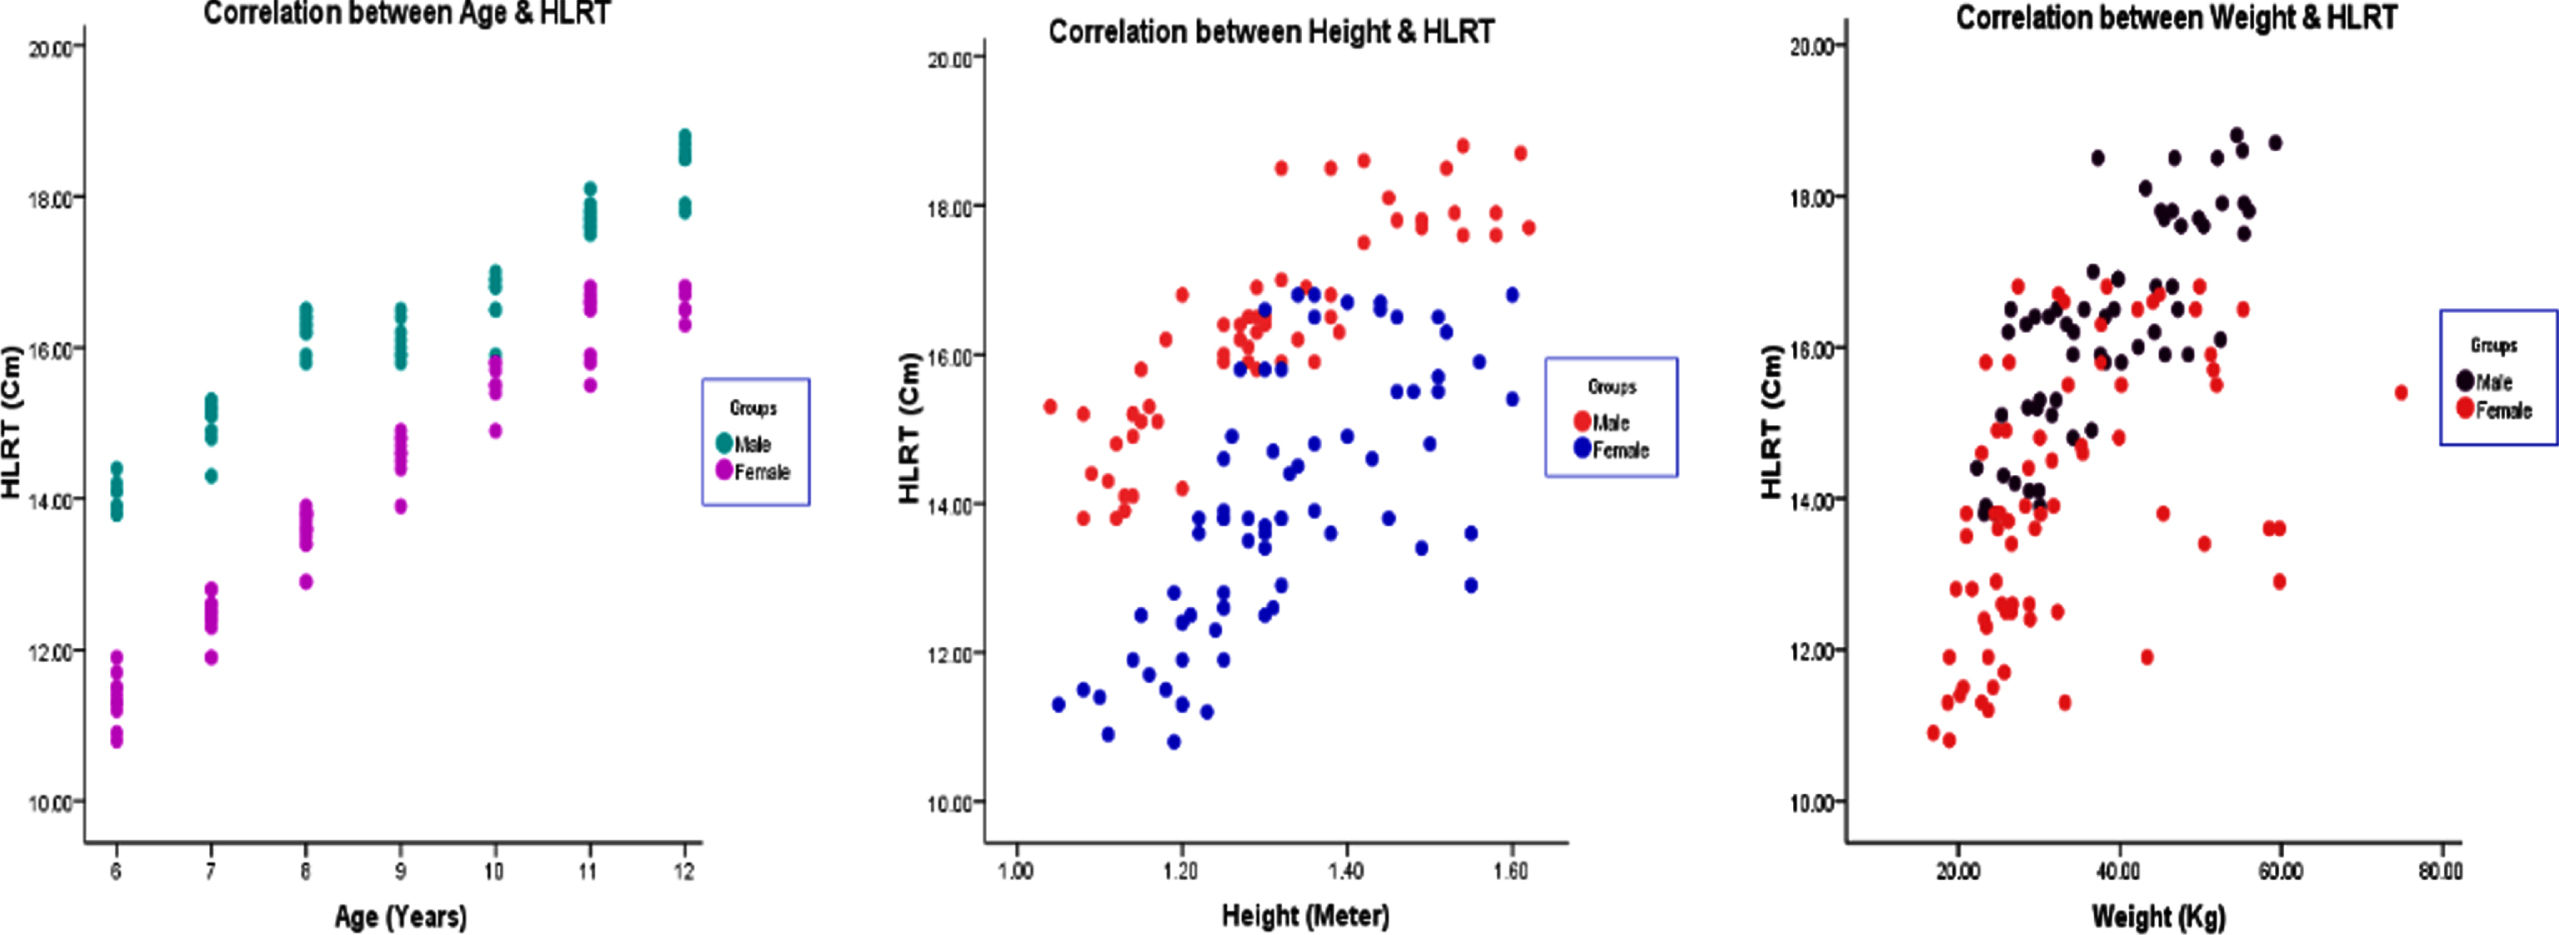
(a): Correlation of age, height, and weight with hand length right side among boys and girls. HLRT: Hand length right side.
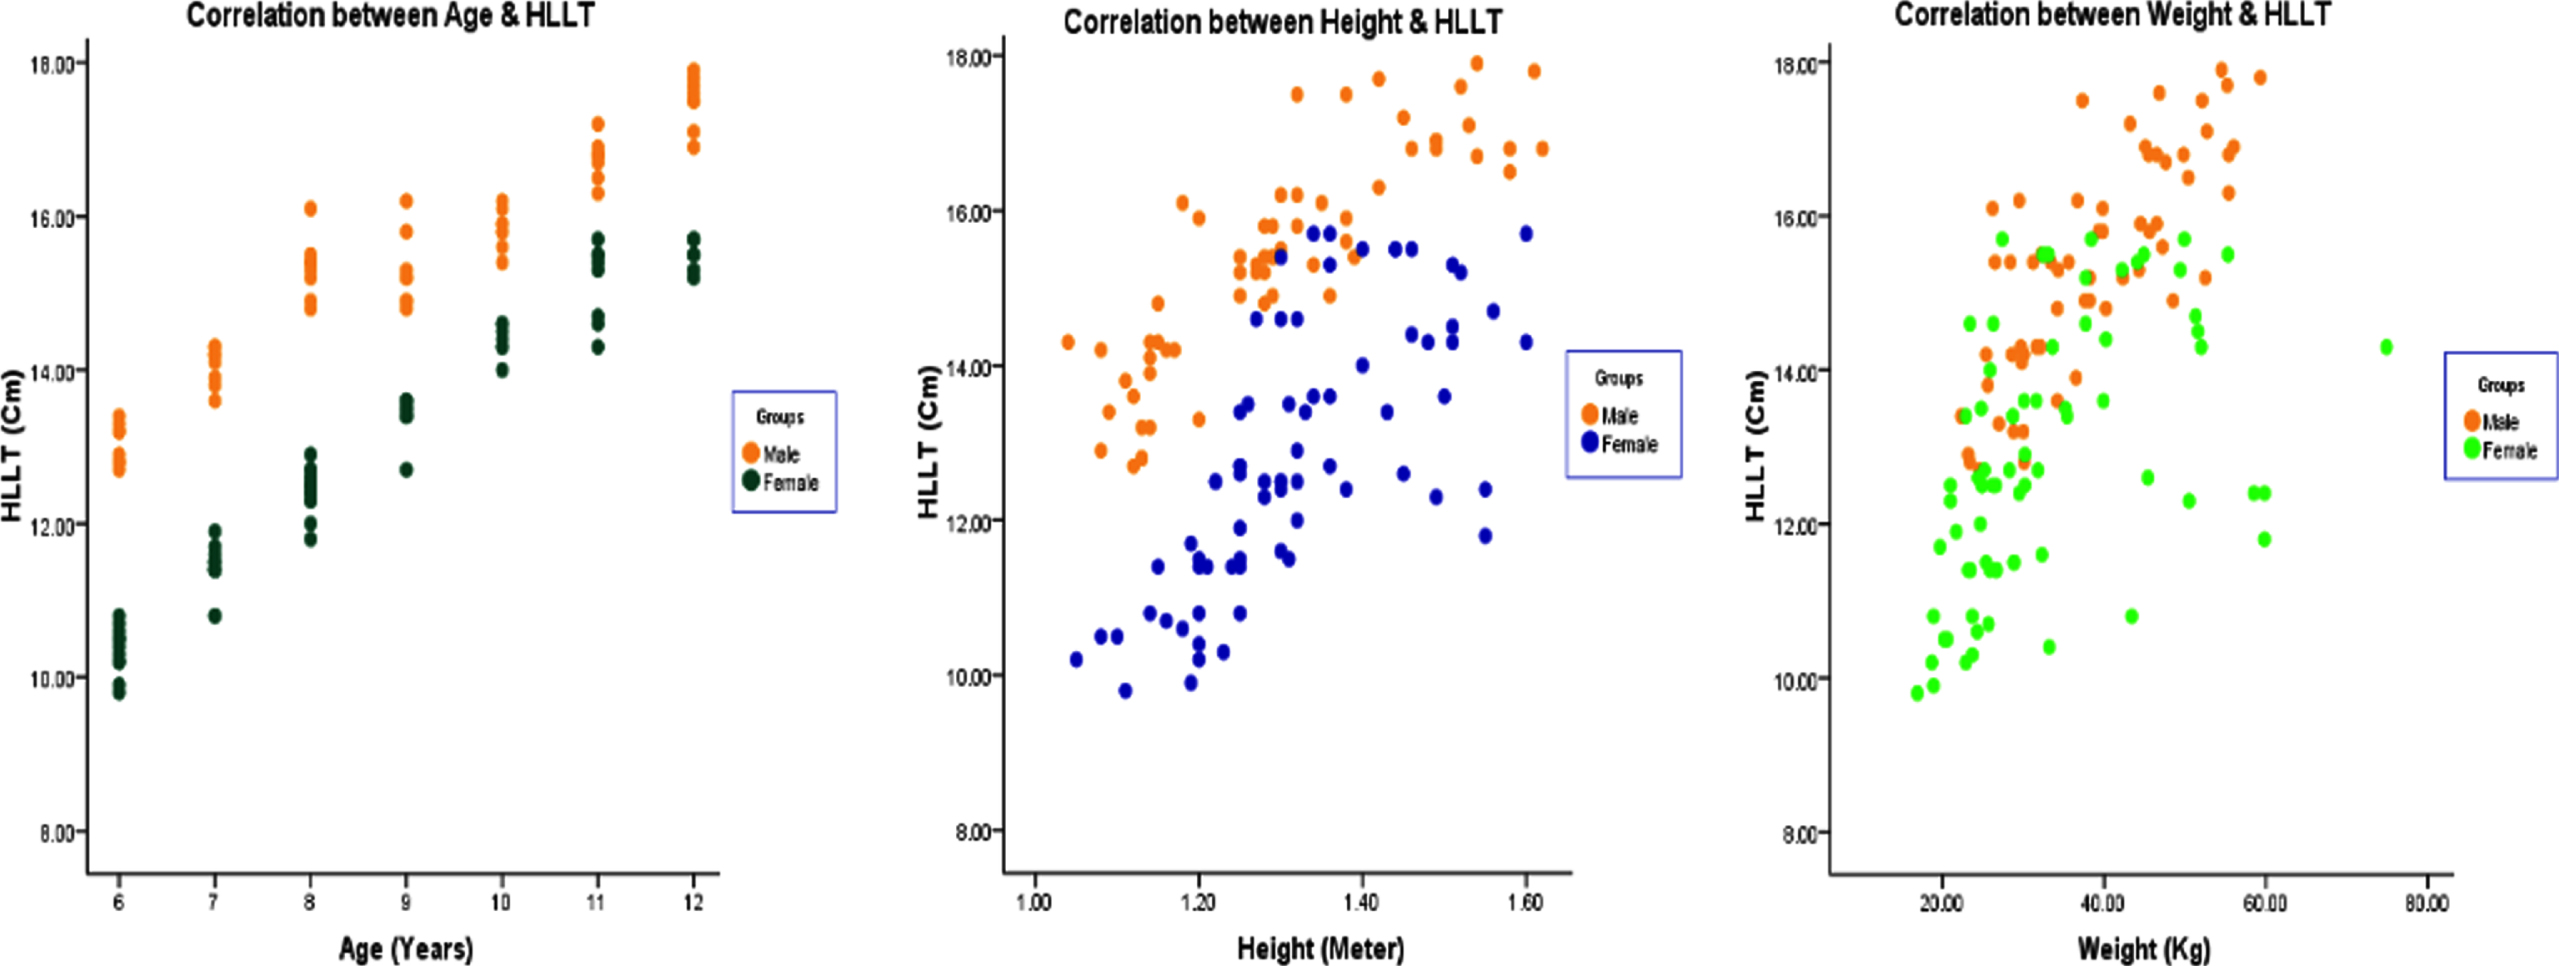
(b): Correlation of age, height, and weight with hand length left side among boys and girls. HLRT: Hand length left side.
Correlation of age, height, weight, BMI, HCRT, HCLT, HSRT, HSLT, HLRT, HLLT, DHGS, and NDHGS in (a) boys and (b) girls. Boys
Girls
BMI = Body mass index, HCRT = Hand circumference right side, HCLT = Hand circumference left side, HSRT = Hand span right side, HSLT = Hand span left side, HLRT = Hand length right side, HLLT = Hand length left side, DHGS = Dominant hand grip strength, NDHGS = Non-dominant hand grip strength. (* Significant): Significant difference (p < 0.05).
To our knowledge, this study is the first of its kind organized to analyze the demographic factors, anthropometric determinants, hand circumference, hand span, and hand length and its impact on handgrip strength in both the dominant and non-dominant hand, especially among 6–12-year-old school children, in both boys and girls.
In this study, 266 (n = 133, both right and left side) hand dimensions of school children were measured. All the hand dimensions evaluated in the present study were substantially different among right and left hands. This outcome is similar to that described in previous studies [17, 18]. Along with that, we also found a significant difference in these dimensions between both genders, and this was supported by many studies across the world [19]. In relation to hand circumference, these dimensions were less when compared to children in Iran (19.5±1.9 cm) in boys and (17.6±1.6 cm) in girls [20]; in regard to hand span, these children demonstrated lower values than children in Spain (17.8±1.5 cm) and, finally, in relation to hand length these subjects demonstrated greater measurements than children in China (14.3±10.3) and Japan (14.9±2.9) [21]. We believe that these variations in hand dimensions anthropometry in various populations is due to inconsistency in human characteristics [22].
Concerning handgrip strength, in the present study the mean grip strength in dominant hand was 21.82±9.66 and 19.43±9.25 and in non-dominant hand was 13.89±7.13 and 12.23±6.52 for boys and girls, respectively (p < 0.001). A study done by Alahmari et al. [23] in Saudi children showed a higher mean grip strength values (34.5±11.7 for boys, dominant hand; 27.3±10.0 for girls, dominant hand) than our study population. We noticed two important aspects in relation to the mean handgrip strength. First, the schoolchildren belong to Pakistan demonstrated more grip strength values than belong to other countries who are living in Saudi Arabia. Second, the magnitude of mean grip strength values in Indian population staying in India, are less than the Indian children staying in Saudi Arabia [24]. We believe that these variations were due to differences in body sizes, geographical factors, food habits, differences in societal and economical environments, etc. [25]. A recent systematic review stated that handgrip strength values in children in developing countries was less compared to those in developed countries, due to variances in body composition [26].
We also found significant difference in handgrip strength between boys and girls and between dominant and non-dominant hands and this is supported by several studies [27, 28]. Various studies suggested that these differences between both genders are mainly due to escalation in testosterone in the course of puberty [29], muscle fibers inconsistency [30], body composition [31], and excessive utilization of thenar muscles while performing daily and sports activities [32, 33]. In relation to hand dominance, a considerable difference was found between right and left hand among boys and girls, which is similar to findings in previous studies [19, 34]. These variations were believed due to greater frequency of using the dominant hand in day-to-day life activities [35, 36], and it is also the mostly used hand for strength training tasks [37].
The mean grip strength values in this population were less when matched with the population in other countries [26, 39], which indicates that grip strength showed a discrepancy in different populations. Differences in body proportions, mean height, weight, BMI, nutrition, ethnicity, hereditary aspects, environmental factors, hand dimensions, sample size, and nativity disparities may give such inter-population variances [36, 40–43].
Finally, the present study showed a significant impact of hand circumference, hand span, and hand length on grip strength in school children and was consistent with previous studies [4, 45]. Handgrip strength is one of the major components highly dependent on hand circumference [46]. Hand circumference appears to be a worthy indicator of body physique and, therefore, considered as a good approximation of physical capabilities and had a significant correlation (p < 0.001) with handgrip strength in our study and supported the findings in previous study [47]. Next is the hand span, which has a vital role and affects the grip strength measurements in our study [48]. We also observed the children with smaller hand spans had less handgrip strength than the subjects with bigger hand spans, which supported the findings in previous study [48]. Because of these variances, comparative studies in regard to measurement of hand grip strength between children and adults, this hand dimension plays an important role in affecting the outcome of maximum handgrip strength. Along with that, the hand span also has a substantial correlation (p < 0.001) with grip strength in the present research. Last, is the hand length, which is also considered as a strong predictor of handgrip strength and supported by outcomes in previous studies [49–51]. It is well-acknowledged in previous studies that persons with lengthier fingers and greater hand surfaces have more grip strength. This is possibly due to the fact that around 35 finger flexor muscles are involved in forearm and hand movements and contribute to gripping activities [52, 53]. This supports our results, which exhibited that hand length has a prominent association (p < 0.001) with handgrip strength.
Therefore, all the hand dimensions evaluated in the present study were considerably correlated with grip strength and assessment of such components, especially in children, should deliver standards for timely identification of their grip strength if it is below the anticipated value. Such children could be involved in strength training programs in order to prevent them from future restrictions or incapacities [20, 54].
This study has some limitations. First, the data were taken from only one region of Saudi Arabia; thus, more research studies from different regions should be established. Second, children aged 6–12 years only were included in the study. Third, variables such as dietary status, and physical activity levels were not studied in the present research. Therefore, a wide range of socio-cultural and economic aspects was not representative in this study. More research is nevertheless needed, ideally while using the same consistent procedures in another area of the country.
Conclusions
This study evaluated the reference values of handgrip strength of school children, both boys and girls. The handgrip strength in this population was quite less than the Western population. These variances may be due to differences in sociodemographics, anthropometric determinants and hand dimensions. In addition, gender, hand-dominance, hand circumference, hand span, and hand length can be prominent variables and significantly correlated with handgrip strength in children. Therefore, the present study provides valuable evidence that will facilitate therapists to compare the grip strength measurements with reference values according to maturity, gender, and hand dominance.
Ethical approval
The study was reviewed and approved by the Research Ethics Committee Board at, King Khalid University (ECM # 2021-5802).
Informed consent
All children and their parents signed a well-versed consent form after getting a brief explanation of the study.
Conflict of interest
None to report.
Footnotes
Acknowledgments
Not applicable.
Funding
This work was supported by the Deanship of Scientific Research, King Khalid University, Abha, Kingdom of Saudi Arabia (RGP. 2/40/42).