
Abstract
BACKGROUND:
Mining, especially underground coal mining, has always been a hazardous occupation. Injuries, including those that are fatal, are a major occupational risk that all miners have to face.
OBJECTIVE:
Despite the fact that all workers are aware of the risks, efforts must be made to increase their safety through the implementation of preventive measures.
METHODS:
This retrospective study includes injury data from all nine Serbian coal mines over a 16-year period, from 2000 to 2016. All injury data were collected from employee safety and health records.
RESULTS:
In the analyzed period, a total of 9,273 occupational injuries were recorded at Resavica. The highest number of occupational injuries (over 600) were recorded in 2008 (669), 2004 (651), and 2005 (603). The data shows that almost one fifth of the total number of occupational injuries, or 20.74%, occurred during the said three years. On average, 493.06 minor, 51.12 severe, and 1.29 fatal injuries occurred each year. Every day there were 1.29 minor occupational injuries and every seven days there was one severe injury.
CONCLUSIONS:
Despite indications that there is a connection between some of the variables and the number of injuries, the general conclusion is that injuries are accidental and unpredictable. The high percentages of injuries are due to the organization of work and the age or qualification structure of the staff and, of course, are the consequence of likelihood –the greater the number of workers, the greater the likelihood of injury. However, the present study showed that some measures can be taken to increase occupational safety and reduce the number of injuries.
Introduction
Mining has a long tradition in Serbia and the territory it occupies, from ancient times, through the Roman Empire to the rise of the Serbian Empire in the 12th century. Mining developed during the 13th century, culminating with the adoption of the first Serbian and one of the first European mining codes, the so-called “Law on Holes” by Despot Stefan Lazarević in 1412. Coal mining in Serbia began with the opening of the Senje coal mine in 1853, the Aleksinac coal mine (1883), Vrška Čuka (1884), Lubnica (1889), and others during the 19th and early 20th century. Today, there are nine active underground coal mines in Serbia (with 12 underground production units) and they all operate within the Resavica Public Company for Underground Coal Mining [1].
Coal mining has always been a hazardous occupation. The process of underground coal mining in Serbia cannot be considered modern due to the fact that the mining process still involves a high level of manual labor, as well as the fact that the mechanization and automation of the entire process are still underdeveloped. Drilling and blasting operations, the use of chain and belt conveyors for coal extraction, confined spaces with narrow corridors, high ground pressures, roof caves, presence of methane, oxidation processes in coal, and abandoned operations are often the causes of mining accidents. Fortunately, in most cases, accidents involve minor and usually individual injuries. On the other hand, Serbia has also had its share of major mining accidents, the largest of which was the mine fire in Aleksinac in 1989, which claimed 90 lives, and the 1998 methane explosion in Soko, which killed 30 people.
Injuries in the mining industry, especially in coal mining, are frequent and all miners are aware of the hazards of mining professions. However, being aware of the hazard and accepting professional risk is certainly not the best way to prevent accidents and injuries. Accordingly, it is critical to keep records of injuries, to analyze the conditions that caused the injury, and to use the collected information and the gained experience in order to prevent future injuries and loss of life. The second aspect is, of course, economic. Injuries are often globally associated with the loss of working days, wages, or productivity. The economic factor of the damage must not be neglected and should by no means be a prevailing factor when deciding on the implementation of preventive measures.
This paper presents the results of a study aimed at analyzing injury data and identifying weaknesses. The purpose of the study is the classification of injuries according to demographic, physical, and temporal parameters and the formulation of recommended preventive measures.
The Resavica Public Company for Underground Coal Mining (hereinafter Resavica) was established in 1992. Today this company encompasses the following mining complexes: “Vrška Čuka” anthracite mine in Avramica; “Ibar” coal mines in Baljevac; “Rembas” brown coal mine in Resavica; “Bogovina” brown coal mine in Bogovina; “Soko” brown coal mine in Sokobanja; “Jasenovac” brown coal mine in Krepoljin; “štavalj” lignite mine in Sjenica; “Lubnica” lignite mine in Lubnica; and “Aleksinac Mining and Construction” in Aleksinački Rudnici, which performs mining investment works in other parts of the company.
The total number of employees at Resavica as of December 31, 2018 is 3,863. In terms of occupational safety and health, underground coal mining is classified as a pit mining job. All pit mining workplaces involve the benefit of reduced years of service and earlier eligibility for retirement; specifically, depending on the severity, hazards, and harmfulness of the job, every 12 months spent in the workplace are counted as 14, 15, 16, or 18 months within the total years of insurance [2].
In addition to minor injuries, hazards and damages in underground mines can cause serious and fatal occupational injuries, work-related diseases, occupational diseases, and partial or total destruction of material property and the basic work equipment and tools.
The hazards that can cause catastrophic consequences in mines include: the presence of hazardous gases in the pit air; the possibility of outbreaks of endogenous and exogenous fires with products that endanger employees; sudden penetration of groundwater, surface water, or sludge from excavated areas; the hazard of clogged and flooded work space; drastic and frequent temperature and microclimate changes in work conditions; confined work space, under artificial and insufficient lighting, increased noise, and more.
All of the above factors are usually constantly present, so certain technical and organizational measures are required to reduce or eliminate their impact. Even if prescribed measures have been implemented, the possibility that the threat factors will have hazardous and harmful effects on employees cannot be excluded. The paper analyzes specific indicators of occupational safety and health at Resavica from 2000 to 2016.
Materials and methods
This retrospective study includes injury data from all nine Serbian coal mines over a 16-year period, from 2000 to 2016. All injury data were collected from employee safety and health records, which is the basis of workplace risk assessment. Data were collected and analyzed cumulatively and for the entire Resavica company, and they are presented in this study.
In Serbia, the records of occupational injuries are maintained by means of a special form, called the Occupational Injury Report, which is defined by the Regulation on the Content and Manner of Issuing the Report on Occupational Injury and Occupational Disease [3]. Article 2 of this Regulation defines the content of the Occupational Injury Report: information about the company; information about the employer; information about the injured person; information about the injury; information about the immediate supervisor of the injured person; eyewitness information; the finding and opinion of the physician who first examined the injured person; a health insurance company. Fill-in instructions, which contain tables (19) with codes to help adequately fill in the report form constitute an integral part of the Regulation. In accordance with the Regulation, which entered into force on January 1, 2019, a new classification method will be applied in everyday operations only for those data that can be represented by the new codes.
This paper is based on a statistical analysis of the data obtained by grouping systematized data from Resavica’s annual statistical reports on occupational injuries and the available scientific and professional papers in the field. Data from the following publications were used and processed for the paper: for the period from 2000 to 2009: Mining injuries in Serbian underground coal mines –A 10-year study [4]; from 2010 to 2015: Effects of Implementation of International Standards on Management Systems in Serbian Mining Industry [5]; from 2011 to 2015: Review of injuries in the mines of the Public Company for Underground Coal Mining, 2011–2015 [6]; and for 2016: Frequency of employee injuries in underground coal mines in Serbia [7].
The classification of occupational injuries can be made in many ways. In Serbia, the most common occupational injuries are classified by: time of occurrence, place of occurrence, sex, age, length of service, occupation, level of education, frequency of occurrence of occupational injuries in individuals, number of injuries (individual, collective or group injuries), severity of injury, injured part of the body, nature of injury, source of injury, cause of injury, manner of occurrence, etc. [8].
The paper presents data and analyzes occupational injuries by weight, age, education, work shift, and injured body part. The classification of injuries by severity is based on the number of days lost due to sick leave. Minor, severe, and fatal injuries are monitored [9], but the criteria for differentiating between minor and severe injuries are not clearly defined. For the mining industry, there is an internal agreement that any injury resulting in absence from work for more than 30 days is considered a severe injury [9]. According to the new codebook in the Decision on a unified system of codes for entering and encoding data into occupational records, item 54 for the assessment of the severity of occupational injuries lists the following: (1) minor, (2) severe, and (3) fatal.
Occupational injuries by age group were classified into four groups of ten years each. The first group of workers is aged from 21 to 30, the second from 31 to 40, the third from 41 to 50, and the fourth from 51 to 60.
Occupational injuries according to the level of professional education of the injured workers are classified into: level 1 (NK) –low-skilled worker (primary education); level 2 (PK) –semi-skilled worker (vocational training of one to two years); level 3 (KV) –skilled worker (three-year secondary vocational education); level 4 –secondary education (four years of secondary vocational education); level 5 (VKV) –highly skilled worker (professional or specialist five-year education); levels 6, 7, and 8 (VSS) –college or university degrees (three-year college, bachelor, specialized, master, or doctoral studies). According to the Decision on a unified system of codes for entering and encoding data into occupational records [10], the codes of professional education levels shown in Table 1 apply.
Level of education index
Level of education index
Depending on the work shift, occupational injuries at Resavica are classified into injuries that occurred in the first, second, and third shift. The first shift lasts from 7 am to 3 pm, the second from 3 pm to 11 pm, and the third from 11 pm to 7 am.
There are many classifications of occupational injuries according to the injured part of the body. At Resavica, the basic classification of occupational injuries according to the injured part of the body is applied: head, eye, ear, and face; internal organs; upper extremities; lower extremities; chest, neck, back; and more. Table 2 shows a new coding method for the injured part of the body [11], which are in line with the previous method of recording injuries in this company.
Summary –Codes for the injured parts of the body
*(Source: Table 17, pp. 28–29, Decision on a unified system of codes for entering and encoding data into occupational records).
The data on the injured parts of the body are indicators of the exposure of individual parts of the body to the risk of injury, which is expressed as a percentage of the proportion of injured body parts in relation to the total number of injuries. According to a study by a group of authors from Croatia, the following order of occurrence of injury to body parts was determined: the most frequently injured are the arms, the legs, the head, the torso, and the neck. This sequence of injuries to body parts represents the exposure of those parts of the body to the sources of injury, i.e. reveals which parts of the body are most susceptible to injury. The authors presented the most commonly injured body parts as percentages (%) of the total number of injuries, using a graphical illustration of an average person [12]. They represented the injured body parts (head, neck, torso, arms, and legs) in the form of rectangles of corresponding surfaces (Fig. 1). This graphical representation of the relative ratios of the frequency of injuries to body parts is based on the approximate ratios of the corresponding body parts in an average person.
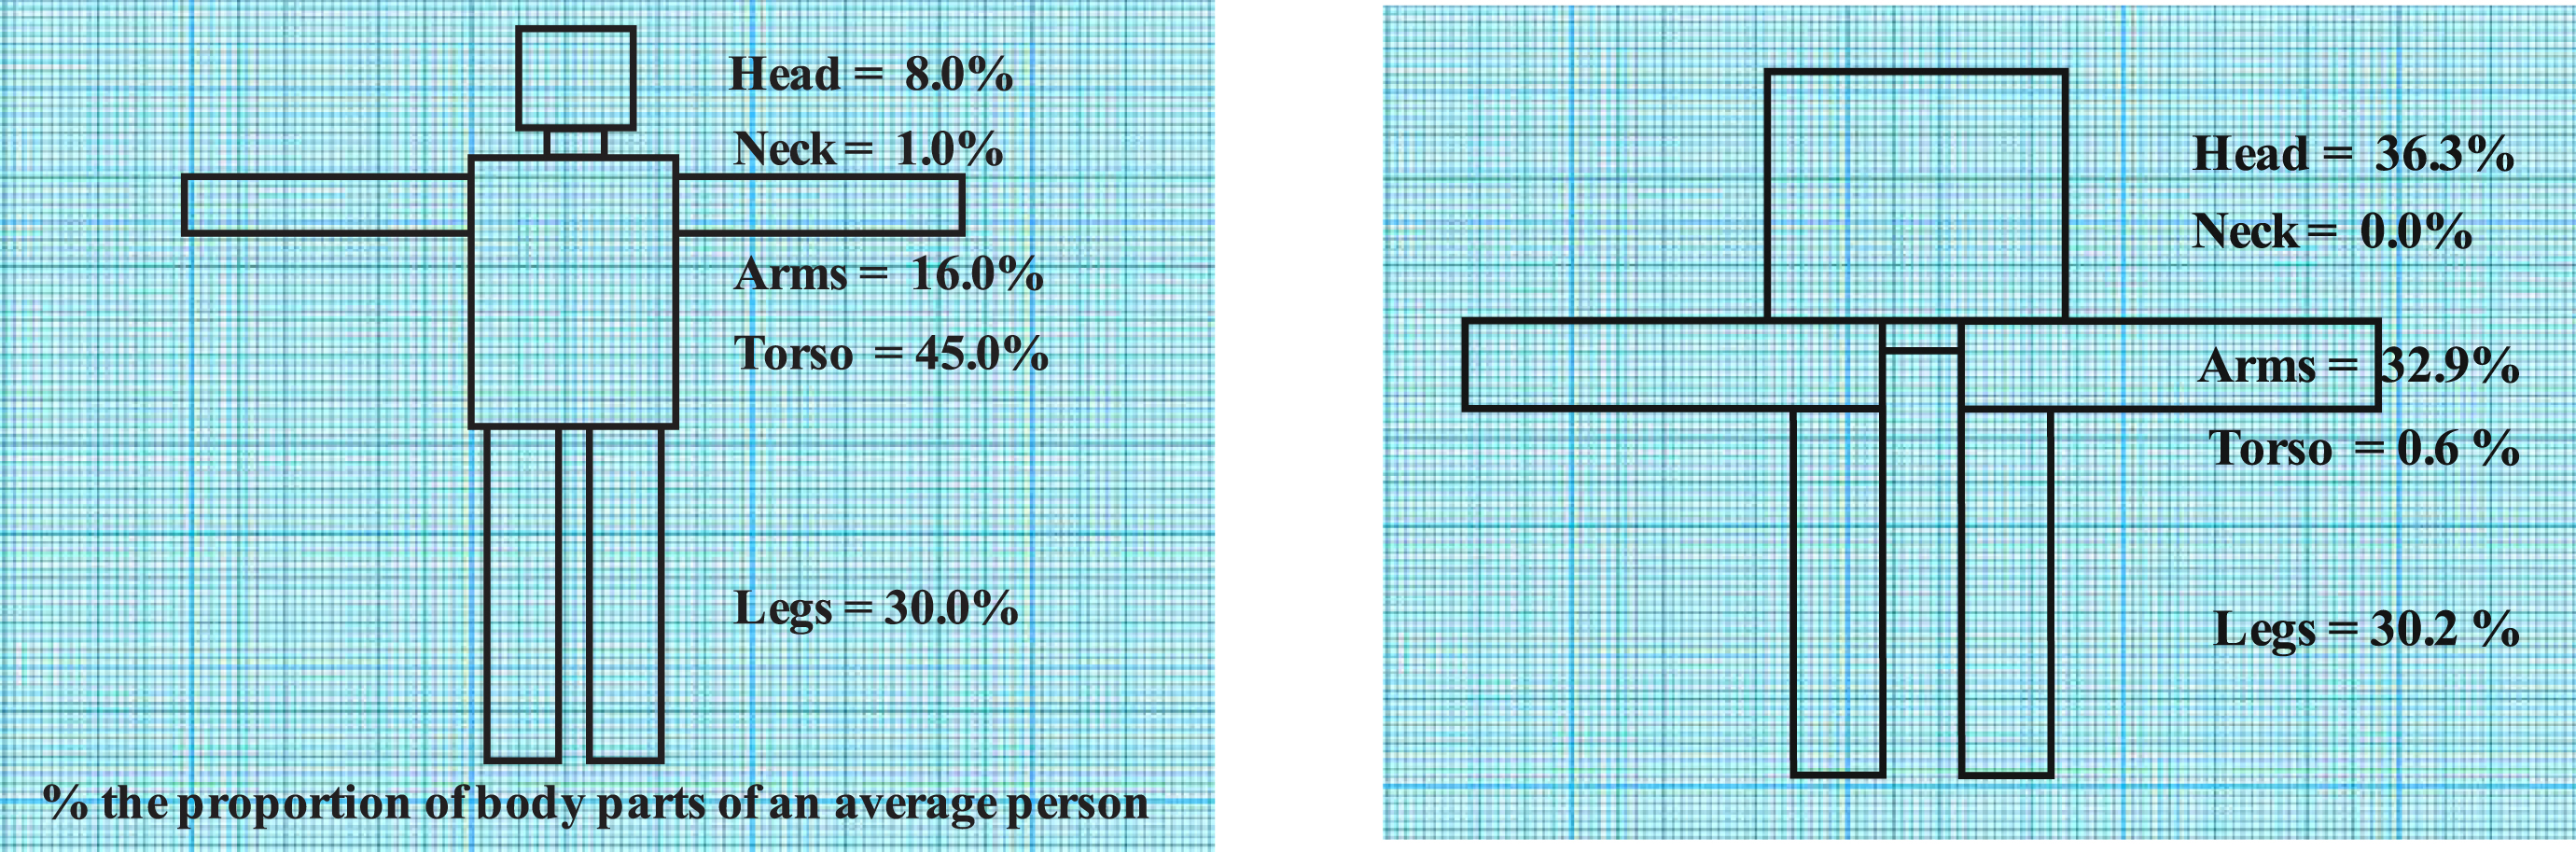
Schematic representation of the proportion of body parts (in%) of an average person and a representation of the proportion of injured body parts of underground coal miners.
The classification of occupational injuries by severity into minor, severe, and fatal is shown in Table 3 [4, 7]. In the analyzed period (2000 to 2016), a total of 9,273 occupational injuries were recorded at Resavica. The number of occupational injuries ranged from 405 in 2016 to 669 in 2008. The highest number of occupational injuries (over 600) was recorded in 2008 (669), 2004 (651), and 2005 (603). The data lead to a conclusion that almost one fifth of the total number of occupational injuries, or 20.74%, occurred during the said three years. The lowest number of injuries (below 500) was recorded in 2016 (405), 2014 (435), and 2015 (496). On average, 493.06 minor, 51.12 severe, and 1.29 fatal injuries occurred each year. Every day there were 1.29 minor occupational injuries and every seven days there was one severe injury. The trend line of the total number of occupational injuries shows a negative trend, which means that the number of occupational injuries in this company gradually decreases over time (Fig. 2).
Number of occupational injuries by severity at the Resavica mining company from 2000 to 2016
Number of occupational injuries by severity at the Resavica mining company from 2000 to 2016
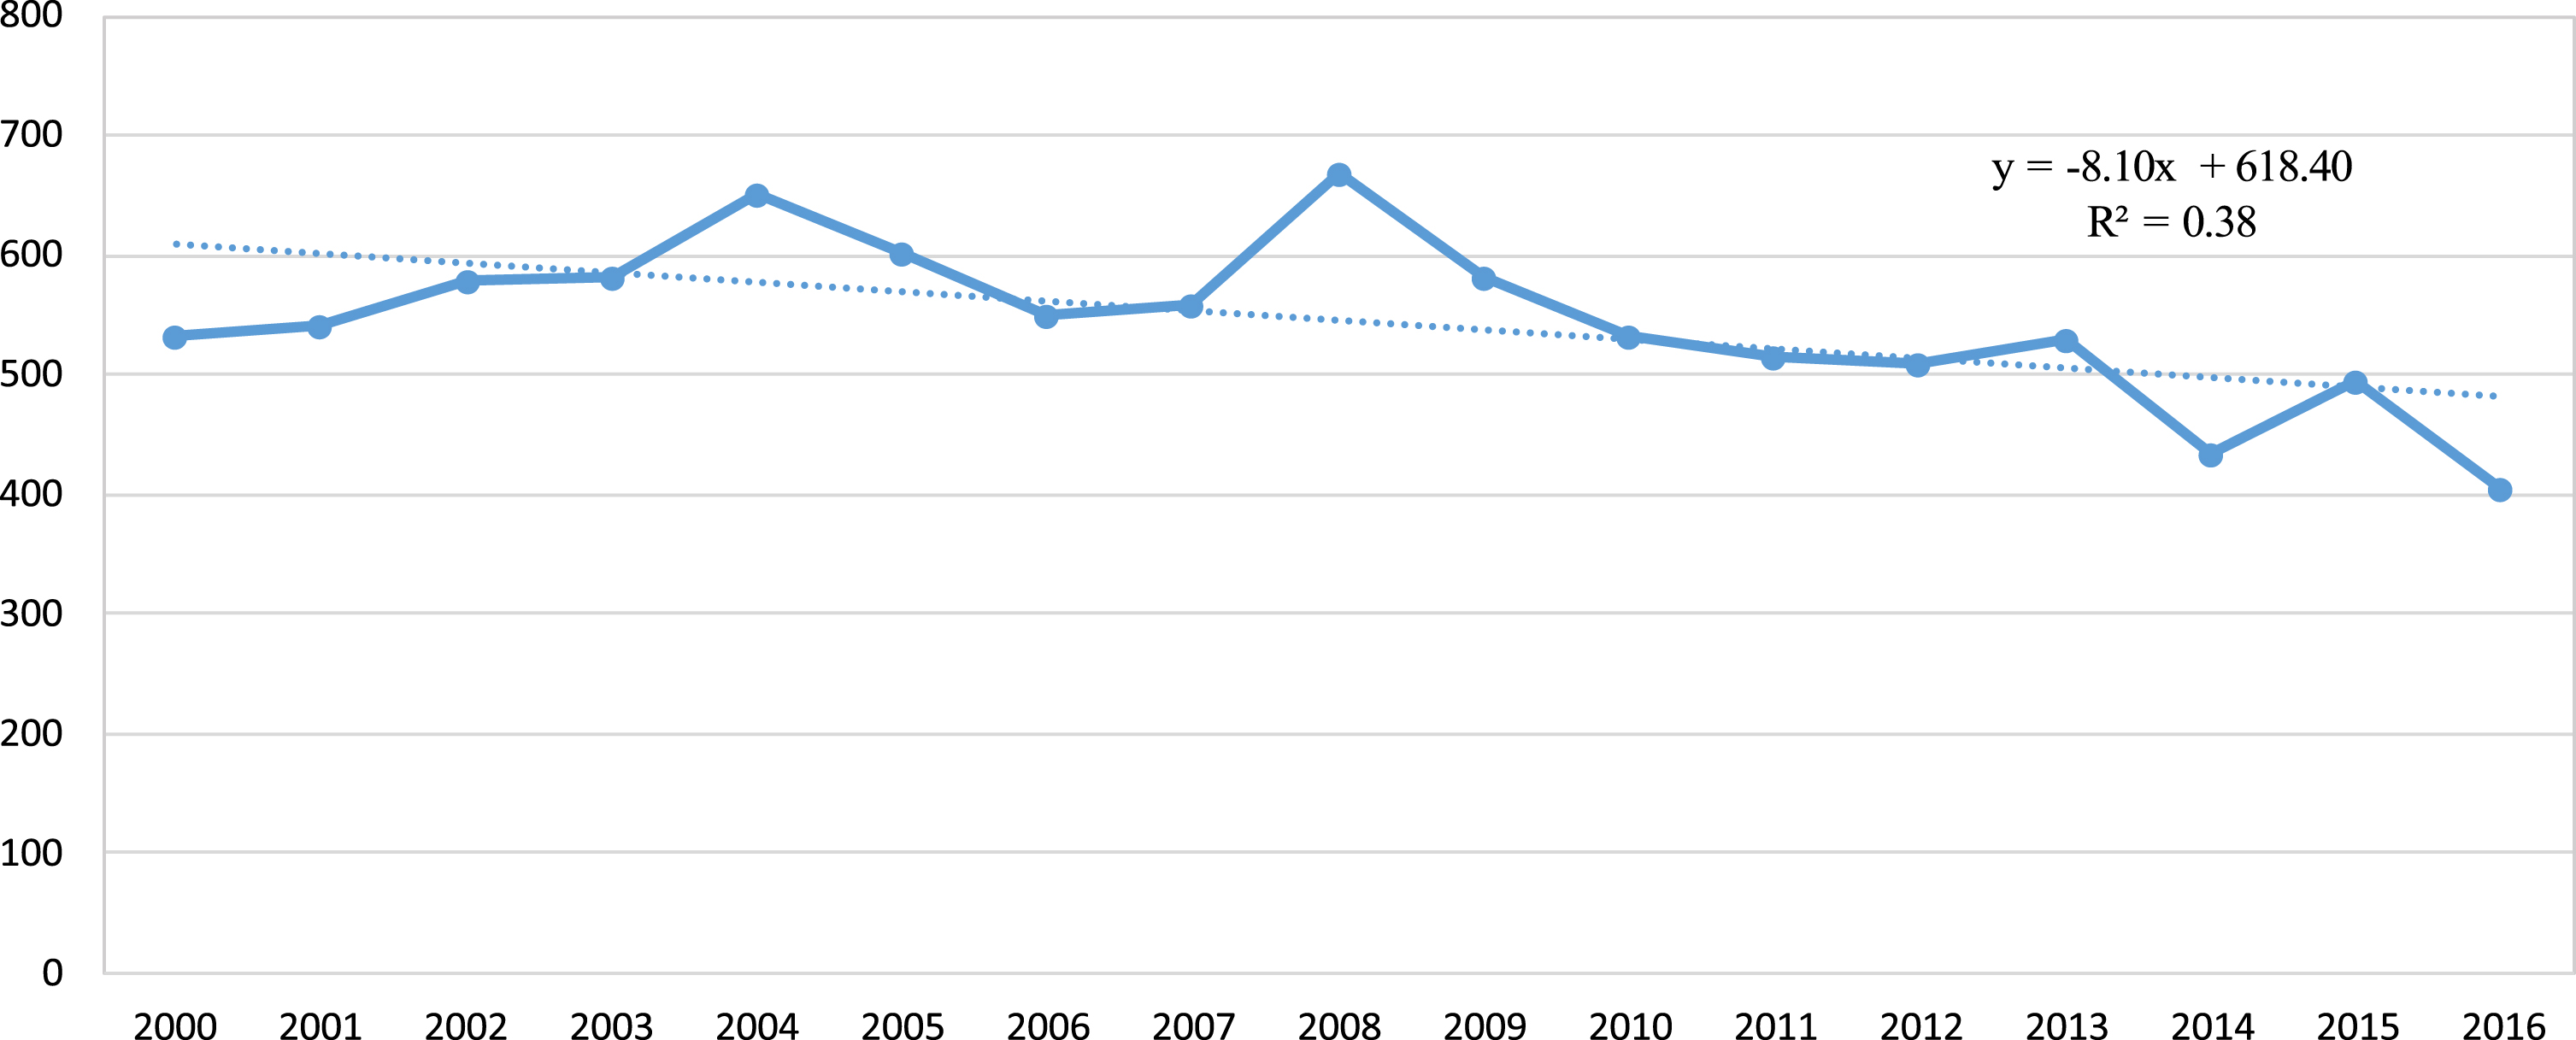
Trend of the total number of occupational injuries at the Resavica mining company from 2000 to 2016.
Regarding the share of the number of occupational injuries according to their severity in the total number of injuries in the observed period, minor injuries accounted for the largest share with 90.39%, severe injuries with 9.37%, and fatal injuries with 0.24%.
An overview of the number of occupational injuries by age groups of injured workers at Resavica from 2000 to 2016 is shown in Table 4.
Number of occupational injuries by age groups of injured workers a thet Resavica mining company from 2000 to 2016
Considering the absolute values of this indicator by age groups and years of occurrence, the following can be observed: in the age group from 21 to 30, the fewest occupational injuries (81) occurred in 2016. The highest number of injuries was recorded in 2004 when 194 occupational injuries occurred. In the age group from 31 to 40, the lowest number of injuries was also recorded in 2016, when 142 injuries occurred, and the highest number of injuries was recorded in 2008, when 249 injuries occurred. The number of occupational injuries in the 41 to 50 age group ranged from 123 injuries in 2003 to 217 in 2008. In the age group from 51–60, the number of injuries ranged from 30 injuries in 2006, 2007, and 2008 to 64 injuries recorded in 2013.
Considering the share of the number of occupational injuries according to age groups of injured workers, it can be seen that the age group from 31 to 40 has the largest share, which accounts for 35.48%of the total number of recorded injuries. A total of 2,751 injuries occurred in the 41–50 age group, or 29.67%of the total number of injuries. This is followed by the 21–30 age group, for which 2,422 occupational injuries were recorded in the surveyed period, i.e. this group has a 26.12%share in the total number of injuries. The lowest share in the total number of occupational injuries was determined for the oldest workers, aged 51 to 60, with a total of 810 injuries or 8.74%.
The number of occupational injuries according to the level of professional education of the injured workers in the analyzed period is shown in Table 5. With regard to the maximum and minimum number of occupational injuries by level of education and by year, the observed seventeen-year period is characterized by the following facts: for low-skilled workers (code 10), the highest number of occupational injuries was 253 in 2002, and the lowest in 2016, with 143 injuries; for semi-skilled workers (code 20), the highest number of injuries was recorded in 2008, when it amounted to 164 injuries, while the fewest injuries were recorded in 2015, when there were 72 occupational injuries; the highest number of occupational injuries of skilled workers (code 30) was recorded in 2003, and the lowest in the final observed year, when 177 occupational injuries were recorded. These high values are followed by occupational injuries in persons with higher levels of education, who sustained a significantly lower number of occupational injuries. During 2006, 2015, and 2016, the highest number of occupational injuries occurred among highly skilled workers, workers with secondary school, and university level workers: code 50 –22 injuries; code 40 –19, and code 71 –only 4 injuries. The minimum number of occupational injuries for these three education levels occurred as follows: for code 50, four injuries were recorded in 2016; for code 40, five injuries in 2009; and for code 71, no occupational injuries were recorded in 2000. When summarizing these facts, it can be hypothetically concluded that the reason for such a factual situation is that workers with lower levels of education perform extremely difficult jobs under arduous and high-risk work conditions and that they constitute the majority in the total number of employed workers. It is interesting to note that four injuries were recorded for workers with a university degree in the final observed year, which should be further investigated.
Number of occupational injuries by level of education of injured workers at the Resavica mining company from 2000 to 2016
Number of occupational injuries by work shift of injured workers at the Resavica mining company from 2000 to 2016
The presented data provide an insight into the percentage of occupational injuries depending on the level of professional educational of employed workers: a total of 3,650 injuries occurred in workers with a level 3 education (code 30), i.e. an average of 214.71 injuries were recorded each year. The share of these workers in the total number of recorded injuries is 39.36%. Elsewhere, there are workers with completed level 1 education or no formal education at all (code 10) with 3,463 recorded injuries or 203.71 injuries per year on average. In terms of their share, injuries to these persons rank second and their share is 37.34%. It is interesting to note that these two levels alone account for 76.7%, whereas the other four levels make up only 23.3%. The least injured were the workers with level 7-1 education (code 71), i.e. higher education, whose share in the total number of injuries is only 0.37%. They are followed by the workers with secondary education levels, level 5 (code 50) and level 4 (code 40) with 1.97%and 2.39%, respectively.
In 2008, the largest number of occupational injuries (300) occurred during the first shift, which constitutes 44.84%of the total number of reported injuries in that year. In the second shift, the highest number of occupational injuries occurred in 2004 (229), or 35.18%of the total number of injuries recorded in that year. The highest number of injuries that occurred in the third shift was recorded in 2008 (156), with a share of 23.32%.
Analysis of the total number of occupational injuries by work shift revealed that the scenario is identical. Most workers sustained injuries during the first shift, 4,123 (44.46%), then during the second shift, 3,051 (32.90%). The lowest number of occupational injuries was recorded during the third shift, when a total of 2,099 injuries (22.64%) occurred.
Occupational injuries according to the injured part of the body are of particular importance for the analysis of occupational health and safety, because they can result in lost working days and potentially escalate to cause disability of the injured workers. Table 7 provides an overview of work-related injuries by injured body part at Resavica from 2000 to 2016.
Number of occupational injuries by injured part of the body of injured workers at Resavica mining company from 2000 to 2016
Codes: 11 –Head; 12 –eye; 13 –ear; 14 –face; 40 –internal organs; 50 –upper extremities; 60 –lower extremities; 41 –chest, 20 –neck; 30 –back; and 99 –other.
According to absolute indicators, it can be concluded that in 2008 and 2004, the majority of occupational injuries were of the upper (258) and lower extremities (217). For these injured parts of the body, the smallest number of injuries was recorded in 2016, when 155 upper extremity injuries and 140 lower extremity injuries occurred. These were followed by head injuries in 2009 with 63 recorded cases, chest, neck, and back injuries in 2005 with 57 cases, and 50 cases of eye, ear, and face injuries in 2010. In the observed period, the number of internal organ injuries was the lowest, with a maximum of 11 in 2002, while in 2011 no such injuries were recorded.
In order to graphically represent the injured body parts (Fig. 3), the data from Table 7 were regrouped and recalculated (Table 8). The head data incorporate the data for head, eye, ear, and face injuries, while the torso data incorporate the data for injuries to internal organs, breasts, the back, and other parts. The chest, neck, and back data were redistributed based on experiential data so that chest and back injuries account for 5%of total injuries combined with injuries to the torso and neck injuries account for 0.8%of total injuries in workers in underground coal mining.
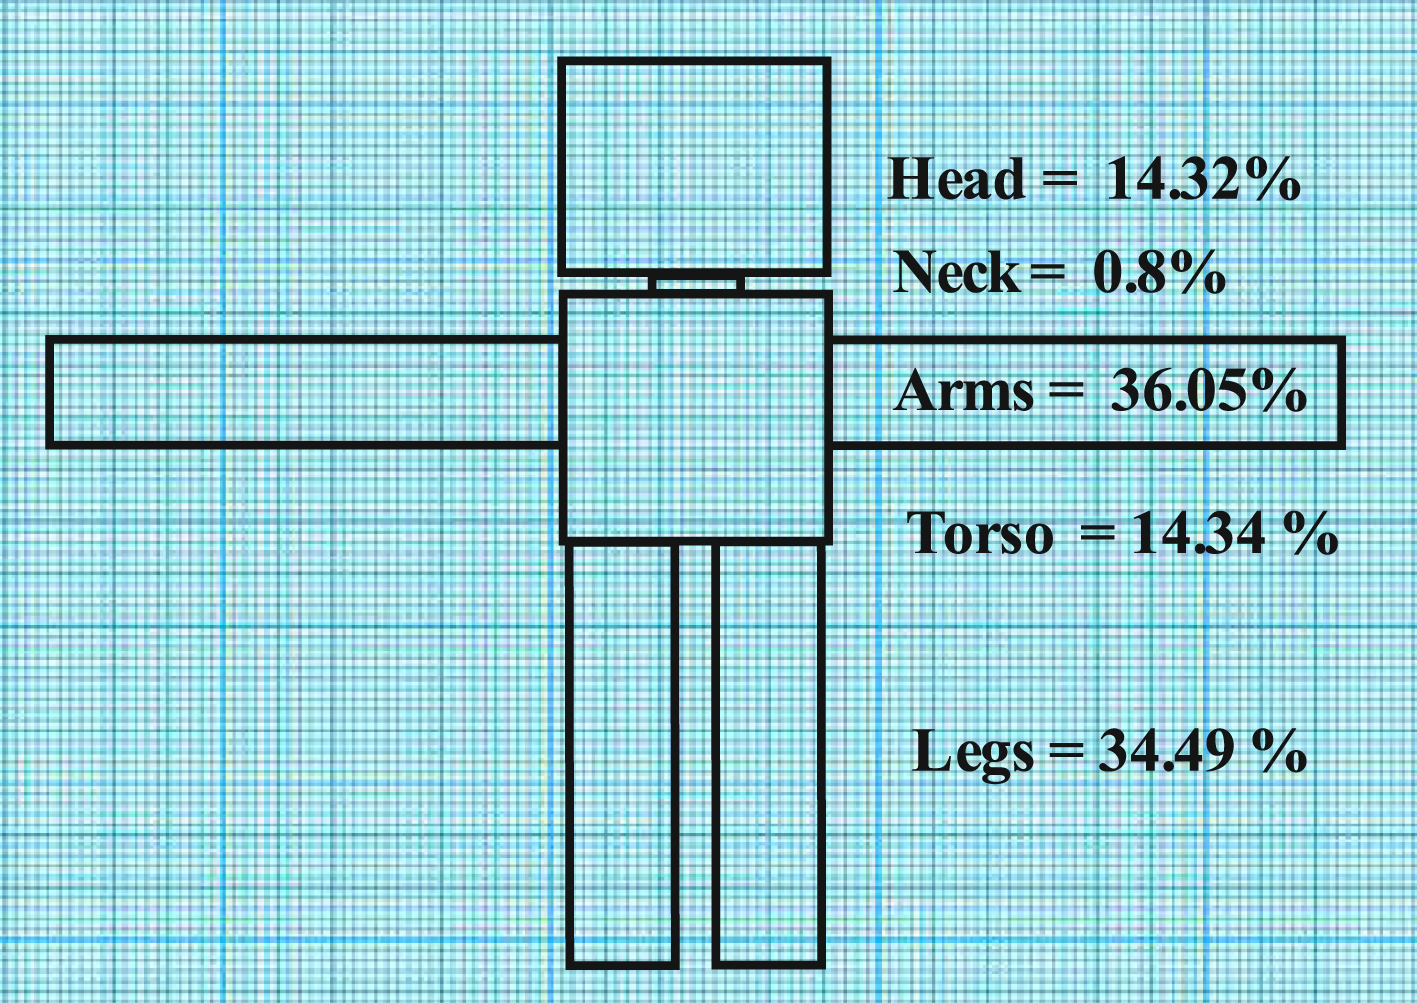
Schematic representation of the proportion of injured body part (in %) to the total number of occupational injuries among workers at Resavica mining company from 2000 to 2016.
Share of injured body part in the total number of injuries
The analysis of the results obtained for occupational injuries in relation to the injured body part at Resavica revealed that 36.05%and 34.49%of the workers in underground coal mining most often injure their arms and legs, followed by the torso (14.34%), the head (14.32%), and the neck (0.8%). These data indicate that special attention should be paid to the protection of the upper and lower extremities.
The results presented in this study probably do not reflect the actual situation in underground coal mines in Serbia. The number of injuries is probably higher, but fortunately these are mostly minor injuries. Numerous minor injuries, such as minor cuts and bruises (mainly finger injuries and usually among the youngest workers), are never reported to the safety and health department. If these injuries were included in the report, they would change the percentage of the distribution of injuries, resulting in a lower proportion of fatal and severe injuries in the total number.
The age of injured workers is an important indicator of the frequency of occupational injuries in underground coal mining in Serbia. As expected, the youngest workers had the highest injury rate per 100 workers per years observed. This rate is probably even higher, as younger workers rarely report minor injuries such as cuts and bruises to the safety and health department.
The injured part of the body is also a significant indicator of occupational injuries in underground coal mining in Serbia. As expected, the extremities have the highest percentage of injuries. Upper limb injuries are mainly due to contact with machinery, especially belt and chain conveyors. The analyzed reports do not specify the injured part of the upper limbs, but it is assumed this is usually a hand or a finger. Lower extremity injuries are mainly caused by kneeling on an object, stepping into cavities, or contact with machines, especially being pulled into a chain conveyor. As with upper limb injuries, reports do not specify a limb injury any further, but it is a logical assumption that it is a toe, a foot, an ankle, or a knee. Head injuries are mainly due to falling objects (e.g. coal from the roof). Injuries to internal organs need to be noted for their severity. These injuries are mainly due to the collapse of the mine, when a worker is buried under a pile of coal. Another cause is a fall from specific altitude. In both cases, injuries to internal organs are combined with fractures and other types of trauma. The most common cause of back injury in mines is the lifting of heavy objects, such as parts of explosive magazines. The analyzed reports provide combined data for eye, ear, and facial injuries, but it is interesting to track only injuries to the eye. From these reports, it is impossible to determine how many eye injuries resulted in vision loss (treated as a disability) and how many were caused by foreign objects (minor injuries). It should be noted that this classification is not complete. Efforts should be made to cover multiple categories, especially for injuries to the limbs, eyes, and ears.
Injury time and work shifts are also key indicators in predicting the possible occurrence of injuries to miners. According to the human biological clock, night time is a time for rest. Therefore, loss of attention and concentration, fatigue, drowsiness, and similar conditions are normal occurrences during night shifts. It was therefore surprising to learn that most injuries occurred during the first (morning) shift. The first shift has the largest number of employees, because all staff (management, control, technical staff, etc.) are present. However, additional workers primarily perform administrative or office tasks on the surface and cannot contribute to the high percentage of morning shift injuries. The reason for this discrepancy between damage percentages of different shifts is the very organization of work in the mines. The first shift has the highest frequency of work and mining operations. In addition, all regular and service maintenance is performed during the first shift, allowing the second and third shifts to operate without delay and interruption.
The qualification structure and level of education can also influence the incidence of injuries. Despite the common belief that highly educated staff will be more aware of the situation and recognize the potential hazard, a conclusion, supported by analysis and calculation of injury rates, can be drawn that injuries are incidental, regardless of education. The distribution of the number of injuries is the result of the number of workers and their involvement in specific mining operations. Under normal conditions, a mining engineer will not be exposed to the risk of the mine roof collapsing, while a low-skilled worker is usually exposed to such risks.
Despite indications that there is a connection between some of the variables and the number of injuries, the general conclusion is that injuries are accidental and unpredictable. The high percentages of injuries shown in the tables are due to the organization of work and the age or qualification structure of the staff and, of course, are the consequence of likelihood –the greater the number of workers, the greater the likelihood of injury. A large number of limb injuries result from high levels of strenuous manual labor. As efforts are being made to mechanize mining operations in some mines, future studies will show the impact of mechanization on the number of limb injuries. However, even at this early stage, the present study showed that some things can be done to increase occupational safety and reduce the number of injuries.
For example, a longer training period for new workers or a simple ‘alert campaign’ among workers could increase awareness and prevent accidents. Since most injuries occur during the morning shift, this fact could help with enhanced security controls and the reorganization of mining operations in terms of avoiding overlaps and unnecessary overcrowding. Given that the root cause of most injuries is worker negligence, efforts to further secure points of high risk of injury, such as the intersections of coal transportation and personnel passing through, will reduce the likelihood of contact with belt or chain conveyors and thus reduce the likelihood of injury.
Problems in monitoring and reporting injuries necessitate training for the implementation of prevention measures at all levels, from the surface offices to the underground pits. In addition to organizing training, it is necessary to design and create a new system for injury monitoring and data processing. The system should have as its core a centralized database that collects and processes all injury data, from the moment of injury to the moment the employee returns to work.
Footnotes
Acknowledgment
This work was supported by the Ministry of Education, Science and Technological Development of the Republic of Serbia (contracts 451-03-9/2021-14/200148).
Conflict of interest
None to report.