
Abstract
BACKGROUND:
There is a growing interest in HR-analytics because of its ability to analyze employee behavior based on HR data. Predicting voluntary turnover of employees is an important topic of study, both in academia and industry.
OBJECTIVE:
The current study analyzes determinants for turnover, distinguishing between blue and white collar workers. The turnover analyses are based on a dataset from a payroll company, in contrary to previous turnover studies that used survey and interview data.
METHODS:
The studied dataset contains demographic and work specific factors for more than 380000 employees in 15692 Belgian corporations. Logistic regression is used to estimate individual turnover probabilities, the goodness of the model is tested with the AUC method.
RESULTS:
The study confirms turnover determinants and differences between blue and white collar workers that were described in previous work based on survey and interview data. Additionally, the study exposes so far unstudied turnover determinants and differences between blue and white collar workers. Confirmed determinants are among others age, seniority, pay and work distance. New determinants are company car, meal vouchers, night work and sickness. Different relationships to turnover are revealed for blue and white collar workers based on gender, number of children, nationality and pay.
CONCLUSIONS:
The presented dataset-based approach has its merit in analyzing turnover: it enables to study actual turnover instead of turnover intentions, and reveals new turnover determinants and differences between blue and white collar workers.
Introduction
The prediction of voluntary turnover is crucial for companies. More specifically, companies wish to prevent dysfunctional turnover, i.e. withdrawal of skilled and talented employees that will reduce the company’s productivity [1]. According to Perryer et al., voluntary turnover can cost the company over one and a half times the employee’s annual salary. These costs consider that a sudden turnover of a valuable employee will lead to reassignments of tasks at first, and recruiting and training of new employees after [2]. Moreover, companies with a high voluntary turnover rate are shown to perform significantly lower than their rivals [3]. Studies of turnover rates, or collective turnover, indeed reveal a negative relationship to organizational performance. Customer service can decline as a result of staff shortage and dysfunctional turnover in certain niche positions can disrupt productivity [4].
Research on voluntary turnover of employees is typically conducted through surveys and interviews [1, 5–12]. The importance of this research is invaluable since it contributes to the psychological understanding of turnover. Numerous determinants of turnover have been discovered this way, which in turn makes it possible to understand and more accurately predict voluntary turnover.
In the last decade, research on data analysis has experienced enormous growth. Today, Human Resources departments have acquired a large amount and a wide variety of data [13]. However, these extensive datasets are mostly not used to their full potential, despite the tremendous interest of HR professionals in accessing useful information. This can largely be attributed to the gap between academia and industry where HR professionals lack know-how of current developments on data analytics [14]. Also, in most HR related research, priority is given to new data collection instead of maximizing the use of an already existing dataset. Research on employee turnover is an example of this matter.
In the current paper, turnover is investigated by carrying out an analysis of data of a Belgian payroll company. Through this dataset based approach over 380,000 Belgian employees (almost 10 percent of the Belgian working population) are analyzed, enabling to draw more general conclusions for the Belgian labor force. A disadvantage of turnover investigation through a payroll database is that the covariate space is limited to the information that is inserted in the database. However, a typical payroll database consists of many work specific and demographic variables that have been shown to have a direct link to turnover [15]. The advantage is that this type of data makes it possible to study the effect on actual turnover, and not turnover intention.
Furthermore, the study of this wide-ranging dataset is used to target the blue-white collar debate within Human Resources literature. In studying general job behavior of employees, literature mostly focusses on white collar workers, whereas blue collar workers are underrepresented in academic literature [16–18]. Blue collar workers, however, make up almost half of the working population in Belgium (Statistics Belgium) 1 . Blue collar and white collar workers are found to have different job behavior, experiences and perspectives [17]. This means, conclusions cannot simply be extended from white collar workers to blue collar workers regarding career aspects in general, and more specifically regarding turnover behavior. In the current paper, therefore, the two types of workers are distinguished and analyzed separately to identify whether these groups indeed behave differently. Studying turnover for blue collar employees is relevant for employers as well. In certain sectors, skilled blue collar workers are required, or they are trained in company specific skills, making voluntary turnover equally undesirable. Also, in Belgium, important industries like construction and hospitality have been suffering a shortage of blue collar workers for many years 2 . Therefore, the need for studying turnover regarding blue collar workers rises.
The aim of the current paper is to use an existing employee database to its full potential without supplementary data collection. Through this dataset based approach, actual voluntary turnover is investigated, and differences regarding blue and white collar workers will be brought to the surface. The focus of this paper is explanatory and thus primarily concerned with identifying the causal relationships between the covariates and voluntary turnover.
In the next section, we will first discuss determinants found in the literature which influence voluntary turnover - determinants for which data is available in a typical Human Resource database. In section 3, we will elaborate upon differences between blue and white collar workers. Next, we provide details on the data and methodology in section 4. The model building is done in section 5, and results are given in section 6. Finally, robustness results are presented in section 7.
Determinants of voluntary turnover
In this section, an overview is provided of variables that are present in a HR database and have been shown to have an effect on turnover. Therefore, only demographic and work specific factors will be discussed. In exploring determinants of voluntary turnover, research is not solely focused on the direct effect on actual turnover. Instead, determinant are set for turnover intention, job satisfaction and organizational commitment, which in turn influence actual turnover. Employees with turnover intention have a behavioral tendency that might lead to turnover [5]. Job satisfaction and organizational commitment are the most frequently studied influences on turnover and have an inverse effect on turnover. If job satisfaction or organizational commitment increase, turnover decreases [7, 20]. This is why not only uncovered determinants of turnover are discussed but also those of turnover intention, job satisfaction and organizational commitment. Since most literature about turnover behavior covers white collar workers, the following overview of antecedents is mostly based on white collar research, unless otherwise stated. This overview is not exhaustive but focusses on variables that all HR databases include and is in this way field-driven.
Age and seniority. The age and seniority of an employee have both been found to be negatively related to turnover intentions [9, 21–23]. According to Pitts et al., however, turnover probability will first increase with increasing age and at a certain point will decrease again [24]. In their meta-analysis Ng and Feldman found that age is negatively related to turnover intention [22]. Furthermore, they concluded that the strength of the effect size of age is moderate and that other personal characteristics should be taken into account along with age for the prediction of turnover. Griffeth et al. confirm the negative relation between age and turnover in their meta- analysis as well [21]. They reach the same conclusion in regards to seniority and found that employee age moderates the seniority turnover relation, making the relation less negative in older populations. Research from Singh and Schwab and from Şirvanci addresses the instability of employees during the first years of employment, leading to a higher turnover [11, 23]. A higher seniority also initiates higher job satisfaction, influencing turnover to decrease with an increasing length of service [9].
Gender. The influence of gender on turnover has been widely studied though no unanimous answer is reached on its relationship to turnover. In their meta-analysis Griffeth et al. identified a similar turnover rate for men and women [21]. This would notably be the case for higher educated women, whereas older women are more likely to stay than older men. This is confirmed by Steenackers and Guerry, who found that older women are more likely to remain with the company [25]. According to Bender and Heywood, who performed a study among highly educated employees, women generally hold a higher job satisfaction than men [26]. This is confirmed by Cohrs et al., who also investigate university degree holders [27]. An older meta-analysis by Cotton and Tuttle, for both blue and white collar workers, finds high indications that women are more likely to leave than men [28]. This would indicate that the influence of gender on employee turnover has changed over time. A study from Loscocco states that among blue collar workers, women are on average more satisfied with their jobs than men [29]. According to the author, women have a great ability to adjust their expectations if the job does not turn out as expected. Moreover, the study indicates that higher education ‘translates into a greater dissatisfaction among women’, because higher education leads to higher expectations [29].
Marital status and children. Cotton and Tuttle identified, in their meta-analysis, that employee turnover is negatively related to the number of dependents of the employee [28]. They also found that married employees are less likely to leave than unmarried employees. However, Loscocco found no stronger organizational commitment for married employees among blue collar workers, even though previous studies had [29]. Among dual-earning couples (mostly managerial and professional employees), women were found more likely to leave than men [30]. It appears then, that marital status and number of children have a gender-based effect on turnover. For men, a higher number of children will even enforce their intra-organizational mobility, while for women, it makes them more likely to leave the organization. Griffeth et al. coincide with this result and suggest to study the interaction with gender [21]. In a more recent work, Euwals et al. discuss the trends of a growing labor force participation of women over the last decades [31]. A few decades ago, having children affected the career possibilities of women in a more negative way. Today, there is a more favorable attitude to relying on child care and combining a family and career. Lastly, Hom et al. discuss the competing explanations, found in past literature, on how having a family can initiate or halt employee turnover [4]. On the one hand, employees want to maintain company benefits (e.g. health benefits) and stability for their families. On the other hand, fulltime child or elderly care might require employment withdrawal.
Nationality. Regarding the nationality or race of the employee, it appears that organizational commitment is stronger if the employee’s culture coincides with the company culture [32]. In their extensive overview, Williams and O’Reilly conclude that turnover is higher for employees that belong to a racial minority in the organization [33]. Griffeth et al. reach no conclusive findings in their meta-analysis on the effect of the employee’s nationality on turnover [21].
Work-home distance. Employees with a lower commuting time will generally have a higher job satisfaction [34]. A study in the Netherlands, however, showed that workers have strong preferences when it comes to housing and are willing to accept longer commutes for better housing in more rural locations [35]. In a meta-analysis, MacDonald discusses the commuting barriers for women, seeing as they often need to combine their job with domestic responsibilities [36]. Feng and Boyle confirm that women with children suffer a long-term stress effect of daily commuting [37]. In a study on national wellbeing, Kahneman et al. had 909 women fill out a feelings journal of a regular week day. Out of all daily activities, commuting is ranked with the least enjoyable activities [38].
Pay. Low pay satisfaction was found by Sirola to have a direct effect on turnover intention [12]. In the meta-analysis by Griffeth et al., the effect size of pay is put into perspective [21]. They state that pay is not as crucial as generally considered in the literature. This result is confirmed by the meta-analysis of Judge et al., stating that a high pay does not necessarily lead to job satisfaction [39]. According to Fong and Shaffer, pay satisfaction is multidimensional and consists not only of salary satisfaction but also satisfaction with benefits and other elements of the compensation package [40]. Also, the salary package should be competitive in comparison with companies in the same industry to avoid turnover [21, 41].
Company size. De Clercq and Rius found a negative relation between company size and organizational commitment [42]. Organizational commitment appears to be higher in small and medium sized enterprises (SMEs). According to Barrett et al., job satisfaction - even despite lower benefits - is higher in SMEs compared to large organizations [43]. Saridakis et al. explain this higher job satisfaction and organizational commitment through the more familiar feeling employees have in a small company, the face-to-face approach and a stronger sense of belonging and shared purpose [44].
Part-time work. When it comes to job satisfaction in regards to parttime or fulltime work, there seems to be a gender difference. According to D’Addio et al. men that work fulltime are more satisfied than parttime working men [45]. On the other hand, Higgins et al. found that parttime working women are more satisfied than fulltimers, because parttime work improves the work-family balance [46].
In this section we provided a non-exhaustive list of turnover determinants. The focus of this section is on the determinants that are available in the studied dataset.
White collar versus blue collar
Blue collar workers are defined as workers who ‘perform primarily physical work and have relatively restricted career paths’, whereas white collar workers are defined as ‘professional and semi-professional employees’ who perform mainly non-manual work [17, 47].
In the previous section we discussed job satisfaction and organizational commitment, which are both antecedents of turnover. However, job satisfaction and organizational commitment are attained in different ways for blue and white collar workers. Hu et al. show that different factors have an influence on job satisfaction when comparing blue and white collar workers [17]. The different employee groups conceptualize important characteristics of their job in a different way. Blue collar workers define career success in a different way (e.g. by mastering job specific skills, seniority) and experience different forms of job-related stress [16, 48].
In a meta-analysis by Riketta organizational commitment is regarded. Only a few blue collar samples were found in the literature. From these samples, Riketta did however distillate that white collar workers generally have a higher organizational commitment than blue collar workers [49].
In their meta-analysis, Sverke et al. state that more qualified employees with a high value on the labor market will decide to turnover in case of job insecurity, and thus take matters into their own hands [50]. Blue collar workers, who typically have a lower education level, will hold on more to their jobs. Earlier, Harris and Locke found that blue and white collar workers differ in the sources of job satisfaction and dissatisfaction. While blue collar workers attach more value to extrinsic motivators such as rewards, white collar workers are more directed at intrinsic motivators such as job content in order to achieve satisfaction [51]. Furthermore, in regards to job content, De Spiegelaere et al. found that routine tasks have a significant negative effect on motivation for white collar workers, while this is not the case for blue collar workers [52].
Often, conventional career models do not take blue collar workers into account [53]. In accordance, Hennequin states that the ‘theoretical frameworks that are used for studying careers are problematic for blue collar career studies’. Blue collar workers often have low career advancement opportunities in the companies they are employed at. This contributes to a high turnover rate for blue collar workers, since they seek for opportunities elsewhere [16]. This is in contradiction with earlier findings, where blue collar workers were found to hold on to their jobs more [50].
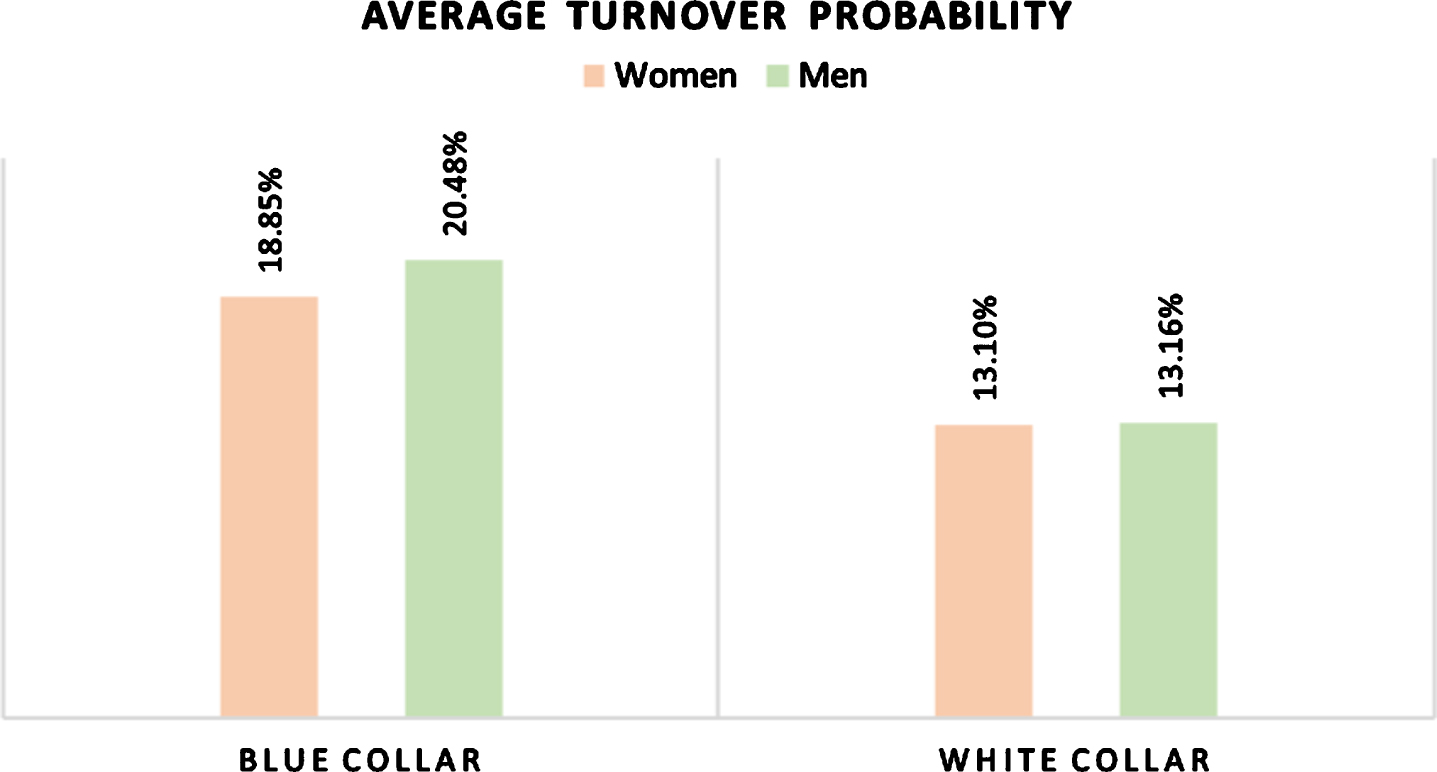
In the studied dataset, the average turnover rate for blue collar workers (24,29%) is higher than the turnover rate for white collars (15,78%).
The findings that blue collar workers have less career advancement opportunities and give more value to extrinsic motivators, suggests that a difference will be found in regards to the pay-turnover relation for blue and white collars. Furthermore, the fact that new evolving career theories focus mainly on white collar workers suggests that findings for blue collar workers might not correspond with these theories.
Methodology
Sample
We were able to investigate a dataset from a Belgian payroll company. The dataset consists of information of the year 2015 of 561 295 employees from about 16 000 Belgian companies. For each employee in the dataset, the status (blue collar or white collar) is indicated. It is important to note that the reliability of this variable in a Belgian payroll dataset is crucial, e.g. a different worker status leads to different tax brackets and rates for holiday bonuses.
The aim is to investigate which factors contribute to voluntary turnover. Therefore, employees are compared who stay in the company and employees who leave voluntary. All other employees (e.g. employees who leave involuntary, retirements) were filtered out. Furthermore, employees with a temporary work contract were excluded from the analysis as well. This resulted in the final sample size of 385 680 employees.
In the final sample, 235 642 employees are white collar workers, and 150 038 are blue collar workers. Within the white collar workers, men and women are more equally distributed (M: 54.02%; W: 45.98%) than for blue collar workers (M: 71.61%; W: 28.39%). The age distribution of the blue and white collar workers can be seen in Figs. 1 and 2.
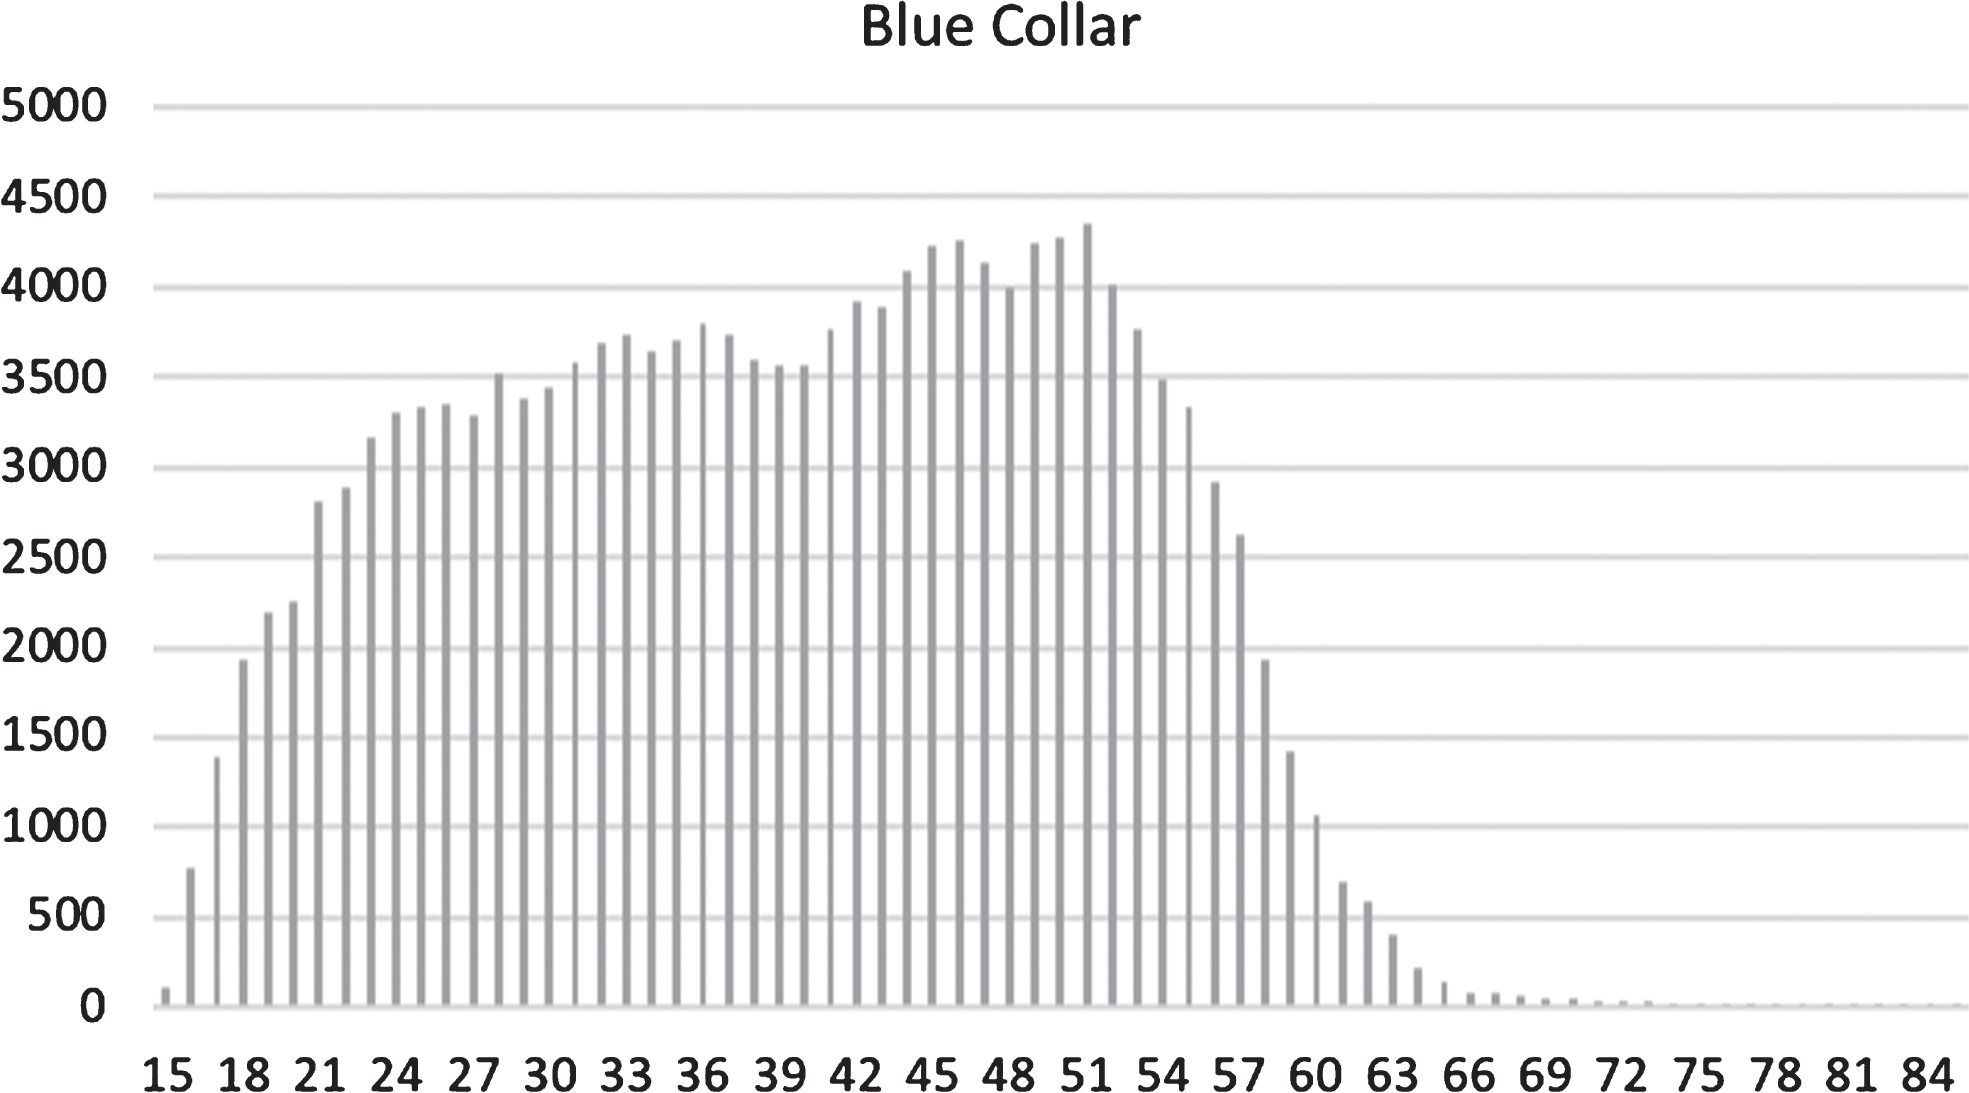
Distribution of the ages in the dataset for blue collars.
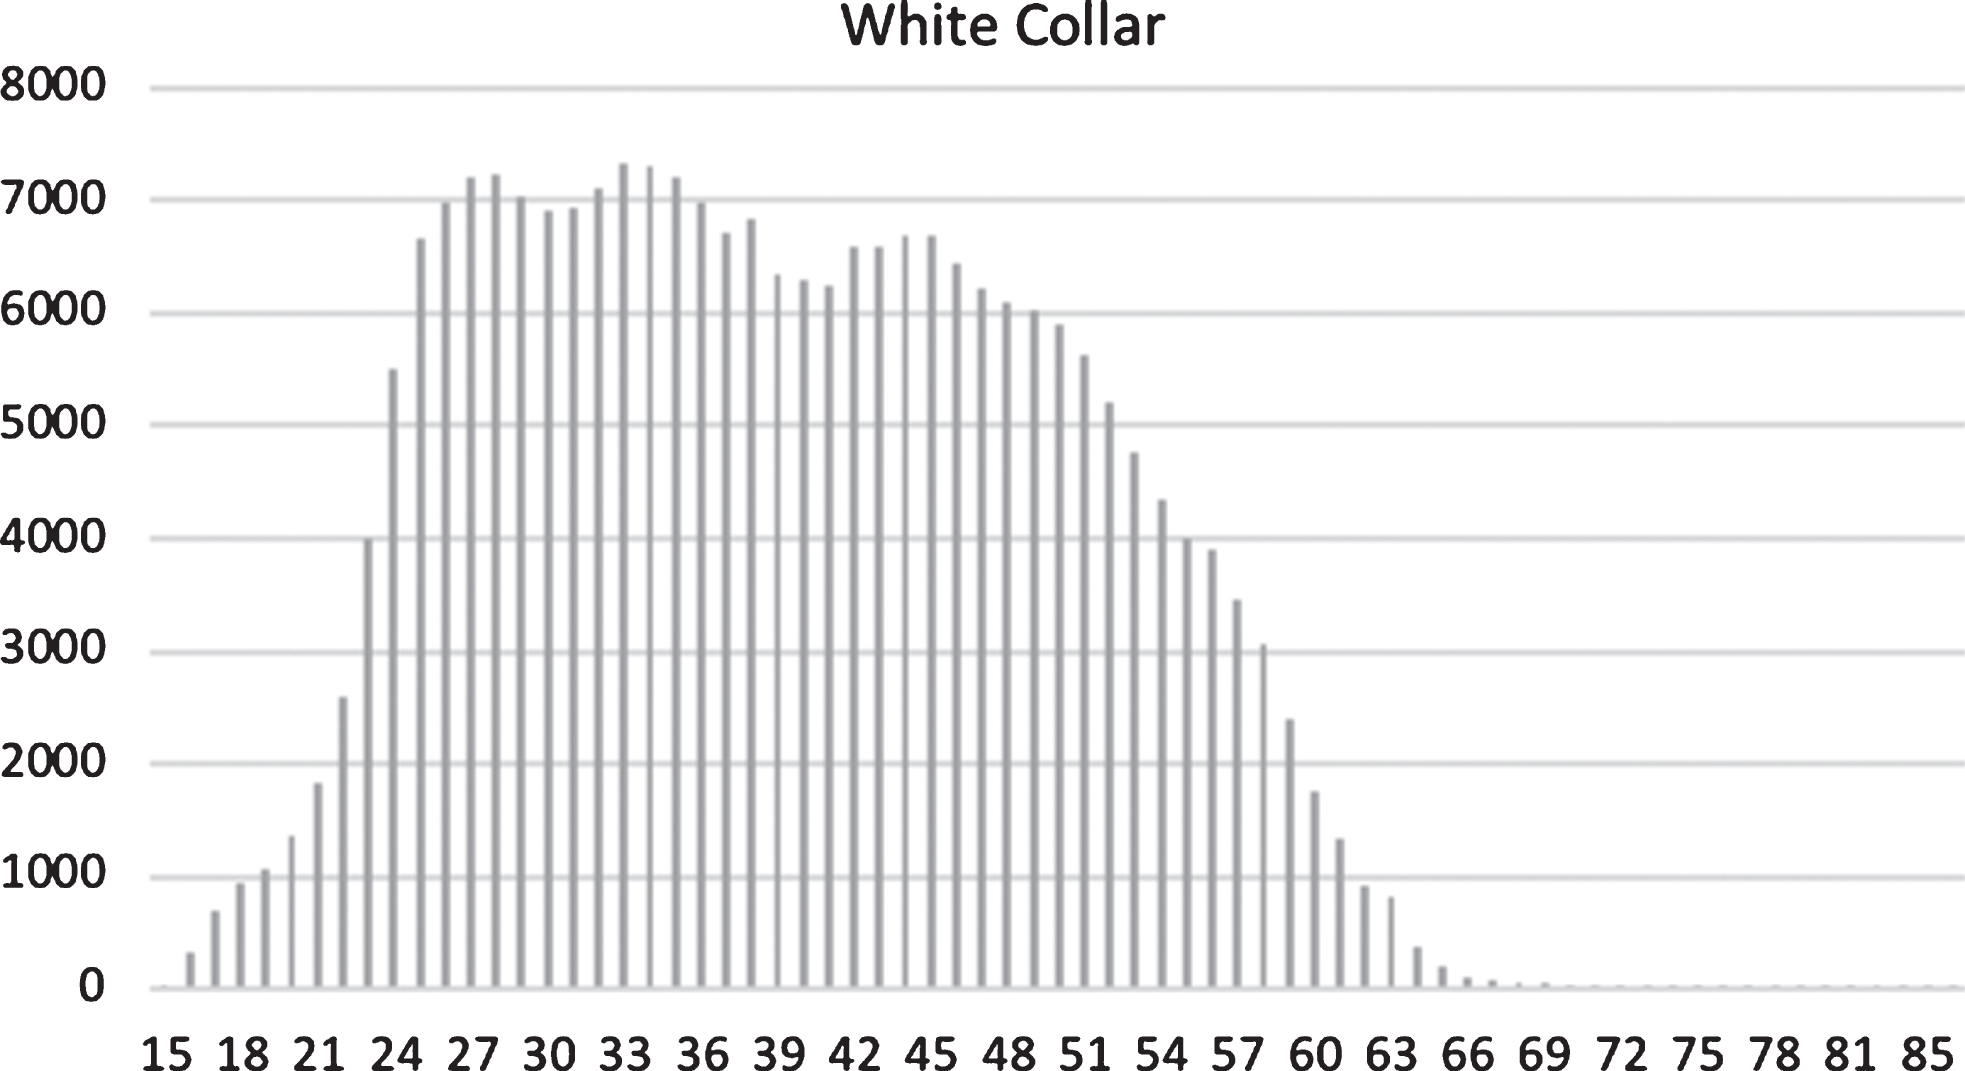
Distribution of the ages in the dataset for white collars.
The available variables in the dataset are the following: Demographic factors: gender, age, nationality, partner (Yes/No), number of children, dependent partner (Yes/No, the partner is dependent if he/she has no self-sustaining income). Work specific factors: seniority, work-home distance, SME
3
(Yes/No), sector (secondary/tertiary), night work (Yes/No), work percentage, percentage of sickness (in one year), fixed pay (monthly in euros), conditional pay (monthly in euros based on performance), overtime pay (monthly in euros based on extra worked hours), meal vouchers
4
(Yes/No), company car (Yes/No).
In Table 1, the descriptive statistics are given for the variables in the dataset.
Descriptives of the variables in the dataset. For continuous variables: the mean and standard deviation is given. For nominal binary variables: the percentage of the specified category is given
One can remark that the data-driven approach enables to investigate voluntary turnover in relation to on the one hand, factors that are already studied in previous work (being seniority, gender, marital status, children, work-home distance, pay, company size and work percentage) and on the other hand, to the additional factors company car, meal vouchers, night work and sickness.
Each row in the dataset represents an employee and gives information as to whether the employee left in that year. The variable VolTurn (voluntary turnover) gives 0 if the employee stayed in the company in that year and 1 if the employee left on a voluntary basis in that year. A logistic regression model is built with the dependent variable VolTurn (dichotomous variable for voluntary turnover). The regression will thus result in a turnover probability for each employee.
The aim of this paper is to establish relationships to the dependent variable and thus to build an explanatory model for both blue and white collar workers. In an explanatory analysis, an automated variable selection procedure (such as stepwise regression) should be avoided [54]. Instead, the final multivariate model should be driven by the hypothesis which need to be tested. Furthermore, in an explanatory analysis, values to test the overall model performance are less important and the focus should lie on the individual β coefficients and P values [54].
In section 2, the payroll variables were discussed that have been found to have an effect on turnover according to literature: seniority, gender, marital status, children, work-home distance, pay, company size and work percentage. The model is built up by first including the demographic and the work specific variables that were already found in the literature to have an effect on turnover. The data-driven approach in this paper offers the opportunity to investigate some additional new variables for which data is available. In this way, the model is next expanded with the following a priori non-investigated variables: company car, meal vouchers, night work and sickness. If a variable is found to be non-significant for both type of workers, the variable is excluded. If a variable is found significant for one type of workers, it is included in the models for both types of workers.
The aim is to investigate differences between blue and white collar workers. Therefore, it is crucial to include the same independent variables in both models. The comparison of the resulting models will be done by using predicted probabilities and marginal effects on probabilities [55, 56]. The direct comparison of the odds ratios and the regression coefficients is not advised, since these values are influenced by unobserved heterogeneity in the different models [57]. Robustness checks are performed through random sampling since significance levels for large sample sizes are easily reached [58]. Therefore, random sampling is a good method to check whether the coefficient estimates are stable for smaller subsamples. The total sample is divided in 100 folds. Next, for each fold, the logistic model is run and thus the coefficients re-estimated.
In the current study, the primary interest is to investigate mean differences between blue and white collar workers. The focus thus lies on the population averaged interpretation of the model. Therefore, a single-level model is applied instead of a multi-level model. In a single-level model, the interpretation of a coefficient for a certain covariate represents a comparison that is averaged across all companies, where in a multilevel model the coefficient represents the comparison within a cluster [59]. In the current paper, the focus lies mainly on the individual characteristics of the employees. On the organizational level, the organization size is included as a covariate. In the robustness check, as well, the context is disregarded, since random samples are drawn from the entire population. Ultimately, it is important to note that, the behavior of employees is not only determined by personnel characteristics, but is also induced by the context [60]. The relationships that are described in this paper are averaged over the population and will therefore not fit each particular company.
Model building
Spearman correlations among the variables in the dataset are presented in Tables 2-3. The correlation matrices as well as the significance levels were calculated in R. Aside from correlation matrices, the VIF value of the obtained model is evaluated. ‘The variance inflation factor (VIF) provides a reasonable and intuitive indication of the effects of multi-collinearity on the variance of the i-th regression coefficient’ [61].
In general, low correlation values are noted, as can be seen in Table 2 and 3. However, a significantly high correlation between age and seniority can be identified. This is an expected correlation, that was also pointed out in the meta-analysis by Griffeth et al. [21]. For blue collar workers, the correlation between age and seniority is 0.57, for white collar workers 0.65. This high correlation can lead to distorted coefficients and should be avoided if the coefficients of the regression are used for explanatory purposes.
Correlation matrix for blue collar workers. Gender: 0 = man, 1 = woman; Partner: 0 = no, 1 = yes; Belgian: 0 = no, 1 = yes; Nightwork: 0 = no, 1 = yes; Meal Vouchers: 0 = no, 1 = yes; Company Car: 0 = no, 1 = yes; SME: 0 = no, 1 = yes
Correlation matrix for blue collar workers. Gender: 0 = man, 1 = woman; Partner: 0 = no, 1 = yes; Belgian: 0 = no, 1 = yes; Nightwork: 0 = no, 1 = yes; Meal Vouchers: 0 = no, 1 = yes; Company Car: 0 = no, 1 = yes; SME: 0 = no, 1 = yes
Correlation matrix for white collar workers. Gender: 0 = man, 1 = woman; Partner: 0 = no, 1 = yes; Belgian: 0 = no, 1 = yes; Night work: 0 = no, 1 = yes; Meal Vouchers: 0 = no, 1 = yes; CompanyCar: 0 = no, 1 = yes; SME: 0 = no, 1 = yes
An explorative descriptive analysis of age in relationship to employee turnover within the dataset shows an increase of turnover at first, and then a decrease after a certain age (see Fig. 3).

Turnover distribution according to the employee age.
The turnover peak for blue collar workers is situated at a younger age in comparison to white collar workers. However, a similar seniority-turnover distribution can be identified for both blue and white collar workers (see Fig. 4). This can be explained by the fact that blue collar workers traditionally enter the labor market at a younger age than white collar workers because of a shorter duration of education. This would imply that seniority has a greater weight in the turnover prediction.
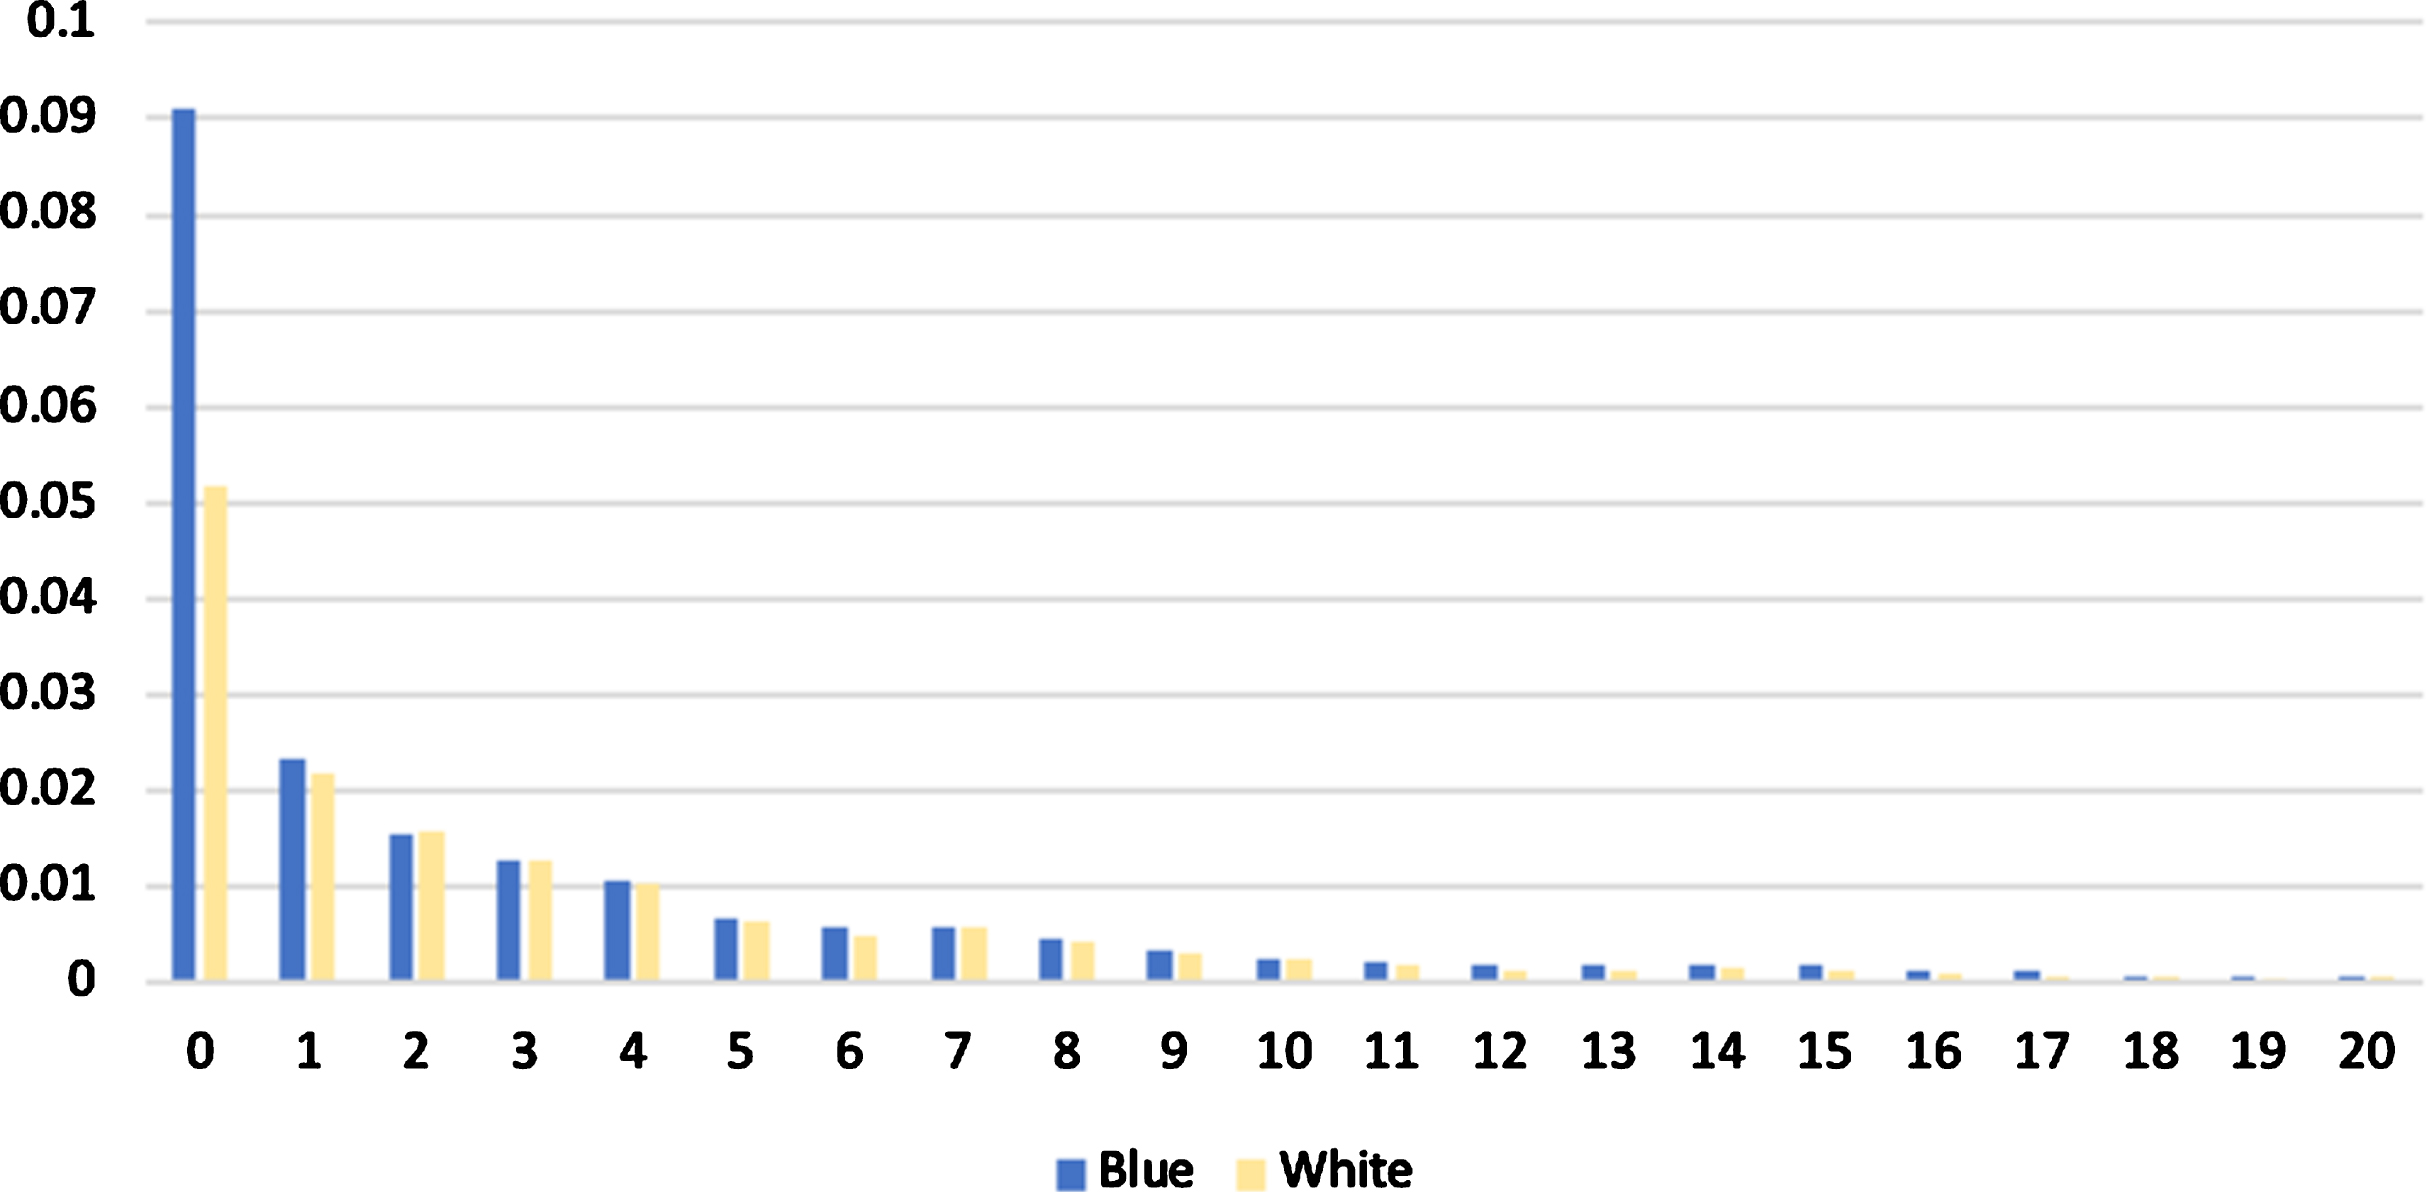
Turnover distribution according to the employee seniority given for the first 20 years of seniority.
Using both age and seniority as explanatory variables leads to high multi-collinearity in the logistic regression model and thus high VIF values. The correlation matrices from both blue and white collar workers show a higher correlation between seniority and voluntary turnover than between age and voluntary turnover. Therefore, the variable Seniority is included and the variable Age is omitted from the model.
Next, interaction variables are added according to previously discussed literature. Since the number of children has been shown to have a gender-based effect on turnover, an interaction variable is included for Gender and Children. To investigate a relation with marital status, the interaction Partner*Children is included as well. Furthermore, the interaction between Gender and Work percentage is investigated, since parttime working women were found to be more satisfied in their jobs.
Next, an interaction variable for Work-home distance and Company car is included, since these variables can play a combined role for commuting time. As greater the work-home distance, a company car is expected to be more appreciated by the employee. Lastly, since commuting time has proven to be specifically stressful for women, an interaction between Gender and Work-home distance is included.
Whenever new interaction variables are added, the VIF score is calculated. Interaction variables were left out if no significant relation to the dependent variable was reached or the VIF score was too high (>5) [62]. This process is repeated for both blue collar and white collar workers. None of the VIF scores exceeds 3,388, this indicates there are no problems in regards to multi-collinearity.
Aside from the regression coefficients, Table 4 contains the odds ratio. The odds ratio is a well-known measure which approximates the odds of the outcome Y given a set of predictor variables [63]. For a binary variable, such as e.g. sex (where man = ‘0’, woman = ‘1’), the odds ratio represents the odds of leaving for female employees compared to male employees, if all other variables stay fixed. For a continuous variable, such as e.g. seniority, the odds ratio represents the odds of leaving given a one-unit increment in the variable, if all other variables stay fixed. For certain continuous covariates, however, a one-unit increment is likely not interesting. For example, consider the variable that represents salary, an increment of 1 euro is not considered interesting, a 200 euro raise, on the other hand, would be. This will be further discussed for certain variables in the results section.
The regression results for both blue and white collar workers.
The different columns represent the regression coefficient, the odds ratio and the significance P-value
First, turnover determinants are discussed that have the same sign for the regression coefficient for blue and white collar workers. Next, determinants that have opposite signs for blue or white collar workers are pointed out. The significance of the variables will be taken into account as well.
In the interpretation of the coefficients and the odds ratios it is important to note that ‘unobserved heterogeneity is almost always present’ [57]. Because of this unobserved heterogeneity the coefficients and effects sizes can be overestimated. Omitted and unobservable variables might affect the estimates, even when they are unrelated to the variables in the model. It is important to preserve vigilance in the interpretation of the coefficients. However, the direction of the impact on the dependent variable still remains valid [57]. Furthermore, robustness checks are performed in section 7. It is also important to note that even though the odds ratios of the two types of workers will be mentioned, the ratios cannot be directly compared, due to the fact that unobserved heterogeneity, as already mentioned, might affect the estimates.
In the discussion below, predicted probabilities are compared over the two groups. In the study of the effect of a certain variable, the remaining variables are always kept at a fixed value. Unless these variables are of interest, the reference probability concerns a single Belgian male without children. The other nominal variables are set to the reference category and the continuous variables are set at the population means.
Blue collar - white collar similarities
Seniority. Seniority has a negative relation to turnover for both blue and white collar workers. This confirms what has been found in the literature [9, 22]. From the odds ratio it appears that an additional year in seniority would already lead to 10% less likeliness to leave. However, caution is necessary in the interpretation of the odds ratio, as the linearity assumption for continuous variables is typically not fulfilled [57]. The decrease in the odds ratio of leaving for a new employee might be quite different from an employee with a high seniority, which can indeed be noted from the descriptive analysis given in Fig. 4.
Gender. The regression coefficients show that woman have a lower turnover probability than men. This confirms the results from [29]. For white collar women, the effect size is less strong, and more importantly not significant. Figure 5 illustrates the turnover probability for single men and women without children, with the other variables held at their means. In the literature, we found no unanimous conclusion of the gender effect on turnover. Higher educated women appear to be more satisfied with their jobs than men [26, 27]. However, this does not necessarily mean that their turnover probability is lower than men. Griffeth et al. identified a similar turnover rate for men and women, more precisely for higher educated women [21]. In this analysis, as well, it appears that turnover behavior of men and women is more similar for white collar workers, who are on average higher educated. The fact that the coefficient is not significant for white collar workers, implies that gender differences do not influence the turnover probability.
Comparison of the turnover probability for blue and white collar men and women, both single and without children with the other variables kept at their means.
Marital status and children. We identify similar relations for blue and white collar workers who have a partner. The interpretation of the negative coefficient is straightforward, i.e. having a partner leads to a lower turnover probability. The interaction variables Gender*Children and Partner*Children lead to interesting insights. The change in probability for changing number of children is illustrated in Figs. 6 and 7. The turnover probability decreases with increasing number of children for single men and women. The decrease is less strong for women with a partner and even slightly increasing for men with a partner. However, Valcour and Tolbert found that men have a lower turnover probability with increasing number of children, while women were found more likely to leave [30]. Yet, a more recent study by Euwals et al. indicates that children have a less negative impact on a woman’s career [31]. The latter is confirmed by our results.
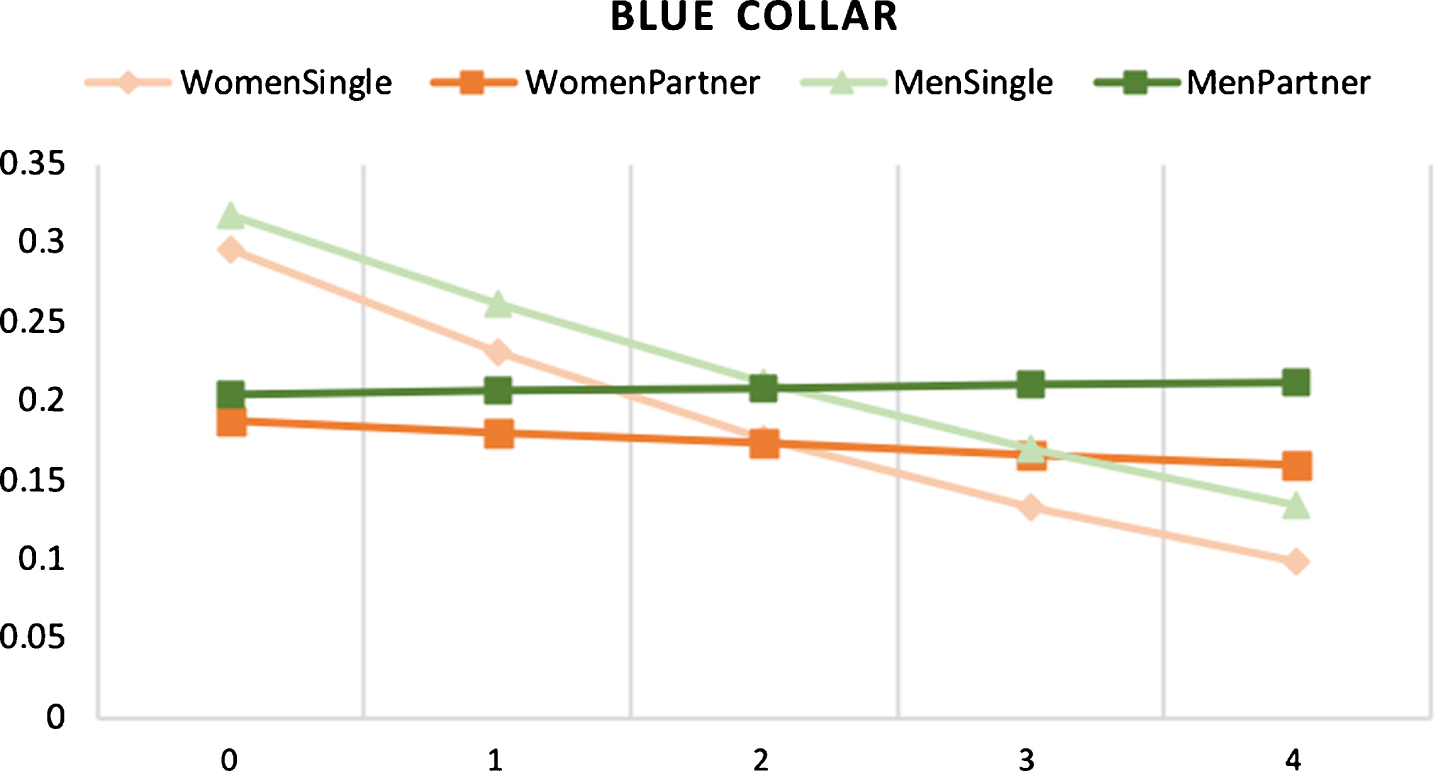
Effect of children on turnover probability for blue collars.
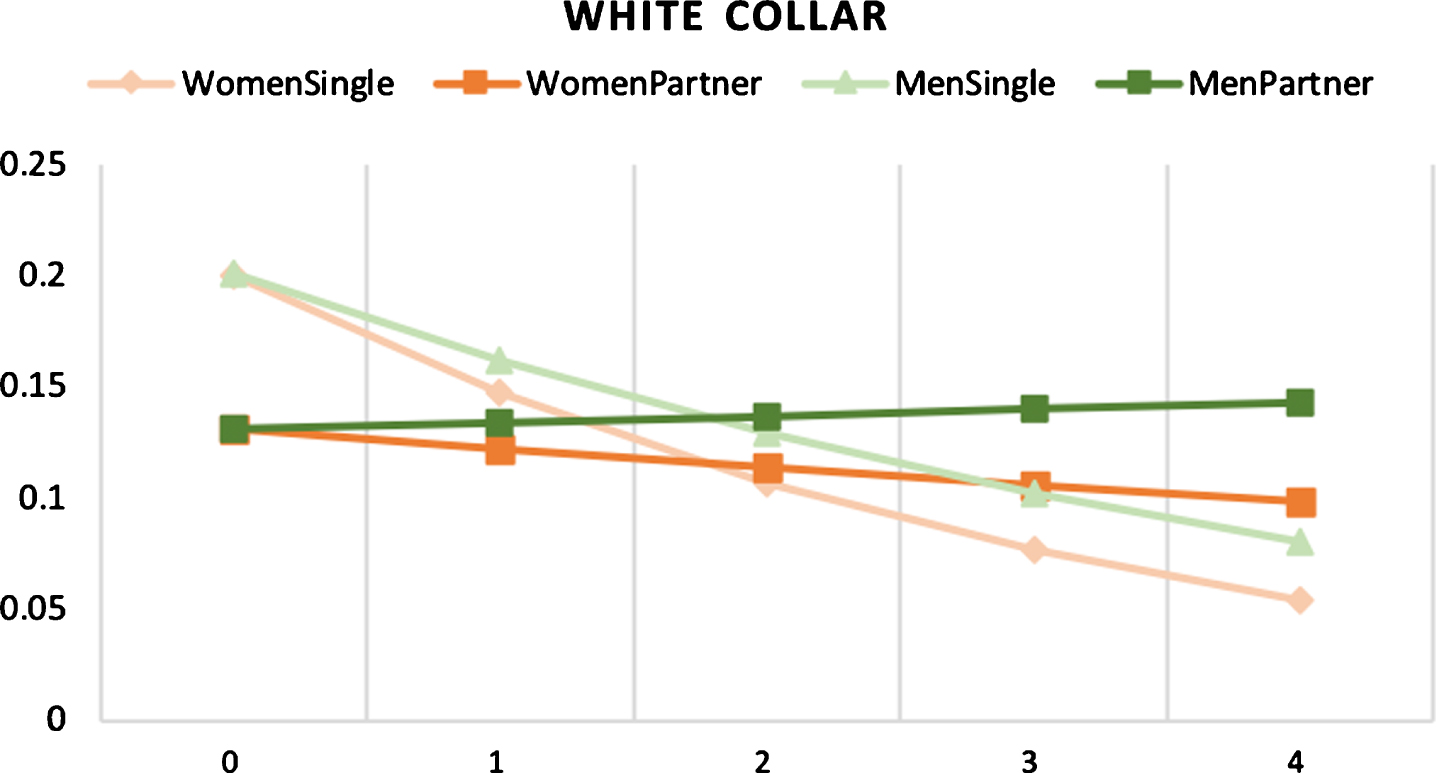
Effect of children on turnover probability for white collars.
Work-home distance. As confirmed in the literature, a greater work distance leads to a higher turnover probability [34]. This appears to be the same for both blue and white collar workers. The odds ratio contains no interesting information for this variable, since an additional kilometer is not likely to have a large effect on the turnover probability. However, considering for example an additional 30 kilometers leads to an odds ratio of 1.09 for white collar workers. This means that an employee A who lives 30 kilometers further than employee B will leave 1.09 times more likely than employee B. The interaction term Gender*Distance shows that a longer commute indeed leads to a higher turnover probability for women, as discussed in the literature [37].
For both types of workers, the distance effect is moderated by a company car. As will be discussed further on, the car itself does not have a retaining effect on the employee. In Fig. 8, the effect of both gender and company car is illustrated on the distance-turnover relation for white collar workers. The effect is illustrated for white collar workers only, since only 1,24% of the blue collar workers actually own a company car, compared to 36,50% of the white collar workers. It can be seen that the car only leads to a lower turnover probability compared to no car at a high work distance of nearly 100 km. Also, with a P-value of 0.08, this effect is not notably significant.
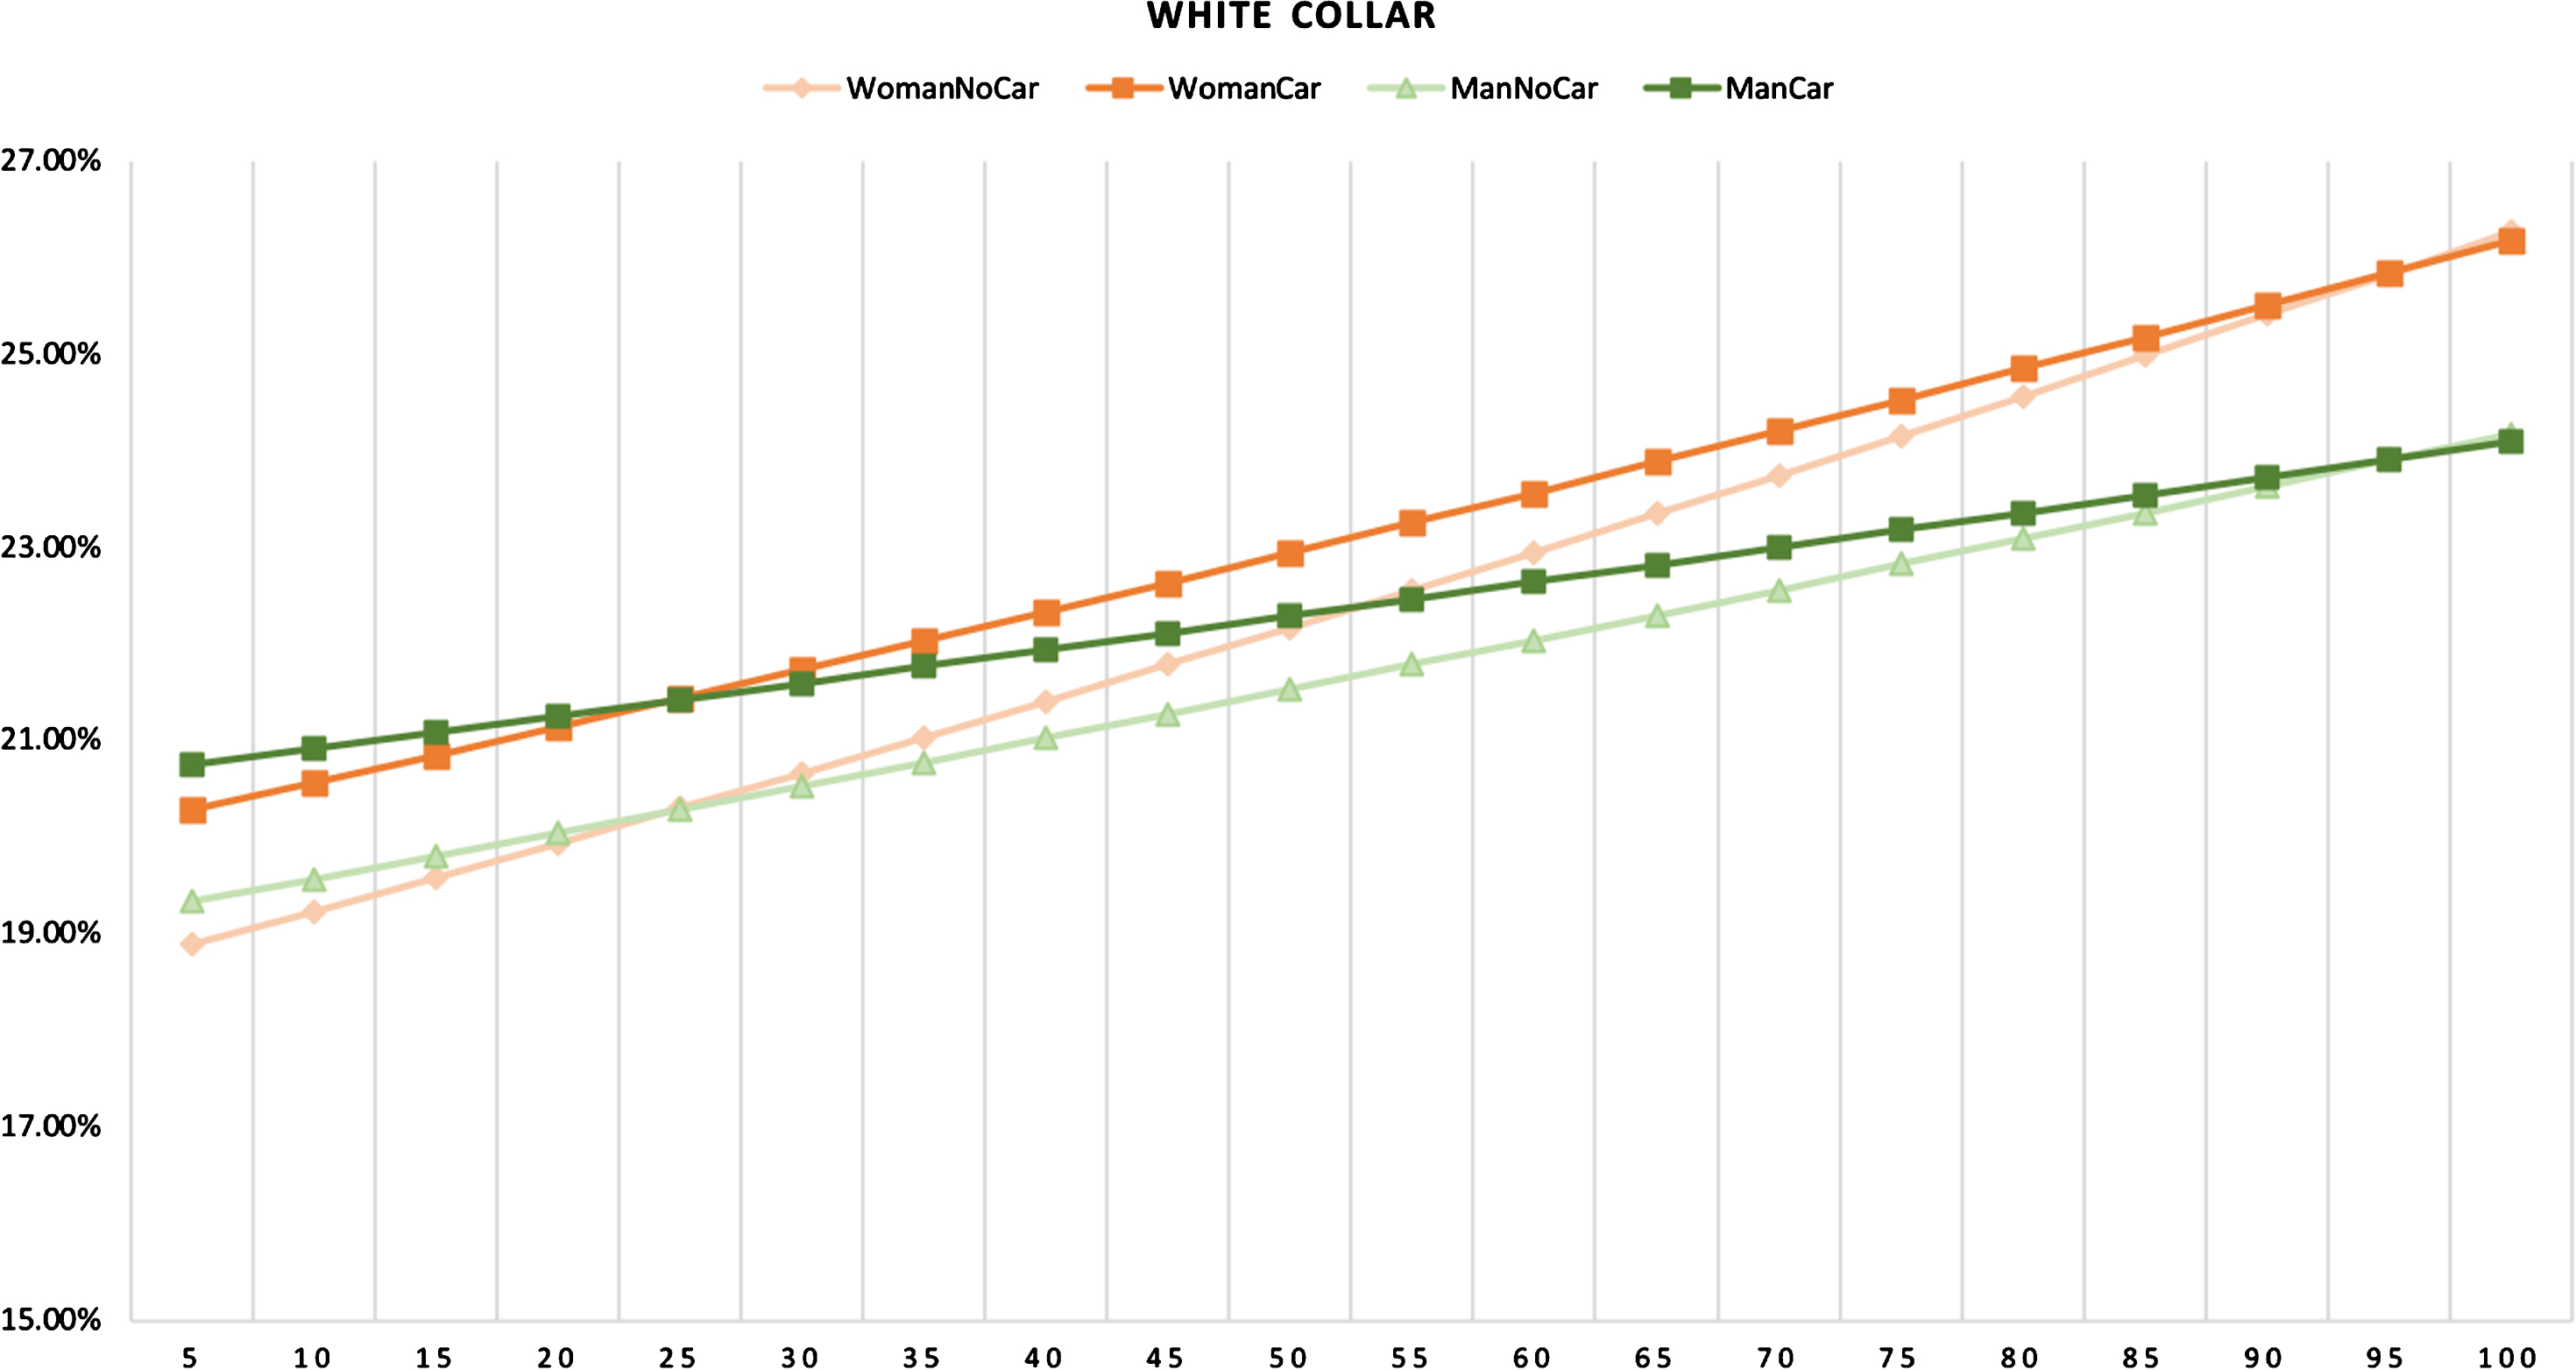
Effect of company car on distance-turnover relation.
Company car. As already stated, employees who possess a company car are more likely to leave than employees without a company car. This result was only significant for white collar workers. In any case, this is the most interesting group to investigate because of the high percentage of white collar workers who own a company car. The result seems unexpected. Van Ommeren et al. state, however, that fringe benefits like a company car ‘do not generate as much value to workers as wages of equal monetary value’ [64]. Also, Belgium is characterized by an urban sprawl which leads to heavy road traffic and congestion [65]. This high congestion can make public transport more attractive to employees and bring down the value of the company car [66]. Another reason why company cars might not retain employees is because a great deal of Belgian employers grant company cars, meaning that a similar function with a competitor will very likely provide this benefit as well. Where two decades ago, company cars were only offered to employees in high managerial positions, they are now ‘a common practice in the composition of the salary package’ [67]. A big reason is that the annual government subsidy per car was found to be highest in Belgium out of 27 OECD countries 5 .
Pay. In the studied dataset, several variables are pay related. We identify a negative relation to turnover for the variables conditional pay, over-time pay and meal vouchers. The regression thus indicates that more pay and benefits lead to a lower turnover probability. This confirms what has been found in the literature [12, 21]. When it comes to over-time pay, Beckers et al. emphasize that over-time work and pay can be very satisfying for employees when they choose to do this on a voluntary basis. If, however, the over-time work is employer-induced, it leads to fatigue and dissatisfaction [68]. The variable fixed pay will be discussed further on.
Company size. Employees in smaller companies are less likely to turnover than employees in bigger companies, both for blue and white collar workers. This result was expected since it has been shown that organizational commitment and job satisfaction are higher in small and medium sized enterprises [42–44].
Nationality. Blue collar workers with a non-Belgian nationality are less likely to leave voluntary than Belgians. For white collar workers however, we find that non-Belgians are more likely to leave. The latter coincides with literature [32, 33]. Griffeth et al., however, found no conclusive relation [21]. A reason might be that they make no distinction between blue and white collar workers and blue collar workers seem to behave differently according to our dataset.
Pay. We found that fixed pay has a negative relation to turnover for blue collar workers only. The latter supports findings by Harris and Locke [51]. Indeed, the authors found that extrinsic factors such as job security and salary are more important for blue collar workers than for white collar workers. McLean et al. also state that salary is ‘not a long-term source of work motivation’ after performing research among white collar workers with an above-average income [69]. It is worth noting that the effect size of pay for white collar workers is very small, even a raise of 500 euros leads to an odds ratio of 1.04. This indicates that there is a weak relation between pay and turnover probability for white collar workers. In Fig. 9 the change in probability is given for 200 euro raises.
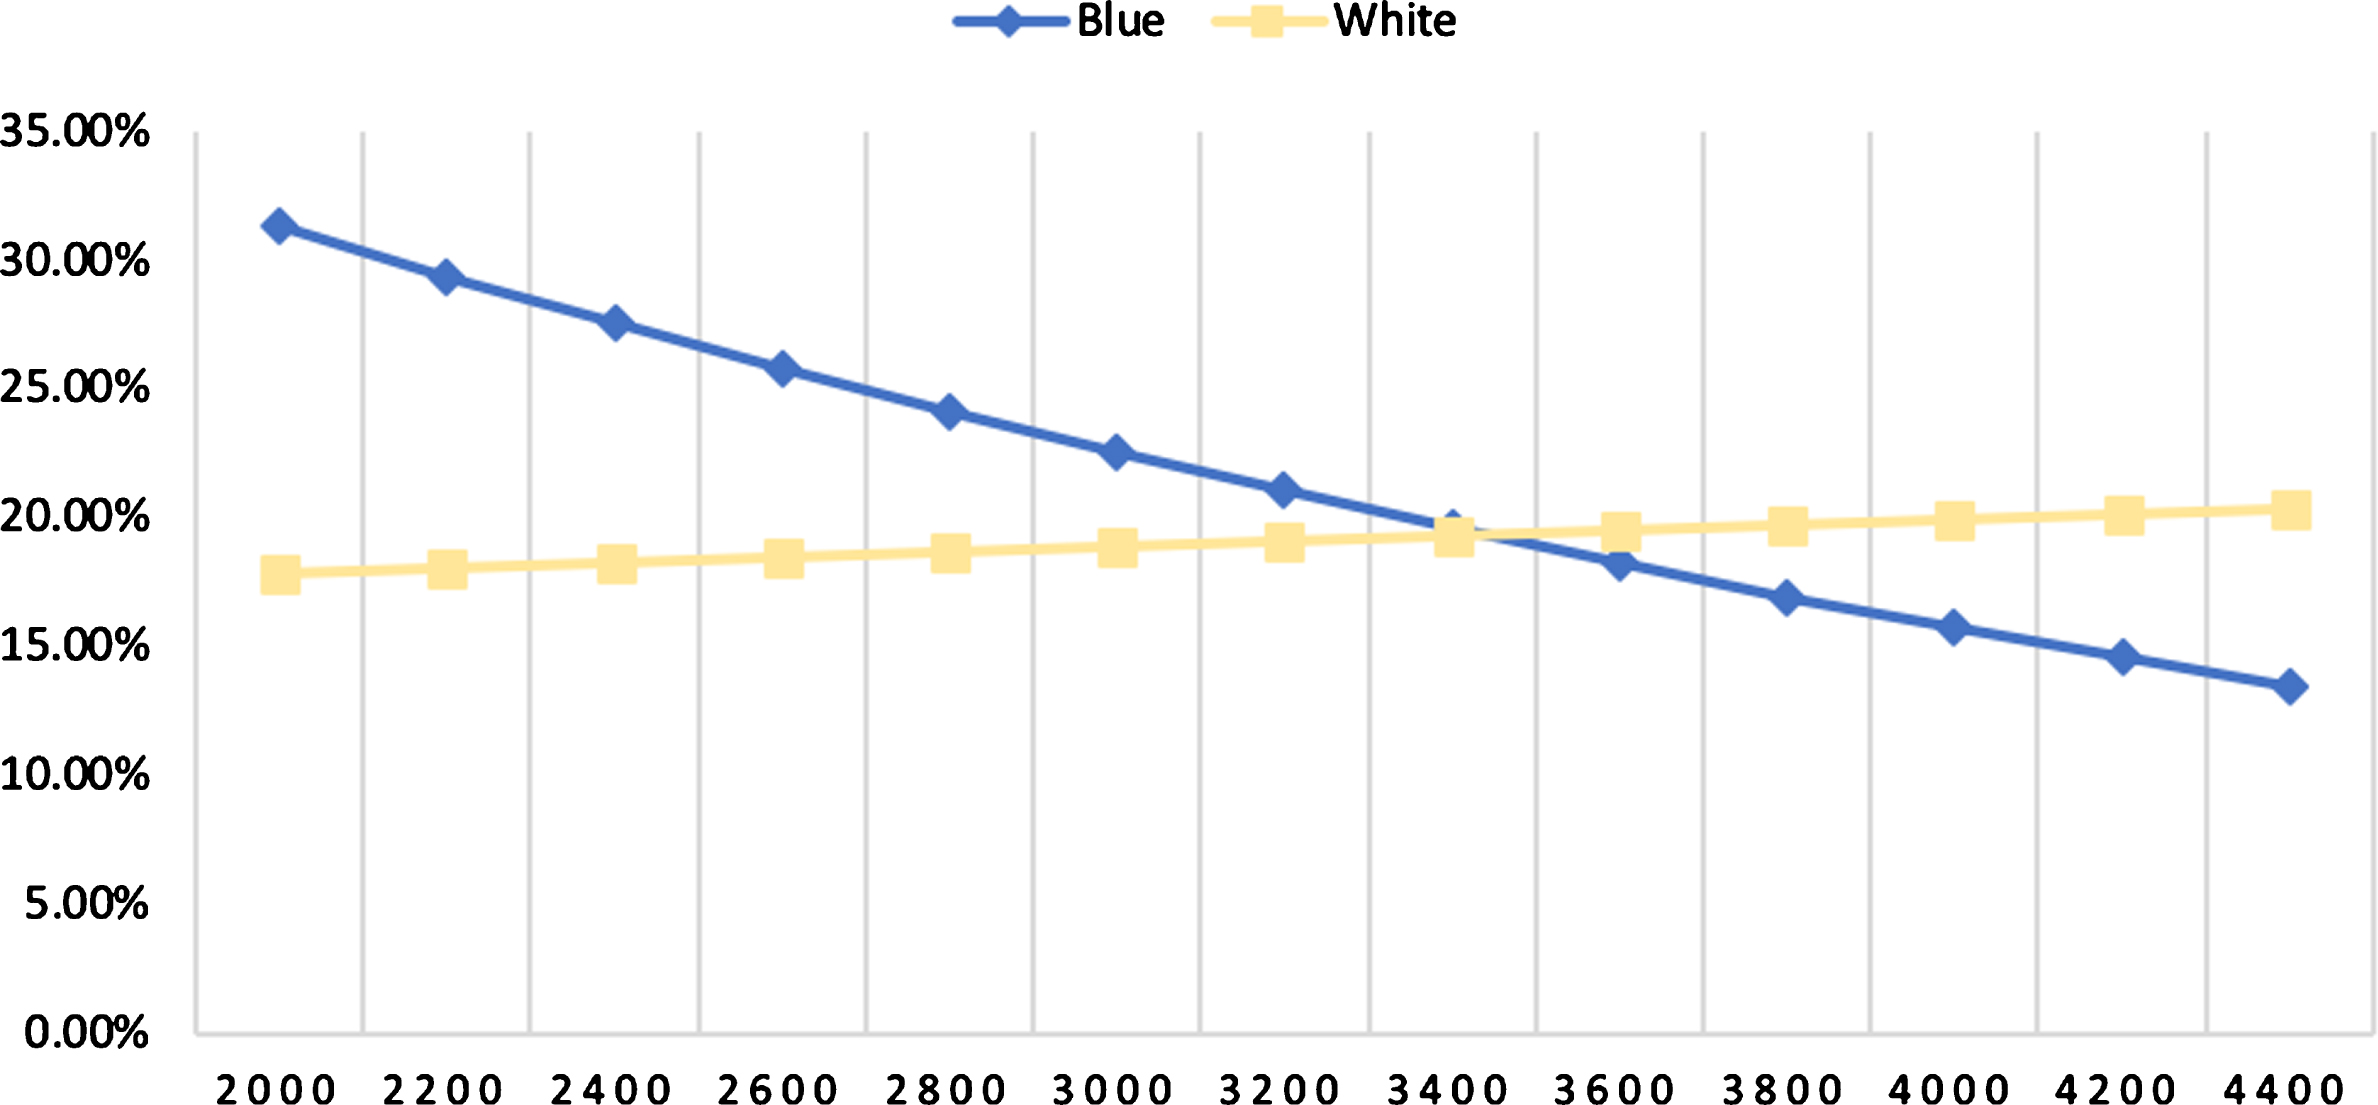
Change in probability with increasing pay.
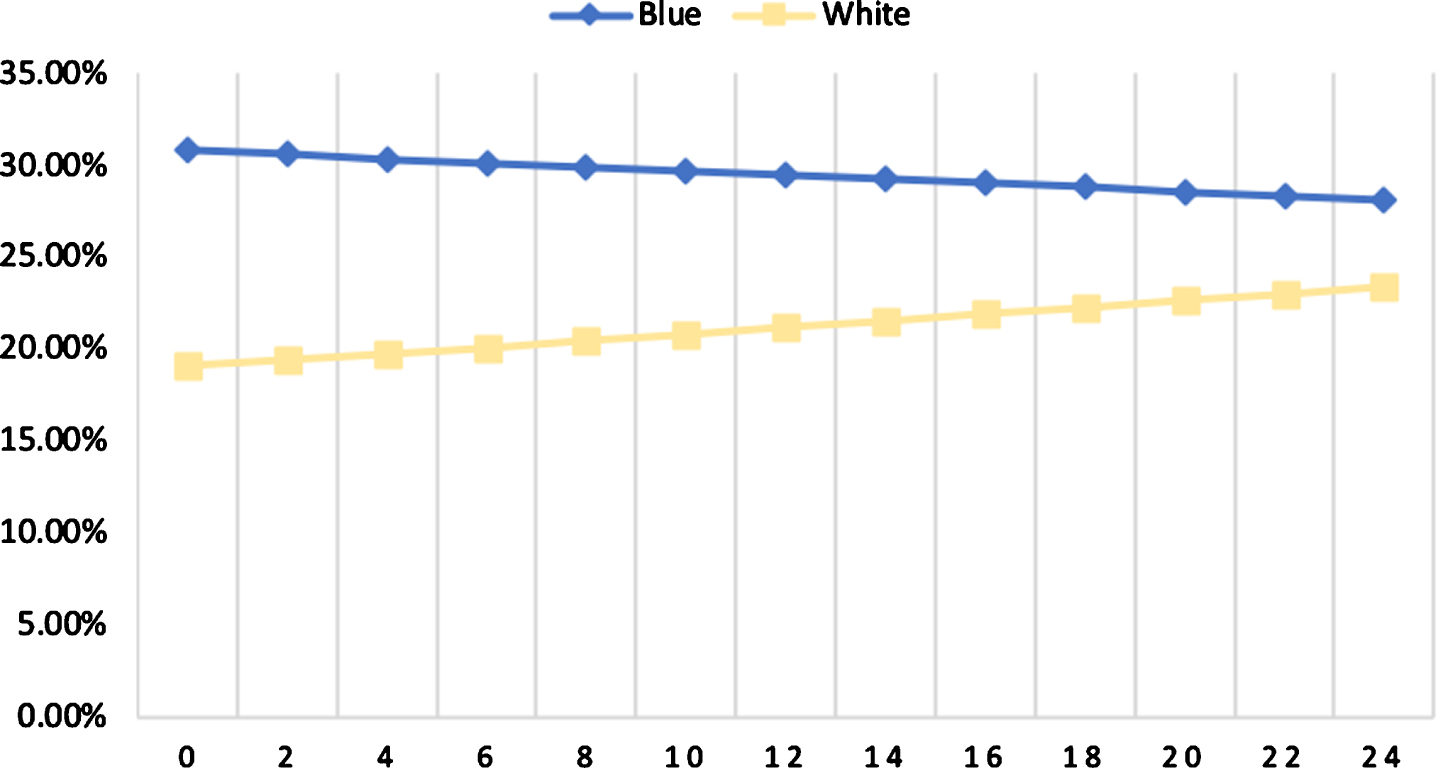
Work percentage. A lower work percentage for white collar workers increases turnover probability. According to D’Addio et al. and Higgins et al. the relation between work percentage and turnover is gender related [45, 46]. Parttime working women are more satisfied than fulltime working women. For men, this relation appeared opposite. In the current analysis, for both men and women a higher work percentage leads to a lower turnover probability. For blue collar women, however, the decrease is less strong. Figures 10 and 11 illustrate a more similar behavior for white collar men and women than for blue collars.

Effect of work percentage on turnover probability for blue collars.

Effect of work percentage on turnover probability for white collars.
Night work. For blue collar workers, night work leads to a higher turnover rate. This result is expected since several previous studies point out that night work is correlated to lower job satisfaction and higher turnover intention: Night work is a working condition that impacts health and well-being of the employee [70]. Night work leads to poorer quality of life and sleep pattern, which worsens job satisfaction [71]. For nursing staff, the ability to deal with night shifts relates to turnover intention [72]. Moreover, night work affects family and social life. Night work is found as a predictor of work-family conflicts [73, 74]. Surprisingly, for white collar workers, in the current analysis the effect of night work on the turnover rate is found opposite. However, only 3,11 % of the white collar population in the analysis are subjected to night work and most likely entails a very specific profile of workers. Work during the non-traditional working hours occurs more often for blue collar workers.
Sickness. While for blue collar workers, a higher sickness percentage leads to a lower turnover probability, the opposite is true for white collar workers (see Fig. 12). The white collar result coincides with literature, where a higher percentage of sickness can indicate burn-out of the employee [75], making turnover more likely. The result for blue collar workers needs more investigation.
Change in probability with increasing percentage in sickness.
In order to assess differences between blue and white collars, marginal effects and the coefficients signs were interpreted. However, significance levels are easily reached in a large sample [58]. Therefore, a robustness check is necessary. In order to check robustness of the model, the total sample is divided in 100 stratified subsamples for both blue and white collar workers. For each subsample, the logistic model is rerun and the coefficient value for each variable is checked. Figures 13–18 plot the coefficient value for each fold for the variable gender and the variables that were found to have an opposite sign for blue and white collar workers. In each graph, the coefficient values are given on the Y-axis and each point represents one fold. In the discussion, it became clear that white collar men and women have a more similar turnover behavior than blue collar men and women. This is confirmed through the subsamples. While for blue collar employees, women were found to turnover less than men in 91% of the folds, this was only so in 48% of the white collar folds (see Fig. 13). This is not surprising, considering that the variable gender was not significant in explaining the turnover probability for white collar workers. Aside from the graphs, a same sign percentage is indicated. This percentage implies the folds in which the variable coefficient has the same sign as the coefficient in the global model.
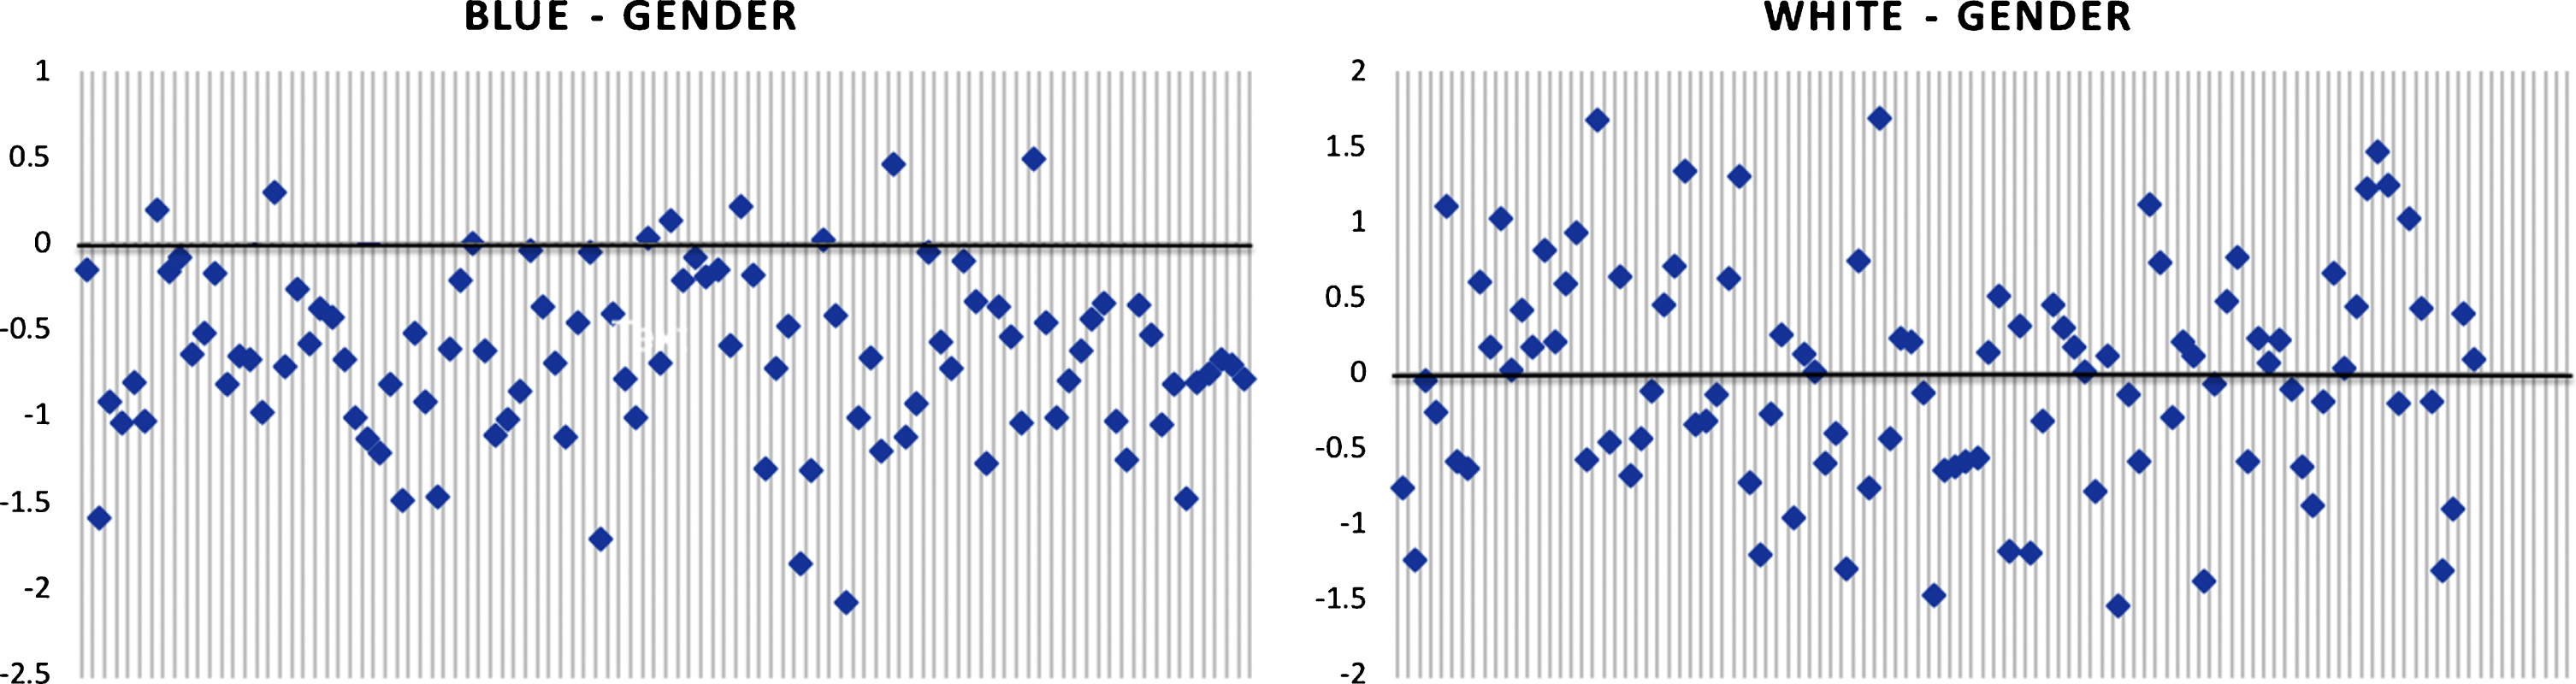
Values of the coefficient for the variable gender. Same sign percentage for blue collar: 91%; for white collar: 48%.

Values of the coefficient for the variable nationality. Same sign percentage for blue collar: 73%; for white collar: 61%.

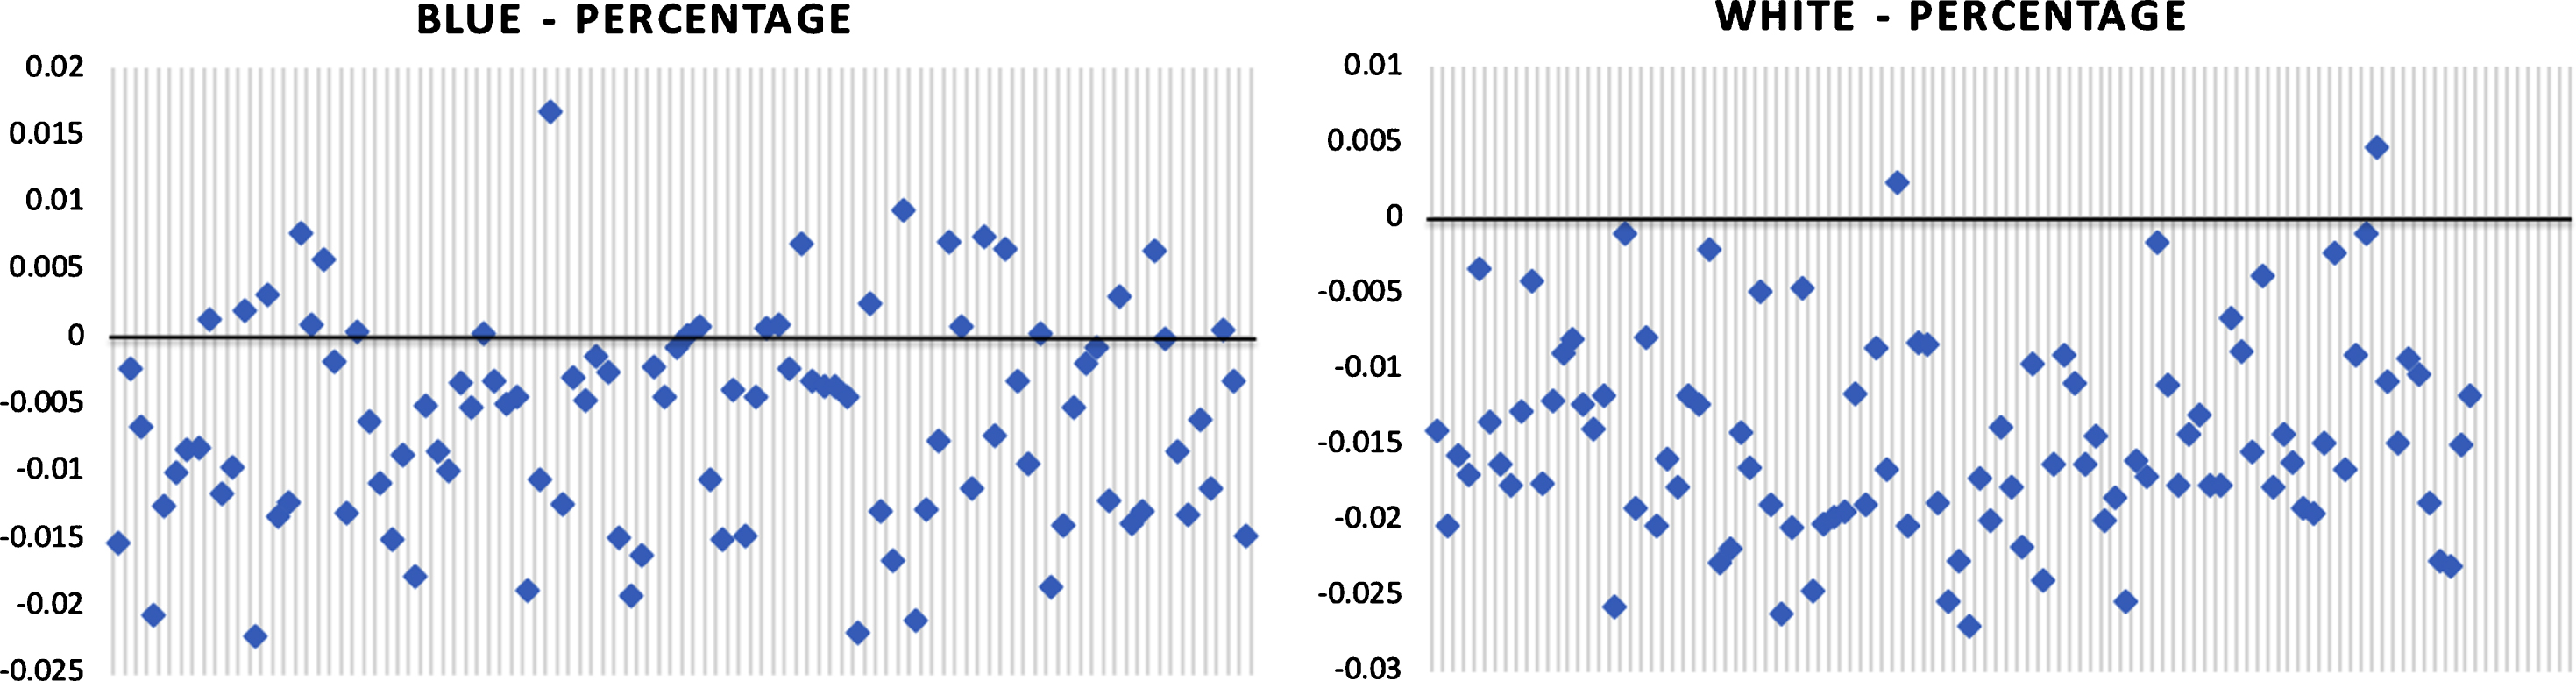
Values of the coefficient for the variable pay. Same sign percentage for blue collar: 92%; for white collar: 85%.
Values of the coefficient for the variable percentage. Same sign percentage for blue collar: 76%; for white collar: 98%.
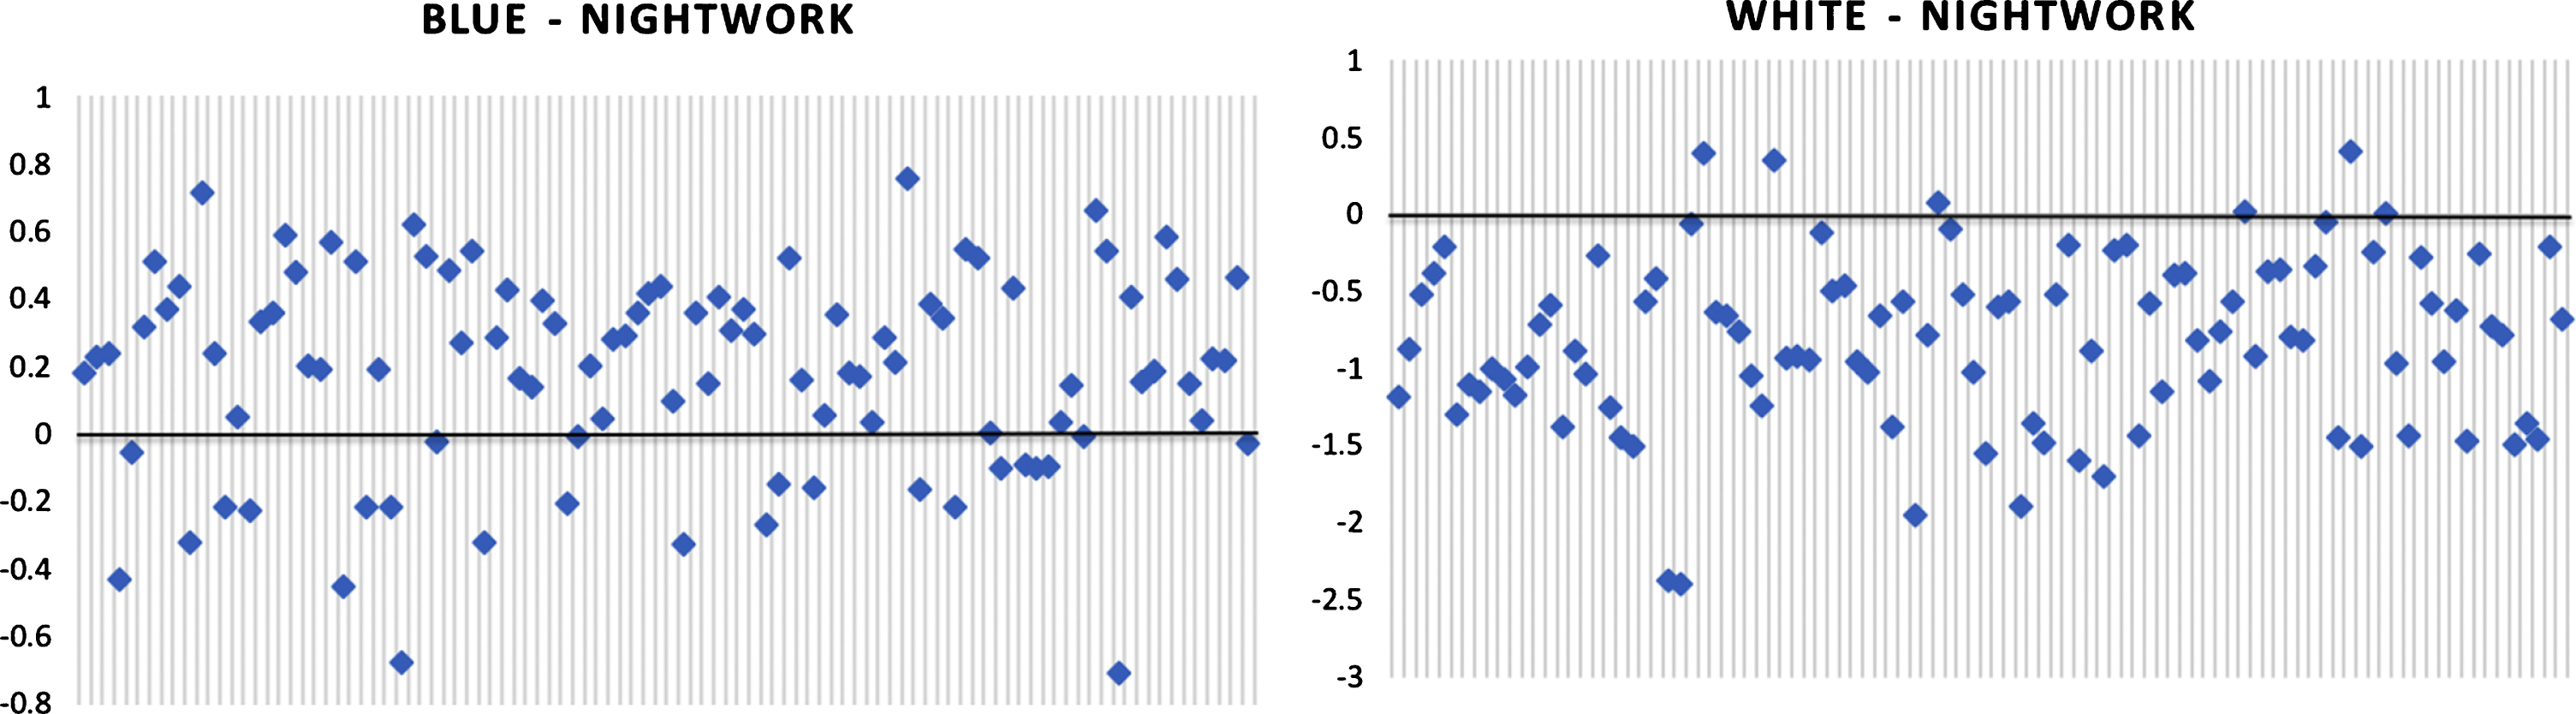
Values of the coefficient for the variable nightwork. Same sign percentage for blue collar: 74%; for white collar: 95%.

Values of the coefficient for the variable sickness. Same sign percentage for blue collar: 81%; for white collar: 97%.
Lastly, the same sign percentages for each coefficient are summarized in Table 5. Moreover, the number of folds where a significance level of 0.05 is reached, is given in Table 6.
Same sign percentages over the different folds
Number of folds with significance level lower than 0.05
The results show, as suggested by earlier theories, a difference in the pay-turnover relation for blue and white collar workers. Confirmation is found for the fact that blue collar workers attach more importance to extrinsic motivators, while this is less so for white collar workers. Another explanation put forward by Schreurs et al. is that the available resources - in this case salary - on the job are more valued by blue collar workers, due to a higher sensitivity [76]. Since blue collar jobs often offer fewer job resources than white collar jobs, blue collar workers might be more sensitive to receiving these resources. A raise in salary for blue collar workers, could therefore still lead to a lower turnover probability, where this might not effect white collar workers. As indicated earlier, the new evolving career theories focus on white collar workers. The results of the current study suggest that blue collar careers still are in accordance with older theories or that there is a need for differentiation in these theories. A remarkable difference is found for the gender-turnover relation. In the beginning of the century, a women expansionist theory was put forward by Barnett and Hyde [77]. The authors found an increasingly similar work-place behavior between men and women. The fact that this theory is developed on mainly higher-educated middle-class Americans, again, suggests that it might not be applicable to blue collar workers. The current findings underline this suggestion.
Conclusion
From the analysis, it became clear that blue and white collar workers indeed have different turnover behaviors. Opposite effects on turnover were identified for nationality and several work-specific factors. First, a non-Belgian nationality leads to a lower turnover probability for blue collar workers, but a higher probability for white collar workers. The relationship we find for white collars is put forward by literature as well [32, 33]. The nationality-turnover relationship for blue collar workers needs further research. Second, fixed pay has a negative relation for blue collar workers only. This means that a higher salary will lead to a lower turnover probability. An explanation we put forward is that blue collar workers are more focused on basic needs such as salary and security, meaning that pay can still have a retaining effect on these employees. Third, the negative relation of work percentage to turnover probability is moderated by gender for blue collar workers only. For white collar workers, no significant relation was found for this interaction variable. Findings by D’Addio et al. and Higgins et al. are thus only confirmed for blue collar workers [45, 46]. Fourth, night work leads to a higher turnover probability for blue collar workers, but the opposite is true for white collar workers. However, in order to draw conclusions, more information would be needed on the white collar profiles which are subjected to night work. Lastly, a higher sickness percentage leads to an increasing turnover probability for white collar workers only. For blue collar workers, the relation is opposite. However, only 21% of the subsamples reach a significance level for blue collar workers, implying that there is no actual relation between sickness and turnover for blue collar workers.
The current analysis also brought forward that the behavior for white collar men and women is more similar than blue collar men and woman. This coincides with the results from Griffeth et al., who found a similar turnover rate for higher educated men and women [21].
The determinants we found that influence blue and white collar workers in the same way generally coincide with past literature. An unexpected result was the effect of the company car on turnover behavior. This would imply that a company car has no retaining effect on employees, which is an interesting result for HR executives.
Theoretical and practical implications
In the current paper, a large sample of the Belgian population was analyzed. The large sample size makes it possible to draw general conclusions in regards to the Belgian workforce. In general, the findings of the paper are aligned with findings from past literature.
The blue and white collar differences that have been brought to the surface add to the existing literature. The current paper points out that more theoretical and psychological research should be carried out where these two types of workers are separately analyzed.
Limitations and further research
The dataset based approach allows us to investigate differences on a large scale between blue and white collar workers. With existing literature, we aimed to find an explanation for the observed differences. However, we are not able to identify the underlying reasons for these differences. Further research should focus on the explanation of the different behavior. If we learn why certain demographic variables lead to opposite behavior for blue and white collar workers, this knowledge can be used for retention purposes.
A dataset based approach is confined to whichever variables are present in the dataset. Differences in regards to job satisfaction and organizational commitment could not be investigated since no information concerning these variables are present in the dataset. Also, the studied dataset contains no information on the education level of the employee. However, the education level is highly correlated with the job status, so it is uncertain if the different effects to turnover might be primarily caused through educational differences instead of status difference.
Lastly, the external validity of some of the results is limited since the dataset is confined to Belgium. The reasons why the company car, for example, might lead to a higher turnover probability, are very country-specific. In other countries, where company cars are not a common practice in most companies, or where traffic is less congested, the effect on turnover might be opposite.
Conflict of interest
None to report.
Footnotes
Small and medium sized corporation if the company has less than 100 employees.