



Abstract
BACKGROUND:
Work ability is the physical and psychological capacity of workers to meet the demands of a job; it declines with age, and the effect is multiplied in a sedentary job. Early detection of workers at risk would help to improve their functional capacity and work efficiency.
OBJECTIVE:
To identify factors and develop a prediction model for low work ability among sedentary aging office workers.
METHODS:
In this case-control study, work ability among sedentary aging workers was evaluated using a Work Ability Questionnaire (WAQ). The worker’s age, gender, BMI, marital status, years at work, diabetes, hypertension, diagnosed medical condition, musculoskeletal problems, medicine intake, menopause, physical activity, sedentary work behaviour and six job-related tasks were recorded. Multiple logistic regression was performed, and the odds ratio was calculated for the variables assessed.
RESULTS:
One hundred and fifty seven sedentary aging workers were assessed for 19 independent factors. BMI and years at work in the demographic domain, diagnosed medical condition and intake of medicine in the health-related domain and handgrip strength in the task domain were found to have a statistically significant odds ratio for poor work ability.
CONCLUSIONS:
The study identified factors influencing work ability among sedentary aging workers and a prediction model was developed.
Keywords
Introduction
Work ability (WA) is the physical and psychological capacity of workers to meet the demands of work. It is shown to have a direct relation with the risk of non-communicable diseases (NCDs), musculoskeletal disorders, absenteeism, productivity and quality of life [1]. Aging workers constitute a larger segment of the workforce [2] and aging demonstrates a reduction in the functional reserve in most of the physiological systems which ultimately leads to the decline of WA [3, 4]. There is a specific deterioration of 12%in WA estimated per year after the age of 45 [3].
‘Sedentary work’ is defined as “any work behaviour characterized by an energy expenditure ≤1.5 metabolic equivalents (METs) in a seated or reclining posture” [5]. Sedentary work profile accelerates age-related changes like loss of skeletal muscle mass, strength, power and development of different cardiovascular comorbidities, which eventually reinforces the declination of WA [6]. High physical demands, poor work environment, lack of freedom, life satisfaction, sitting work posture and physical exercises during leisure time are few factors that influence perceived WA [7]. However, the factors affecting WA among sedentary aging workers are not entirely explored; identifying those factors would help in maintaining the worker’s productivity and efficiency. Therefore, the objective of this study is to determine the factors and develop a prediction model for low WA among sedentary aging office workers.
Methods
This case-control study was conducted among office workers of a Higher Education Institute, Manipal Academy of Higher Education, Karnataka, India. Workers of either gender aged 45 years and above with a sitting time of ≥30 hours a week or ≥6 hours a day during work participated in this study. Workers who have undergone any surgery in the past three months or having upper limb dysfunction hindering evaluation of tasks were excluded. The sample size was estimated to be n = 178 using G-power software, estimating the G-power effect of 0.3 (libguide.library.kent.edu).
This research complied with the tenets of the Declaration of Helsinki and was approved by the Institutional Ethics Committee (IEC 117/2017) and was registered in the Clinical Trial Registry- India (CTRI/2018/03/012869). A self-developed, reliable (ICC: 0.776; p = 0.027) and content validated (under copyright), Work Ability Questionnaire (WAQ) was used to evaluate WA in this study. The WAQ consists of socio-demographic, health-related, work ability-related and impact of health on work ability related domains; 25 items with a weighted scoring for each domain and a total score of 110.
Permission was taken from the human resource department of the institution to conduct the study. Participants were explained about the study procedures and their written informed consent was taken. Age, gender, BMI, marital status, years at work, diabetes and hypertension status, diagnosed medical condition, musculoskeletal problem, medicine intake, menopause details, physical activity, and sedentary work behaviour and six job-related tasks were recorded. The participants also completed the WAQ, Global Physical Activity Questionnaire (GPAQ) and Sedentary Behaviour Questionnaire (SBQ) to quantify physical activity.
Performance testing included six functional tasks, namely Repetitive Side Reaching (RSR), Hand and Forearm Dexterity (HFD), Handgrip strength (HG), Tip pinch grip strength (TP), Palmar pinch grip strength (PG) and Key pinch grip strength (KG). RSR was assessed with participants seated comfortably on the chair with two bowls (14 cm diameter with 30 marbles) kept on wingspan distance of arm on the table, the participants were asked to move the marbles horizontally from one bowl to the other from right to left with the right hand as fast as possible and vice versa. Time taken to move 30 marbles were scored, and the average score was recorded in seconds.
HFD was assessed using the Purdue Pegboard Test [8]. The workers were made to sit on a chair with backrest and the pegboard was placed on a table in front. Demonstration of the test and practice trial was given. The workers were instructed to perform pegboard test for three times. The test was performed on either side and with both hands together and the average score was considered. The test-retest reliability correlation coefficient is 0.82 to 0.91.
Jamar Hand Dynamometer was used to assess HG whereas TP, PG, and KG were assessed using Jamar Pinch Gauge [9]. Standard procedures were followed for HFD, HG, TP, PG, and KG [10, 11]. Participants were seated on a standard height chair without armrests and positioned as per the recommendations of the American Society of Hand Therapists. The test was performed on participants seated with shoulders adducted and neutrally rotated, elbow flexed at 90, forearm in a neutral position, and wrist in 0-30 dorsiflexion and 0–15 ulnar deviation. The dynamometer was adjusted based on the participant’s hand size in order to obtain an optimal grip position. Three measurements of handgrip strength were taken for each hand, with a 10-second rest between the measurements to avoid fatigue. The mean value of all three measurements was calculated. The measurement method was demonstrated before beginning the test. This position was chosen as it has been shown to provide highly repeatable measurements. Intra and inter tester reliability of hand dynamometer is 0.85 to 0.98.
TP, PG and KG strength was assessed using a pinch gauge. Demonstrations for the TP, PG and KG methods were performed before beginning the test. Participants were seated on a standard height chair without armrests and positioned as per the American Society of Hand Therapists recommendation [12]. The pinch gauge was placed between the tip of the thumb and the tip of the index finger for TP, between the palm of thumb and palm of the index finger for PG and the palm of thumb and the lateral aspect of the index finger for KG. Three measurements of pinch strength were taken for each hand, with a 10-second rest between the measurements to avoid fatigue. The mean value of all three measurements was calculated.
Statistical analysis was carried out using SPSS version 15.0 for Windows; descriptive statistics were used to summarize the data. The worker’s age, gender, BMI, marital status, years at work, diabetes and hypertension status, diagnosed medical condition, musculoskeletal problem, medicine intake, menopause, physical activity, and sedentary work behaviour and six work-related tasks were recorded as independent variables. Mann-Whitney U test and Chi-square test were used to compare the continuous and categorical variables, respectively. Multiple logistic regression was performed, the odds ratio was calculated for the variables assessed and significance was set at p ≥ 0.05.
Results
The flow of participants is represented in Fig. 1. About 157 sedentary office workers working in the University participated in the study. The demographic characteristics and functional strength profile of the participants are represented in Table 1. The workers were categorized into cases (poor work ability score < 90) and controls (good work ability score ≥90). Comparison of the socio-demographic characteristics between cases and controls did not show a statistically significant difference except for gender, marital status, hypertension, diagnosed medical condition, musculoskeletal problem, medicine intake, physical activity, and sedentary work behaviour. The participants in the control group had 285.32±61.82 MET min/week of physical activity more and 87.43±33.68 min/week of less sedentary time when compared with the cases. The number of participants with hypertension, diagnosed medical condition, musculoskeletal problem and those who are taking medicines were more among the selected cases.
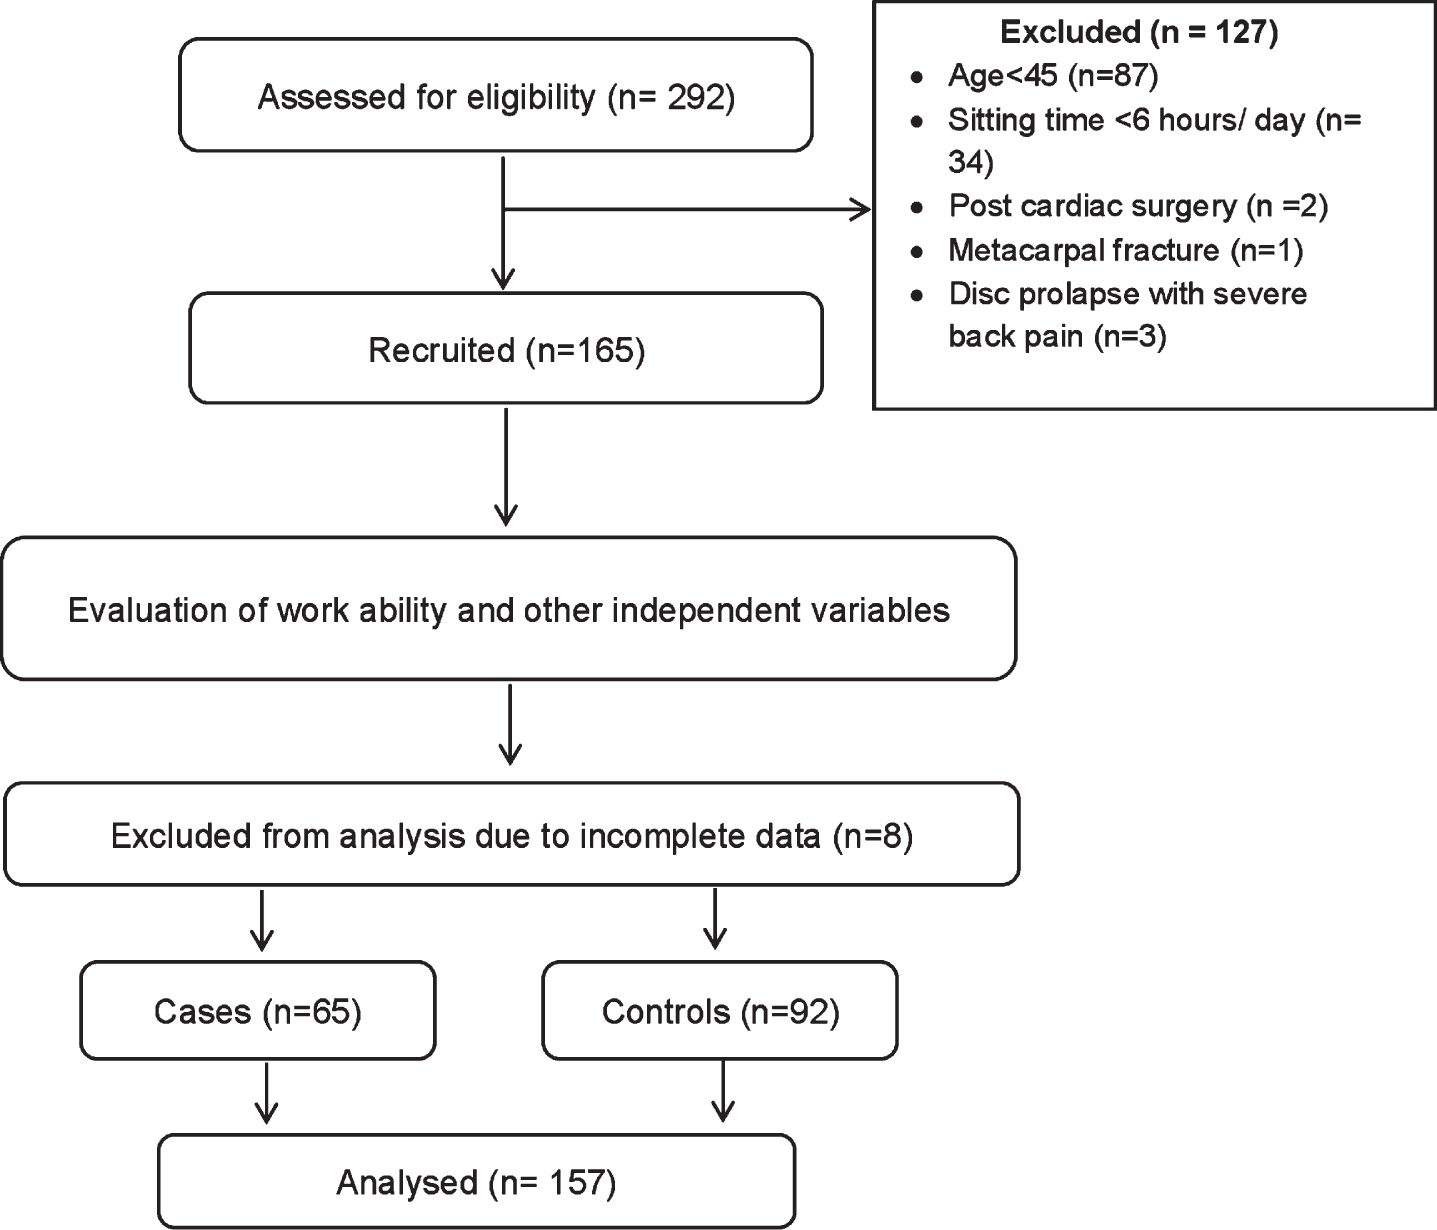
Flow of participants.
Demographic characteristics and functional strength profile of the participants (n = 157)
GPAQ: Global physical activity questionnaire; Kg: kilogram; cm: centimeter.
Table 2 depicts the adjusted and unadjusted odds ratio of the individual predictive factors on work ability among the participants. Age, hypertension, years at work, presence of the diagnosed medical condition and MSK problem, medicine intake, physical activity status, hand and forearm dexterity and handgrip showed a statistically significant association during univariate analysis. But when adjusted for the other variables, a statistically significant odds ratio was observed for BMI, years at work, diagnosed medical condition, medicine intake physical activity and handgrip only and hence were taken for developing the regression model.
Adjusted and unadjusted odds ratio among participants (n = 157)
RSR: repeated side reaching; HFD: hand and finger dexterity; HG: hand grip strength; TP: tip pinch grip strength; PG: palmar pinch grip strength; KG: key pinch grip strength.
The regression model developed for the risk of poor WA among sedentary aging workers is Exp [–1.412 +1.554 (BMI) + 0.107 (years at work) + 3.476 (diagnosed medical conditions) + 1.746 (medicine intake) –0.049 (handgrip strength)] with an r2 of 0.592. Among the six variables considered in the model, diagnosed medical condition and medicine intake are categorical ones whereas the others are continuous variables. A negative association was found between the handgrip and poor WA whereas all other variables showed a positive association.
We evaluated selected socio-demographic, health-related and work-related factors and explored their influence on perceived WA among sedentary aging workers. Preserving work ability among sedentary aging workers is the current need of the hour as the percentage of these workers are increasing, Several factors seem to influence perceived WA among sedentary aging workers. BMI was found to be a significant predictor of overall work ability. BMI in the healthy range is associated with good work ability as reported in previous studies. This may suggest that individuals with low (< 18 kg/m2) or high BMI (> 25 kg/m2) might have poor perceived WA, especially in sedentary jobs [13].
Years of work was associated with poor WA. Work stressors, mainly years at work was a predictor of poor work ability. A possible reason could be the increased presence of medical comorbidities with age, which can significantly give rise to stress symptoms and thereby reduce the potential to be productive [14]. A stratified analysis of the data showed an increase in the percentage of workers with one or more medical comorbidities with years at work. Also, other factors like family issues [15], economic issues [16], workplace monotony and poor peer relationship [17] could add on to poor WA.
Diagnosed medical conditions including cardiac problems, asthma, gastrointestinal disorders and disorders of the MSK system are found to have a positive association with poor WA. These findings suggest that physical health is a significant factor in the perception of WA among older workers. The presence of diseases may affect overall work productivity in these individuals [18–20]. The sedentary nature of work compounded by reduced out of work physical activity are a well-established risk factor for many non-communicable diseases. Once a health condition has been diagnosed, the exercise and activity capacity of the individual gets compromised which could be the reason for reduced work capacity. Intake of medicine is another factor that had a positive association and appeared in the regression model and it goes parallel with a diagnosed medical condition.
Among the six work-related tasks, handgrip strength showed an association with poor WA. This relationship is negative, so any increase in handgrip strength has an inverse relation with poor workability. Handgrip strength is widely researched and its relationship has been established with a wide range of health conditions, hence decline grip strength is considered as a major predictor in many of the adverse health events [21, 22].
We hypothesized an association between GPAQ scores and WA. However, it showed a statistically significant difference with an odds ratio of one, which indicates that there was no association between physical activity and workability. The results would have been different with an objective tool like accelerometery or activity monitor for quantifying physical activity.
This study had a few limitations. First and fore-most, the sequence of assessments was not randomised. As all the assessments were carried out by one investigator, sequence randomization of the tests would have avoided the potential reporting bias. Secondly, we did not explore the influence of potentially relevant lifestyle factors like smoking and alcohol intake on work ability. Thirdly, this study has been conducted on 157 workers despite the estimated sample size being 178 could be another limitation. Future studies could validate the present model, include activity monitors.
This research gives an overview of the factors affecting WA among sedentary aging office workers. The factors affecting WA could be different among sedentary aging workers when compared to young workers. This study paves the way in the easy identification of workers who are at a risk for decline in WA and would help in modifying the factors thereby enhancing productivity and quality of life.
Conclusion
This study identified work and worker related factors that could influence the WA of sedentary aging workers. BMI and years at work in the demographic domain, diagnosed medical condition and intake of medicine in the health-related domain and handgrip strength in the task domain influenced WA among sedentary aging workers.
Conflict of interest
The authors declare no conflict of interest for this article.
Funding
This study did not receive funding from any source.