



Abstract
BACKGROUND:
Today, sedentary lifestyles are very common for children. Therefore, maintaining a good posture while sitting is very important to prevent musculoskeletal disorders. To maintain a good posture, the formation of good postural habit must be encouraged through posture correction. However, long-term observation is required for effective posture correction. Additionally, posture correction is more effective when it is performed in real time.
OBJECTIVE:
The goal of this study is to classify nine representative sitting postures of children by applying a machine learning technique using pressure distribution data according to the sitting postures.
METHODS:
In this study, a customized film-type pressure sensor was developed and pressure distribution data from nine sitting postures was collected from seven to twelve year-old children. A convolutional neural network (CNN) was applied to classify the sitting postures and three experiments were conducted to evaluate the performance of the model in three applicable usage scenarios: usage by familiar identifiable users, usage by familiar, but unidentifiable users, and usage by unfamiliar users.
RESULTS:
The results of our experiments revealed model accuracies of 99.66%, 99.40%, and 77.35%, respectively. When comparing the recall values for each posture, leaning left and leaning right postures had high recall values, but good posture, leaning forward, and crossed-legs postures had low recall values.
CONCLUSION:
The results of experiments indicated that CNN is an excellent classification method to classify the posture when the pressure distribution data is used as input data. This study is expected to contribute a development of system to aid in observing the natural sitting behavior of children and correcting poor posture in real time.
Introduction
Sedentary lifestyles are very common for modern people and it is considered important to maintain a good posture while sitting because inappropriate sitting postures may lead to musculoskeletal disorders [1–5]. Proper sitting posture is especially important for children [6, 7]. The postural habits formed during childhood are likely to carry over to adulthood because these habits do not change easily once they are formed [8, 9]. Additionally, musculoskeletal disorders that develop during childhood can be more dangerous than those that develop during adulthood. Back pain during childhood caused by improper posture can be a major risk factor for the development of lumbar diseases as growth occurs [10, 11]. These diseases are difficult to treat once they develop and are likely to cause similar diseases in the future [12]. Furthermore, they can be a deterioration factor for the physical development of children [13]. Therefore, it is important to form good postural habits during childhood.
To effectively encourage children to form good postural habits, it is desirable for posture observation and correction to be performed in real time. Traditionally, posture corrections have been made in such a way that human observers (ergonomic specialists, occupational therapists, teachers, parents, etc.) monitor a child’s sitting behavior, identify the causes of postural problems, and encourage the child to sit properly [14–16]. However, this process has two major drawbacks. The first is a drawback of the observation method. This method requires significant time and resource investment, meaning it is difficult perform long-term observation. Additionally, reliability problems may arise because of variance between observers [17]. The second drawback is a problem with the correction method. The effectiveness of this method may decrease over time because it is difficult for users to remember guidelines and maintain good posture. Zheng and Morrell postulated that real-time posture correction may be more effective for learning and maintaining good posture based on the results of interviews with ergonomic specialists and occupational therapists [18]. Because of these problems, a system that automatically monitors and corrects posture in real time is needed.
In order to develop such a system, an automatic posture classification system is required to collect objective measurements from a subject and determine their posture. Such systems can be roughly divided into two types according to the conditions for sensing. The first is a type of system that observes posture by attaching various devices to the subject’s body. For instance, sensors such as accelerometers, gyroscopes, or goniometers can be attached to the subject’s body and directly measure their postures based on inertial measurements of body parts and joints [19–21]. Systems that use markers for motion capture also belong to this type [22–24]. In this type of system, it is possible to observe the posture of a subject accurately and without any complex data processing because of the directness of measurement. However, such systems are not usable in the real world because of their hardware complexity and natural motion inhibition. According to Fradet and his collegues, such systems require careful selection of attachment points for sensors (or markers) to acquire accurate data, meaning users would require expert knowledge [25]. Additionally, the attached sensors (or markers) could inhibit the natural movement of subjects [26]. The second type is systems that do not require any devices to be attached to a subject’s body. Marker-less motion capture systems belong to this type. In such systems, a subject is filmed by a depth camera and RGB-camera, and the posture of the subject is calculated using a skeleton-tracking algorithm [26–30]. Based on recent developments in image processing technology, a system using only an RGB-camera has been developed [31]. These systems do not physically limit the movement of subjects, meaning they allow more natural movement. However, these systems can still limit the natural behavior of subjects because they can give subjects a negative impression of being monitored, which also raises privacy concerns [17]. Because of the drawbacks mentioned above, several attempts have been made to develop novel posture monitoring systems using pressure sensors [17, 32–35]. These systems predict a subject’s posture based on center of pressure, pressure distribution, etc. Such systems do not require any devices other than a chair with built-in sensors and do not physically or psychologically interfere with the movement of subjects, meaning they are suitable for use in the real world and enable observation of the natural behavior of subjects. However, because these systems do not directly measure body parts or joint positions, researches have struggled to identify optimal hardware configurations and analysis techniques with the goal of predicting more posture more accurately.
In previous studies, Tan et al. recruited adult subjects aged 18 to 60 years and obtained pressure data for a total of ten sitting postures [36]. Commercial mat-type pressure sensors (consisting of a grid of 42×48 force-sensitive resistors (FSRs)) were attached to the seat pan and backrest of a chair. The obtained pressure distribution data were analyzed by PCA-based classification algorithms to predict sitting postures. Zemp et al. performed a sitting posture prediction study on adults aged 24 to 64 years [35]. A total of 16 FSRs were attached to the seat pan, backrest, and armrest of a chair. A total of seven sitting postures were predicted. In addition to pressure distribution data, they utilized backrest angle data captured by motion-modules equipped with accelerometers, gyroscopes, and magnetometers. Five different classification algorithms were applied to predict sitting postures: support vector machine, multinomial regression, neural network, random forest, and boosting. Chenu et al. predicted nine sitting postures with varying waist and hip positions [37]. A total of twelve adult subjects participated and commercial mat-type pressure sensors (32×32 FSRs) were attached to the seat pan of a chair. Instead of using a machine learning technique, posture classification was performed based on the pre-mapped pressure distributions of each posture. Meyer et al. predicted a total of sixteen sitting postures using two different mat-type pressure sensors [33]. One was a commercial sensor (32×32 FSRs) and the other was a custom-made sensor consisting of 240 FSRs. Compared to other related studies, they predicted a more diverse array of postures. A Naïve Bayes classifier was applied to classify the postures. Xu et al. developed a textile pressure sensor mat called the “eCushion,” consisting of 256 sensors (16×16 FSRs), and attached it to the seat pan of a chair [17]. They predicted seven postures using a dynamic time warping-based classification method. Zemp et al. used a custom-made mat-type pressure sensor (8×8 FSRs) called the “SIT-CAT” to predict seven sitting postures [38]. Adult subjects aged 25 to 57 years participated and the random forest method was applied as a prediction algorithm. Bao et al. attempted to predict sitting postures using fewer sensors by attaching only five FSRs to the seat pan of a chair [39]. Five static postures and two activities (swaying and shaking) were selected for testing and a density-based clustering method was applied to classify the postures. Liang and his colleague tried to find optimal number of pressure sensors and their placement on seat [40]. To achieve this goal, they acquired the data of 15 postures from 15 participants and conduct classification experiment using AdaBoost algorithm. Zhou et al developed wireless smart blanket which has 1024 (32×32) sensing points for sitting posture monitoring [41]. The data of 12 states (11 postures and not seated condition) were collected from 16 participants. Especially they used simple algorithm based on correlation score vector considering time-efficiency of calculation. Huang and his colleague classified 8 postures using 64 sensing units in 52 by 44 piezo-resistive sensor array [42]. They put the system on the seat and collect the data from 16 participants and classified the postures using ANN algorithm. The system developed by Roh et al. had 4 load cells which are located under seat cushion [43]. They acquired the data of 6 postures from 9 participants in the main test. They compared the multiple algorithms (SVM, Linear and quadratic discriminant analysis, Naïve Bayes algorithm, random forest and Decision tree). The results showed that SVM was the most effective algorithm. Jeong and Park classified 8 postures using customized sensing system [44]. The system consisted of 6 (2×3) FSRs on seat and 6 (2×3) distance sensors on back rest. The data was acquired from 36 participants and KNN algorithm was utilized as a classifier.
Previous studies predicted sitting postures using pressure data obtained by custom-made or commercial pressure sensors. The pressure sensors were typically attached to the seat pan of a chair and it can be reasonably assumed that the pressure distribution obtained from the seat pan is indispensable for predicting posture. For classification algorithms, researchers adopted various algorithms based on their hardware configurations and extracted input features. Although the number of predicted postures was different, most studies included an upright posture, leaning of the upper body in four directions (left, right, forward, backward), and postures for each foot crossing over the other. However, these studies had certain limitations. First, they acquired pressure data for selected postures, which are defined qualitatively. Considering the facts that each posture has intra-variability and the boundary of each posture is unclear, prediction results may be less reliable, even if the accuracy of classification is high. Second, these studies have mainly collected the data from adults. Even for the same posture, the pressure distributions of children may be different than those of adults. This is because children have distinctively different physical characteristics from adults in terms of body proportions, as well as the length, weight, and geometry of cervical vertebrae and joints [45]. According to Moes, various parameters that determine pressure distributions are influenced by demographic and anthropometric characteristics, such as body mass, gender, stature, somatotype, and body fat percentage [46]. It means that posture prediction systems developed for adults have limitations in reproducing the same performance when applied to children. Therefore, to develop a reliable system for predicting the postures of children, it is necessary to acquire data of qualitatively defined postures from children. In this study, a mat-type pressure sensor was developed and inserted into the seat pan of a chair for non-invasive observation and pressure distribution data for pre-defined postures of children were collected. A convolutional neural network (CNN) model, which is a famous deep learning algorithm for image classification [47, 48], was applied to classify sitting postures based on collected data. CNN has been successfully applied to image classification in various fields such as object recognition in an autonomous driving environment, medical diagnosis, face recognition [49–51], and the acquired pressure distribution data has a two-dimensional image structure. Thus, it can be seen that it is reasonable to apply CNN when classifying pre-defined sitting postures. Three independent experiments were performed considering three applicable usage scenarios: usage by familiar identifiable users, usage by familiar, but unidentifiable users, and usage by unfamiliar users.
Methodology
Hardware configuration and measurement characteristics
In order to acquire the pressure distribution data for sitting postures, a conventional chair for children (RA-070SDSF, Duoback Korea, Seoul, Korea) was equipped with a self-developed sensing cushion containing a film-type pressure sensor (Fig. 1). The chair could be adjusted for location of backrest, height of seat pan, and position of footrest to fit each participant’s body size. The size of the sensor was 318×318 mm and it included 64 (8×8) FSRs (TechStorm, Seoul, Korea). The pressure distribution data was recorded at a 10 Hz frequency and 12-bit resolution. The data was transmitted to a smartphone (Galaxy Note 3, Samsung, Seoul, Korea) through a Bluetooth network using appropriate applications.
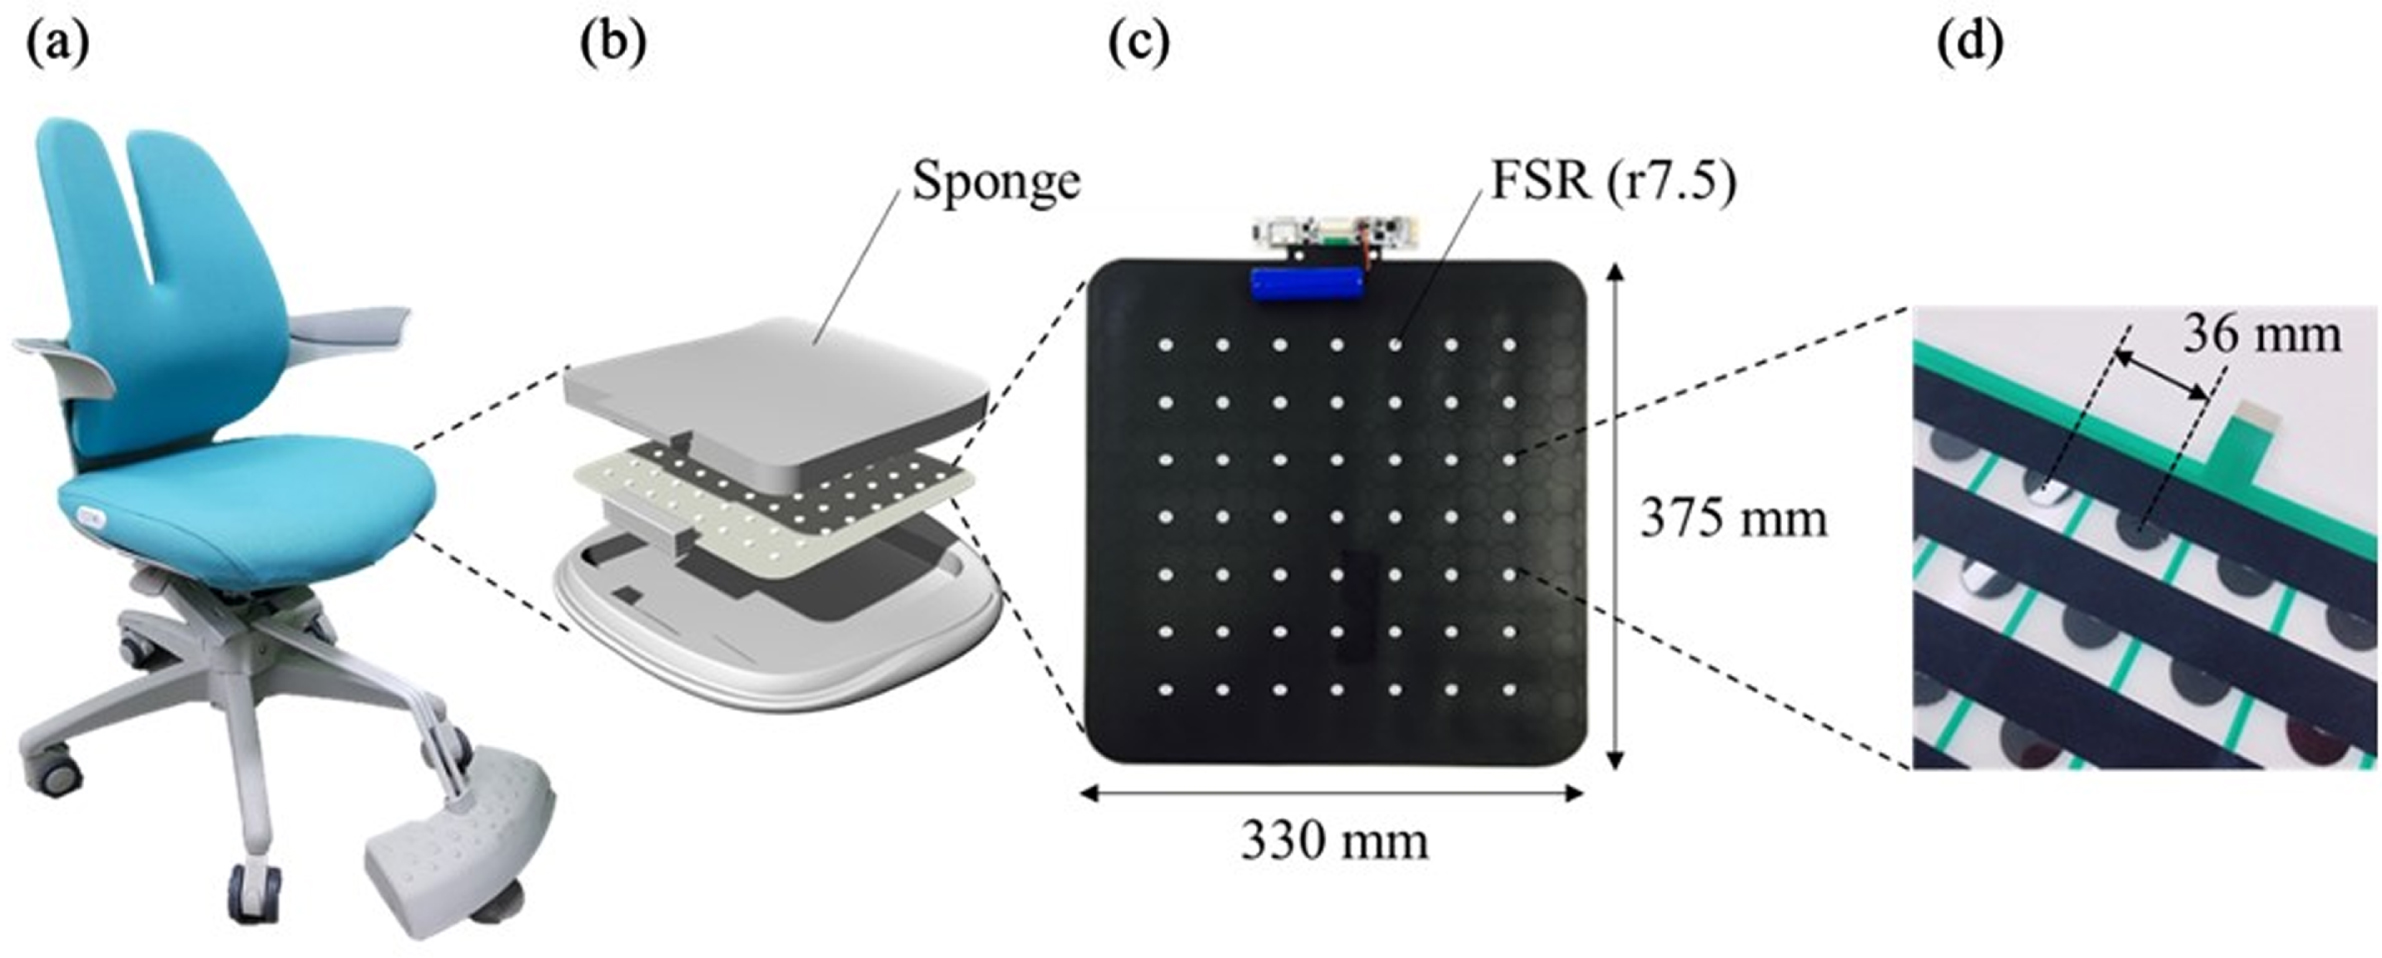
Hardware configuration. (a) Chair with a sensing cushion, (b) structure of sensing cushion, (c) customized film-type pressure sensor inserted into sensing cushion, (d) structure of sensor mat.
For efficient data acquisition, one chair with a sensor, one desk, two simple protractors, and two cameras were prepared for each of two participants. The pressure distribution data for each posture was measured while participants sat at the desk, which is used in Korean elementary schools. The protractors were installed to the right and rear of the participants to verify that they correctly assumed the prescribed posture. The cameras were installed to the left and front of the participants so that lateral and front views of the participants could be filmed. The dimensions of the environment are presented in Fig. 2.

Data acquisition environment.
Participants
A total of 24 healthy 7 to 12 year-old children (11 boys, 13 girls) were recruited for data acquisition. Their average age was 10.13 years (SD = 1.62). A body discomfort chart and visual analogue scale were used to screen unhealthy participants [52] and all participants passed. Prior to data collection, the participants and caregivers were informed regarding the purpose and procedure of the study, and they gave consent to participate. The anthropometric information of the participants is listed in Table 1.
Anthropometric information of participants
Anthropometric information of participants
Note. SD: Standard deviation.
In this study, nine postures were selected considering the commonly predicted postures in previous studies [10, 28–32] and commonly observed postures in Korean children [53, 54] (Fig. 3): (a) good posture, (b) leaning forward, (c) leaning left, (d) right foot over left, (e) leaning right, (f) left foot over right, (g) sitting at the front edge, (h) slouching, (i) crossed-legs. To cover a wider range of postures, sub-postures were included in some of the selected postures. The good posture includes a slightly leaning backward posture and upright posture (Fig. 3 (a)). The leaning forward posture includes a normally leaning forward posture and head down on the desk posture (Fig. 3 (b)). The leaning left posture includes a normally leaning left posture, leaning left and forward posture, and leaning left and slouching posture (Fig. 3 (c)). The right foot over left posture includes a right foot fully over left posture and right foot slightly over left posture (Fig. 3 (d)). The leaning right posture includes a normally leaning right posture, leaning right and forward posture, and leaning right and slouching posture (Fig. 3 (e)). The left foot over right posture includes a left foot fully over right posture and left foot slightly over right posture (Fig. 3 (f)). The definition of each posture was specifically defined based on the position of body parts, such as the hips, upper body, and legs (Table 2). In particular, the definitions for the upper body and hip positions for each posture were established according to previous studies related to workload assessment of sitting work and anthropometric recommendations for the usage of chairs [55–58].

Front and side views of selected sitting postures. (a) Good posture (left: slightly leaning backward posture, right: upright posture), (b) leaning forward posture (left: normally leaning forward posture, right: head down on the desk posture), (c) leaning left posture (left: normally leaning left, center: leaning left and forward posture, right: leaning left and slouching posture), (d) right foot over left posture (left: right foot fully over left posture, right: right foot slightly over left posture), (e) leaning right posture (left: normally leaning right posture, center: leaning right and forward posture, right: leaning right and slouching posture), (f) left foot over right posture (left: left foot fully over right posture, right: left foot slightly over right posture), (g) sitting at the front edge posture, (h) slouching posture, (i) crossed-legs posture.
Definitions of selected sitting postures
Each participant sat on the chair in front of the desk. The chair and desk were adjusted to fit their body based on anthropometric recommendations [58]. Each participant was given a verbal description of postures with supplementary figures until they could understand and perform each posture correctly. Next, pressure data for each posture were collected for thirty to forty seconds. During this time, participants were allowed to move within the acceptable ranges in the definition of each posture (Table 2). Movement was facilitated to prevent repetitive measurements of the same data during the measurement period and acquire data for various sub-postures that can occur within the definition of each posture. The participants were carefully monitored in real time to verify that they moved within the definition of each posture. This was then checked again using the recorded video. The selected postures were given in counterbalanced order. The total time for data acquisition was approximately an hour for each participant, including time for setup, instruction, and breaks. All participants received monetary compensation for their efforts.
Classification algorithm
A CNN was used to predict sitting postures. CNNs which was introduced by LeCun and Bengio [59] have become widely used in various fields, such as speech and image recognition [60–62], and have been proven to be reliable and powerful by many researches. A CNN is a type of multi-layer perceptron, but it is specialized for two-dimensional inputs by introducing convolution and sub-sampling techniques. Conventional neural networks cannot reflect characteristics of dimensionality because they consider inputs linearly. CNNs can also be optimized to handle computer vision tasks by introducing filters. A CNN consists of two types of layers called convolutional and pooling layers, which effectively reduce the number of weight parameters. Therefore, the complexity of a CNN is reduced by introducing these types of layers.
Because the acquired data (8×8) were too small to be optimal inputs for a CNN, it was necessary to adjust the inputs to a more appropriate size (16×16) through linear interpolation. This interpolation can represent inputs more densely and can smoothly represent the differences between pressure values (see Fig. 4 (a) and Fig. 4 (b)). After interpolation, the inputs were min-max normalized to make pressure the distributions for the same posture from different subjects more similar (see Fig. 4 (b) and Fig. 4 (c)).
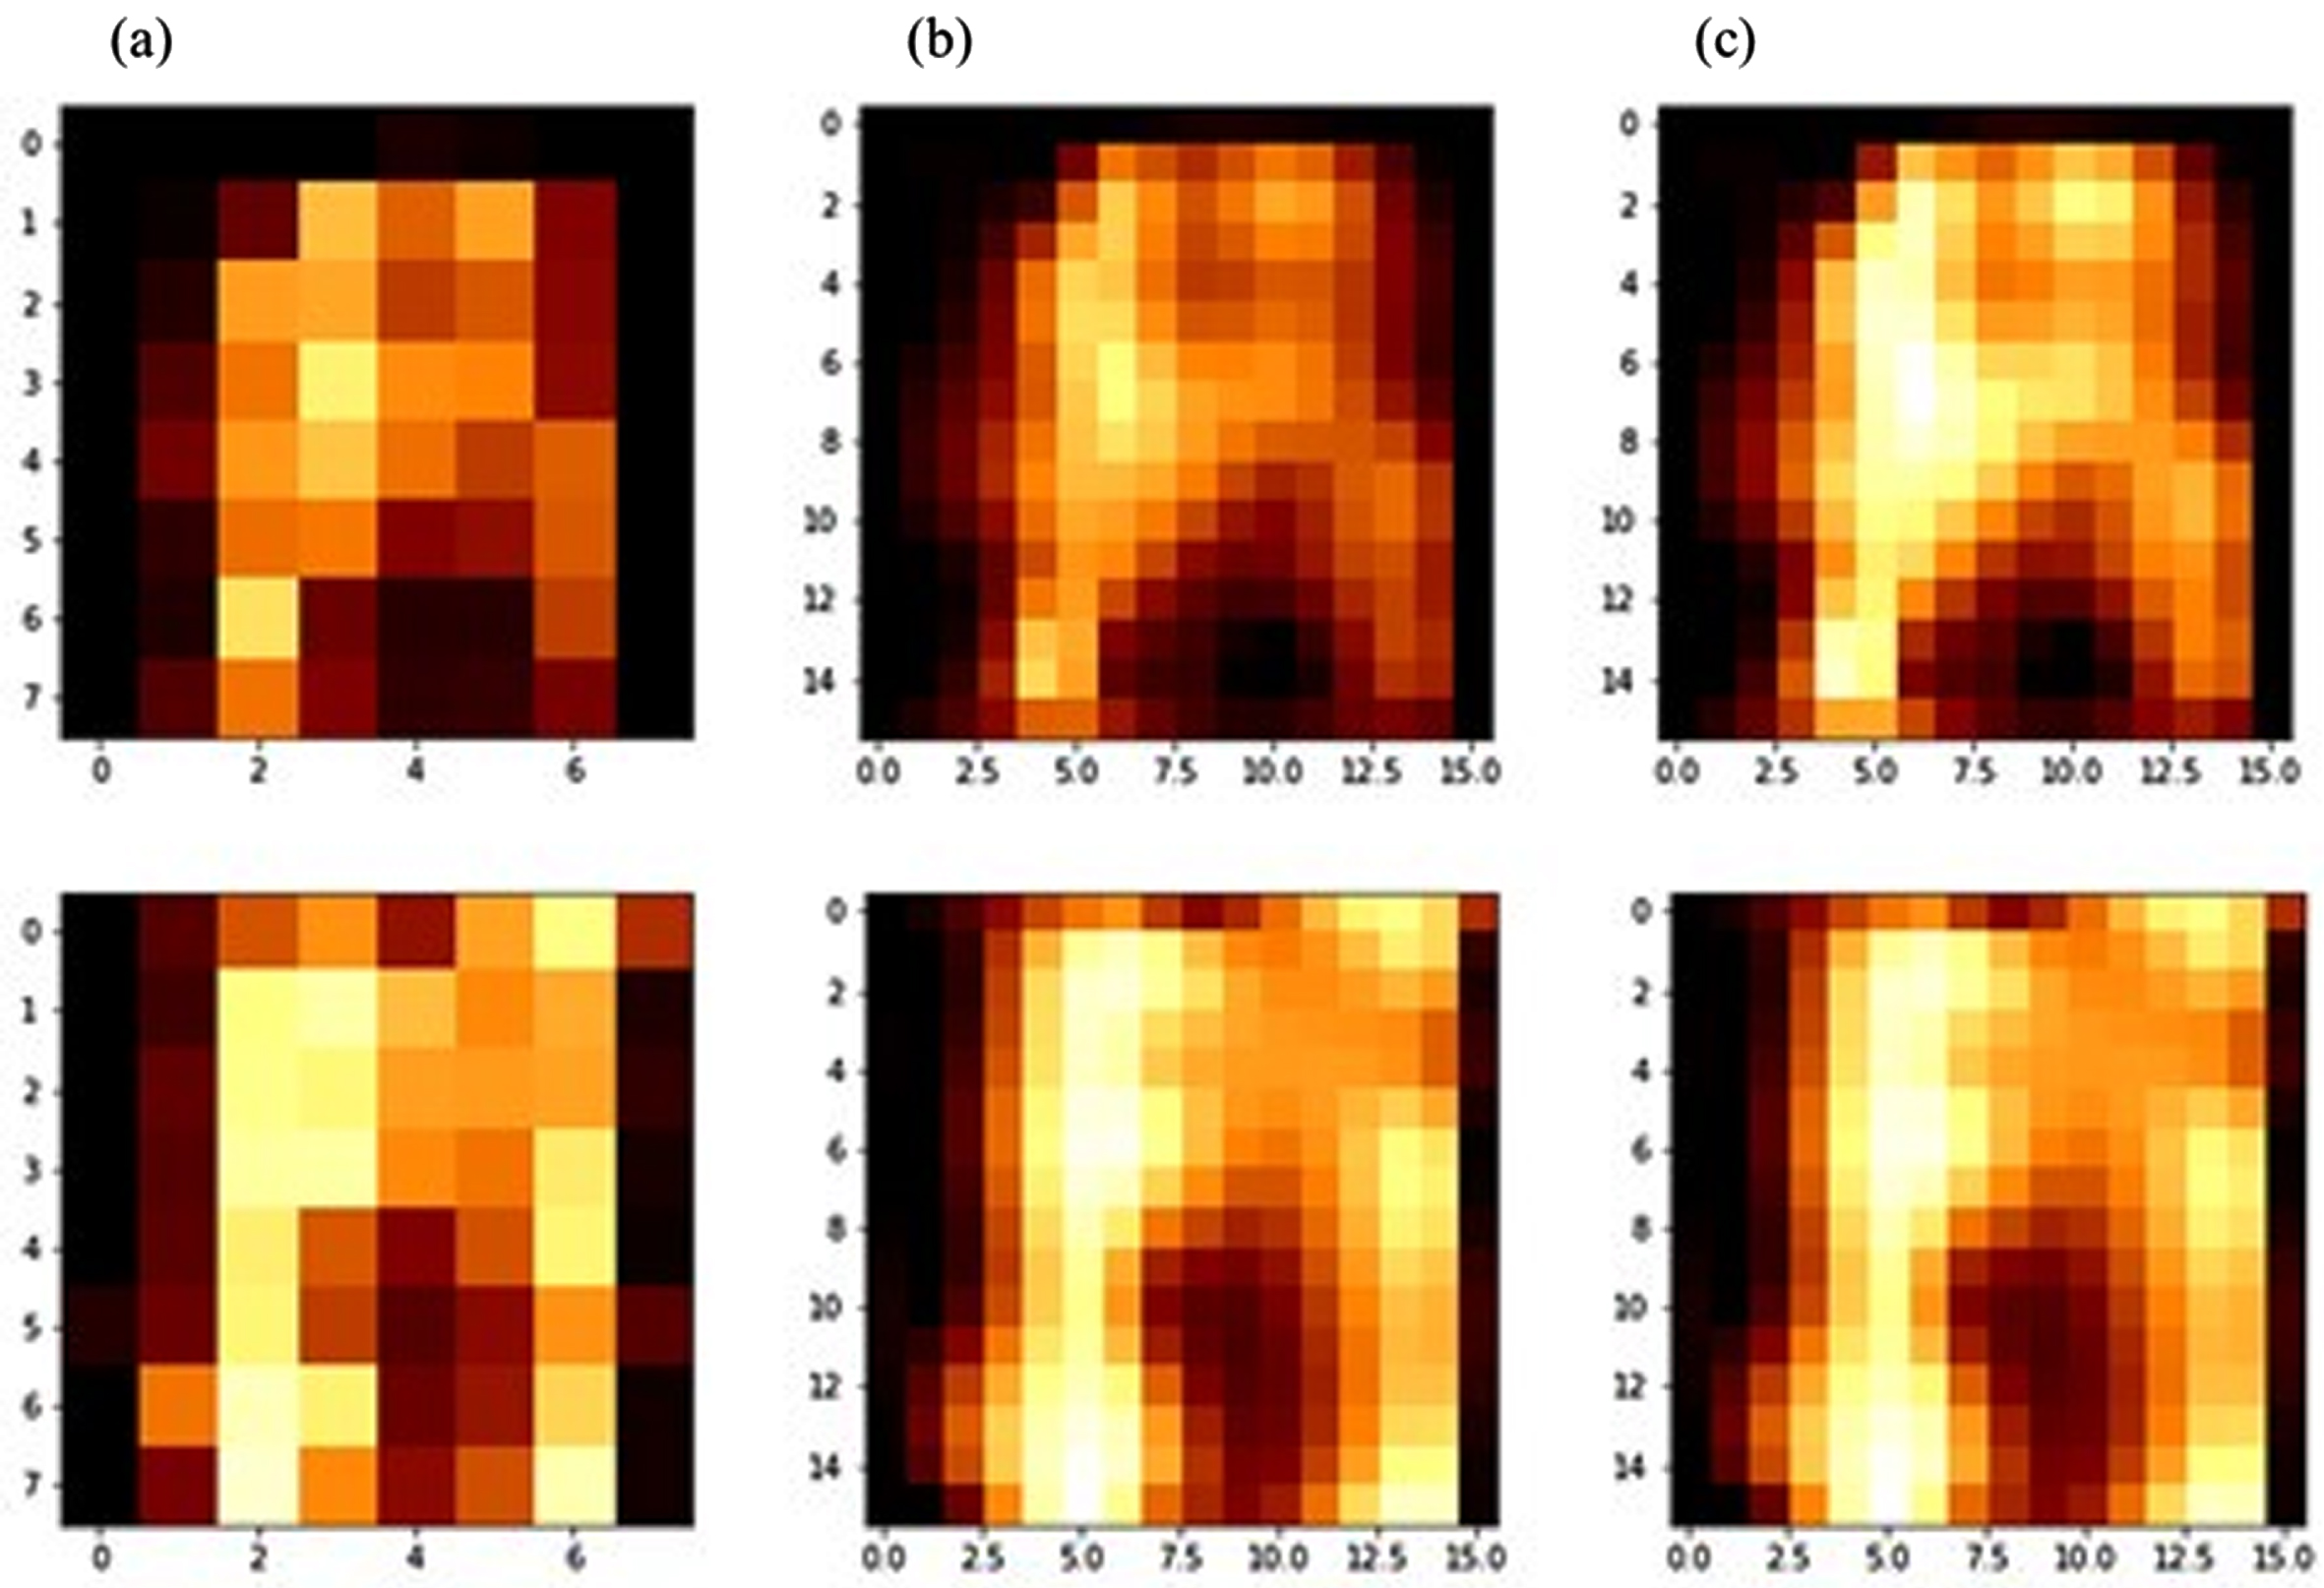
Transformation process for raw pressure distribution data. (a) Pressure distribution map from raw data, (b) refined pressure distribution map from interpolation, (c) refined pressure distribution map from normalization.
In this sturdy, the applied CNN consisted of four convolution and sub-sampling layers. Table 3 presents hyper-parameters and tuned values in our CNN. Hyper-parameters were set to the optimal value by validating 30% after training 70% of all sample data. In each layer, 50 feature maps were generated and 2×2 filters were used between the convolution and sub-sampling layers. Following the two pairs of convolution and sub-sampling layers, a fully connected layer with 100 neurons was connected to the output layer. The full architecture is illustrated in Fig. 5.
Hyper-parameters and their tuned values in CNN
Note. Rectified Linear Units (ReLU) function (f) is defined as f(x) = max (0,x).
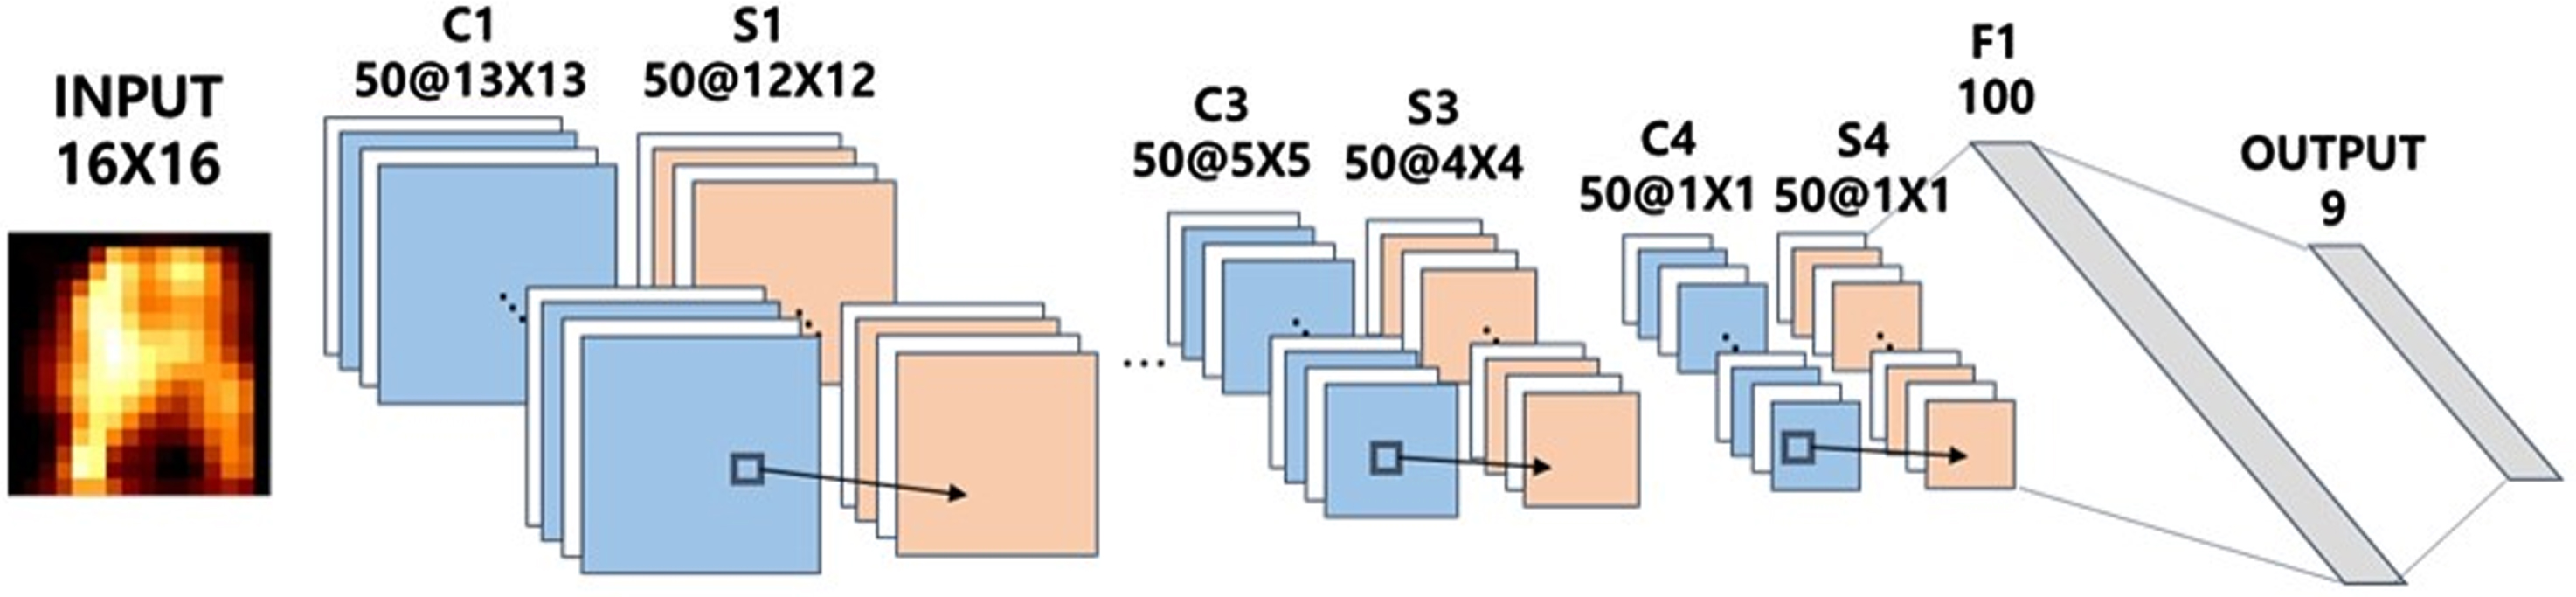
Structure of the CNN. C, S, and F denote convolution, sub-sampling, and fully connected layers, respectively.
The collected data was used to train the CNN model to classify the nine postures. The performance of the model was evaluated considering three applicable usage scenarios. The first is usage by a familiar identifiable user. In this situation, the user’s pressure distribution data for each posture is in the known dataset and the system classifies postures with the user’s own data set. The second scenario is usage by a familiar unidentifiable user. In this situation, the user’s pressure distribution data for each posture is in the known dataset and the system must classify the posture using the entire dataset because it does
not recognize the user. The final scenario is usage by an unfamiliar user. In this situation, the system must classify the posture of the user using data from other users. The methodology and results of the experiments for each usage scenario are described in order in sections 3.1, 3.2, and 3.3.
Results of experiment 1
Experiment 1 was conducted using individual data. For each participant, 70% of their own data were randomly selected as a training set and the remaining 30% were used as a test set. Table 4 shows the results of predicting postures for each participant. The average training rate and accuracy were 99.88% (97.00 –100.00) and 99.66% (95.00 –100.00), respectively.
Results of experiment 1
Results of experiment 1
Experiment 2 was conducted using the entire dataset. For each user, 70% of the entire posture dataset was randomly chosen as a training set and the remaining 30% was used as a test set. The training rate and accuracy were 100.00% and 99.40%, respectively (Table 5).
Results of experiment 2
Results of experiment 2
The leave-one-out method was used in experiment 3. This experiment was performed to predict postures for each participant using the data of the other 23 participants as the training set. Table 6 summarizes the training rates and accuracies when data from each participant were used as test data. The average training rate and accuracy were 99.79% (99.33 –100.00) and 77.35% (61.00 –93.20), respectively.
Results of experiment 3
Results of experiment 3
Overall results
The accuracies of classification in experiments 1 and 2 were very good, but the accuracy in experiment 3 was relatively low (Fig. 6). The same result was obtained in a previous study [36]. This result suggests that if a user’s posture data is included in the training data, it has a significant effect on classification performance. This is because pressure distributions differ according to the physical characteristics of users, even for the same posture [34].
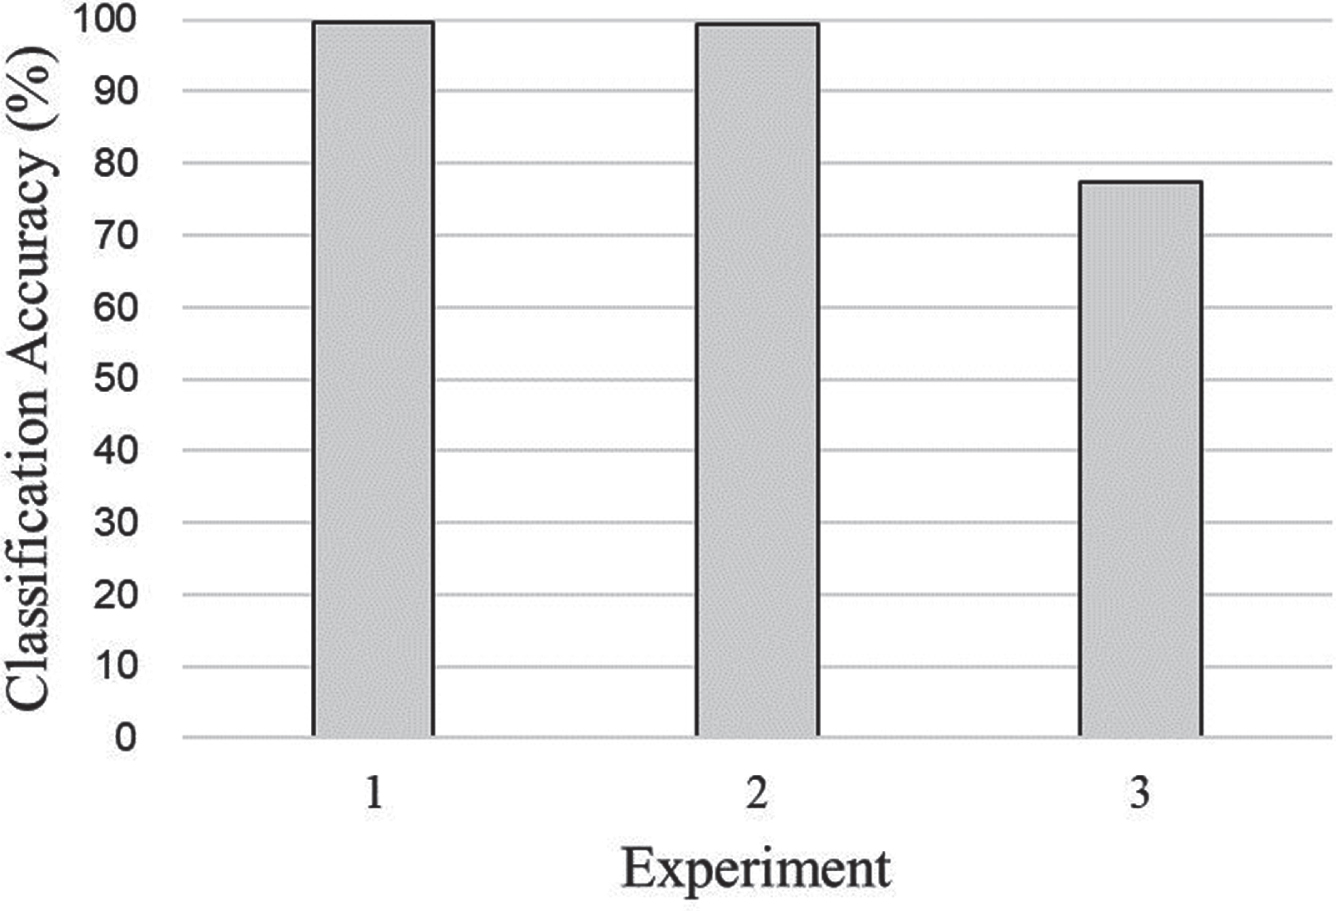
Summary of experimental results.
The average accuracy of classification in experiment 1 was 99.66%. This result is superior when compared to the results of a previous study (95% in [36]). Although Tan et al. predicted more postures, they also equipped expensive commercial pressure sensor mats on both the backrest and seat pan of a chair [36]. Therefore, it can be concluded that the hardware and classification method used in this study are very effective and efficient at predicting sitting postures.
The average accuracy of classification in experiment 2 was 99.4%. This result is superior or equivalent to the results of similar experiments in previous studies (96% in [36]; 85.9% in [17]; 94.2% in [39]; 99.6% in [40]; 80% in [41]; 82.2% in [42]; 97.2% in [43]; 92% in [44]). Considering the fact that previous studies classified fewer postures (five postures in [39]; seven postures in [17]; 8 postures in [42, 44]; 6 postures in [43]) or used a larger number of sensors (8,064 sensors in [36]; 256 sensors in [17]) or small amount of data (15 participants in [40]; 16 participants in [41]), the performance of the sensor and CNN could be interpreted as being superior to previously applied.
The average accuracy of classification in experiment 3 was 77.35%. This is slightly lower than the experimental results from leave-one-out method tests in previous studies (79% in [36]; 81% in [33]; 90.9% in [35]; 82.7% in [38]). This result can be attributed to the fact that relatively few sensors were used and that sensors were attached to only the seat pan of a chair in this study. This argument is supported by the results of a previous study [33]. Meyer et al. compared the performance of two static sitting posture classification systems [33]. One used only pressure data from the seat pan and the other used both pressure data from seat pan and backrest. The results demonstrated that if pressure data from the backrest was not used, the accuracy of classification fell dramatically from 81% to 55%. Zemp et al. used a smaller number of pressure sensors to predict posture, but attached pressure sensors to the backrest and armrest in addition to the seat pan [35]. Additionally, a motion module was attached to their chair to utilize the backrest angle as an input variable. Zemp et al. only used 64 pressure sensors attached to the seat pan, but also classified fewer postures (seven postures) [38].
The accuracies in experiments 1 and 2 were close to 100%. However, the accuracy in experiment 3 was significantly lower, so it is necessary to discuss the recognition rate (same as recall value) for each posture in this experiment. The recall value for each posture is presented in Fig. 7. While the recall values for the leaning left and right postures were high, the recall values for the upright, leaning forward, and crossed-legs postures were low. As shown in Fig. 8, the postures with high recall values had distinct pressure distributions and the postures with low recall values did not. There were many cases where the upright posture was misclassified as the leaning forward posture, leaning forward posture was misclassified as the upright posture, and crossed-legs posture was misclassified as the leaning forward posture (Table 7). As shown in Fig. 8, the pressure distributions of the upright posture and leaning forward posture are similar. The fact that that these two postures share many common features has already been demonstrated in a previous study [17]. However, the similarity in pressure distributions between the crossed-legs posture and leaning forward posture was an unexpected result because these two postures are clearly very different. This result is noteworthy because the crossed-legs posture is a very common posture in Asia. Further study is needed to distinguish between these two independent postures accurately.

Recall value for each posture.
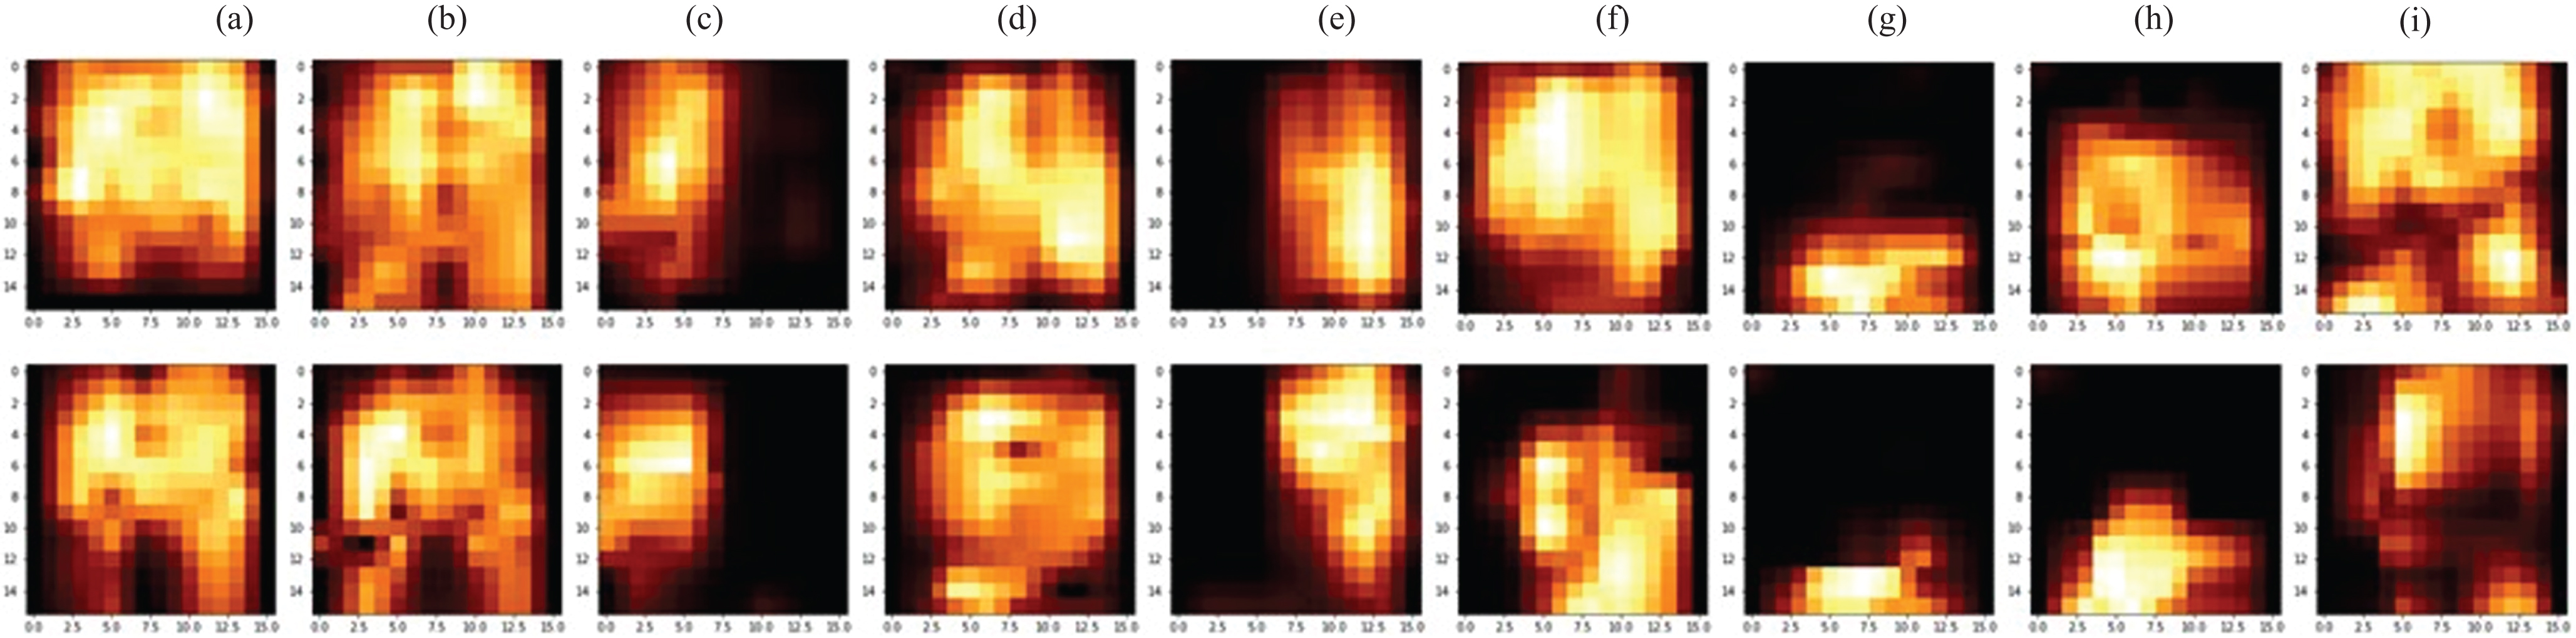
Example pressure distribution maps of nine postures from different participants (Top: Participant 23, Bottom: Participant 18). (a) Good posture, (b) leaning forward posture, (c) leaning left posture, (d) right foot over left posture, (e) leaning right posture, (f) left foot over right posture, (g) sitting at the front edge posture, (h) slouching posture, (i) crossed-legs posture.
The confusion matrix for experiment 3
Combined confusion matrix
It is important to predict exactly what type of posture users assumed, but it is also important to discriminate between whether or not users assumed good posture for posture correction. In this section, the performance of the proposed system when it is used as a good posture discriminator is evaluated. Evaluation was performed with a focus on cases when the system is applied to unfamiliar users for reasons described in Section 4.2. Table 8 is the combined confusion matrix of Table 7 for two postures: good posture and poor posture (all postures other than good posture). The recall value for good posture was 0.67 and the recall value for poor posture was 0.93. It should be noted that positive predictive value (PPV) and negative predictive value (NPV) are more important than the other performance metrics when considering application of the system in the real world. In this situation, PPV is the probability that a user’s actual posture was good when the system predicted that the posture was good and NPV is the probability that the user’s actual posture was bad when system predicted that the posture was bad. The reason why PPV and NPV are particularly important in a posture discrimination system is that the actual posture of a user is unknown in a real usage situation and only the prediction result from the system can be used as a cue for the true posture of the user. The PPV and NPV of the suggested good posture discriminator system were 0.59 and 0.95, respectively. However, the training data used in this study does not represent the actual sitting posture behavior of the entire child population because the number of collected data for each posture was controlled. Because PPV and NPV depend on the prevalence of good posture, these values may vary between users because sitting posture behavior is different for each user. In the absence of additional training data, it can be assumed that calculated recall values of good and bad posture are applied to all users equally. Under this assumption, the change patterns in PPV and NPV with the prevalence of good posture are presented in Fig. 9. As shown in the figure, the discriminant performance of the system changes according to the prevalence of good posture. Both PPV and NPV are greater than 0.7 when the prevalence of good posture is between 0.21 and 0.55. False discovery rate (FDR), with is the complement of PPV, is critical for the purposes of the system. If bad postures are misjudged as good postures, the opportunity for posture correction may disappear. If the system was applied to users with very poor postural habits, then FDR would be high. This means that the effectiveness of the system may be low initially because it views bad posture as good posture. However, it can be expected that FDR will decrease rapidly as the prevalence of good posture increases as users correct their improper sitting behavior through use of the system. In contrast, when a user with very good postural habits uses the system, the system may underestimate how often the user assumes good posture because false omission rate, which is the complement of NPV, would be high. If we improve the recall value for each posture through acquisition of additional training data and improvement of the classification algorithm, the performance of the good posture discriminator system would be better and more stable, irrespective of users.
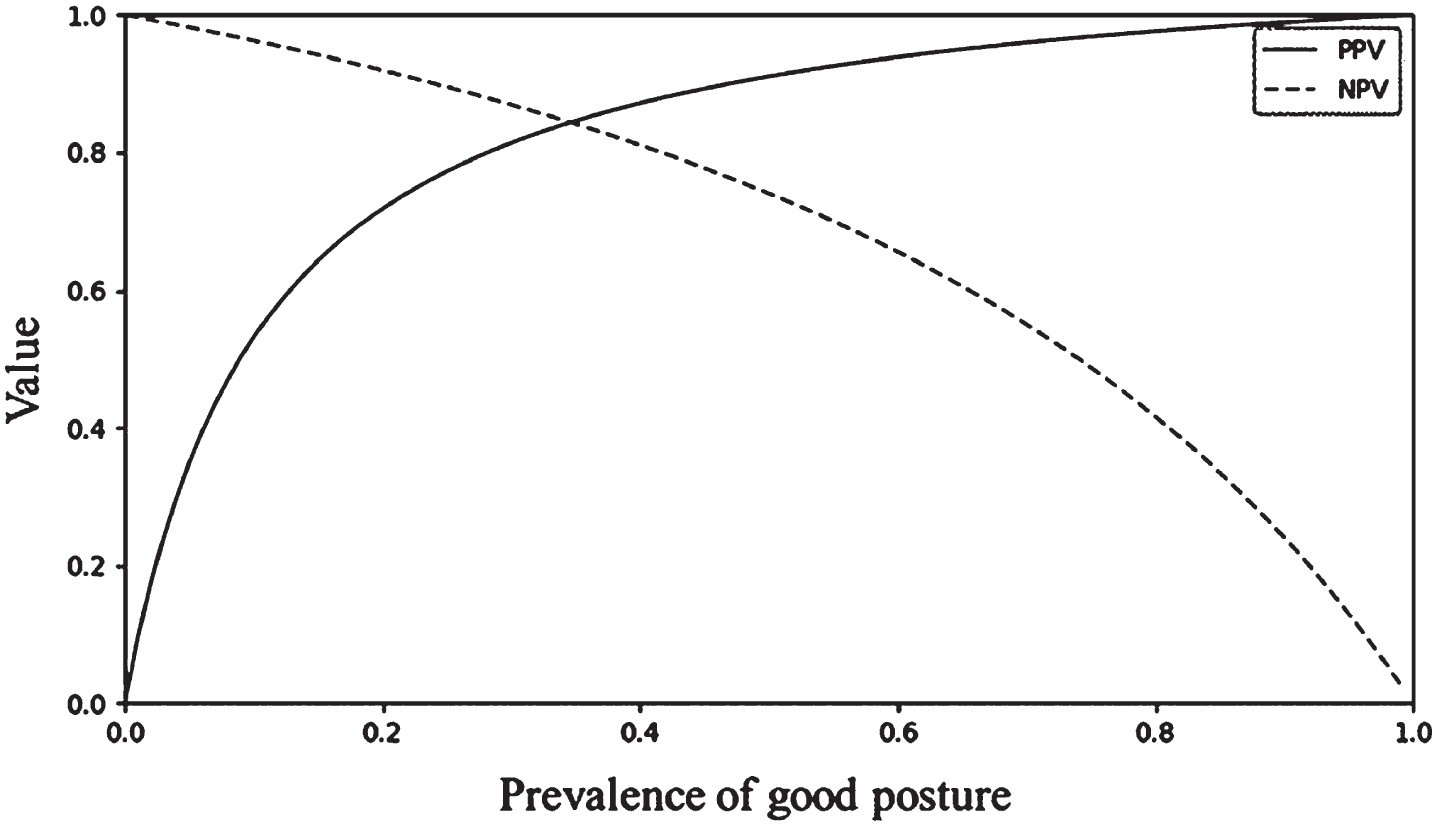
Prevalence of good posture vs. system prediction performance (PPV: Positive predictive value; NPV: Negative predictive value).
Sedentary behavior is common in daily life and the formation of proper sitting postural habits during childhood is important for preventing musculoskeletal disorders that may lead to back pain and hinder physical development. Improper postural habits during childhood are likely to remain in adulthood and cannot be easily corrected by oneself. For these reasons, we collected the pressure distribution data of nine postures from children using self-developed film-type pressure sensor, and classified sitting postures using CNN. The sitting postures selected for prediction were defined qualitatively and quantitatively to provide more information to users during practical use of the system. Furthermore, considering economic efficiency and practical application suitability, sitting posture data obtained noninvasively in real time by using a custom-made film-type pressure sensor. When measuring the data for each posture, more data from each posture was collected by providing degrees of freedom for the upper body. This precaution guarantees greater versatility in actual use. A CNN algorithm was applied to predict sitting postures and its performance was excellent in three different experiments compared to previous studies, considering the number of pressure sensors and wide range of each posture. However, there are still some postures which are not included in our study. For the results of this study to be more useful in real-world, more postures need to be predicted. In the future, we will collect the data of additional postures and improve the classification algorithm for the development of robust and accurate posture monitoring system. Furthermore, we will study effective methods, which will help children to be aware of their sitting posture and correct improper posture in real-time. In spite of some limitations, it is expected that the applied techniques and the results of this study could contribute the development of posture monitoring and correcting systems which can be used in personal sitting environments or public institutions, such as schools.
Footnotes
Acknowledgments
This work was supported by the Ministry of Education of the Republic of Korea and the National Research Foundation of Korea (NRF 2019R1A6A3A01095083). The authors would like to thank DBK Co., Ltd. and Algorigo Inc. for their cooperation in this study.
Conflict of interest
None to report.