
Abstract
BACKGROUND:
Universal design (UD) is a beneficial concept for better accessible design to improve easy approachability and industry-standard products. Specifically, Indian household products require UD features in domains such as bathroom and toilet, furniture, kitchen utilities, and home appliances. Among household product design in India, a lack of understanding of the product’s universality might be a constraint for product designers. Also, there are no studies assessing the UD features of Indian household products.
OBJECTIVE:
(1) To examine the UD feature of Indian household products against the seven principles of UD; (2) To determine the most lacking UD feature among Indian household products; and (3) To find out the Indian household categories (i.e., bathroom and toilet, furniture, kitchen utilities, and home appliances) which are most lacking in UD performance.
METHOD:
The UD features were evaluated using a standardized questionnaire, which contains 29 questions on UD principles and general questions (gender, education level, age and house characteristics). Using statistical packages, the data were computed for mean and frequency distribution, as well as analyzed to achieve the objectives. The analysis of variance (ANOVA) was performed for comparative analyses.
RESULTS:
The results indicate that the “flexibility in use” and “perceptible information” principles were lacking among the Indian household products. Also, bathroom and toilet and furniture household products were most lacking in UD performance.
CONCLUSION:
The findings of this research will enlighten the insights into the usefulness, usability, safety, and marketability of Indian household products. In addition, they will be helpful in promoting UD features and obtaining financial benefits from the Indian market.
Introduction
Universal design (UD) is defined as the feature of the product which could enable the better usability for all-kinds-of-people in greater extent possibilities, without any assistance or adaption aid [1]. The concept of UD is widely applicable from website to pen for better accessibility and utility. The demand of UD implementation currently is increasing due to rapid user’s aging, manufacturing of multi-functional products, and emerging technologies in products. For the same reasons, UD is necessary for a country like India, which is the world’s second largest populated country with heterogeneous group of people and variants of household products.
India’s economy is trending towards the third largest and fastest economy by 2035, and is more densely populated than any other country in the world. In 2017, India’s per capita GDP was US$ 1,981 and increased to US$ 2,101 in 2019 [2]. Per capita GDP is also increasing and it has been argued that this will tentatively continue. This means that the standard of living in India may be improving with better income rise. Considering these facts, the purchasing power of Indians are expected to be high in upcoming years. Thus, household items/products (e.g., white goods, home appliances, furniture) are expected to be delivered with better quality in terms of usability, durability and accessibility.
Most of the time, it has been challenging for a designer to develop a household product in consideration of heterogeneous groups (i.e., different geographic locations, diversified socio-economic status, different age groups, diversified body dimensions, and diversified capabilities) [3]. Among various design issues, a lack of understanding of the product’s universality might be a constraint for product designers. Also, UD features expand the product’s usability for specially-challenged and older people, who have been neglected in the Indian household products. Beecher and Paquet [4] conducted a survey to assess the universality among consumer products (pens, container, pilers and calculators) in the USA. They found that “low physical effect”, “perceptible information”, “flexibility in use”, “adaptability to user pace”, “intuitive use”, “reach and access for use”, “simple use”, “equitable use”, “secure, safe and private use”, “tolerance for error”, and “size for use” were the factors that corresponded to the seven principles of UD.
According to the Center for Universal Design at State University [5], the seven UD principles are: Principle 1: Equitable use; Principle 2: Flexibility in use; Principle 3: Simple and intuitive; Principle 4: Perceptible information; Principle 5: Tolerance for error; Principle 6: Low physical effort; Principle 7: Size and space for approach and use.
In general, research related to UD revolves around two different domains: (1) UD for product or service and (2) UD for learning (UDL). There are several studies that stated UDL’s principles and its various enhancement methods/techniques in various education domains (e.g., Engineering, Arts and Science). However, few investigations have been performed using UD assessment methods for products or service among heterogeneous users in developed/developing countries. Singh and Tandon [6] presented a framework for improving UD features among the products. They found that a product’s functionality, performance, usability and extra features were the key elements for better acceptability. Zolna et al. [7] reviewed 30 research articles which developed strategies to accommodate differently abled people (mobility and dexterity) in public/workplace. Additionally, UD principles have been incorporated in design (building architecture [8] and normal products (e.g., staplers, hand tools, mobile phone, websites, mobile apps)) via various tools and techniques by several researchers.
Afacan and Demirkan [9] performed the kitchen UD using analytic-hierarchy and planning gaming techniques. This cost-value approach increased the universality and satisfying diversified users for kitchen design. Afacan and Erbug, Belchior and Nunn et al. [10, 11] studied the UD features of workplace/home buildings which includes kitchens, bedrooms and toilets and general housing features. Using a standardized/original UD questionnaire, the investigation was conducted by the authors. Based on these study findings, the authors framed recommendations in-consideration with elderly populations for house-buildings at USA. Rahman and Widyanti and Miralles et al. [12, 13] applied principles of UD for small/medium-enterprises to improve accessibility, ease of service and lower the energy expenditure. Kim and Jeong [14] established that UD enable the universal safety, health, to assist productive worker with sustainability workspace.
Plos and Buisine [15] applied UD principle to develop a mobile-phone for differently abled and aged people (i.e., visually-impaired, hearing-impaired, and older adults). The design process of new mobile-phone was pursued using human-centered design approach. The outcomes of this study were tested by the user for adaptation, usability and design style.
Singh and Tandon [16] framed the evaluation model to examine product universality. Using user categorization with age and needs, the proposed model was developed. Primarily, original UD principles were applied to a product (Stapler) for evaluating the universality of the product. Lately, proposed model (i.e., add-on of original UD principles) were applied to do the same evaluation of the stapler. The findings of this study imply that the proposed model is significantly good to improve the overall universality of the products.
Similarly, Lin and Wu [17] applied the UD principle to develop a hand-tool for all kinds of users. In this study, Initial assessment of the hand-tool was conducted using UD principles and user experience questionnaires. The new design was evaluated by crucial design factors which has been obtained through factor analysis and Quantification theory. This study significantly contributes to user-centered UD applications.
Although a few researchers [15, 19] evaluated the UD feature of products, their studies were limited to a single product. Furthermore, they did not consider the Indian household products and users. Based on the literature review, the following research question has been framed as RQ1: What are the Indian household categories that are lacking in UD performance? RQ2: What are the UD characteristics that are lacking among Indian householdproducts?
Henceforth, the present study aims to evaluate and investigate UD features among Indian household products (i.e., bathroom and toilet products, furniture, kitchen utilities, and home appliances) for better usability, safety, and marketability. To achieve this aim, the two objectives of the study are: (1) To determine the critical UD characteristics which are most lacking among the Indian household categories, and (2) To determine the critical household categories most lacking in the UD performance.
Materials and methods
Participants
According to the recent Indian census, households with bedrooms, bathrooms, and kitchens in urban regions of India were estimated at 3,700,000. The sample size was estimated as ∼600 based on the standardized Equation (1), which establishes general requirements for actual sample size calculations while performing consumer/users’ studies.
Where N = Sample size; Z = Confidence level at 95% (standard value of 1.96); pq = Variance of population (0.501); e = allowable error (5%)
In order to cover the sample/user size (∼600), we deployed group members who can conduct the UD evaluation for Indian household products. The 150 group members are randomly selected from the design college/university database. The research covered the members and users from 20 major states of India members. All of these members were invited through email to participate in the UD evaluation. Out of 150, only 94 members expressed their interest in this research. The group of members covered 608 users of Indian household items/products. These users are family members, friends, or associates of the 94 members.
Since card sorting techniques facilitate clustering, categorizing, and prioritizing the information [20], this technique was used in selecting the most commonly used products in Indian households. Specifically, the closed-card sorting technique was performed owing to the procedural suitability of the present study. Initially, 100 household product’s pictures and names were printed with the white background on rectangular cards (91 mm X 61 mm) and then later stacked for analysis.
Among the 94 invited members, only 22 members expressed interest in the card sorting activity. Although the number of participants is lesser in this activity, the participant size was within the recommended limit of the earlier researchers [21] for better reliability response. These members were pooled participants who can represent the overall users of the country/major states of India. Each member’s card sorting activity was scheduled at the library of university.
Members were given a set of 100 cards labeled with the product picture/name. Consequently, they were instructed to arrange the cards into four columns of household categories (bathroom, furniture, kitchen utilities, and home appliances) according to their opinion of the “most commonly used products in the house”. Also, they were asked to use the “others category” to scrap the cards which do not fit their context/opinion [22]. In each session, the card sorting activity of members was monitored by two researchers for documentation purposes. During documentation, researchers have noted the mode cards to determine the most common products used in Indian households. Each member took 3 hours to perform the activity. In total, eight consequence days to complete the full card sorting activity.
After a week, the same procedure was repeated with the same members for checking the reliability of the member’s card sorting responses. The reliability (intra-observer technical error) of the card sorting activity among the members was found to be 0.90, which is within the recommended range of earlier research papers. The inter-observer technical error (reliability) between the two researchers was found to be (97%) good. Based on the card sorting activity, the following 25 house products/items were found to be most commonly used household products in India (Tables 1 and 2).
Most common household items/products in India
Most common household items/products in India
Details of household items, users and investigation members of this study
The member was trained to conduct the UD evaluation using the UD questionnaire [5]. This UD questionnaire covers seven principles, which are assessed by 4 to 5 numbers of opinion-based questions (i.e., grand total of 29 questions). These questions were assessed against a 6-point Likert scale (0 - Not applicable; 1 - Strongly agree; 2 - Agree; 3 - Neutral; 4 - Disagree; 5 - Strongly Disagree) (Table 3). The seven principles and 29 questions (Q) are stated below.
Inference for weighted mean Likert scoring of users
Inference for weighted mean Likert scoring of users
All users (i.e., 608 study subjects) were asked by 94 members to fill in the UD questionnaire for each product after using it for a week. Also, they were asked to provide basic information (e.g., gender, education level, age and house characteristics) in line with previous research [23].
Initially, the 94 members were divided into four categories (i.e., bathroom and toilet, furniture, kitchen utilities, and home appliances) which covered 25 products used by Indian users (see Table 2). For instance, in the Bathroom category, 18 members were grouped as B1, B2, B3, B4, and B5, with members of 3, 4, 4, 4, and 3, respectively. These five groups consider the following bathroom products for the UD evaluation from users: Bathroom stool, door handles, shower, bucket, and wiper.
Similarly, 22 members were grouped as F1, F2, F3, F4, and F5 in the furniture category with members of 4, 3, 5, 5, and 5, respectively. These five groups consider the following furniture products for the UD evaluation from users: bookcase, chair, stool, dressing table, and rocking chair. In the kitchen utility category, 26 members were grouped as K1, K2, K3, K4, K5, and K6, with members of 5, 4, 5, 4, 4, and 4, respectively. These six groups considered the following kitchen-utilities products for the UD evaluation from users: pressure cooker, lemon squeezer, grater, hand mixer, sew and whisk.
Since home appliance and white goods products are predominantly used in India, we had involved 38 members/9 groups interested in the home appliances category. The 38 members were grouped as H1, H2, H3, H4, H5, H6, H7, H8, and H9, with members of 6, 5, 3, 3, 5, 4, 4, 4, and 4, respectively. These nine groups consider the following home appliances products for UD evaluation from users: Iron box, refrigerators, microwave, air conditioner, geyser, induction, coffee machine, toaster, and heating rod.
After collecting the UD assessment/response from 608 users, the 94 members were asked by the authors to repeat the assessment process with the same set of users to check the reliability of their responses. Later, the authors consolidated the response in the SPSS statistical package for data analysis (frequency distribution, analysis of variance (ANOVA)).
Data analysis
General information of users (e.g., gender, education level, age, and family status) was tabulated (see Table 4) with the house characteristics of users (e.g., ownership and family size). The Spearman correlation coefficient has been calculated to check the Test-retest reliability of response (i.e., level of agreement between the first and second set of responses from users) in the statistical package.
General information of users and their house’s characteristics
General information of users and their house’s characteristics
Since they were vital features concerning of any household products, the Likert scoring is relevant to the perceived UD features of users’ household products in this research. For further comparative analysis among the household categories and seven principles, the average Likert scoring has been obtained through individuals’ user Likert scoring against principles’ questions (i.e., 29 questions) for all the 25 products. The frequency distribution of users’ Likert scoring against the seven UD principles for four categories of Indian household products (Appendix Tables A-D) was also tabulated.
Later, the overall mean of individuals’ household categories (i.e., bathroom and toilet, furniture, kitchen utilities, and home appliances) was calculated via Likert scoring to derive the weighted mean Likert scores rated by users. The weighted mean Likert scoring has been estimated using equations [2–4], which have been adopted from previous research articles [24, 25]. The standard deviation (SD) has been obtained by averaging the difference between the maximum and minimum of PV’s Likert scoring. The weighted mean and standard deviation (SD) have been calculated and presented in Table 5. In ordinance with Leung [26], the Likert scale’s interval/difference and its description have been used (see Table 3) for a better understanding of the Likert scale’s weighted means.
Where Various products (i.e., B1, B2 ... ...H9): V = 1,2, 3....9; P = Product; C = Household categories (B: Bathroom and Toilet; F: Furniture; K: Kitchen utilities; H: Home appliances)
Where Sub-questions’ numbers: i = 1, 2. 3....29; Likert scale: j = 0, 1, 2 ... ., 5; Likert scale scoring: L = 0, 1, 2, 3, 4, 5.
Where, O ij is number of users opted for j Likert scale-rating in ith questions. N c is total number of users rated in a category. W ij = ration between opted and total users in ith question as jth rating/scoring. Basically, this will help us to understand the percentage of users who opted for the jth score in ith questions.
Weighted Mean and SD of Likert scoring for 4 household categories
Note: According to Leung. [26], these mean values might be interpreted as: 0 to 0.99 = “Not applicable”; 1.00 to 1.79 = “Strongly agree”; 1.80 to 2.59 = “Agree”; 2.60 to 3.39 = “Neutral”; 3.40 to 4.19 = “Disagree”; 4.20 to 5.00 = “Strongly disagree”. N/A: None.
The comparative analysis was performed using a statistical package (IBM SPSS version 25.0 software). The weighted mean Likert scoring of users was analyzed using one-way analysis of variance (AVOVA), with household categories (bathroom and toilet, furniture, kitchen utilities, and home appliances) and seven UD principles. The parametric ANOVA was adopted when the assumption of the normality, Robust test (Welch test for equality of means), and Homogeneity of variance test were passed. Further for multiple comparisons, the Bonferroni post-hoc test has performed when the F-test results were significant at 0.05 (P < 0.05).
Descriptive analysis
User’s variables in the study
General information about users is presented in Table 4, with data presented as the sample size and percentage. The users’ ages ranged from 15 to 75 yrs.; SD 35 yrs.) and marginally equivalent gender sample-size found in the study. Most users stay in rented houses, and their educational level ranges from schooling (31.9%) to tertiary education (1.1%). Most users (48.4%) earn monthly income ranging fromRs 5.00 lakh to Rs 9.99 lakh and live in a nuclear family (57%). Almost >10% of users have physical disability and are older than 60 yrs. in the study sample.
User’s UD assessment responses
Before conducting descriptive analysis for the user’s UD assessment responses, the Test-retest reliability (Intra-observer technical error) of the user’s response was found to be 0.82 (average), which is within the recommended range of pervious research articles. Since the level of agreement between two sets of response was found to be (82%) good. The results were validated and reliable enough for further process of statistical analyses.
The percentage of users against each UD principle’s Likert scores (i.e., UD feature scoring for each principle’s questions) are shown in the Appendix Table A and Fig. 1 for bathroom and toilet. The Likert scoring of the users were mostly between “Neutral” and “Strongly agree”. Generally, users opted for “Not applicable” scoring for 3E (“This product provides feedback to the user”), and 5D (“This product prompts the user to pay attention during critical tasks”). The “Disagree” scoring has been opted by some users for 1B (“Potential user could use this product without feeling segregated or stigmatized because of differences in personal capabilities”), 4B (“This product can be used without sight”), 5 C (“If the user makes a mistake with this product, it won’t cause damage to the user”), 6 C (“This product can be used without repeating any motion enough to cause pain”), and 7B (“It is easy for a person of any size to reach all the important elements of this product from any position”). Overall, Principle 2 (“Flexibility in use”) was found to highly satisfying by users, as compare do other principles, whereas Principles 1, 4, 5, 6, and 7 were found to be partially satisfying by users.

Percentage of frequency distribution of four household categories. Note for Figure 1: n = sample size, n.p = number of products considered for the UD analysis. Principle 1: Equitable use 1A to 1D; Principle 2: Flexibility in use 2A to 2D; Principle 3: Simple and intuitive 3A to 3E; Principle 4: Perceptible information 4A to 4D; Principle 5: Tolerance for error 5A to 5D; Principle 6: Low physical effort 6A to 6D; Principle 7: Size and space for approach and use 7A to 7D. All 29 sub-questions (1A to 7D) are mentioned in the Appendix.
The percentage of users against each UD principle’s Likert scores (i.e., UD feature scoring for each principle’s questions) are show in the Appendix Table B and Fig. 1 for furniture. The Likert scoring of the users were mostly between “Neutral” and “Strongly agree”. Few users opted for “Not applicable” scoring in Principles 2 (“Flexibility in use”) and 5 (“Tolerance for error”). The “Disagree” scoring has been opted by many users in 1A (“All potential users could use this product essentially the same way, regardless of differences in their abilities”), 4B (“This product can be used without sight”), 5 C (“If the user makes a mistake with this product, it won’t cause damage to the user”), and 7B (“It is easy for a person of any size to reach all the important elements of this product from any position”). As compared to other principles, Principles 2 (“Flexibility in use”), 3 (‘Simple and intuitive”), and 6 (“Low physical effort”) were found to satisfying for users. In contrast, Principles 1, 4, 5, and 7 were found to be marginally satisfying for users.
In the kitchen category, the percentage of users rated against each UD principle’s questions are show in the Appendix Table C and Fig. 1. Most users did not opt for “Not applicable” and “Strongly disagree” scoring in these categories. However, “Neutral” and “Strongly agree” scorings were rated by most of the users. Similar to the other two categories (i.e., bathroom and toilet and furniture), the “Disagree” scoring has been opted by some users in 1A, 4B, and 5 C questions of UD principles. Overall, Principles 2 (“Flexibility in use”) and 7 (“Size and space for approach and use”) were found to highly satisfactory for users, as compared to other principles, whereas Principles 1, 3, 4, 5, and 6 were found to be partially satisfying for users.
Considering the UD principles for home appliances, the users’ responses are presented in the Appendix Table D and Fig. 1. All most negotiable percentage of users opted “Not applicable” in most of the UD principle’s questions. However, they opted “Neutral”, “Agree”, and “Strongly agree” for most of the questions. Exceptionally, Principles 2 (2 C in “Flexibility in use”), 3 (3A and 3B in “Simple and intuitive”), 4 (4B in “Perceptible information”), and 5 (5B and 5 C in “Tolerance for effort”) gained a higher percentage of respondents for “Disagree”. Overall, Principles 1, 6, and 7 were marginally satisfying for users.
The weighted-mean Likert scoring of users with each UD features questions (i.e., 29 questions w.r.t seven principles) of four categories are shown in Table 5. Considering Leung [26], the Likert scale interpretation of all weighted mean Likert scoring was beyond the “Neutral” score in this study, expect for Principle 5 (“Tolerance for error”).
A one-way ANOVA was performed to compare the effect of household categories (bathroom and toilet, furniture, kitchen utilities, and home appliances) on weighted mean Likert scoring against UD principle’s questions. An one-way ANOVA revealed that there was not a statistically significant difference in weighted-Mean Likert scoring among household categories (F(3, 112) = 0.269, p = 0.848). Since F-test results were not statistically significant, a post-hoc test was not conducted for multiple comparisons.
A one-way ANOVA was performed to compare the effect of seven UD principles on weighted mean Likert scoring for four household categories. A one-way ANOVA revealed that there was a statistically significant difference among UD principles (F(6, 109) = 7.313, p = 0.001). Since F-test results were statistically significant, Bonferroni post-hoc test was conducted for multiple comparisons. This test found that the mean value of UD principles was significantly different between Principle 5 (“Tolerance for error”) and the other six UD principles (p = 0.002, 95% C.I. = 2.7– 3.1). There was no statistically significant (p = 0.6) difference among 6 principles (i.e., Principle 1: Equitable use; Principle 2: Flexibility in use; Principle 3: Simple and intuitive; Principle 4: Perceptible information; Principle 6: Low physical effort; Principle 7: Size and space for approach and use).
Discussion
Figure 2 represents the scatter/line plot of overall weighted mean Likert scoring of users against four household categories. Based on Leung’s [26] mean interpretation strategy, graphical regions (Fig. 2) were divided into three categories (agreement regions, neutral, disagreement regions). None of the household category’s mean were fall under neutral or agreement regions. Nevertheless, home appliances and kitchens barely touched the board of neutral regions.
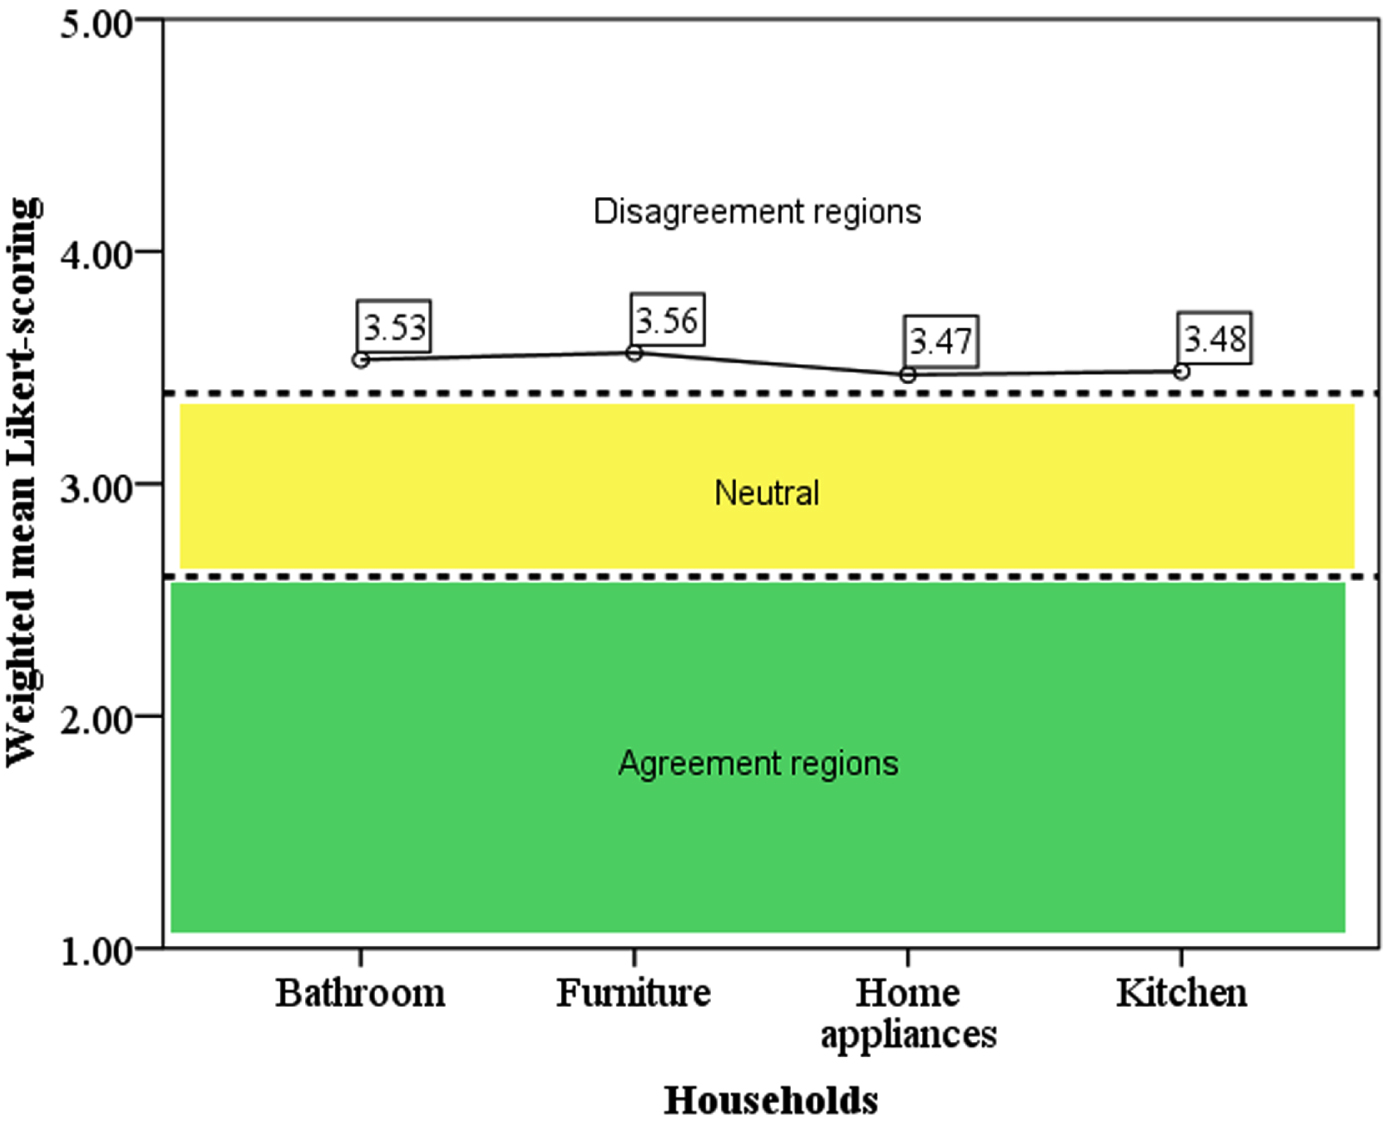
Overall weighted mean Likert scoring of users for four household categories.
Although overall weighted mean Likert scoring among four household categories was not significantly different from each other, there is a marginal difference between them. For instance, the overall mean score of furniture is (3.56) 0.8% higher than the bathroom and toilet products (i.e., 3.53). Similarly, overall mean score of home appliances is (3.47) 0.3% lower than the kitchen products (i.e., 3.48). However, among the four household categories, furniture and bathroom and toilet products’ UD features were found to be very weak, as compared to the other two categories. Specifically, Principles 1 (i.e., “Equitable use”), 4 (“Perceptible information”), 5 (i.e., “Tolerance for error”), and 7 (i.e., “Size and space for approach and use”) were found to be unsatisfactory for users.
Figure 3 represents the scatter/line plot of overall weighted mean Likert scoring of seven UD principles irrespective of household categories. In ordinance of Leung [26], mean interpretation strategy, graphical regions (in Fig. 3) were divided into three categories as, agreement regions, neutral, disagreement regions. Among the principles’ overall-weighted-mean, Principle 6 (“Low physical effort”) was relatively higher than the other principles irrespective of household categories. However, Principles 2 (“Flexibility in use”), 4 (“Perceptible information”), and 7 (“Size and Space for approach and use”) were marginally similar. The overall-weighted-mean of UD Principle 5 (“Tolerance for error”) falls under the region of neutral, whereas Principles 1 (“Equitable Use”) and 3 (“Simple and intuitive”) barely touched the boards of neutral regions. This implies that users are majorly experiencing a lack of universality features among Indian household products.
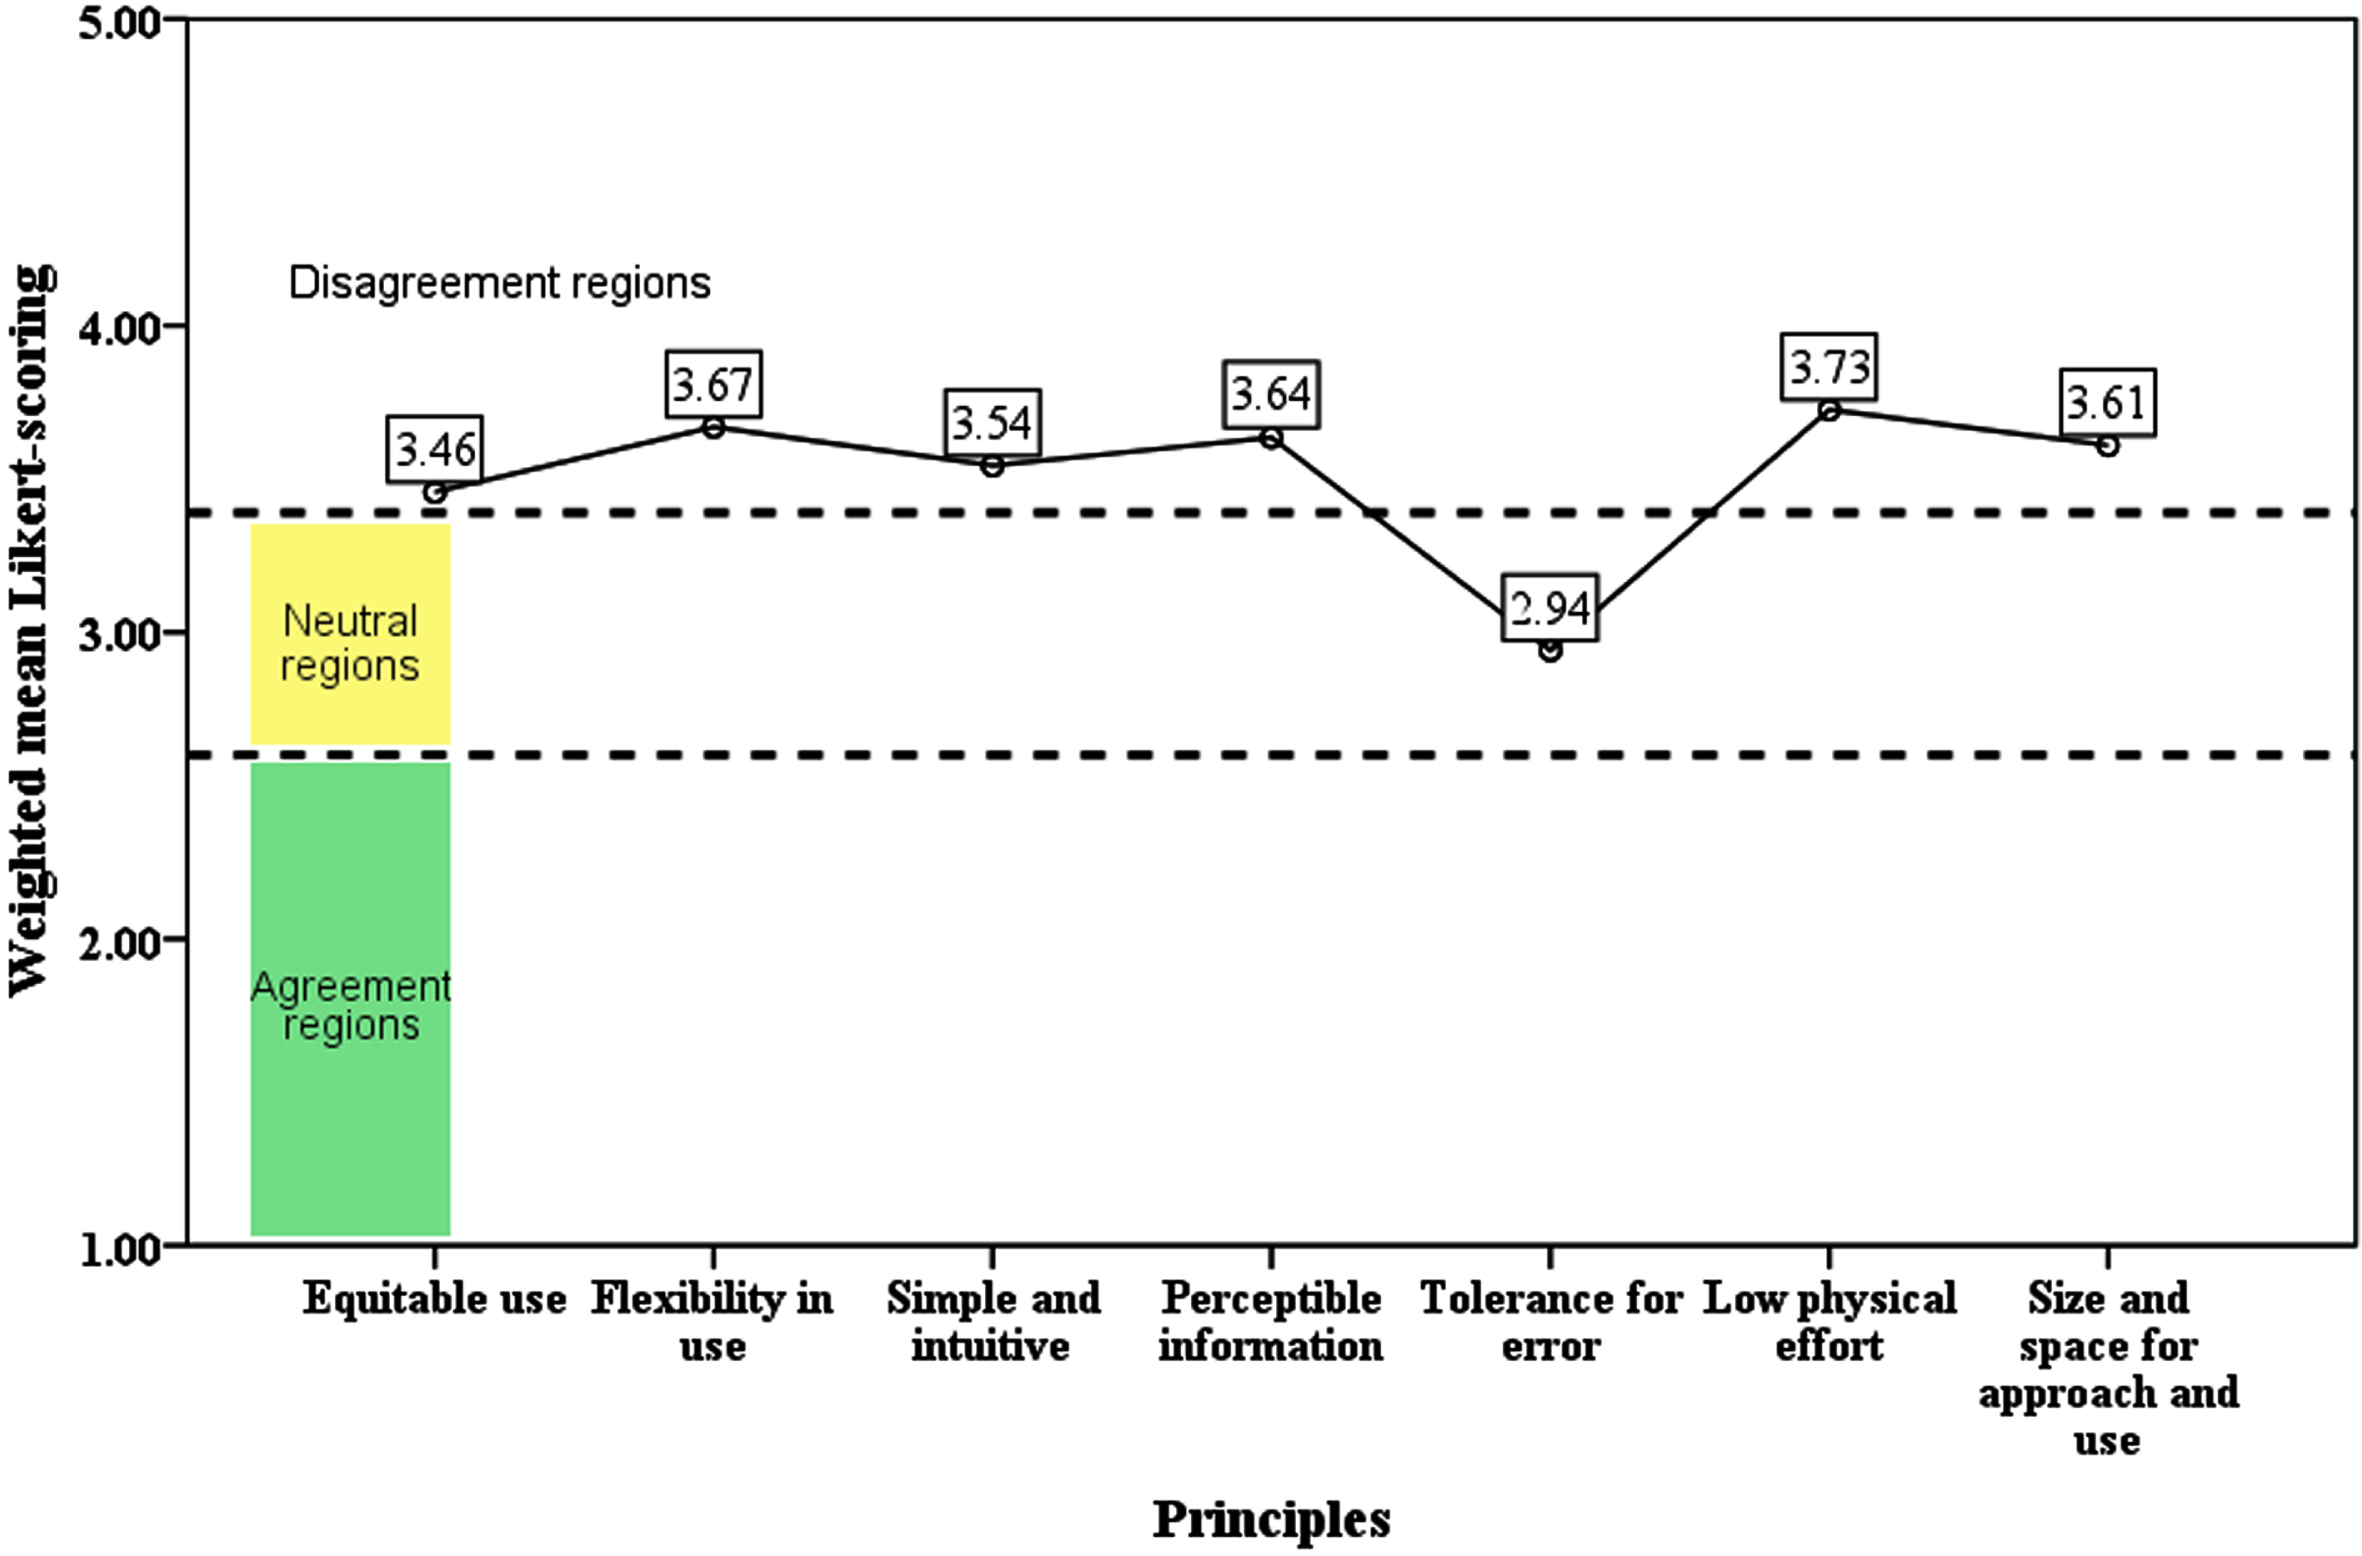
Overall weighted mean Likert scoring for seven UD principles.
In line with our results, other researchers [26, 27] also observed that the products were partially satisfying the general need of users unless they are differently-abled users. Prajapati et al. [3] also explored the same level of UD features lack among Indian products. These studies help the product manufacturer to understand the products and redesign them in order to satisfy all kind of users in the Indian market. Based on the previous literature [28–34], some of the proposed designs/recommendations for maximizing the usability, improving marketability of the Indian household products and satisfying user’s principles are: Consideration of UD principles during ideation process of any household items Towne, Inclusion of seven UD principles in concept selection criteria during design process of any household items Consideration of extreme (i.e., maximum and minimum) anthropometric and strength/force data of human during embodiment stage of product development process Reduction of graphical elements (e.g., colors and shape) in the user interface (UI) for better visual communication between the user and product While designing a product, consideration of reducing cognitive load for easy-of-operation
While deploying the present study’s findings for generalization the following limitations should be considered: (1) Product variation (i.e., technical specifications and aesthetics) has not been considered. However, a large set of products has been covered in this study to avoid biases towards UD scoring for product variations. (2) Although the sample sizes was sufficiently achieved in this study, the minimal sample size was considered to be a limitation. Also, the authors plan to extend the research findings by examining the effect of product variation in UD performance of the household products. (3) The UD questionnaire refers only to females and men which clearly indicates that it does not included other gender groups for assessment. Nowadays we need to recognize other gender groups for improvising the universality of product. Thus, future studies would cover other gender groups in the UD assessment of household products.
Conclusion
The Indian household products were significantly lacking in universality. Specifically, furniture and bathroom and toilet products’ UD features were found to be very weak. However, home appliances and kitchens were relatively fair in term of UD features. Among seven UD principles, the “Tolerance for error” principle was found to be fulfilling among the Indian household products. Furthermore, the other six UD principles (“Equitable use”, “Flexibility in use”, “Simple and intuitive”, “Perceptible information”, “Low physical effort”, “Size and space for approach and use”) were shortcomings among Indian household products. These findings help to establish the fact that UD principles should be considered in the Indian household products for better usability, durability and marketability. These findings will also help develop some guidelines during design interventions of household products for Indian users.
Ethical approval
Ethical approval was obtained from the Ethics Committee at Karnavati School of Dentistry (Approval number: KSDEC/25062021).
Informed consent
Informed consent was obtained from all individual participants included in the study.
Conflict of interest
None to report.
Footnotes
Acknowledgments
The authors express their faithful appreciation to all users and members who were involved during the data collection process of this study. Also, they are extremely grateful to all faculties/students who supported this research for successful completion.
Funding
This research received no specific grant from any funding agency in the public, commercial, or not-for-profit sectors.