



Abstract
BACKGROUND:
The number of deaths, causes, and frequency measures are crucial in determining the health of a country’s population.
OBJECTIVE:
The current study aimed to estimate deaths, causes of death, and their frequency for Saudi nationals in 2017.
METHODS:
In this descriptive study, we used data from the 2017 Population Characteristics Survey (n = 14,215,901) and performed secondary data analysis between November 2021 and February 2022. We used a total number of survey samples to compute the deaths. The cause of death was determined by dividing the total number of fatalities according to sex. We calculated the overall population-, administrative region-, and gender-wise percentages, rates per 1,000 people per year, the ratios for mortality, and their reasons.
RESULTS:
There were 58,915 (0.4%) total deaths, including 0.3% and 0.2% deaths among females and males, respectively. The illness was the most frequent cause of mortality (46.5% or 465 per 1,000 population/year), notably in women (52.5% or 525 per 1,000 population/year). The fatality rate was higher due to traffic accidents (a total of five in every female and four males in every female).
CONCLUSION:
In 2017, illness—especially in women—was the cause of death. Road car accidents had a high mortality rate, especially among males. Saudi Arabia has lower death rates than other Arab nations and high-, moderate-, and low-income nations.
Introduction
Deaths, reasons for death, and frequency measures have been characterized to compare one part to another, the entire distribution among a particular population in general, or due to a specific reason [1]. The reasons for death vary significantly between countries [2]. According to the World Health Organization (WHO), the leading causes of death worldwide in 2016 for males, females, and people of all ages were illness and road injuries [3].
The most common frequency measures are proportions, rates, and ratios [4]. For example,epidemiologists can use frequency mortality measures to signify economic success and failure [5]. Historically, short-term price increases have adversely influenced mortality rates [6]. Higher mortality rates have been slightly tied to socioeconomic levels within a given society [6]. They have, however, varied more between low and high-income countries [7]. It found that national income is the most considerable aspect of the mortality metric connected to the standard of living within a nation [8].
Ideally, epidemiologists calculate all mortality using census data, vital statistics, household surveys, or sampling and predict mortality rates [9]. The census data provides precise facts about the population at risk of death, and vital statistics furnish info about live births and deaths [10]. Household surveys or interviews are another way to gauge mortality in distinct population segments [11]. Additionally, epidemiologists often use a sampling approach by choosing a population subset, efficiently providing data concerning the whole population [12].
The causes of mortality in Saudi Arabia between 1990 and 2017 have received very little attention, notwithstanding significant research [13–15]. However, no study has been conducted in Saudi Arabia to evaluate deaths, causes, or frequency, critical indicators of a population’s health. Thus, the current study aimed to increase knowledge by estimating 2017 deaths, reasons for death, and their frequency measures, particularly among Saudi citizens. Awareness of these statistics is crucial to building the country’s economy, improving people’s health, and tracking traffic accidents.
Methods
In this descriptive study, we analyzed secondary data using data from the 2017 Population Characteristics Survey (n = 14,215,901) between November 2021 and February 2022. The data are publicly available at the Saudi General Authority for Statistics (GaStat) [16]. This survey was carried out in 2017 using the population projections methodology [17]. Population projections assess the population’s total size in the future by age and gender, depending on the people and housing census, with hypotheses on fertility, mortality, and migration rates. This method is considered a crucial pillar for economic, social, and demographic planning to increase a community’s living standards and obtain prosperity.
A reexamination of data and indicators was carried out in this survey in two phases to obtain the population projection results. In the first phase, the population projections were checked and assessed using data provided by other sources. In the second phase, population projection results were reviewed and evaluated according to newly adopted population policies. In this survey, more than 358 trained (by GaStat) field researchers collected data from more than 33,000 households using a form. This form consists of many main sections to be filled in by ‘tablet.’ The time required to complete this form was approximately 60—65 min. The form consists of questions regarding fundamental characteristics, including mortality.
Statistical analysis
We presented descriptive statistics as counts and percentages for the causes of deaths and demographic factors such as age, marital status, educational attainment, and administrative region. From the entire survey sample—including sex—we calculated the total and administrative region-level fatalities. The cause of death was determined by dividing the overall deaths by sex. The proportion or rate of death was derived by dividing the total number of male and female deaths by the entire survey sample. Then multiply that result by 100 to get the proportion and 1,000 people per year to get rates. We compared this rate (Saudi Arabia) to benchmark rates for other Arab countries [18] and high-, moderate-, and low-income nations [19]. We obtained the data on rates from these classified countries from the literature research [3, 20].
Total deaths by administration area and sex were determined by dividing the national death toll by the sum of deaths in each region and multiplying the result by 100. The cause-of-death ratio to the total number of deaths among males and females was multiplied by 100 for proportion. In contrast, it was multiplied by 1,000 to get a rate per 1,000 people-year for each group. The overall fatalities were divided by the total fatalities among men, women, and men-to-women to arrive at the death ratio. Chi-square test results were used to calculate the significance between the sexes. All the analyses were performed using the PSPP version 1.4.1 for Windows (Free Software Foundation, Inc., Massachusetts, USA). The threshold for statistical significance wasp < .05.
Results
About 50.1% of survey participants were men. Most of them were young, ranging in age from 15 to 39. Around 33.4 percent of people had finished secondary school or its equivalent. The majority of them were married (58.1%) and resided in Makkah (23.1%) or Riyadh (21.7%) (Table 1).
Demographic features, stratified by gender
Demographic features, stratified by gender
There were 58,915 deaths overall (0.4%). Compared to females, males had a more significant percentage (0.3% vs. 0.2%) or rate (3 vs. 2 per 1,000 population/year). In Makkah, deaths were high (21.8%, or 218 per 1,000 people per year), especially among men (13.3%, or 133 per 1,000 people per year). The northern border region had the lowest death rate (1.7% or 17 per 1,000 people-year), which included sex (1% or 10 per 1,000 people-year for men and 0.8% or 8 per 1,000 people-year for women) (Table 2 and Fig. 1).
The number of deaths and proportion, stratified by gender and administrative regions
*Total deaths divided by total survey sample (n = 14,215,901); Chi-square test, p = 0.971. **Administration area-wise total deaths, including males and females divided by total deaths (n = 58,915); Chi-square test, p = 0.233.
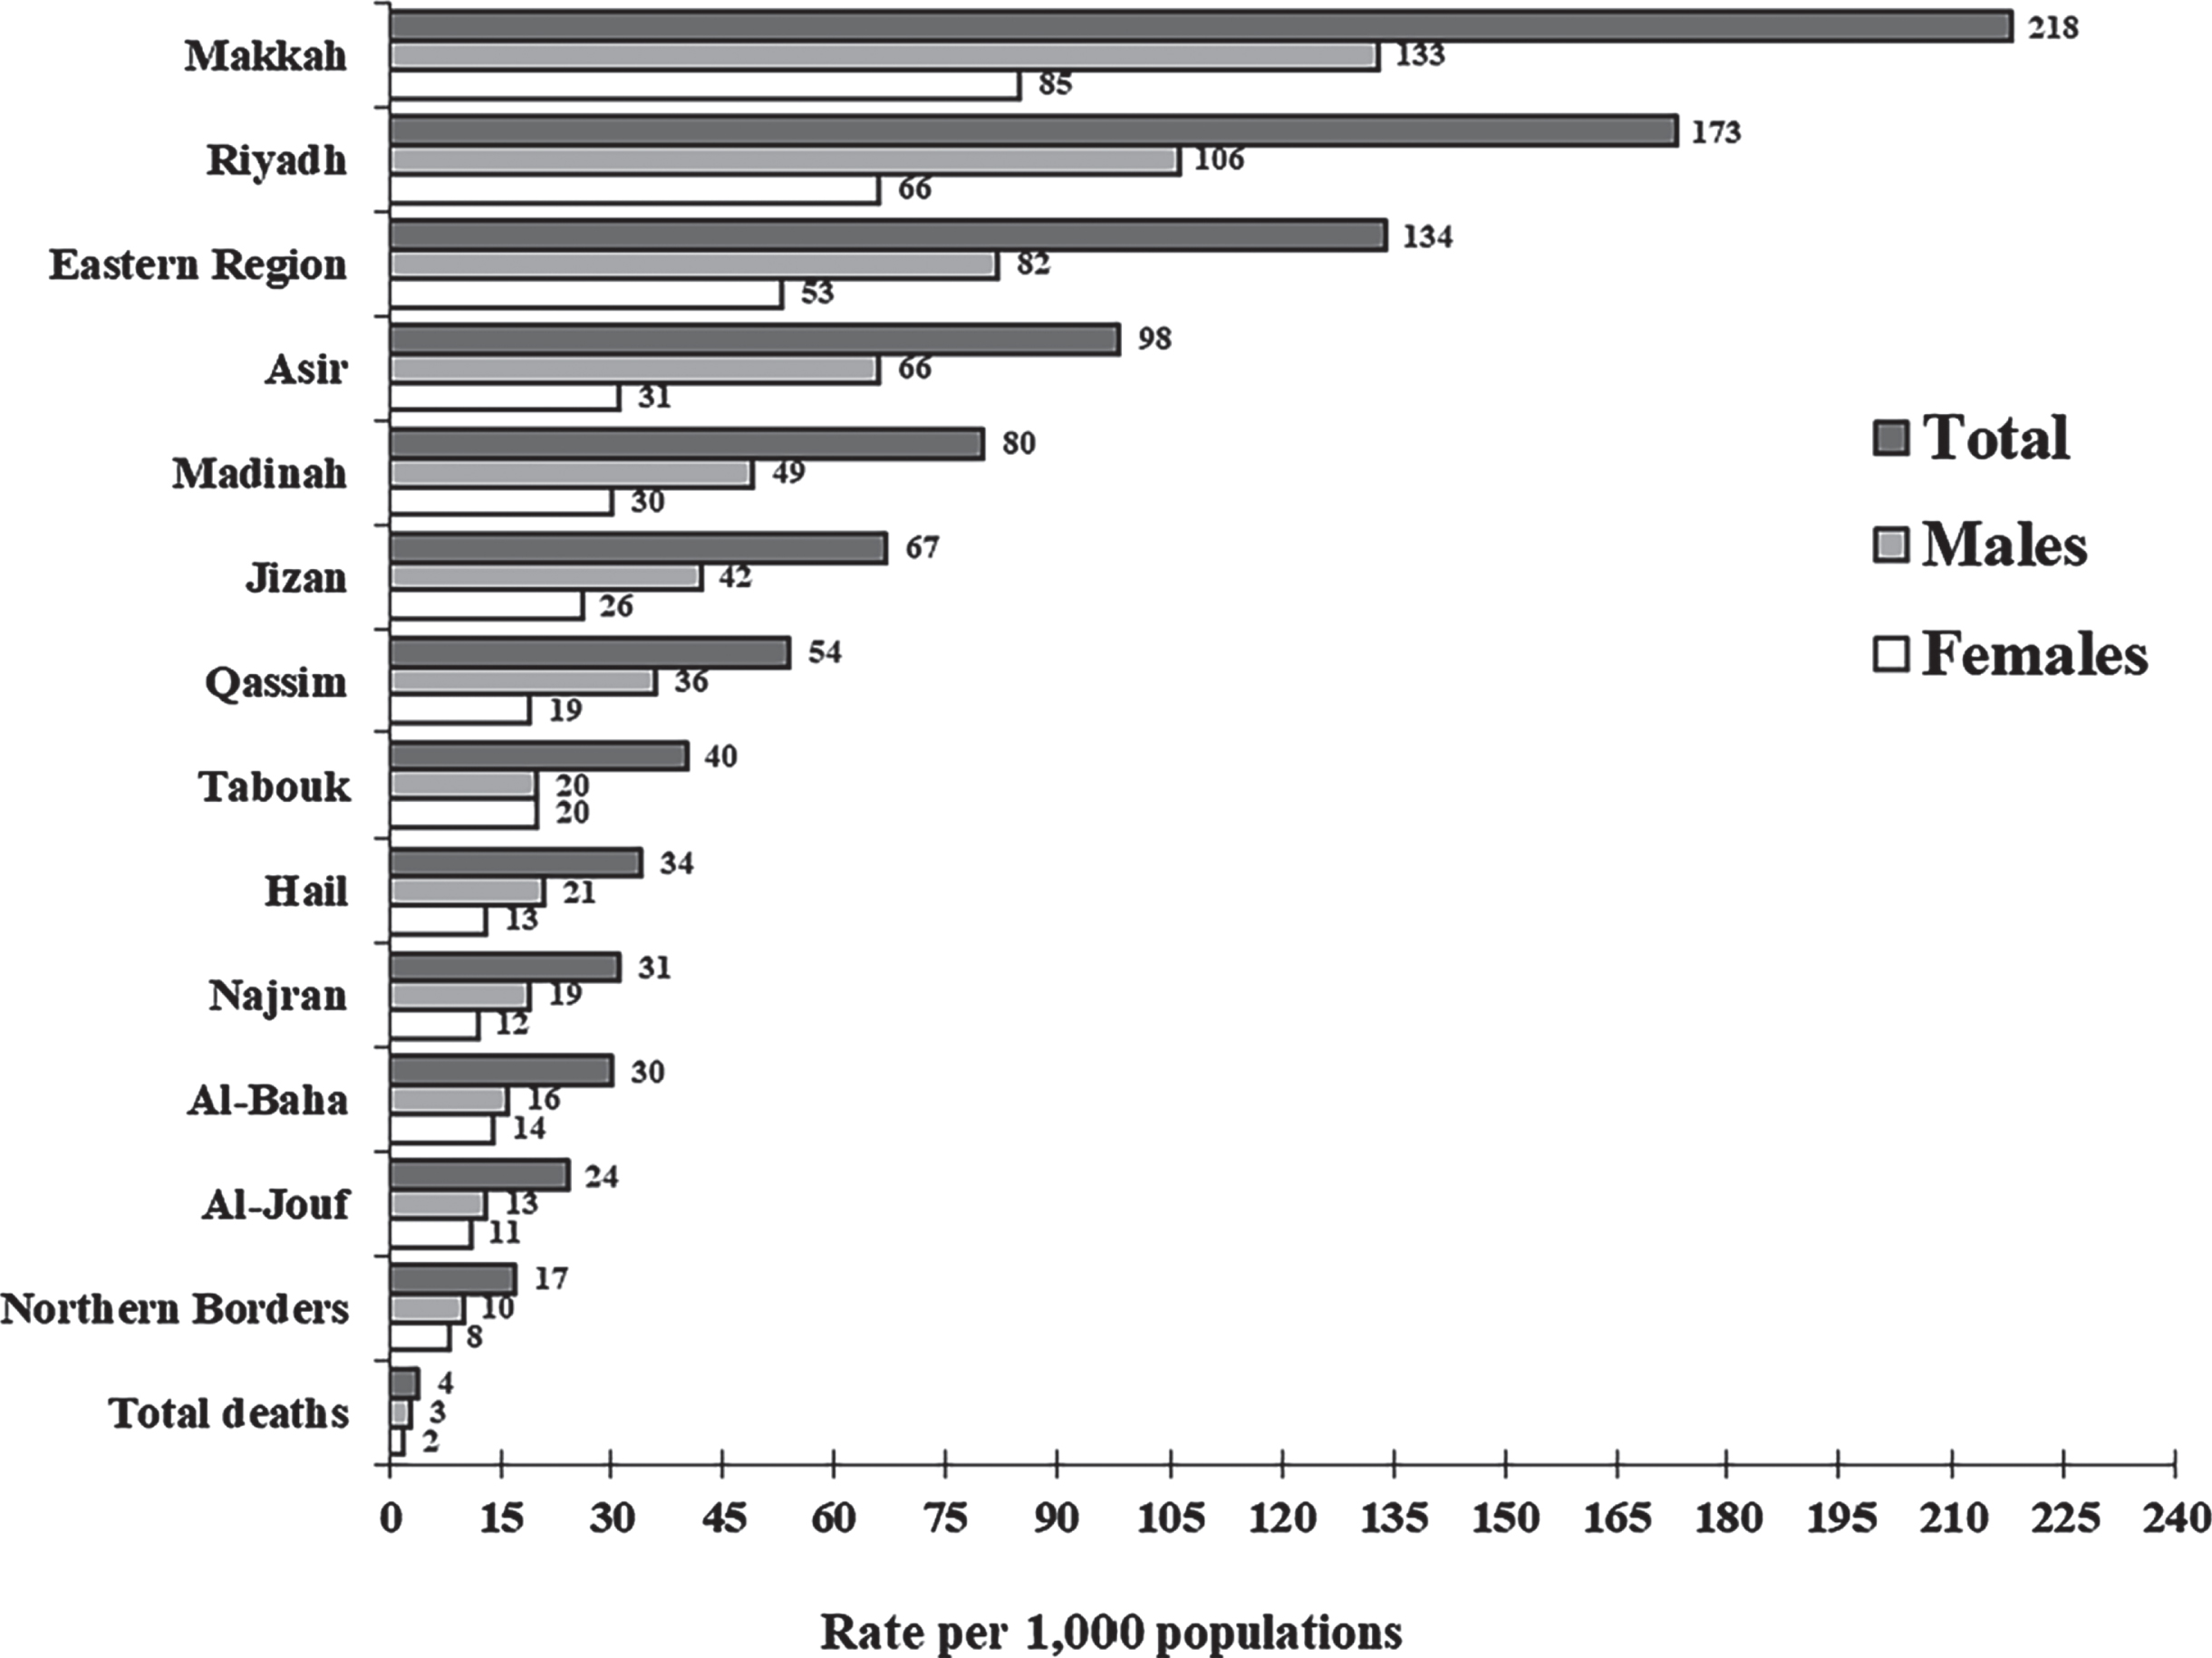
The death rate per 1,000 population in Saudi Arabia and administration regions.
For both males and females, there were a total of three and two deaths, respectively. According to the death ratio, two females died for every male overall. In the Tabouk region, there were two deaths overall for every woman. In Makkah, Riyadh, Madinah, and Qassim, there were more female fatalities than male fatalities (Table 3).
Death ratio, stratified by administrative region wise
*Total to male death ratio was calculated as the number of total deaths divided by the number of total deaths in males; Chi-square test, p = 0.502. **Total to female death ratio was calculated as the number of total deaths divided by the number of total deaths in females; Chi-square test, p = 0.245. ***Female to male death ratio was calculated as the number of total deaths in females divided by the number of total deaths in males; Chi-square test, p = 0.268.
The leading causes of death were illness (465 per 1,000 people per year), which predominantly affected women (525 per 1,000 people per year). Traffic car accidents (18.6% or 186 per 1,000 people per year), which were notably harmful to men (24.2% or 242 populations per year) (Table 4 and Fig. 2). The majority of deaths overall were caused by traffic accidents (five for every female). Male deaths outnumbered female deaths by a ratio of 4 to 1 (Table 5). The death rate was 4.1, lower than that of the Arab nations and high-, middle-, and low-income countries(Fig. 3).
The reason for death and proportion, stratified by gender
Deaths due to pregnancy/delivery in females are 141 (0.4%). Chi-square test, P = 0.220.
The ratio for a reason for death, stratified by gender
*Total to male ratio was calculated as the number of total deaths divided by the number of total deaths in males; Chi-square test, p = 0.312. **Total to female ratio was calculated as the number of total deaths divided by the number of total deaths in females; Chi-square test, p = 0.123. ***Female to male ratio was calculated as the number of total deaths in females divided by the number of total deaths in males; Chi-square test, p = 0.482.
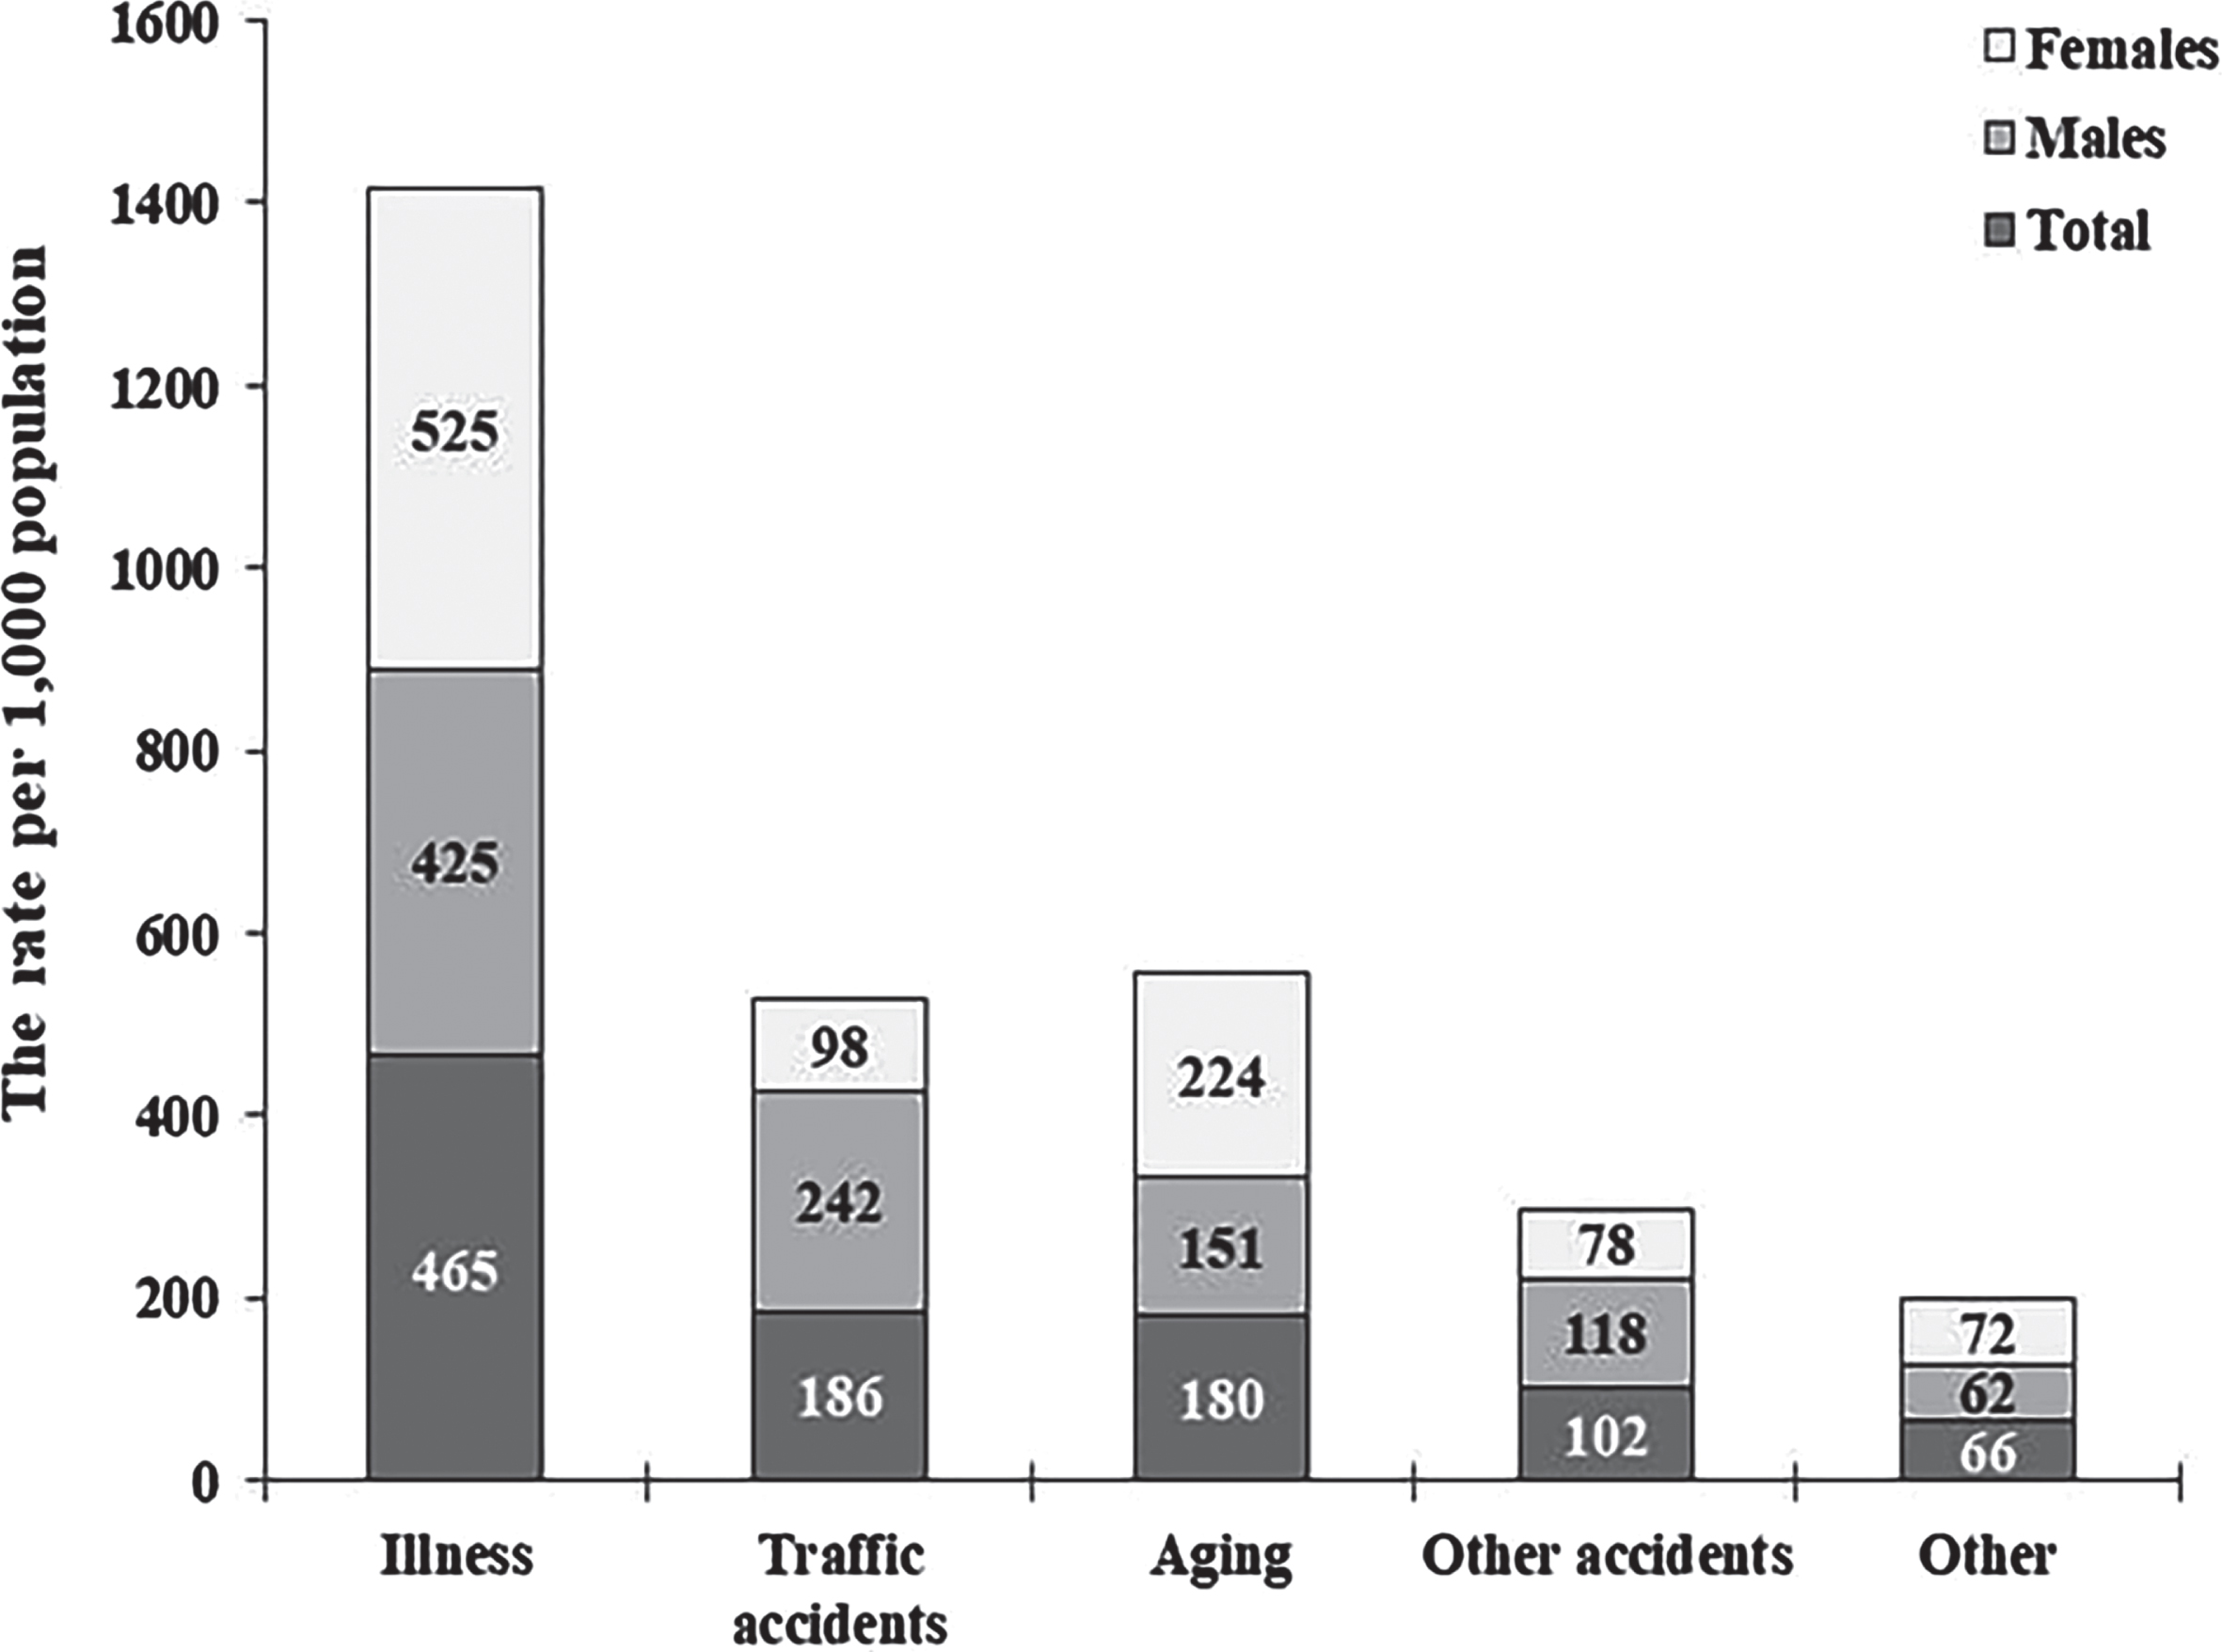
A reason for the death rate per 1,000 populations by gender. Chi-square test, P = 0.197.
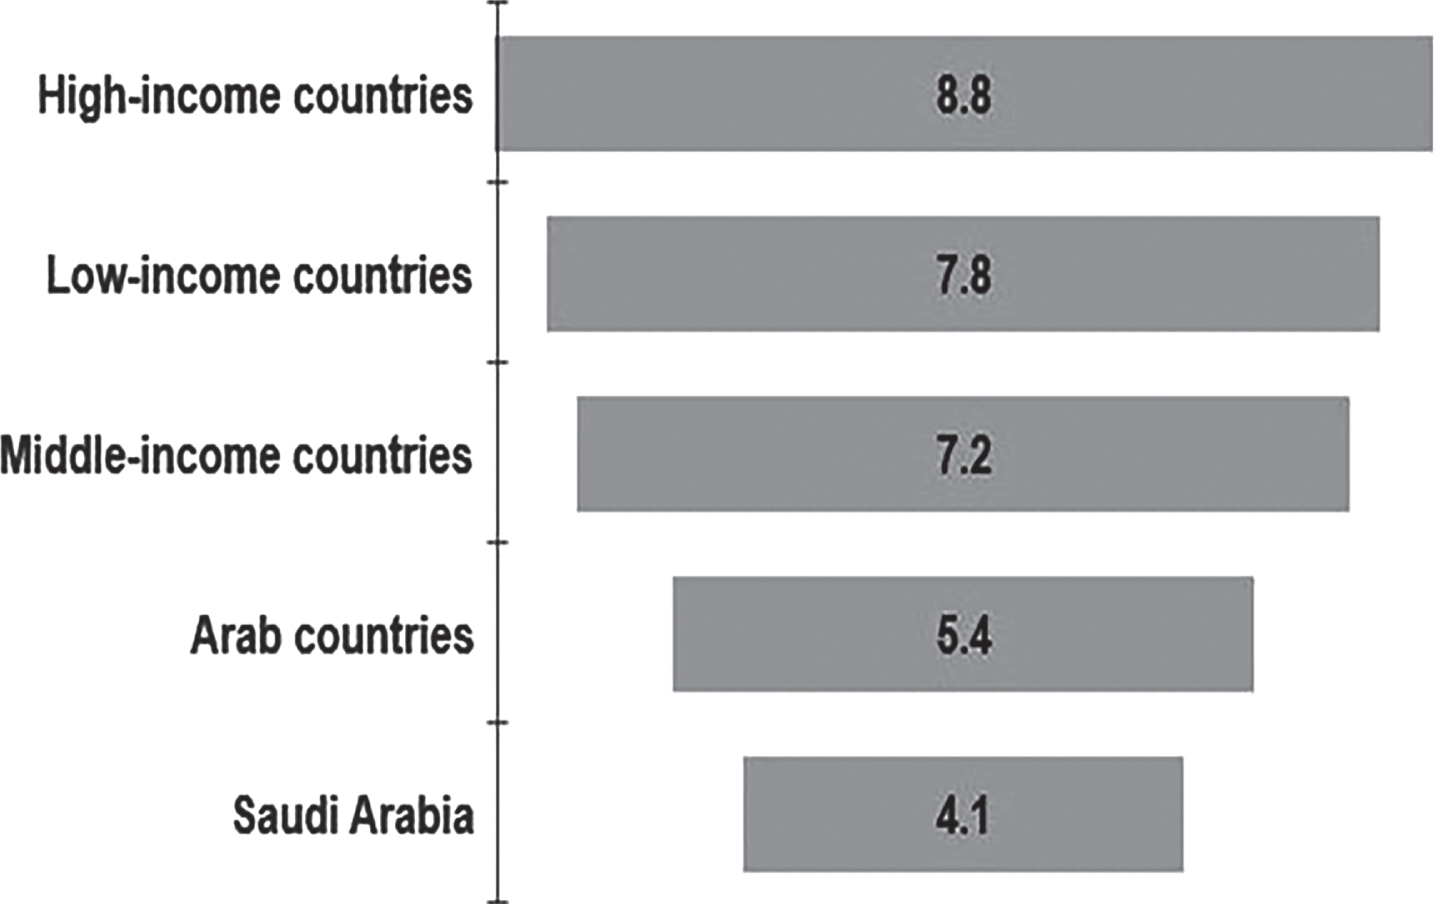
The death rate per 1,000 population in Saudi Arabia compared to other nations.
In 2017, deaths among Saudi nationals were estimated, along with the causes of death and frequency metrics. The leading causes of death were illness, particularly in women, and traffic car accidents, particularly in men. Makkah and Riyadh had more fatalities overall than other places combined. The northern border, in comparison, showed low mortality across the board. Fewer people died in Saudi Arabia than in the Arab nations and high-, middle-, and low-income countries. According to the death ratio, two females perished for every male. The ratio also revealed four male deaths for every female and five deaths overall for every female due to traffic accidents. No statistically significant differences were observed between the sexes.
The findings are broadly consistent with previous studies [13, 15]. Using results from the Global Burden of Diseases, Injuries, and Risk Factors Study (GBD) 2017, researchers described the levels and temporal patterns of deaths in the Saudi Arabian population between 1990 and 2010 and 2010 and 2017 [13]. They found a continued decrease in mortality rates in Saudi Arabia between 2010 and 2017 than in 1990–2010. The findings of the present study also revealed that the 2017 death rate in Saudi Arabia was more economical than that in other Arab nations and high-, middle-, and low-income countries [3, 20]. A possible justification might be the rise in life expectancy from 66 to 74.9 years and the decline in the infant mortality rate from 52 to 6.3 per 1,000 live births [21]. Moreover, there has been significant growth in healthcare availability at primary, secondary, and tertiary levels since 1925 in Saudi Arabia [22]. Currently, the nation has 487 hospitals with 72,981 beds (around 2.2 per 1,000 people) [23]. The Ministry of Health (MOH) often owns and controls the healthcare operation, which provides free medical care [24]. Another potential reason may be the WHO ranked the Saudi Arabian healthcare system 26th out of 191 countries [25]. The United Arab Emirates, Canada, Australia, USA, Qatar, and Kuwait were listed as 27th, 30th, 32nd, 37th, 44th, and 45th, respectively. Moreover, vision 2030, approved in April 2016, recognized its preferences across all economical sectors and helped as a roadmap for economic growth, including strengthening citizens’ health and life expectancy [26].
Interestingly, the primary cause of death was an illness, specifically in women. Older studies examined the burden of diseases and injuries in Arab world in 1990, 2005, and 2010 using data from the GBD 2010 [15] and 2013 [27]. Findings from those studies revealed that the burden of non-communicable diseases and injuries increased in the Arab world between 1990 and 2013. The results also showed that non-communicable diseases, notably ischemic heart disease contributed to 14.3% of deaths in 2010 and 90.3% per 100,000 people, with an increase of 17.2% since 1990. Moreover, the findings showed that depression, anxiety, lower back pain, neck pain, diabetes, and cirrhosis have increased since 1990. Previous studies also proclaimed a sharp increase in chronic conditions, such as obesity, smoking, and physical inactivity [28, 29], which raised the prevalence of cancer, diabetes, and coronary heart disease in Saudi Arabia [30, 31]. Furthermore, it has been described that Saudi Arabian females are prevalent in psychiatric illnesses, osteoporosis and breast cancer, depression, anxiety, and stress [32]. The high fertility rate in Saudi women has driven a considerable prevalence of low bone density, osteoporosis, and bone fractures [32].
Another exciting finding was that the second-highest cause of death was traffic car accidents, notably in men. Uniform on the current results, the WHO summarized that 1.24 million people were killed on the road, and up to 50 million were wounded worldwide [20, 33]. In Saudi Arabia, traffic accidents have been found to have many deaths; mostly, it is a leading reason for death in 16–30 years males [34]. Approximately 81% of the deaths in Saudi MOH hospitals were due to road traffic accidents, and 20% of their hospital beds were occupied by traffic accident victims [35]. It might be because motor vehicles are the primary means of transport within and between cities in Saudi Arabia. Another reason might be distracted driving. Researchers monitored the occurrence of distracted driving in an earlier study [36]. Participants were not made aware of the goal of the study. For four hours each day between 6:30 and 8:30 a.m., 4:30 and 5:30 p.m., and 6:30 and 7:30 p.m., distracted driving—texting or conversing on a cell phone while driving—was recorded. The amount of talking and texting while driving significantly decreased after the intervention compared to before. During the post-intervention phase, there was a 24% decrease in the rate of distracted driving, which rose to 32% at 6 months post-intervention. To establish consistency, the same observer who carried out the pre-intervention observation also carried out the post-intervention observation.
This finding has important implications for workplace health promotion. It has reportedly emerged as a new strategy to lower risk factors for non-communicable chronic diseases [37]. Some of the issues arising from this finding relate specifically to road safety and public health initiatives to enhance road users’ legal literacy [38]. Also, an effective injury prevention implementation campaign could reduce the incidence of distracted driving nationally. However, research on road traffic injuries publications, citations, and the impact was high in Saudi Arabia, especially from King Saud University [39]. This study’s compressed results implicate national authorities in promoting traffic safety by concentrating on research on road traffic deaths and injuries. A recent paper has described the conception, implementation, and initial testing of an objective scoring system that assigns safety indexes to observed driving styles [40]. The developed safety score has shown that the associated driving style should not be accepted for use while driving in actual traffic if the safety index decreases during a sizable portion of a driving session owing to frequent or severe safety margin violations.
Study strengths and limitations
The primary strength of this study was the adequate sample size—the projections of a larger sample are more reliable for predicting the current results. The main weakness of the present study is that it is limited to the 2017 data. There is variation in recent death and death rates in Saudi Arabia. A comprehensive, more extensive longitudinal study is needed to obtain current data at the national level concerning the epidemiology of death and the reason for death in Saudi Arabia. Another limitation was the lack of clinical data, especially on illness and definition, which can alter the current findings.
Conclusion
Illness, particularly in women, was the leading cause of death in 2017. Traffic car accidents, particularly among men, were a secondary cause of death. The death rate in Makkah was higher than in other regions. Compared to other high-, middle-, and low-income countries and other Arab countries, Saudi Arabia has a lower death rate. These results can improve public health, traffic accident monitoring, and the economic assessment of the country. Identifying and closely monitoring the factors causing worrying patterns in death and illness, particularly among women, require a national commitment and investment. A successful, comprehensive educational injury prevention effort is needed to decrease the prevalence of distracted driving nationwide, particularly among men. There is a need for extensive national research to validate these findings.
Footnotes
Acknowledgments
The authors would like to express their gratitude to the Saudi General Authority for Statistics for providing free online data for public access and making it possible to carry out this study. The authors would also like to thank the College of Applied Medical Sciences Research Center and the Deanship of Scientific Research at King Saud University for their support.
Ethical approval
Not applicable.
Informed consent
Not applicable.
Conflict of interest
None to report.
Funding
Not applicable.