
Abstract
BACKGROUND:
Offshore wind technicians (WTs) have been identified as having an occupation with high physical demands.
OBJECTIVE:
To characterise the physical demands of WTs, during the working day and when performing casualty rescues.
METHODS:
Data collection consisted of two components. Component A, 14 WTs (n = 13 male, 1 female) were monitored over three consecutive working days. The data collected consisted of: a questionnaire; heart rate and movement data; and accelerometer data. Component B, 5 WTs (n = 5 male) were assessed undertaking two simulated casualty evacuations. Heart rate and metabolic data were collected.
RESULTS:
A working day lasted 7.5 hrs to 9 hrs, with WTs covering, on average, 4.7 km on the turbine. WTs spent 28% of their time undertaking “light activity”, 69% “moderate activity” and 3% working “vigorously”. The greatest amount of time in a day was spent working on manual handling tasks such as torque and tensioning (up to 4 hours in total). Both rescues were performed largely aerobically, with similar cardiac and metabolic demands (14.56 (4.84) mL.kg–1.min–1 vs. 17.07 (3.54) mL.kg–1.min–1). Higher RPE values were reported for the rescue from within the Hub (median (range), 13 (12–14)) compared to down the ladder (11 (7–12)), likely due to a greater requirement to manoeuvre the casualty in tight spaces.
CONCLUSION:
The results presented characterise the physical requirements of WTs during the working day and two casualty evacuations. These data play an important role in supporting the job task analysis for WTs working in the offshore wind industry.
Introduction
The wind industry is undergoing large-scale commercial development of offshore wind farms [1]. This is resulting in an increased need to employee wind technicians (WTs) to undertake the regular service and maintenance routines performed on the turbines. To ensure that the industry is recruiting and retaining physically capable WTs, there is a need to understand the associated physical demands of a working day as an important initial step in completing a job task analysis [2].
Previous work by this research group [3] included a small-scale job analysis to identify the essential tasks associated with being a WT, using qualitative focus groups and interviews. In this work five essential tasks for WT were identified: transfer from the vessel to the transition piece (i.e., “an external platform, that allows access into the turbine, Fig. 1”); ascent of the internal ladder; manoeuvre through hatches; torque and tensioning; and casualty evacuation [3]. The working day was found to be tide dependent, with departure times to the turbine varying between 0300 and 1500, and with the potential for technicians to be on a vessel transferring, to and from the turbines, for 3 to 4 hours of a 12-hour working day [3].

Schematic of an offshore wind turbine. The schematic is not to scale with variations occurring in all aspects across the industry. The model is based on a 3.6 Offshore Turbine [2].
With significant developments in the accuracy of wearable health devices, there is now the opportunity to measure the physical demands of workers using embedded biosensors such as heart rate (HR) and accelerometer sensors [4–8]. In particular, wristband-type wearable health devices, such as smartwatches and fitness trackers, are lightweight, comfortable, affordable, and have great potential for measuring physical demands at the worksite without disrupting ongoing work. One study objectively measured the physical work demands of offshore WTs [4], using accelerometers and HR data, the average physical work was reported for the following activities as a percentage of the working day: sitting (43%), standing (19%), lying (13%) moving (9%), walking (8%) and high intensity physical activities (1%). Only 1 minute was reported to be spent climbing vertical ladders [4], assuming a 9-hour working day including transfer to and from the turbine this accounts for 0.02% of the day. The approximate median (range) reported for percentage heart rate reserve (HRR) and time spent above 60% (HRR) was 35 (18 to 33)% and 6 (3 to 23) mins, respectively. The data collected included the time spent transferring to the turbine, therefore it is of interest to understand what the physical work demands would be without the transfer time included. When measuring physical demands for a job based on HR, it is important to consider factors such as environmental conditions, nutrition, methods for measuring resting heart rates, mental stress, illness, and medications [9]. Alternatively, wearable physical activity monitors, relying solely on movement data, have proven to offer a valid estimation of metabolic equivalents (METs) during military training. The tasks involved in such training differ from the typical human movements for which the algorithms were initially developed [8]. Therefore, the use of movement data could be considered a more suitable measure when assessing the demands placed on WTs over consecutive working days when external factors (e.g. environment, lifestyle etc) are not controlled.
Casualty evacuation has been identified as an “infrequent essential” task (i.e., “a job that may not occur as part of the regular service pattern in WTs, but when the need arises for people to undertake item, they must have the necessary physical capacity”) [3, 10]. These rescues were classified as rescues from: 1) the Hub 2) the tower and 3) the Nacelle (Fig. 1). Rescues can be broken down into five key areas including: 1) Gaining access to the area where the casualty is, 2) Assessing the casualty, 3) Manoeuvring the casualty to enable the rescue 4) Setting up pully systems and manoeuvring the casualty through the turbine, 5) Lowering or lifting the casualty to the extraction point [10]. One of the key differences between casualty evacuation and the other work tasks performed by WTs is the inability to take a rest break when needed, with rescues reported to last ∼45 mins [10]. Due to the infrequent nature of these tasks it is not possible to measure the physical demands on the turbine. Training centres have been set up that allow the WTs to undertake casualty evacuation scenarios and acquire experience using the equipment and techniques to perform this task, whilst gaining the required advanced rescue trained qualification [GWO Advanced Rescue Training Standard V2.1]. Currently there is no literature or, objectively measured data, to help characterise the physical demands of these casualty evacuation scenarios.
The primary aim of this study was to characterise the working day of WTs in the offshore wind industry. The secondary aim was to quantify the physical demands of two simulated rescue scenarios WTs based on their industry standards.
Study design
The study was broken into two components A and B. Component A was a three-day cross sectional, within-participant field study among WTs. Component B was a counterbalanced within-participant design consisting of two simulate rescue scenarios. Ethical approval was obtained for both components, from the University of Portsmouth’s Science Faculty Ethics committee (SFEC2020-023). This study complied with The Declaration of Helsinki, as adopted at the 18th World Medical Association (WMA) General Assembly, Helsinki, Finland, 1964 and last amended at the 64th WMA General Assembly, Fortaleza, Brazil, October 2013.
Component A: The physical demands of a working day
Participants
Participants were recruited from a single wind farm associated with a large sustainable energy company in the UK, who supported the project and advertised participation among their WTs. Involvement was based on participant availability and participation occurred following provision of informed consent. WTs were considered eligible to volunteer to participate if they were currently working on a service campaign. Participants p (n = 14, 13 males and 1 female) were recruited (age: 33.5 (7.63) years; mass: 83.57 (10.22) kg; height 179.57 (8.02) cm) and were reflective of the offshore WT population.
Procedures
Data were collected for three consecutive days in consecutive weeks during September 2021. Data collection was aimed at service teams working on a 3.45 mW turbine (80 m height to Hub). The data collected consisted of: A questionnaire on tasks completed, duration of these tasks, work:rest schedule, RPE rating of each task, and a description of what the task consisted of. Measurement of HR and movement data (e.g. distance travelled and speed) during the day. Directly measured physical work demands using accelerometer monitoring.
Data collection began at 6 am each morning as WTs arrived on site. Participants height and mass were recorded. HR monitors (10 Hz Polar Team Pro GPS, Polar Team Pro Sensor, Polar Electro, Kempele, Finland) and activity monitors (GENEActiv, Activinsights, Kimbolton, Cambridge, UK) were applied before transfer to avoid interfering with the working day. Information on work schedule and maintenance required each day was provided in the morning. This was checked against the daily logs completed at the end of the day by the WT to ensure consistency.
Measurements
Mass –was recorded to the nearest 0.05 kg (Model B150 S Sartorious, UK) in minimal standard clothing (trousers, t-shirt and socks, without shoes).
Height –In standard clothing, shoes removed participants stood on a stadiometer (Seca Ltd, Leicester, UK) looking straight ahead with their feet together. Feet, buttocks and head in contact with the back of the stadiometer. Height was recorded to the nearest 0.1 cm.
Assessment of physical activity –An accelerometer (GENEActiv, Activinsights, Kimbolton, Cambridge, UK), programmed to record movement data for three consecutive days, was fitted to the participant’s dominant wrist. The GENEActiv accelerometers measured triaxial movement acceleration in gravity (g) units (1 g = 9.81 m.s–2) at a frequency of 100 Hz continuously. The Euclidean norm (magnitude) of signals from the three axes minus 1 g (with negative numbers rounded to zero) was used to quantify acceleration due to movement in mg (1mg = 0.00981 m.s–2). Following the measurement period, data were downloaded using the manufacturers software and processed in R (R Core Team, Vienna, Austria) using the open source GGIR software package (http://cran.r-project.org). Previously established acceleration thresholds [11], validated in healthy adults, were employed to measure the average time (in minutes per day) spent in each intensity category including: total physical activity, light, moderate, and vigorous intensities. Additionally, participants wore a Polar heart rate monitor (10 Hz Polar Team Pro GPS, Polar Team Pro Sensor, Polar Electro, Kempele, Finland) that has an inbuilt tri-axial accelerometer, motion sensor and gyroscope.
Component B: Casualty Rescue
Participants
Participants (n = 5 males) were recruited from employees of the Wind Industry who were in date for their industry medical (age 36.6 (4.04); mass 82.22 (8.86) kg; mass including personal protective equipment [PPE] 91.72 (8.86) kg; height (177.90 (5.89) cm; Chester Step Test –Predicted
Procedures
On arrival at the Siemens Gamesa Training Centre, Hull participants height, and mass were recorded, and a Polar heart rate monitor (Polar Team Pro GPS, Polar Team Pro Sensor, Polar Electro, Kempele, Finland) was secured around their chest. Participants were then asked to complete the Chester Step Test. On completion of this test, participants were seated and rested until their HR returned to the pre-test level (∼10 mins). Water was permitted ad libitum.
Participants donned their standard PPE and Climbing harness. Mass was remeasured in full clothing before fitting a Cosmed K5 Ambulatory Gas Analysis System (Cosmed, Italy). Participants then rested for 5 mins prior to undertaking one of the two rescue scenarios
Participants were asked to undertake two simulated rescues in a counterbalanced order over two visits.
Get to the casualty (a rescue dummy weight 59 kg, based on the GWO training requirements and the load equating to single person contribution during a two-person rescue) –gain access to the Hub from the Nacelle, manoeuvre the rescue dummy onto the back in order to perform a primary top to toe survey of the casualty. Assess the casualty, including assessment that the casualty is breathing and a top to toe survey. Packaging the injured person (rescue dummy) –manoeuvre the casualty onto a spinal board. Manoeuvre the casualty to the position where they can be lowered or lifted to the assembly area –set up the 6 to 1 pulley to allow the casualty to be manoeuvred through a hatch connecting the Hub to the Nacelle. Move the casualty through the Nacelle to the escape hatch. Once at the escape hatch a Milan (Fig. 2) was secured, this involves the stretcher being lifted to remove the slack from the Milan. Lower the casualty to the assembly area –the casualty was then lowered feet first through the escape hatch before being lowered to the ground.
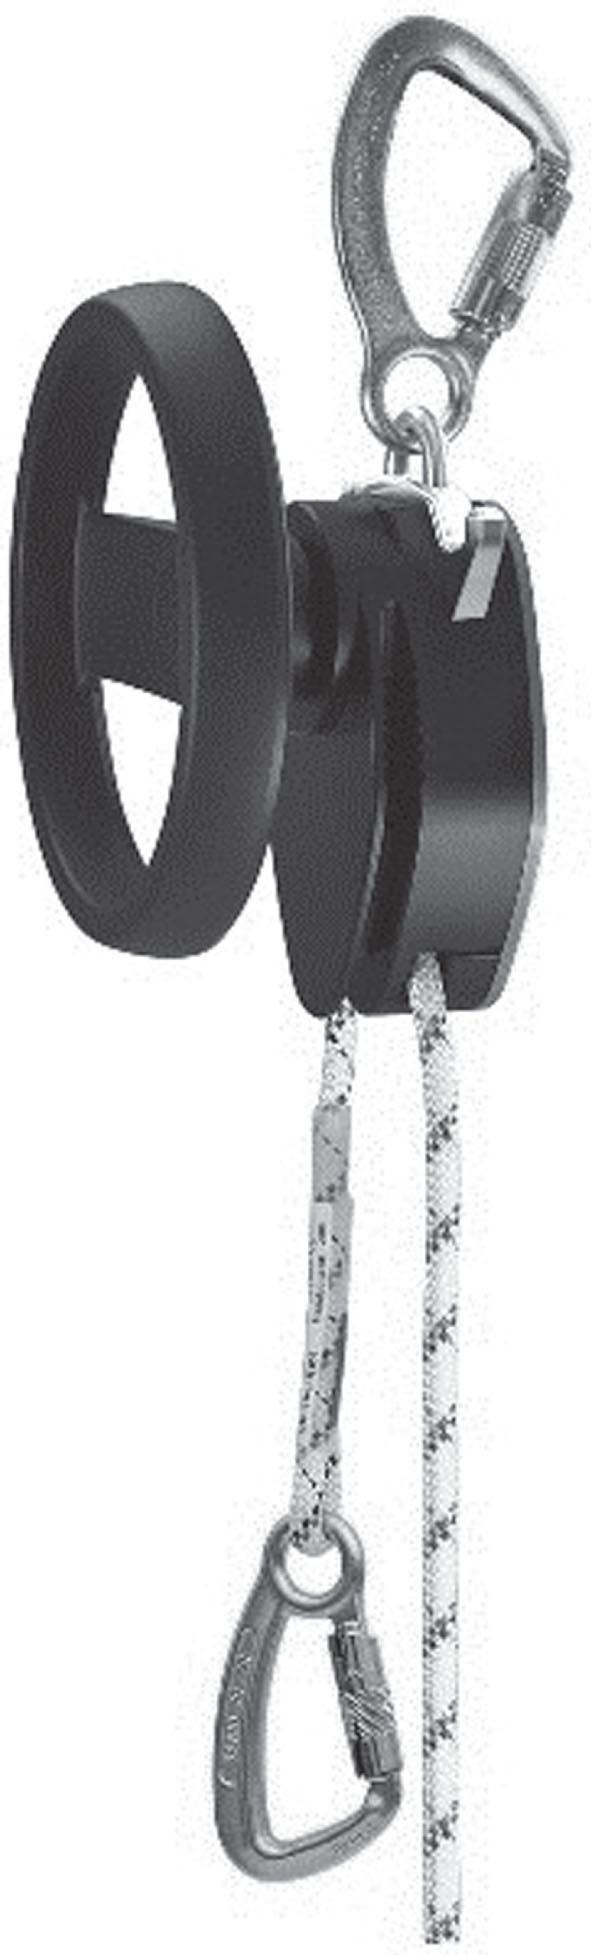
Picture of the Milan used during rescue on a wind turbine. This pully system works on a 6 : 1 ratio.
Get to the casualty (i.e., “a rescue dummy weight 59 kg”) –climb to the casualty up the training ladder, manoeuvre into a position to be able to perform a primary survey. Assess the casualty, including assessment that the casualty is breathing and a top to toe survey. Initiate the rescue set up by placing the Milan approximately 2 m above the casualty, on structural anchor points, reinforced ladder rungs or ladder stiles. Lift the casualty with the Milan to allow the casualty to be disconnected from their fall arrest system. Lift the casualty whilst descending the ladder.
Each phase was timed, the number of breaks in physical activity noted, and the duration recorded. On completion of the simulated rescue participants were asked to sit resting for 10 minutes, before data collection was stopped. Breath by breath data were collected throughout the rescue using a Cosmed K5 Ambulatory Gas Analysis System (Cosmed, Italy). HR, sampling at 20 s intervals, was recorded throughout. At the end of each phase of the rescues, rating of perceived exertion was recorded.
In order to quantify the loads lifted and pulling and pushing forces during the rescue, a load cell force transducer (Biometrics, UK) were incorporated into the rescue systems by the onsite training instructors. Task demands were repeated three times to determine the average force requirements. These measurements were undertaken on separate occasions to the simulated rescues.
Height and mass were recorded following the procedures reported in Component A.
The Chester step test –a submaximal test which requires the candidate to step up onto a step which is 30 cm (if under 40 years old) and 25 cm (if over 40 years old) in height. Once on the step with both feet, the WT stepped back off the step before repeating the movements in time with a metronome. The Chester Step test is multi-staged, starting at 15 step.min–1. Each stage lasts 2 minutes. On completion RPE and HR are recorded before an increase of 5 steps.min–1. Participants continued stepping until they reached 80% of their age predicted maximum HR or complete level 5.
Oxygen consumption –Breath by breath metabolic data were collected throughout exercise, using a Cosmed K5 3b Ambulatory Gas Analysis System (Cosmed, Italy). The responses were measured breath-by-breath and then converted into 20 second collections and are reported as average values for the task. The weight of this system was counted in any load the participants were carrying or wearing.
Heart rate –recorded using a polar HR monitor every 20 seconds throughout the trial.
Rating of perceived exertion (RPE) –recorded at the end of each 5-minute bout of exercise, using a 1–10 Borg scale.
Results
Component A: A sample working day
Daily temperatures were recorded by the WTs from within the turbine at various times of the day. Temperatures were reported to average 32.8°C with a range of 25°C to 34°C. The days began with loading of bags onto the vessel. This was followed by a briefing on the vessel, beginning at approximately 7 am. Shortly afterwards the vessel set sail. The travel time to the turbine varied between 60 minutes and 90 minutes depending on which turbine the vessel was travelling to. These transfer times are consistent with the majority of turbines in the UK. Additionally, on some days, the vessels stopped at two or even three turbines on the journey which increased travel time for the WTs to the final turbine. Many WTs sat and had breakfast during this time. Others lay down and slept. This activity varied within WTs from day to day. The transfer from the vessel to the turbine generally took 15–30 mins. The day ended with a vessel transfer back to shore. This generally occurred between 4 pm and 5 pm, depending on the jobs required and the number of WTs on each vessel and consequently the number of stops at other turbines e.g. it may be slightly earlier if a WT was on the first of three stops for that particular vessel and later if the WT was on the third stop. Activity varied on the return journey. Some WTs sat and ate/read/chatted during that time, others lay down and slept.
WTs tended to rate many tasks as “high” demand (e.g. median rating of 6.5 across tasks during a day) and another rated similar tasks lower (median rating of 4.5 across the day). However, the scoring within each individual relative to each task was similar i.e., “ladder climbing and torque/tensioning were consistently rated highest”. The median of each task relative to each other should represent the difficulty of the task as rated by the WT, rather than the absolute score. Table 1 displays the most common tasks during the day along with the rating assigned to them by the WTs.
Daily tasks of the Wind Technicians (WTs) with rating of physical demand (n = 14; n = 13; n = 1 female)
Daily tasks of the Wind Technicians (WTs) with rating of physical demand (n = 14; n = 13; n = 1 female)
Note: TP = Transition piece; CTV = Crew transfer vessel. The actual climbing time was measured separately using the HR monitors with built in motion sensors. The climb time was averaged 22 mins from getting off the vessel to end of ascending. Prior to getting off the vessel the WTs donned life jackets and prepared their equipment. The times noted in Table B1 are those reported by the WTs.
The tasks listed in Table 1 were then used for the analysis of the activity monitor data and the Team Pro sensor data (Tables 2 and 3 respectively). Ladder climbing data are broken down into transferring with high tide and low tide. This varied across the testing days, with WT reporting a high tide transfer to be less strenuous, due to less distance travelled. None of the WT were required to climb the full height of the turbine during these services. Tasks relating to torques were consistently ranked as most physical demanding. When tasks were broken into two-person and three-person tasks, the two-person task was consistently rated as more physically demanding.
Physical Activity data gathered using a wrist accelerometer (n = 14; 13 males and 1 female)
Note: TP = Transition piece; CTV = Crew transfer vessel. The time taken for a task varied slightly depending on the day and on the WT. Therefore, the range of times of these tasks are presented. The calculations of % times in each category are calculated using data beginning when the vessel arrived at the turbine, and ending when the WT was back in the vessel. The travel time was primarily in the light activity category and not included so as not to lower the percentages in moderate and vigorous categories when on the turbine. To allow for interpretation of the data, values for cut points associated with sedentary (≤1.5 METs), light (>1.5–2.99 METs), moderate (3–5.99 METs) and vigorous (≥6 METs) were assigned to place activities into categories.
WTs total daily movement on the turbine was 4730 (767) m (Table 3). Although some of this is their travel to the top of the turbine using the lift, many other activities take place with repetitions of small distances. The greatest distance travelled are via ladders when ascending and descending the turbine. These data are presented in Table 3. Additionally, the distances are normalised to hourly rates to allow average distance per hour on that task to be viewed. The distance travelled includes all vertical and horizontal movement, this is not discriminated between in the data presented. As can be seen from the data in Table 3, the greater rate of movement (distance/hour) and greater velocity of movement took place during ladder climbing. The ladder climbing data from Table 3 has been further evaluated to determine ladder climbing speeds Table 4.
Distances travelled and velocities
Note: TP = Transition piece; CTV = Crew transfer vessel. Individual peak velocity represents the single highest speed reported by an individual. Data are presented as Mean (SD). For max velocity, the greatest value of any WT is presented. The SD is also presented to allow a view of the spread across all WTs. It is important to note that this value represents the spread around the mean rather than the max value.
Ladder climbing distances travelled and velocities
Air temperature during the trials ranged between 19°C to 22°C with barometric pressures between 748 mmHg to 776 mmHg. The data presented in Table 5 provide the overall physical demand for the rescues with respect to each component (e.g. organising, climbing, attaching rope etc) and the time spent performing each of these. The physical demands of each component task are detailed in Tables 6 and
Mean (SD) casualty evacuation data for both rescues (n = 5)
Mean (SD) casualty evacuation data for both rescues (n = 5)
Note: WTs = Wind technicians; ARTWT = Advance rescue trained wind technicians.
Casualty rescue down a ladder (n = 5)
Casualty rescue for the Hub
The results of this study identified that the majority of the day (69%) is spent undertaking activities of a moderate nature, with 3% working vigorously. Using MET data to provide an approximation of the aerobic demand suggests that WTs would be working daily between 10.5 mL.kg–1.min–1 and 20.9 mL.kg–1.min–1 and at work intensities≥21 mL.kg–1.min–1 for approximately 15 mins. To ensure WTs can complete tasks without becoming exhausted, and be able to go on to do other tasks, work rates should not require an individual to work at their maximum capacity for anything other than very brief periods. For tasks with an aerobic demand this equates to a percentage of maximum aerobic capacity (
Whilst other studies have identified WTs as a group who experience high physical demands, strains and musculoskeletal disorders as a result of working on a turbine during service campaigns [14–16], this is only one of two studies to have collected physical demand data on a turbine during the working day. The only other study to have investigated the physical requirements of WTs was that of Oestergaard et al. [4]. The data of our study (METs) and that of Oestergaard et al. (% HRR) [4] reported on average MET data between 2.2 to 4.7 for various job task, and % HRR of 22% ranging between approximately 18% and 33% across days [4]. Comparing the MET and % HRR data [16] suggests that the WTs were working at similar intensities during the both studies, with the main differences occurring in the duration spent completing moderate and vigorous activities e.g. ∼4 min per day on vigorous activity [4] compared to ∼15 mins in the present study, corresponding to the transfer from the vessel to the turbine. Climbing speeds during the transfer were reported on average to be 44.5 rungs. min–1, with the minimum speed observed being 41.6 rungs.min–1, which is greater than those observed previously [18]. These data confirm that short ladder climbs are both essential and frequently performed tasks.
The data collected during this study and Oestergaard et al. [4] did not include WTs climbing the full height of the turbine. However, this task has been classified as an essential infrequent task during recent job task analysis in which interviews (n = 45) focus groups (n = 14) and a survey (n = 167) were conducted [10]. If a lift cannot be used it is essential that WTs climb the turbine to get to the Nacelle. Subject matter experts reported that the number of times in a year they are likely required to climb the full height of the turbine was approximately three, ranging between none to >10 [10]. The data presented here do not include days involving climbing the full height of the turbine; it is considered crucial to conduct additional research to investigate whether the physical exertion involved in ascending the ladder’s the entire height of the turbine exceeds the reported physical demands reported in this study. Neglecting this activity may lead to underestimating the minimum aerobic threshold required for establishing a physical employment standard.
Collecting data in-situ results in a number of limitations. The activities/diary were completed retrospectively, and so the timings between tasks are not exact. However, based upon the data from the activity monitors, a picture of the day can be established. Additionally, the use of the rating of physical demand scale varied significantly between individuals. Some rated many tasks high (e.g. median rating of 6.5 across tasks during a day) and another rated similar tasks lower (median rating of 4.5 across the day). However, the scoring within each individual relative to each task (rank order) was similar i.e., “ladder climbing and torque/tensioning were consistently rated highest”. The median of each task, relative to other tasks should represent the difficulty of the task as ranked by the WT.
When analysing the physical activity data, it’s important to consider that the activity monitors were worn on the wrist of the WTs. As a result, these monitors only capture large movements of the whole body and do not account for activities that may cause local muscular fatigue. Ladder climbing, which involves extensive arm movements, emerges as the most physically demanding activity. This finding contradicts the perception of the WTs who believed tasks like torque and tensioning to be the most physically demanding. Thus, the data does not accurately reflect the physical demands of tasks such as holding a 20 kg tool, manoeuvring in confined spaces, and working in uncomfortable positions, in which the physical demands are based in the parameters of strength, strength endurance and mobility.
A number of studies have looked at the physical demands of various casualty rescues under different conditions [19–23]. Both rescues in the present study were performed predominately aerobically, eliciting relatively similar cardiac and metabolic demands, which can be considered “low” when compared to the demands reported in other studies [19–23]. This is likely due to the differences observed in the distances needed to be travelled to get to the casualty e.g. climb a mountain [21], walk, swim or paddle out to a casualty [19, 22]. The higher RPE values reported for the Hub rescue are due to the increase in time to complete the rescue and a greater requirement to manoeuvre the casualty in tight spaces. It should be noted that for the rescue down the ladder, the mass to be manoeuvred was the weight of the rescue dummy, whilst the rescue in the Hub included the rescue stretcher. During a casualty rescue down a ladder WTs are required to lift the casualty to release them from the ladder in order to lower them. This lift was performed with the WT using both hands whilst leaning with their back against the tower –this is only possible in smaller turbines i.e., “<6 mW, such as those used at GWO training centres, where the tower wall is close enough”. In larger turbines, WTs may have to change their technique, which may require one hand remaining on a rung whilst performing the lift single handed. Neither rescue elicited higher aerobic demands than those experienced during the working day or prolonged ladder climbing. Although the metabolic demands are lower, the physical demand comes from working in restricted spaces while having to manoeuvring the casualty onto the stretcher and repeatedly hauling a mass through, up or down the turbine.
Conclusion
These data can be used to support the job task analysis undertaken for WTs working in the offshore wind industry [3, 10]. It is concluded that the most physically demanding essential tasks of working as a WT in the offshore wind industry are ladder climbing, torque and tensioning, manual handling, working in restricted spaces and casualty evacuation from the Hub.
Footnotes
Acknowledgments
The authors would like to acknowledge the Energy Institute and the member organisations of the G + Offshore Wind Health and Safety Organisation.
Conflict of interest
None to report.
Ethical approval
The study was approved by the Science Faculty Ethics committee of the University of Portsmouth (SFEC2020-023).
Informed consent
Informed consent was obtained from all participants prior to inclusion in the study.
Funding
Financial support was received from the G + Offshore Wind Health and Safety Organisation.