
Abstract
BACKGROUND:
Work-related musculoskeletal disorders for upper limbs (UL-WMSDs) form a complex of occupational diseases common to many professions worldwide. UL-WMSDs are manifested in most cases by pain, resulting in musculoskeletal discomfort.
OBJECTIVE:
This research aimed to evaluate the perception of musculoskeletal discomfort in workers from the interior of the Brazilian states of Alagoas and Bahia through the construction of a scale to assess musculoskeletal discomfort for upper limb.
METHODS:
The discomfort assessment scale was constructed from self-reported pain symptoms by 420 workers from the inner regions of the Brazilian states of Alagoas and Bahia. The reliability and dimensionality of the collected data were analyzed by McDonald’s Omega and exploratory factor analysis, respectively. Item Response Theory (IRT) was used to create parameters for the discomfort scale.
RESULTS:
The musculoskeletal discomfort metric was constructed from the workers’ response with six levels (varying from minimum discomfort to maximum discomfort). At the lowest level of the scale, workers indicated symptoms in the shoulders and wrists were rare. At the highest level of the scale, daily pain symptoms are reported in all regions of the upper limbs. The shoulders are the last region to develop extreme pain symptoms.
CONCLUSION:
The metric was created to present satisfactory psychometric properties and capable measurement of the workers’ level of musculoskeletal discomfort based on self-reported pain symptoms. Therefore, the metric can support measuring discomfort, contributing to decisions that improve a healthier occupational environment for the worker.
Introduction
Work-related musculoskeletal disorders (WMSDs) are considered a serious, common, and expensive occupational health problem [1, 2]. The report from the Special Secretariat for Social Security and Labor in Brazil accounted for around 39,000 workers a year being removed from work due to WMSDs, creating a loss of functionality because of the difficulty of movement, impacting both the professional and personal life of the worker [3]. In some cases, WMSDs are associated with insufficient time to recuperate the parts that form the musculoskeletal system of workers [3–5]. Therefore, when the psychomotor and cognitive demands of work go beyond workers’ limits, a process of illness begins that affects various regions of the body, especially the upper limbs [6].
In countries like Brazil, WMSDs impose the greatest occupational disease burden occupational disease [7]. Therefore, WMSDs become a complex problem because they have a multifactorial origin [8] and because they are influenced by characteristics of the work environment, and the way the activities are performed [9]. Indeed, pain symptoms result in decreased work efficiency, negatively impacting the increase in production costs and reducing the quality of the product or service being offered [10].
According to data from the Brazilian Ministry of Health, WMSDs have a higher incidence among professionals that work in the sectors of industry, commerce, food, transport, and domestic/cleaning services [7]. Between 2016 and 2017, the Northeast Region had the second highest incidence of WMSD in the country, with 27.2%of cases in workers [11].
Despite this, there is an under-notification of cases of musculoskeletal disorders in inner regions of the Northeastern states, especially in Alagoas and Bahia [12]. Thus, the actual WMSD cases may be higher than the official information from the Brazilian government.
However, it is possible to identify economic sectors with a high number of reported accidents at work, like the hospital care sector, with 6%of accidents between 2012 and 2022 in the city of Delmiro Gouveia (inner of the State of Alagoas); and the electrical energy sector (27%of accidents), public administration (7,44%of accidents), preservation and manufacture of fish products (6,82%of accidents) and retail trade of goods in general (6,05%of accidents) in Paulo Afonso (city of the State of Bahia) according to the National Institute of Social Security of Brazil [13].
Because they are considered costly occupational injuries, WMSDs have been constantly studied in different work contexts. In many cases, statistical modeling has been used to analyze the influence of risk factors on the onset of upper limb work-related musculoskeletal disorders (UL-WMSDs) [14–16]. However, the literature is incomplete in the construction of scales that consider ergonomic issues to guide organizational policies and practices during the analysis of working conditions [17]. In this context, in most cases, musculoskeletal discomfort is assessed either by a single item or based on the sum of symptoms reported by workers. However, expressing a complex phenomenon through a simple item does not seem the most appropriate. Likewise, for musculoskeletal discomfort scores that are generated based on the sum, simple or weighted, it is not known how accurate and reliable they are.
Metrics or scales to quantify musculoskeletal discomfort are still scant. Alternatively, researchers in ergonomics and occupational health have used Item Response Theory (IRT) to pick up the response patterns associated with musculoskeletal symptoms in the body parts of workers to generate a valid and reliable discomfort score [18, 19]. IRT makes use of a mathematical model that represents the relationship between the probability of an individual marking an alternative response (pain intensity, for example) of an item (body region), and the behavior of the latent trait (musculoskeletal discomfort). of individuals (workers) [20–22]. Thus, conclusions do not depend on the test as a whole or on the entirety of the research instrument used, but on each item that composes it, enabling a statistical analysis focused on the item [23].
It is worth noting that few studies are focusing on the health of workers in the interior regions of Northeast Brazil [12, 25]. This is the first study with a sample of workers from the Inner States of Alagoas and Bahia that seeks to construct a scale of musculoskeletal discomfort based on symptoms self-reported by workers in the upper body region. Given the above, the article aims to evaluate the perception of musculoskeletal discomfort through the construction of a scale to assess musculoskeletal discomfort in the upper limb with workers in the industry, commerce, health, and education sectors of cities in the hinterland of Alagoas and Bahia, leveraging IRT to improve response quality.
Materials and methods
The steps for this research were: (i) Definition of population and sample; (ii) Research instrument; and (iii) Statistical analysis of data. This study was approved by the Research Ethics Committee of the Federal University of Alagoas, with CAAE number 35014720.6.0000.5013. The research was conducted over a two-year period in locations where consent was obtained. The researchers split up to collect data from workers in both Alagoas and Bahia, which began in February 2020 and ended in January 2021. After collection, the data was organized, which took approximately 12 months (period from February 2021 to January 2022) to complete and be applied according to the proposed methodology.
Definition of the study population and sample
This research accounts for a sample of data from an Inner Northeastern region, more specifically in the cities of Delmiro Gouveia (State of Alagoas) and Paulo Afonso (State of Bahia). Sampling took place by non-probabilistic means, totaling 420 professionals interviewed from the industry, commerce, health, and education segments (Table 1). The pre-established inclusion criteria for participation in the research were: voluntary worker participation, being at least 18 years old, and having an effective contract with the company, regardless of biological sex. The exclusion criteria applied to workers who did not want to participate in the research during data collection, who were not dismissed due to WMSD or occupational accidents in others works and pregnant women.
Description of professional areas
Description of professional areas
As seen in Table 1, 167 professionals from hospitals, clinics, and health centers were interviewed, including doctors, nurses, nursing technicians, pharmacists, and others. For education, there were 159 responses, including teachers, librarians, technicians, and professionals in the administrative area of 9 municipal schools, 3 state schools, and a university. Trade covered private chain stores in the service sector, totaling 35 respondents. For the industry, 59 workers from the ceramic industries answered the questionnaire.
The data referring to pain symptoms in the upper limbs were collected in loco through a self-administered questionnaire adapted from the Nordic questionnaire [26], from the diagram detailing symptoms in the forearm region [27] and in the hands [28] (Fig. 1).
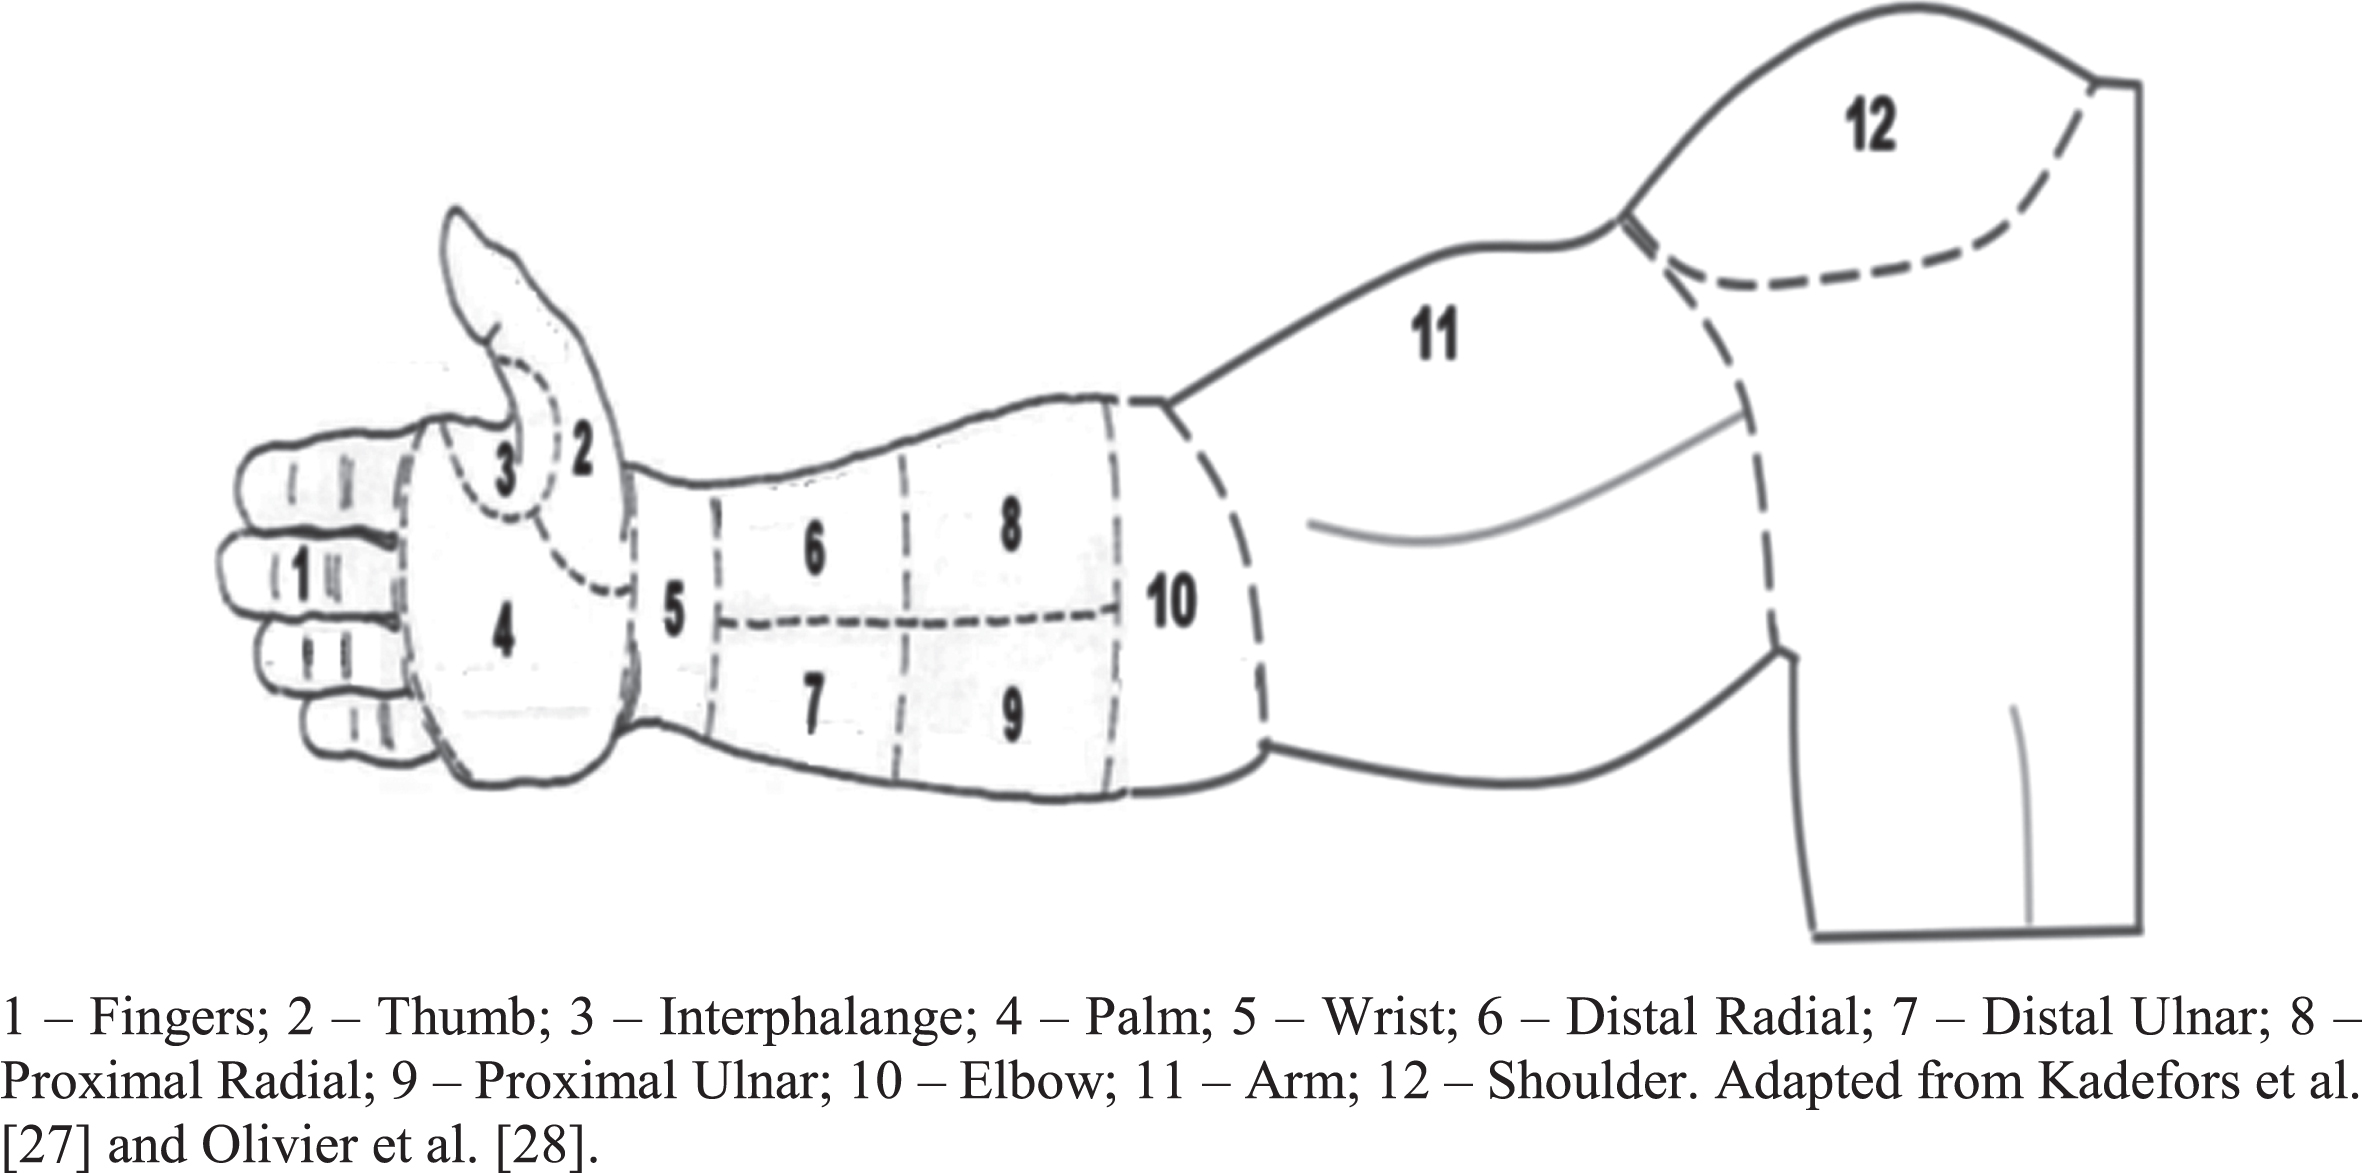
Regions analyzed by the research instrument.
The instrument has a total of twelve items referring to the regions highlighted for the upper limbs. A scale with five response alternatives (1- I never felt pain; 2- I rarely feel pain; 3- Sometimes I feel pain; 4- I often feel pain; 5- I feel pain daily) was used to help determine workers’ perception of pain in each region of the upper limbs. Questions were added about sociodemographic factors such as age, BMI, education, marital status, children, physical activity, and biological sex. The complete instrument is shown in Fig. 1.
The reliability of the instrument was assessed via the McDonald’s Omega test (ω) and the ω values greater than 0.70 indicate reliability [29] Bartlett’s test of sphericity and Kaiser-Meyer-Olkin’s (KMO) test were also applied to analyze the suitability of data for full-information item factor analysis (FA). Bartlett’s test of sphericity the hypothesis that the variables are uncorrelated and KMO is used to compare the partial correlations between pairs of variables without the effects of the others [30, 31]. A p-value lower than 0.05 in Bartlett’s sphericity test and a KMO greater than 0.70 indicate good adequacy of the data to the FA technique.
Parallel analysis was used to determine the number of dimensions to be used in FA. The instrument was considered unidimensional when a factorial load (F) greater than 0.300 and commonality (h2) greater than 0.200 for all parts of the body in a single dimension [19]. Items with F less than 0.300 or h2 less than 0.200 were considered low-quality items [31].
Equation 1 presents the TRI gradual response model (GMR) [32] which was used to estimate the discrimination parameters (ai) and difficulty (bi) of the items and the latent trait of musculoskeletal discomfort in the upper limbs (⊖j) of workers. These parameters were estimated with a mean of 0.00 and a standard deviation of 1.00 [20].
The parameter ai expresses the capacity of an item i to discriminate individuals with different levels of the latent trait θ (musculoskeletal discomfort in the upper limbs of workers); and the bik parameter represents the position on the scale of the latent trait θ in which category k of item i has the highest probability [33]. Items with ai greater than 0.70 are adequate [20, 34] and bik ∈ [–3.3] [35], as they indicate good quality [36]. The θj expresses musculoskeletal discomfort in the upper limbs experienced by worker j.
Based on the IRT parameters, the aim was to construct a musculoskeletal discomfort scale for the upper limbs based on the process of anchoring the response alternatives for each item. Initially, Z-anchor levels spaced by 0.55 θ discomfort units were created in the range of –3 to 3. Then, based on the IRT parameters, the cumulative probability was calculated at each Z anchor level. It was considered that a response alternative k of item i was anchored at a given Z anchor level when its cumulative probability was greater than 50%at this level [37].
Among the benefits of IRT, there is the amount of information provided for each item in different regions of the latent traits scale [38]. The instrument’s information curve indicates the region of the scale with greater accuracy, it ensures that the subset of selected items provides adequate precision throughout the continuum of the latent trait scale [36, 39]. Equation 2 presents the calculation to evaluate the information function of item i for the latent trait θ (Ii(θ)).
The sum of the information of each item i generates the instrument’s information curve, where P’ix (θ) is the first derivative of the response curve of the category evaluated at a given latent trait level. Thus, the greater the discrimination of an item, the greater the information it provides to the measurement instrument [38].
Descriptive analysis
The sample has the response of 420 individuals to the research instrument applied in the sectors of industry, commerce, health, and education, in the cities of Delmiro Gouveia in the state of Alagoas and Paulo Afonso in Bahia, a region known for being part of the Brazilian hinterland.
Sociodemographic data are shown in Table 2. The sample, for the most part, is made up of female individuals (72.38%), married (52.38%), with children (69.05%), aged between 18 and 44 years (72.14 %), normal weight (51.67%), completed high school (34.05%) and who perform physical activities (52.14%).
Sociodemographic data
Sociodemographic data
As for the frequency of pain, most workers reported never feeling symptoms in the upper limbs, but when workers reported pain, the main regions with severe and maximum symptoms were concentrated in the right fingers, right thumb, right and left wrists, left proximal ulnar, left arm and right and left shoulders (Fig. 2).
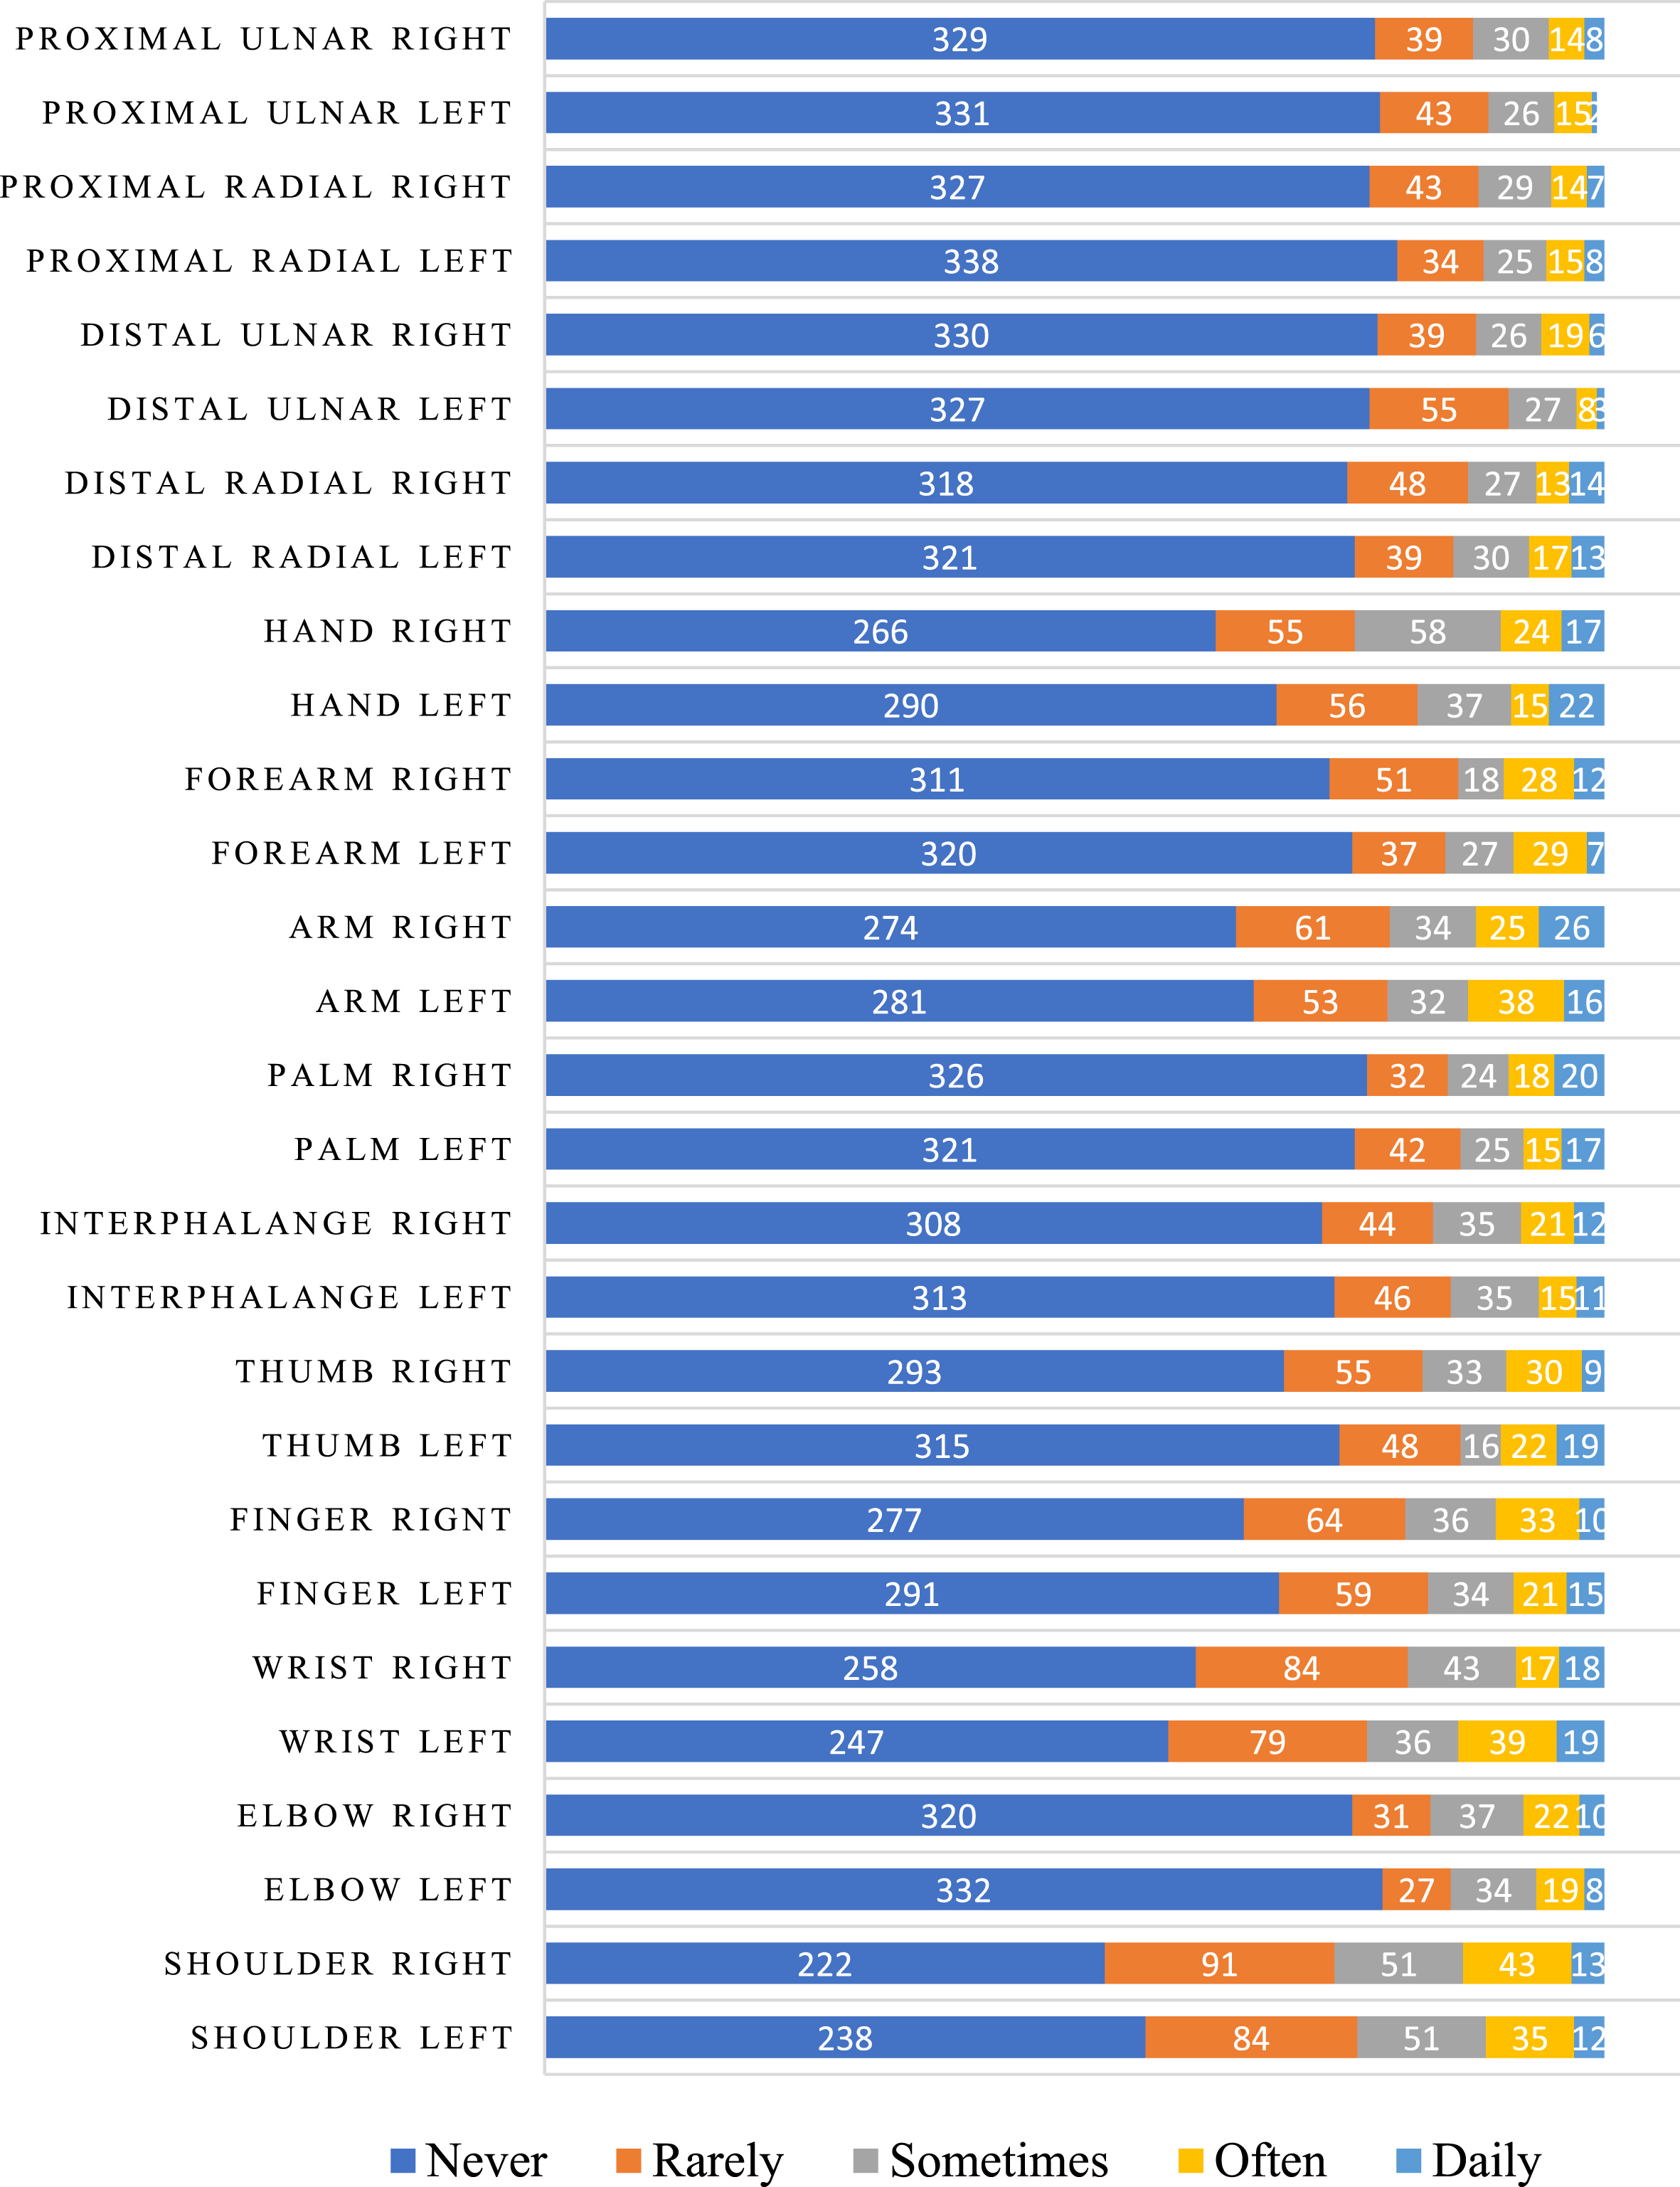
Frequency of pain perception in the affected regions.
The ωt value was equal to 0.96, indicating the presence of reliability in the data collected by the research instrument. In the same way, Bartlett’s test of sphericity and KMO presented p-values equal to 2.2×10⁻¹⁶ and 0.89, respectively, allowing the use of FA The parallel analysis graph (Fig. 3), when analyzing the explanatory variance of the set of factors of the items evaluated in the research instrument, suggests unidimensionality of the latent trait of musculoskeletal discomfort in the upper limbs, given that a single dimension stands out with a high eigenvalue.

Parallel analysis scree plots.
Therefore, the FA method considered the presence of a dimension to estimate the values of F and h2 (Table 3). All regions of the upper limbs showed F > 0.300 and h2 > 0.200, reinforcing that musculoskeletal discomfort in the upper limbs is a latent unidimensional trait. Symptoms in the forearm region had an average F of 0.939, indicating that detailing the symptoms in this region of the body increases the correspondence between the symptoms of pain in the forearm and the perception of discomfort in the workers’ upper limbs. Similar results occurred for the hands, in which the detailing of their anatomical regions resulted in F values greater than 0.800.
Factorial load, commonality, and TRI parameters in the analyzed body regions
F –Factor loading; h2 –Commonality; ai –Discrimination values; b2, b3, b4, b5 –Difficulty parameter of each alternative answer.
Commonality values were also higher in regions of the upper limbs with greater anatomical detail. In addition, Table 3 presents the discrimination (ai) and difficulty (bik) parameters. All body regions demonstrate a high ability to discriminate individuals with different levels of musculoskeletal discomfort in the upper limbs. It was also evident that workers needed to have an above-average level of discomfort to start reporting symptoms. But, in general, all regions had a high value of the difficulty parameter, indicating that the symptoms in these regions are not commonly experienced by most workers in the sample. These results are in line with the results shown in Table 4.
Upper Body region discomfort scale
RA: Rarely, ST: Sometimes, OF: Often, ED: Everyday.
Thus, the rare symptoms in the right shoulder region will start to be reported when workers are discomfort level equal to 0.156, estimating the parameters with a mean of 0.00 and standard deviation of 1.00, the value was above the average. In most regions of the upper limbs, the items had a standard deviation above the mean (bik≥1.000) to report that response alternative ‘sometimes have symptoms of musculoskeletal pain’, and the standard deviation was 1.5 times and 2.0 times above the mean to report ‘frequent’ and ‘daily’ symptoms, respectively.
Figure 4 shows the instrument information curve. A low amount of information was evidenced in the region of the scale close to one standard deviation below the mean. On the other hand, the error for this same region was also low, indicating that the instrument generates little information for workers with a level of discomfort slightly below average. The greatest amount of information was grouped in the region of the scale close to 2 standard deviations below the mean; and in the region between the mean and up to 2 standard deviations above the mean. Thus, there are indications that the instrument measures the latent trait of workers with very low levels of discomfort, or medium discomfort, or above average discomfort.

Instrument information and standard error curves.
The accumulated probabilities became greater than 50%for the answer alternative, ‘I rarely have symptoms’, from 0.55 units of musculoskeletal discomfort in the upper limbs (⊖). Therefore, the first level of the scale, called minimal discomfort in the upper limbs, started at 0.55 units of ⊖ with mild symptoms in the wrists and shoulders. In general, the musculoskeletal discomfort scale for the upper limbs (Table 3) presented six levels, which were classified as minimal discomfort (⊖= 0.55), mild (⊖= 0.10), moderate (⊖= 1.65), high (⊖= 2.20), severe (⊖= 2.75) and maximum (⊖= 3.30).
Because it is a cumulative IRT model, at the last level of the scale (maximum discomfort) workers tend to respond that they experience daily symptoms in all regions of the upper limbs, with the shoulders being the last region with this frequency of symptoms. Still, in Table 3, it is possible to analyze the response pattern of each level of the scale of musculoskeletal discomfort in the upper limbs, in which the regions with painful symptoms of each level of the scale and the frequency in which these symptoms affect the workers are expressed.
According to Fig. 5, it was possible to observe that each region of the upper limbs anchors at different points as the level of pain increases and this presents the evolution of WMSD symptoms.

Evolution of upper limb musculoskeletal discomfort for each scale level.
The construction of musculoskeletal discomfort scales based on the IRT assumptions has demonstrated satisfactory psychometric properties [34], resulting in results with less bias, given that the findings are based on the analysis of response patterns contributed by an individual to a set of items and not the sum of the responses of these same items [40]. To understand the relevance of response patterns defined based on IRT parameters, researchers have devised Computerized Adaptive Testing (CAT). Wherein, a computer selects a few items contained in a bank of items already calibrated by the IRT procedures to be applied, and an individual doesn’t need to respond to all items so that their discomfort score is caused by pain, can be determined. example [42]. Other researchers have put to the test the response patterns generated by the IRT, starting to compare the response patterns of workers who are at the same level of the discomfort scale, but who have different ages, BMI, and length of service [24]. As a result, more than 95%of the analyzed response patterns, at all levels of the scale, showed no significant difference.
In this study, six different response patterns were captured (Table 4), generating the six levels of discomfort on the scale that ranged from minimal musculoskeletal discomfort to maximum musculoskeletal discomfort in the upper limbs. This research seeks response patterns for musculoskeletal symptoms in a sample of workers from the interior of the States of Alagoas and Bahia, who are part of a population with occupational characteristics that are little known, but with serious social characteristics such as low pay, long working hours, adverse weather conditions, illiteracy and improvised work tools [12].
The first response pattern of the scale of musculoskeletal discomfort in the upper limbs, called the region of minimal discomfort (
The next level of the scale was called mild discomfort (
In the region of the scale called moderate discomfort (
In the region of the high discomfort scale (
The next region of the scale, called severe discomfort in the upper limbs (
The finding relates to notifications of work accidents in the period from 2012 to 2022 in the municipalities examined in the study. In Delmiro Gouveia, the most frequently affected body parts include fingers (25.6%), hand (except wrist or fingers –5.79%), arm (between wrist and shoulder –4.96%) and shoulder (4.13%), with emphasis on the hospital care sector. The most reported occupations were retail salespeople and nursing technicians, both representing 4.17%[11]. In the municipality of Paulo Afonso, the areas predominantly affected were the fingers (23.2%), hand (except wrist or fingers –5%), forearm (between wrist and elbow –4.24%) and shoulder (3.9%). Nursing technicians led the notifications in occupations, with a rate of 11.2%, while the retail trade of general merchandise, with a focus on food products (6.05%), was the most reported economic sector [13]. These results are aligned with the body regions identified in the discomfort scale in the upper body region (Table 4), showing significant levels of discomfort, ranging from high to maximum.
At the last level of the scale, called maximum discomfort in the upper limbs (
Accordingly, the study by Miranda et al. [61] indicated that the self-report of nonspecific pain in the shoulder was related to burnout, depression, and inability to express feelings. Wixted et al. [62] related the increased incidence of musculoskeletal disorders in the industrial sector to the increased cognitive demand imposed by the automation of manufacturing processes, verifying that increased distress among employees contributes to a higher incidence of self-reported symptoms in the shoulder and lower back. When it comes to studies in the countryside, Silva et al. [24] already pointed out that shoulder symptoms were associated with long exposure to biomechanical factors related to poor posture of the upper limbs and use of vibrating hand tools, in addition to psychosocial stressors such as low control and job satisfaction, in addition to high job insecurity, work and work-family conflict.
Studies by Silva et al. [36] indicated that daily elbow symptoms tend to occur at the highest level, something not observed in this study. Already Silva et al. [24] found that symptoms in the right hand were the only ones located in the upper limbs to be at the highest level of the musculoskeletal discomfort scale. On the other hand, different results were expected, as Brazil has continental proportions, exposing workers from similar professions to totally different working conditions. On the other hand, Bispo et al. [12], when studying WMSDs in this region of the backlands of Alagoas and Bahia, it was be observed that the region has a high degree of informality at work, high labor turnover, and intense competition for unstable jobs, something that can contribute to that workers hide their musculoskeletal symptoms and that they get worse or become more and more frequent. Furthermore, in Brazil it is estimated that diseases and accidents at work produce losses of approximately R$300 billion, in addition to immeasurable costs to the individual and family [63].
Conclusion
In this study, a six-level scale was developed to measure musculoskeletal discomfort caused by work-related musculoskeletal disorders among workers in the interior of the states of Alagoas and Bahia in Brazil. The scale’s psychometric properties were satisfactory, indicating validity for the musculoskeletal discomfort metric.
The use of diagrams of the human body to signal WMSD symptoms is a common practice for understanding WMSDs in the workers studied. Therefore, this study aimed to contribute to expanding the possibilities of using these reported symptoms to create a score that reflects the level of musculoskeletal discomfort experienced by workers.
The scale levels were constructed based on the workers’ response pattern, obtained by the anchoring procedure performed from the estimation of the IRT parameters. As they present a cumulative behavior, the response patterns seem to express the progressive process in which the symptoms affect the parts that form the workers’ upper limbs. It was evidenced that the symptoms begin to occur rarely in the shoulders and wrists (left and right). At the maximum level of discomfort, they affect all regions of the upper limbs, with symptoms in the shoulders (left and right) of the daily type, the last to manifest.
Therefore, the use of scales like this one enables research and monitoring of symptom perception through worker self-report. This aids in identifying workplace improvements, reducing medical costs, and minimizing sick leave. Additionally, it contributes to the organization’s profitability, enhances employee performance, and allows early treatment of symptoms, preventing serious complications.
When analyzing the perception of pain in the upper limbs of workers from the interior of Alagoas and Bahia in a global way, there is the benefit of viewing the professional profile according to regional characteristics, highlighting the particularities of the sample. For this study, there were some limitations: Self-reporting involves personal perception, making it a subjective evaluation; therefore, other types of tests should be explored to increase the reliability of the research. Additionally, due to sample characterization, the results may not extrapolate to other regions or professions.
On the other hand, this study has limitations that can be overcome by future studies. Thus, studies carried out a posteriori can make use of IRT parameter equalization methods to generate separate scales based on different characteristics of the sample, such as gender, professional group, and level of experience, among others. Other studies may analyze the differentiated functioning of items (DFI) by verifying whether individual characteristics of the respondents may compromise the estimation process of the IRT parameters and, consequently, the construction of the musculoskeletal discomfort scale for the upper limbs.
Ethical approval
This study was approved by the Research Ethics Committee of the Federal University of Alagoas (protocol number CAAE 31022420.3.0000.5013).
Informed consent
Informed consent was obtained from all respondents.
Conflict of interest
The authors declare that they have no conflict of interest.
Footnotes
Acknowledgments
None to report.
Funding
None to report.