
Abstract
BACKGROUND:
Occupational foot-transmitted vibration (FTV) exposure is common in industries like mining, construction, and agriculture, often leading to acute and chronic injuries. Vibration assessments require technical expertise and equipment which can be costly for employers to perform. Alternatively, researchers have observed that self-reported discomfort can be used as an effective indicator of injury risk.
OBJECTIVE:
This study aimed to investigate the effect of standing FTV exposure on self-reported ratings of discomfort, and whether these subjective ratings differed by body area and exposure frequency.
METHODS:
Participants (n = 30) were randomly exposed to standing FTV at six frequencies (25, 30, 35, 40, 45, and 50 Hz) for 20–45 seconds. Following each exposure, participants rated discomfort on a scale of 0–9 in four body areas: head and neck (HN), upper body (UB), lower body (LB), and total body.
RESULTS:
Results indicated that participants experienced the most discomfort in the LB at higher frequencies (p < 0.001), consistent with the resonance of foot structures. The HN discomfort tended to decrease as the exposure frequency increased, although not statistically significant (p > 0.0167). The UB discomfort remained relatively low across all frequencies.
CONCLUSIONS:
The study suggests a potential connection between resonant frequencies and discomfort, potentially indicating injury risk. Although self-reported discomfort is insufficient for directly assessing injury risk from FTV, it provides a simple method for monitoring potential musculoskeletal risks related to vibration exposure at resonant frequencies. While professional vibration assessment remains necessary, self-reported discomfort may act as an early indicated of vibration-induced injuries, aiding in implementing mitigation strategies.
Abbreviations
BS British Standard
FTV foot-transmitted vibration
HAVS hand-arm vibration syndrome
HN head and neck
HTV hand-transmitted vibration
IQR interquartile range
ISO International Organization of Standardization
LB lower body
TB total body
UB upper body
VIWFt vibration-induced white-foot
WBV whole-body vibration
Introduction
Occupational exposure to vibration can be difficult to characterize, especially when the worker is exposed to vibration at multiple anatomical locations. The most common example of this scenario is a seated operator of heavy equipment. The operator is exposed to whole-body vibration (WBV) through the seat surface, hand-transmitted vibration (HTV) from contact with the vibrating steering wheel or joystick, and foot-transmitted vibration (FTV) from contact with the vibrating pedals and machine. Occupational exposure to FTV has been reported in many occupations where the equipment transmits vibration from the operating platform to the feet of the operator, including mining, construction, and agriculture [1–5]. Unfortunately, exposure to standing FTV has yet to be categorized separately in WBV statistics, but it has been estimated that 29 million workers experience WBV exposure, and 1.2 million workers may experience WBV at potentially harmful levels in the United States [6]. Additionally, in a survey of 4500 Australian workers, 513 reported exposure to WBV and 228 experienced both WBV and hand-transmitted vibration [7].
An additional challenge to classifying FTV exposure results from researchers finding that workers with hand-arm vibration syndrome (HAVS) can have corresponding neurological and vascular symptoms in the feet, despite only being exposed to HTV [8]. A centrally mediated sympathetic response that causes repeated vasoconstriction leading to hypertrophy of the muscular medial layer and reducing blood flow to the extremities has been suggested [4, 8–10]. Vibration exposure to the feet may result in vibration-induced white-foot (VIWFt), a condition that is similar to vibration-induced white finger [11]. VIWFt or Raynaud’s phenomenon of the feet, has been examined mostly in conjunction with HAVS [10, 12–14].
The symptoms of prolonged FTV exposure are similar to those of HTV exposure, where they can occur in the neurological, vascular or osteoarticular, and muscular systems (4). The neurological or sensorineural symptoms in the feet can include numbness and tingling in the toes, reduced sense of touch and temperature, pain in the feet, and nerves and sensory receptors in the toes can become damaged or compressed caused digital neuropathies or compression neuropathies (e.g., carpal tunnel syndrome) [11]. Vascular symptoms can include blood vessel damage, increasing loss of circulation, and toe blanching [15]. The muscular, or osteoarticular symptoms can include muscular fatigue, contractures, bone or joint damage, and tendonitis. Occupational vibration exposure can also result in fatigue, acute or chronic injuries, and interfere with worker productivity [16–18].
To understand the biodynamic response of the body to vibration exposure, an understanding of the resonance behaviour of the structures is critical. When humans are exposed to vibration, the point at which the vibration transmissibility is the highest is known as the resonant frequency, leading to the greatest displacement in both the bodily organs and skeletal structures [19, 20]. This places excess stress on the exposed body tissues, thereby increasing the likelihood of injury [21–23]. Understanding human resonance presents challenges due to the difficulty of stimulating the natural frequency of an isolated organ without triggering resonances throughout the entire body [24]. Each specific area of the body possesses its individual resonant frequency range, implying that various body parts are vulnerable to vibration exposure at distinctly different frequencies. The resonant frequencies linked to direct exposure from seated WBV, HTV, and standing FTV have been summarized in Table 1. Vulnerability to lower frequencies has been observed in the pelvis and lumbar spine, whereas the hand and foot are sensitive to a broader range of higher frequencies.
Previously identified resonant frequencies (Hz) by body area
Previously identified resonant frequencies (Hz) by body area
Occupational vibration exposure is frequently measured using accelerometers and data loggers as root-mean-squared (r.m.s.) acceleration with appropriate weighting factors as described in ISO 2631-1 [32–34]. The measurement equipment for evaluating occupational WBV exposure can be quite expensive (e.g., ranging from $4,000 to $50,000), it needs regular calibration, and is often complex to operate which requires expertise to use. The combination of these factors is often a barrier to routine collection of occupational vibration exposure in workplaces [35]. This generally results in workplaces recruiting third-party expertise to evaluate worker vibration exposure. Having a method of determining, or screening, for an occupational vibration exposure problem prior to investing in measurement methods could be beneficial.
Self-reported discomfort is an inexpensive metric for predicting vibration-related injury risk [36–38]. Previous studies have shown a positive correlation between increased acceleration and reported discomfort levels while seated [37]. Increased accelerations have also resulted in higher discomfort levels when exposed to WBV while standing with and without additional support (i.e., hand railing) [38]. Discomfort levels are also higher when participants are exposed to six-axis vibration than to three-axis and single-axis vibration [39]. Multiple rating scales have been used to investigate the discomfort caused by exposure to WBV (Table 2). For example, a scale range of+3 (second much more uncomfortable than first) to –3 (second much more comfortable than first) was used to determine the effect of phase on discomfort [40]. Continuous scales for self-reported discomfort have also been used, where “0” is considered “no discomfort,” and “9” reflects “maximum discomfort” [41]. This 9-point scale modeled by Dickey and colleagues has been increasingly observed in recent vibration research focusing on self-reported discomfort [42, 43].
Self-reported discomfort scales reported in the literature for use during vibration exposure research
As far as the inclusion of discomfort within the standards for occupational vibration evaluation, ISO 2631-1 [49] briefly describes the expected discomfort from workers at varying vibration exposure levels. However, previous work has observed that these standards may overestimate discomfort in mining, forestry, and construction when applied in field studies [49, 50]. The British Standards (BS) Institute 6841 predicts likely discomfort levels to various vibration magnitudes where; “0” reflects magnitudes of up to 0.315 m/s2 r.m.s., “3” from 0.8 to 1.6 m/s2 r.m.s., and “5” from 2.0 m/s2 r.m.s. and greater (Table 2) [46]. This relies on quantifying the exposure to determine likely discomfort of the worker.
Evaluating self-reported discomfort may be an effective low-cost control by acting as a subjective indicator of exposure to hazardous vibration levels. As it stands, there is no specific standard for evaluating FTV exposure separately from WBV, and this includes methods of determining FTV exposure related discomfort. Discomfort ratings may provide insight to employers on how workers experience FTV, which may impact their health, safety, and productivity [4, 51]. This research investigated the effect of standing FTV exposure on self-reported ratings of discomfort, and whether these subjective ratings differed by body area and exposure frequency.
The experiment methodology was approved by the Research Ethics Board of Laurentian University (Sudbury, Canada).
Participants
Thirty male participants with an average (±standard deviation) age of 28 (±9.5) years, height of 180.6 (±8.7) cm, and mass of 85.65 (±12.4) were voluntarily recruited as sample of convenience on Laurentian University campus [52]. Given the possible symptoms and effects of vibration exposure, the exclusion criteria included voluntary declaration of any injuries of the musculoskeletal, vasculopathy, neuropathy systems or motion sickness, diabetes, or head injury within the last six months. Participants were asked to fill out a consent form where they could note if they had previously been exposed to vibration (n = 14), and a pre-discomfort questionnaire using a body map (n = 5 with minimal discomfort prior to experimental protocol).
Vibration exposure conditions
Using a Power Plate (Power Plate North American, Inc. Irvine, CA, USA) participants were exposed to six different frequencies of vibration: 25, 30, 35, 40, 45 and 50 Hz. The vibration frequencies used in this study reflect FTV levels that miners are exposed to when drilling on platforms and raises [1]. The running r.m.s. un-weighted average acceleration values, dominant frequencies, and coherences were confirmed for each of the 6 frequencies prior to the beginning of the trials [52].
Vibration exposure was divided into three trial sections; pre-trial, mid-trial, and post-trial (Fig. 1). The pre- and post-trials exposed participants to vibration for 20 seconds, and the mid-trial allowed a 45-second exposure time. The vibration periods were repeated 6 times in each trial (i.e., once per frequency), and participants received a ten-second break between each exposure to self-report their discomfort [41]. Previous research deemed this exposure time appropriate for evaluating discomfort associated with vertical profiles [41]. Participants were exposed to vibration frequencies in a random order to reduce range effects, similar to the procedure used by Thuong and Griffin [38].
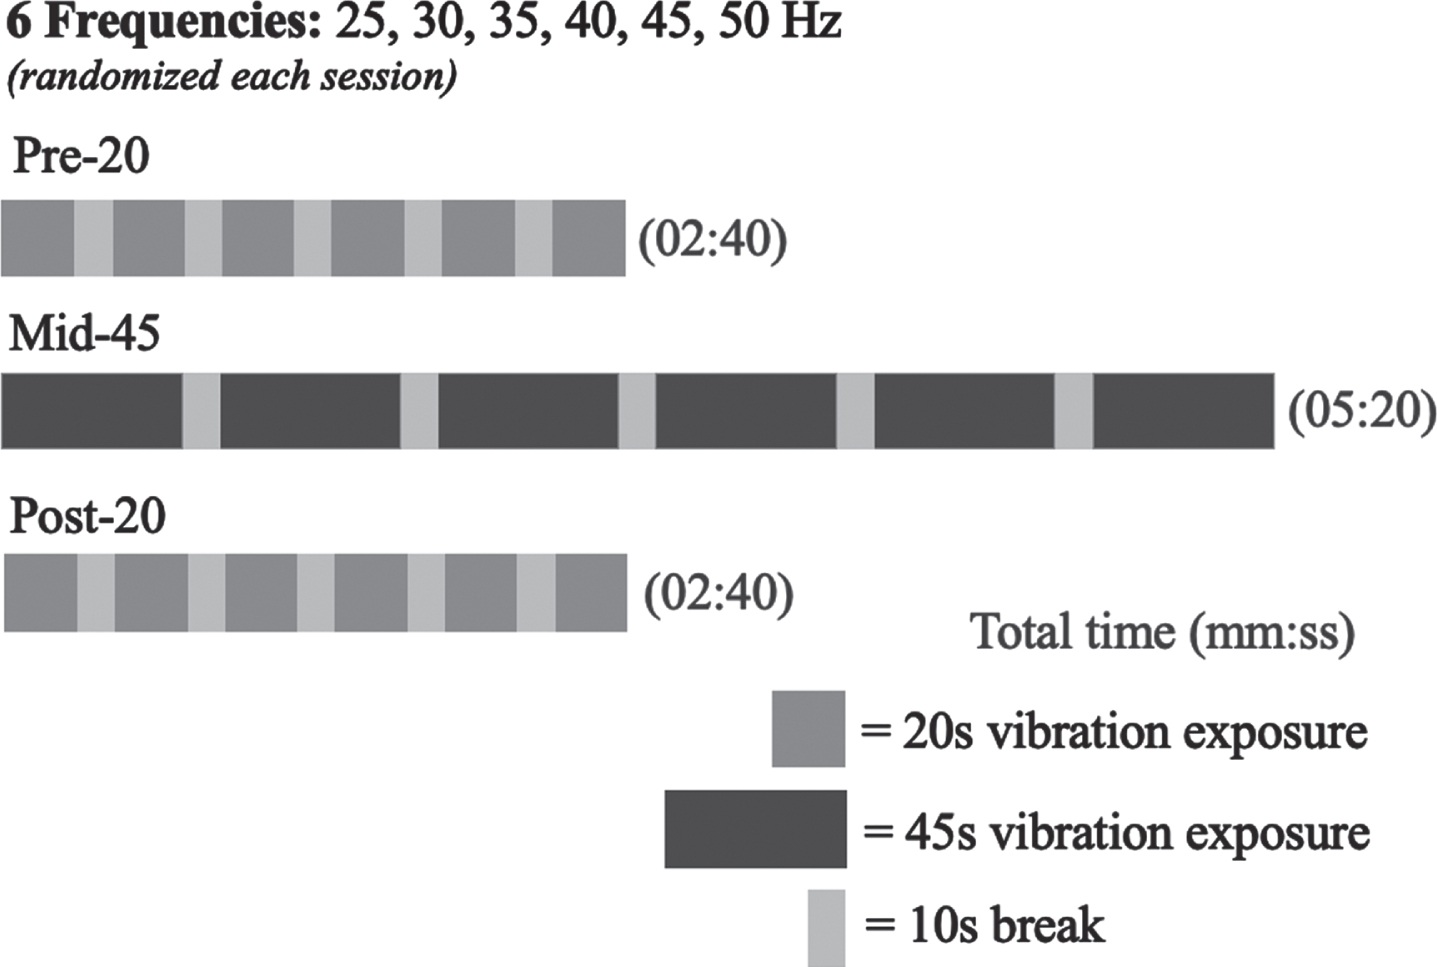
The timeline of one experimental trial. Each exposure period was divided into 6 vibration blocks, during which participants were exposed to vibration for 20 seconds (pre- and post-20) or 45 seconds (mid-45). Vibration blocks were separated by 10-second no-vibration break periods. After completing the trial, the participants were allowed to stand and stretch before beginning the next trial. This timeline was repeated for the vibration frequencies 25, 30, 35, 40, 45, and 50 Hz. The order in which participants were exposed to each frequency was randomized, and the participant was unaware of the vibration condition.
The participants were asked to stand in a neutral posture, with their head, trunk and feet in line and their shoulders relaxed with their arms by their sides. They were instructed to stand with their knees flexed at approximately 10° and their feet flat on the platform aligned with two marked positions. Handles were located above the platform to help the participants maintain balance, if necessary. A 2-minute break between the trial sections allowed the participants to leave the platform and walk around. Moving off the platform was especially important if the participant began feeling fatigued or numbness and tingling due to the vibration exposure [50]. Breaks were necessary to avoid participants experiencing compounded discomfort as exposure duration increases, as described in Hancock and Warm’s Maximum Adaptation Model [50]. The pre- and post-trials were conducted to observe if participant discomfort changed significantly from the beginning to the end of each trial, influencing the results.
Participants were asked to rate their discomfort during the 10-second break after each vibration exposure. Collecting data within this short period minimized the reliance of the participant on their memory to accurately rate their discomfort. As the participants only had 10 seconds to note their discomfort rating, a reduced musculoskeletal discomfort questionnaire was designed to use during the experiment (Fig. 2). The questionnaire included a body map highlighting four body regions: the total body (TB), the head and the neck (HN), the upper body (UB), and the lower body (LB). The scale ranged from 0 to 9, with “0” representing discomfort tolerable for a standard 8-hour workday [41, 53]. The discomfort rating “9” corresponds with discomfort the participant could only tolerate for the trial duration, and they could not endure another exposure at this vibration level [41]. The body map included in the questionnaire was also posted at eye level on the wall in front of the participant. The posted body map served a dual purpose of keeping the head of the participant neutral throughout the trial and reminding the participant of the areas they would be assessing.

Body map with discomfort prompts for the four body areas: total body (TB), head and neck (HN), upper body (UB), and lower body (LB).
The median discomfort ratings for the six pre-, mid-, and post-trial exposure sessions were determined for each body region (i.e., TB, HN, UB, and LB) and vibration frequency (i.e., 25, 30, 35, 40, 45, and 50 Hz). In the case of a platform malfunction, the trial section was repeated, and the average discomfort rating of the original and repeated exposure was included in the data analysis. The data followed a repeated measures design, with a non-normal distribution, so Friedman’s ANOVA was conducted to determine whether discomfort ratings differed between the six exposure frequencies within each of the four body areas. Friedman’s ANOVA was also used to determine whether discomfort ratings differed between three body areas (HN, UB, and LB) within each of the six exposure frequencies. The TB segment was excluded from the between body area comparison as perceptions of TB discomfort would be inclusive of perceptions of HN, UB, and LB discomfort. For significant Friedman’s ANOVAs, post hoc comparisons were conducted using Wilcoxin signed-rank tests with a Bonferroni correction. Friedman’s ANOVAs were performed at an alpha of.05, with the adjusted alpha for the Bonferroni correction at.0033 for the between vibration frequencies comparisons, and at.0167 for the between body areas comparisons. A Mann-Whitney U test was conducted to determine if perceptions of vibration-related discomfort differed between participants with and without previous vibration exposure. The Mann-Whitney U test was performed at an alpha of.05. All statistical analyses were carried out using SPSS v.29.0.1.0 (IBM Corp: Armonk, New York).
Results
Pre-, mid-, and post-trial ratings of self-reported discomfort
The median and interquartile ranges (IQR) for each discomfort rating were determined for the six vibration frequencies and the four body areas for each trial session across the 30 participants. Across vibration frequencies, median ranges for ratings of discomfort were similar for the TB (Pre-trial: 4–6; Mid-Trial: 5–6; Post-Trial: 4.9–5.4), the HN (Pre-trial: 4–6; Mid-Trial: 4.5–6; Post-Trial: 4–5.5), and the LB (Pre-trial: 3–6; Mid-Trial: 3–6.5; Post-Trial: 4–5.5) body areas, while for the UB (Pre-trial: 2–3; Mid-Trial: 3–3.8; Post-Trial: 2–3) the median ranges tended to be lower than the other three body areas (Table 3).
Median interquartile range discomfort ratings reported by the 30 participants following the pre-trial (20-sec), the mid-trial (45-sec), and the post-trial (20-sec) exposures at each vibration frequency (25, 30, 35, 40, 45, and 50 Hz), for each body area (TB –Total body; HN –Head & neck; UB –Upper body; and LB –Lower body)
Median interquartile range discomfort ratings reported by the 30 participants following the pre-trial (20-sec), the mid-trial (45-sec), and the post-trial (20-sec) exposures at each vibration frequency (25, 30, 35, 40, 45, and 50 Hz), for each body area (TB –Total body; HN –Head & neck; UB –Upper body; and LB –Lower body)
Overall, discomfort ratings during the pre-, mid-, and post-trial exposures remained relatively constant at all frequencies and for each body area. As there was minimal variation in discomfort between the pre-, mid- and post-trial sections, the mid-trial exposures were considered to be reflective of overall discomfort ratings without underestimating participant discomfort. Therefore, all further analyses were performed using the mid-trial exposure data.
Friedman’s ANOVAs were performed to evaluate whether ratings of discomfort differed by vibration frequency for each of the four body areas. For the TB (χ2(5)=2.60, p = .761), the HN (χ2(5)=6.35, p = .273), and the UB (χ2(5)=4.61, p = .466) self-reported ratings of discomfort were not significantly different across the six vibration frequencies (Fig. 3a-c). For the LB, there were statistically significant differences in the self-reported ratings of discomfort across the six vibration frequencies, χ2(5)=36.57, p < .001 (Fig. 3d). Wilcoxin signed-rank post hoc comparisons with a Bonferroni adjustment indicated that there were statistically significant differences in self-reported discomfort in the LB between the 25 Hz (Mdn = 3, IQR = 2.0–5.0) and 40 Hz (Mdn = 6, IQR = 3.8–7.0) exposures (Z = -3.69, p < .001); the 25 Hz (Mdn = 3, IQR = 2.0–5.0) and 45 Hz (Mdn = 6.5, IQR = 3.8–7.3) exposures (Z = -3.87, p < .001); the 25 Hz (Mdn = 3, IQR = 2.0–5.0) and 50 Hz (Mdn = 5.3, IQR = 3.0–7.1) exposures (Z = -3.31, p = .001); and the 35 Hz (Mdn = 5, IQR = 3.0–6.0) and 45 Hz (Mdn = 6.5, IQR = 3.8–7.3) exposures (Z = -3.15, p = .002). The other comparisons were not statistically significant after the Bonferroni adjustment (p > .0033).

Comparison of self-reported ratings of participant discomfort in the a)TB, b) HN, c) UB, and d) LB body areas, at the 25, 30, 35, 40, 45, and 50 Hz vibration exposures during the 45-second mid-trial sessions. Ratings of discomfort in the LB significantly differed between vibration frequencies, according to Friedman’s ANOVA. An asterisk (*) denotes statistically significant Wilcoxin rank sum post hoc tests at a level of p < .0033.
Friedman’s ANOVAs were performed to evaluate whether ratings of discomfort differed between three body areas (HN, UB, and LB) across each of the six vibration frequencies. There were statistically significant differences in self-reported ratings of discomfort at 25 Hz (χ2(2)=26.34, p < .001), 30 Hz (χ2(2)=16.46, p < .001), 35 Hz (χ2(2)=22.28, p < .001), 40 Hz (χ2(2)=13.82, p = .001), 45 Hz (χ2(2)=25.404, p < .001), and 50 Hz (χ2(2)=11.90, p = .003) between the three body areas (Fig. 4). Wilcoxin signed-rank post hoc comparisons with a Bonferroni adjustment indicated that at 25 Hz there were statistically significant differences in self-reported perceptions of discomfort between the HN (Mdn = 6, IQR = 3.8–8.0) and the UB (Mdn = 3, IQR = 1.0–5.0) (Z = -4.46, p < .001), and the HN (Mdn = 6, IQR = 3.8–8.0) and the LB (Mdn = 3, IQR = 2.0–5.0) (Z = -3.73, p < .001).
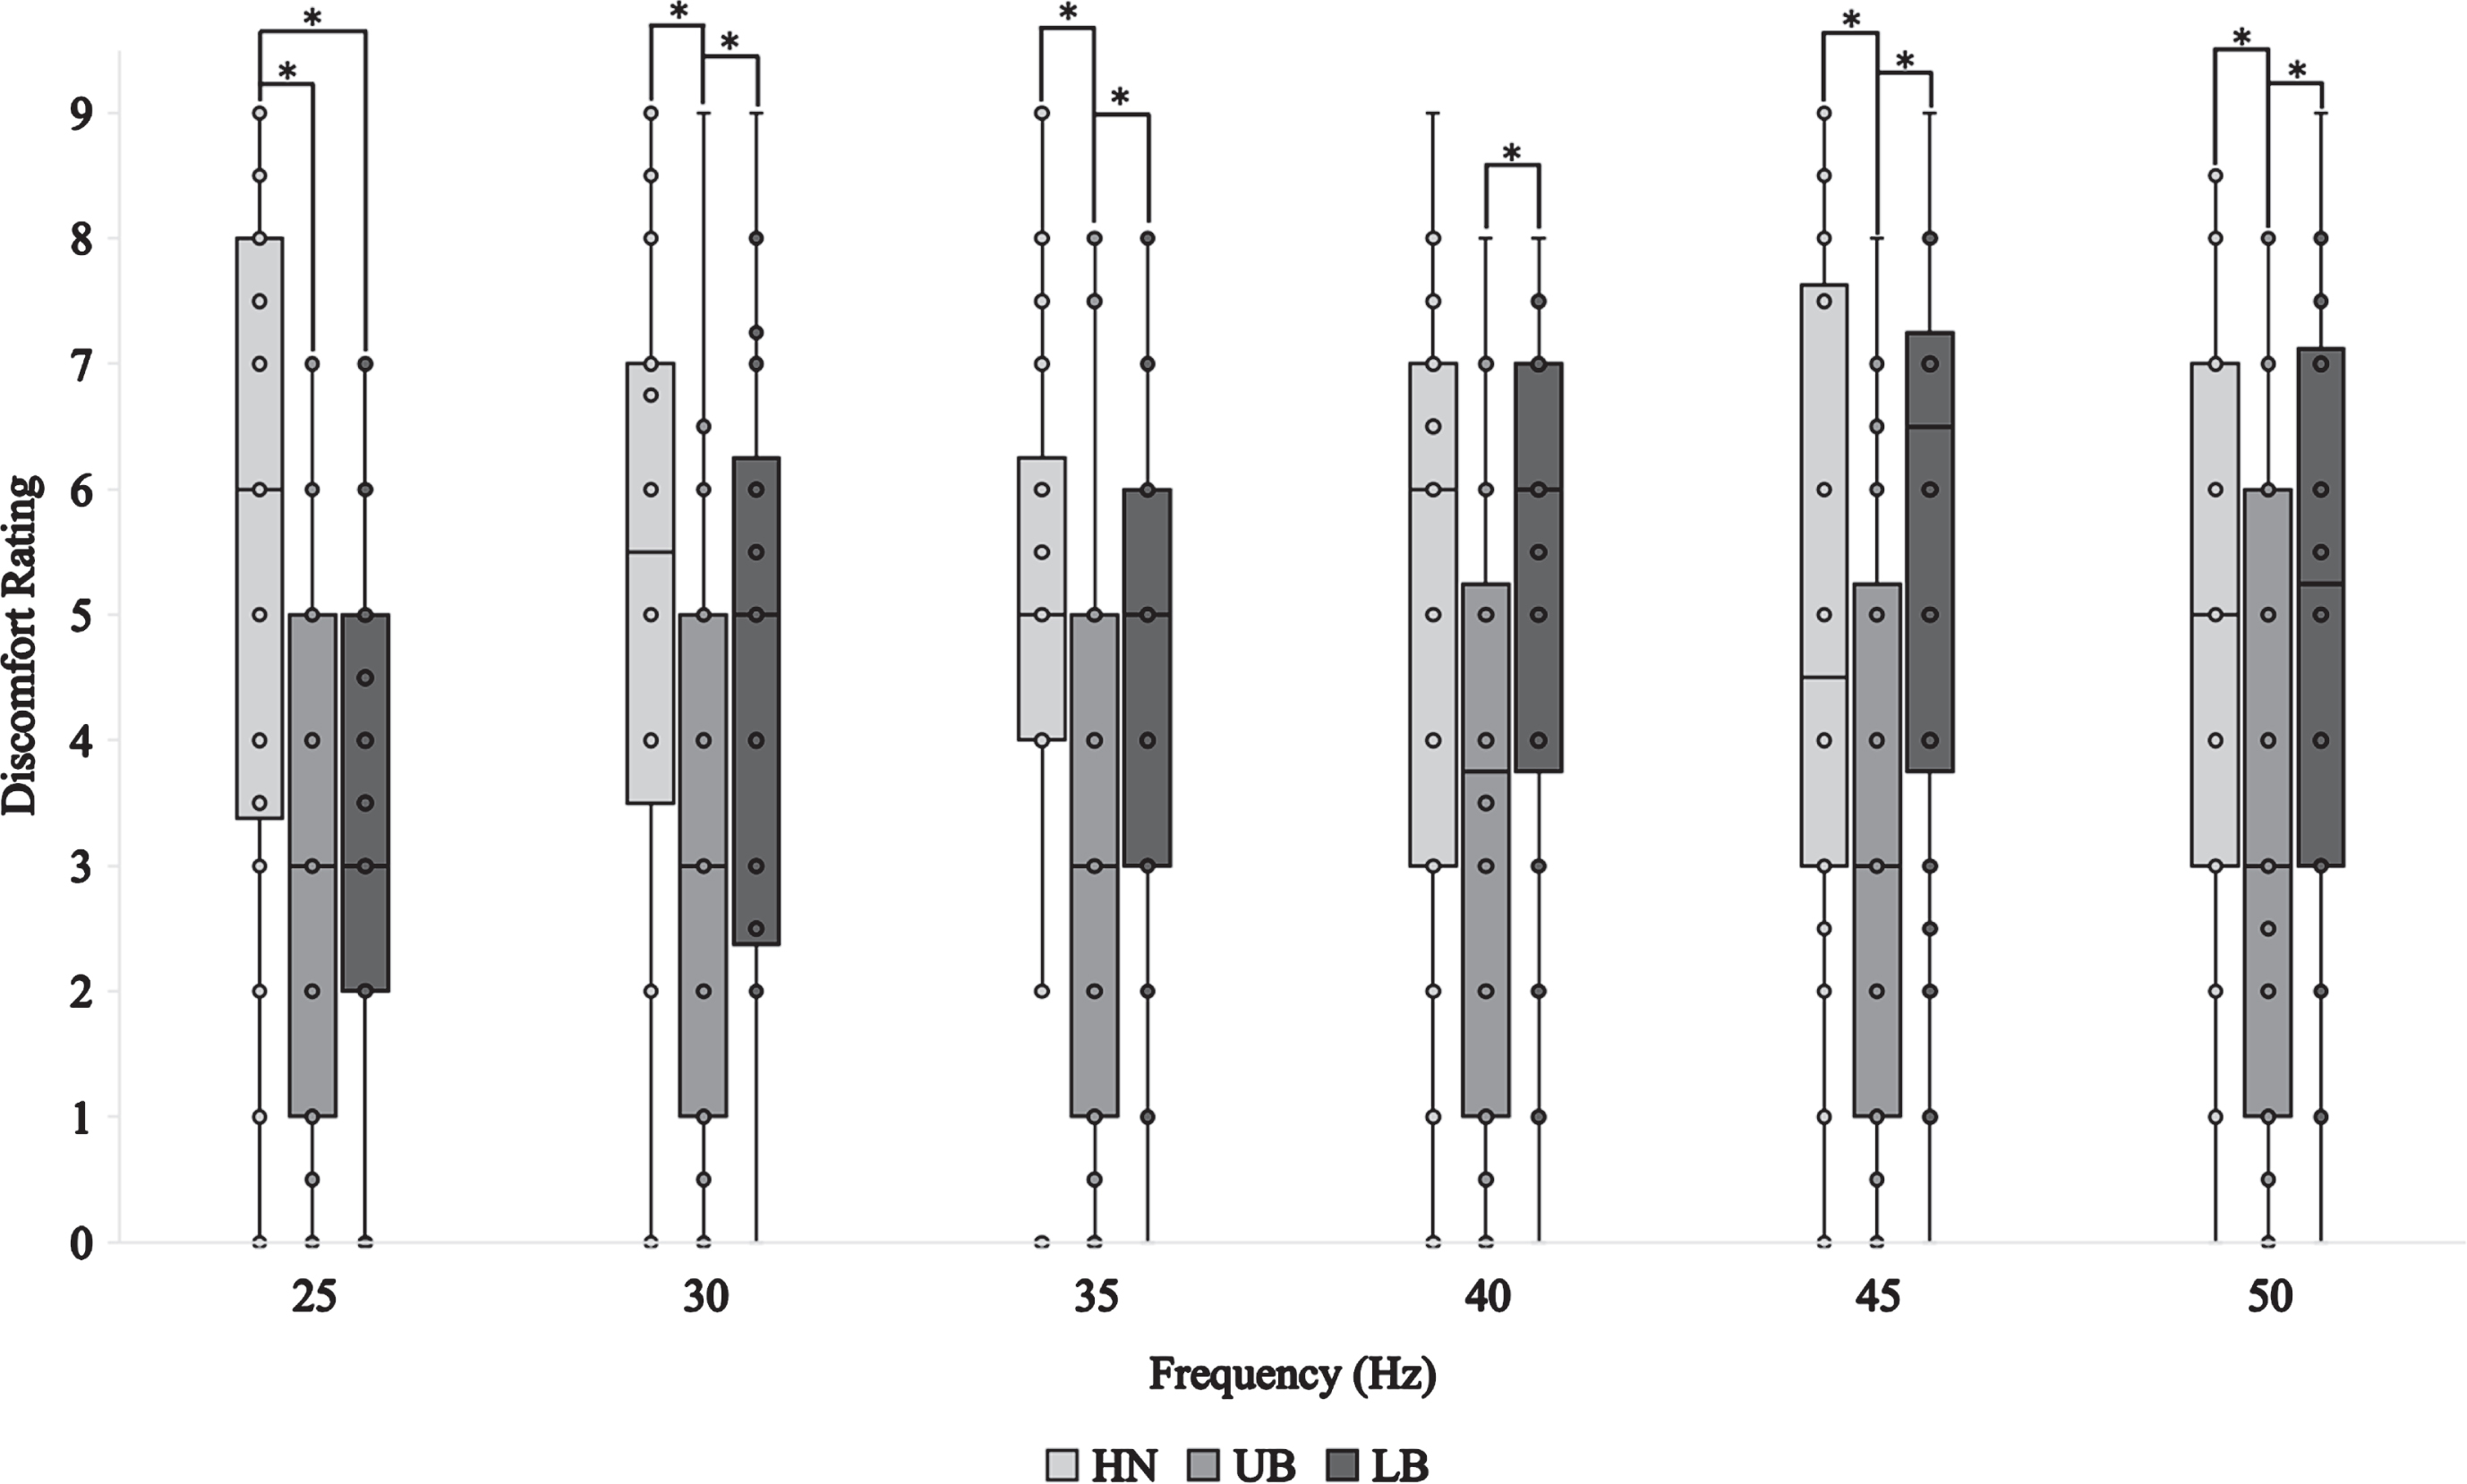
Comparison of self-reported ratings of discomfort between three body areas (HN, UB, and LB) for each vibration frequency (25, 30, 35, 40, 45, and 50 Hz) during the 45-second mid-trial sessions. Ratings of discomfort significantly differed across the three body areas at each vibration frequency, according to Friedman’s ANOVA. For each vibration frequency, an asterisk (*) denotes statistically significant Wilcoxin rank sum post hoc tests at a level of p < .0167.
Self-reported ratings of discomfort were statistically different between the HN and the UB at 30 Hz (Z = -3.64, p < .001), 35 Hz (Z = -3.99, p < .001), 40 Hz (Z = -3.28, p = .001), 45 Hz (Z = -3.48, p < .001), and 50 Hz (Z = -2.55, p = .011), and the UB and the LB at 30 Hz (Z = -3.35, p = .001), 35 Hz (Z = -3.71, p < .001), 40 Hz (Z = -3.58, p < .001), 45 Hz (Z = -4.32, p < .001), and 50 Hz (Z = -3.69, p < .001) (Table 4). The other post hoc comparisons were not statistically significant after the Bonferroni adjustment (p > .0167).
Mann-Whitney U test statistics for the comparisons of self-reported ratings of discomfort between participants who reported previous exposure to vibration, and those with no vibration exposure history, at each vibration frequency (25, 30, 35, 40, 45, and 50 Hz) and for each body area (TB –Total body; HN –Head & neck; UB –Upper body; and LB –Lower body)
Mann-Whitney U tests were performed to evaluate whether self-reported ratings of discomfort differed between participants who reported previous exposure to vibrations and those with no vibration exposure history, for each of the six vibration frequencies in the four body areas. The results indicated that there was no significant difference in self-reported ratings of discomfort between participants who reported previous exposure to vibrations and those with no vibration exposure history for any vibration frequency in any body area (p > .05: Table 4).
This study examined the relationship between standing vibration exposure at frequencies ranging from 25 to 50 Hz in 5 Hz increments, and participant self-reported discomfort to assess if discomfort can be differentiated by body area and exposure frequency. Self-reported discomfort ratings were recorded during 20 and 45-second trials in four areas: HN, UB, LB, and TB. No significant changes were observed between discomfort ratings for the 20-second pre- and post-trial sections. Although there were significant differences in discomfort between the 20- and 45-second trials, the minimal change in trial length does not produce sufficient evidence of a link between FTV and duration of exposure.
Overall, the participants reported significantly more discomfort in the HN and LB than in the UB at all frequencies. The LB discomfort exhibited a positive correlation with increasing frequency, as observed by a significant difference between discomfort ratings at 25 compared to 40, 45, and 50 Hz, respectively, and 35 to 45 Hz. The discomfort response of the participants aligns with previous research demonstrating the resonant frequency of the ankle to range from 16 to 39 Hz [31]. At resonant frequencies there is increased movement amplitudes of the skeletal structures, which can be linked to an increased risk of injury [21, 54]. Accordingly, increased discomfort scores at the resonant frequency of the ankle suggest an association between the resonance of the foot and ankle structure and LB discomfort [31, 55]. Indicating there is the potential self-reported discomfort in the LB may be an indicator of injury risk in the long term [36].
In contrast to LB discomfort, HN discomfort tended to decrease as the frequency increased; however, this was not statistically significant. This study saw the greatest discomfort in the HN at 25 Hz, with a slightly lower peak at 40 Hz. This observation may be linked to the resonant frequencies of the head and the ankle. Previous research observed that the resonant frequency of the head ranges from 20–40 Hz [25]. The eyeball vibration model designed by Shih and Guo also depicted the second mode of vibration in the eye to naturally resonate between 35–51 Hz [26]. Thus, peaks in participant discomfort at 40 Hz may be associated with a shift in the liquid displacement pattern of the eyeballs [26]. Additionally, with the resonant frequency of the ankles ranges from 16–39 Hz, transmissibility was potentially amplified from the LB to the HN at these frequencies, causing the participant to report additional HN discomfort [31, 56]. Similar results were found by Nawayseh, who observed reduced vibration transmission to the head as the frequency increased in individuals exposed to FTV [56]. Contrary to the current study, Sonza and colleagues observed that participant head discomfort increased as the vibration frequency increased [57]. The authors attributed this finding to vibration attenuation by the LB, as demonstrated by a substantially higher vibration magnitude in the lower legs than the head [57]. However, Sonza and colleagues [57] examined discomfort in vibration with frequencies ranging from 3 to 25 Hz, including only the lower values of the ankle resonant frequency range of 16 to 39 Hz [31]. Thus, the authors may have observed head discomfort to increase as exposures approached the resonant frequency of the ankles [31, 57].
Participants experienced the lowest discomfort in the UB, regardless of frequency or duration of exposure. Low self-reported discomfort in the UB emphasized the potential role of resonance in HN discomfort experienced during FTV exposure [21, 36]. Neither body area receives direct vibration exposure, yet participants reported significantly greater discomfort in the HN area. As previously indicated, HN discomfort was greatest near the resonance of the head, and the ankles [25, 31]. However, most resonant frequency ranges in the UB, including the hands and arms (40–100 Hz), fingers (>100 Hz), and shoulder (4–8 Hz), were not evaluated in this study [25, 27]. Accordingly, the risk of damage to vascular structures, as observed with the condition vibration-induced white-finger, increases near these frequencies [21, 54]. As such, UB discomfort may be more prevalent at higher frequencies not evaluated in this study; however, further research is required.
Based on the results of the current and previous studies, a connection between discomfort levels and resonant frequencies may exist [21, 54]. However, this study suggests discomfort measurements are insufficient to directly evaluate injury risk linked to standing occupational FTV exposure. Self-reported discomfort may instead offer a simple method of monitoring the early risk of vibration-induced injuries. Evaluating self-reported discomfort when exposed to FTV may highlight risks to worker health, safety, and productivity and allow employers to implement mitigation strategies prior to injury development [36, 51]. Thus, although professional vibration assessment is still necessary to quantify occupational exposure risk, self-reported discomfort may be an inexpensive gauge of potential musculoskeletal risks related to vibration exposure at resonant frequencies.
As a relationship between lower limb discomfort and the likelihood of musculoskeletal injury has been observed, self-reported discomfort could also be used to implement or design novel vibration mitigation strategies as a guideline or screening strategy [46, 58]. Occupational health, or medical surveillance, for vibration-induced disorders ideally would occur during the preplacement screening of workers to establish a baseline [19]. From the physical examination and testing examples for vibration-associated pathology in the feet, it is critical for occupational health and safety personnel to plan a method of documenting symptoms, onset, and progression [11, 59]. There are specific methods for classifying the vascular and neural symptoms of HTV, but not FTV. The Stockholm Workshop and Brammer et al.’s classification scales for HTV could be adapted for this purpose [19, 60].
A limitation of the current work includes the use of a discomfort rating scale. The lack of a standardized method of incorporating self-reported discomfort into research makes it difficult to use the scales effectively. With various self-reporting scales used throughout discomfort research, it’s created incomparable measurements between different types of equipment or occupations. Thus, a standardized discomfort rating scale should be designed for future assessments. Individual discomfort is highly self-reported and is influenced by the personal experiences of a participant [61]. As such, future studies should use a larger sample size to strengthen the statistical conclusions. Additionally, the current study observes changes in discomfort over a limited frequency range (25–50 Hz). The range was selected to reflect common exposure levels in an underground mining environment [1]. However, discomfort scores may have peaked at frequency levels outside of the selected range [48, 62]. For instance, Zhou and Griffin [48] noted that participants experienced the greatest growth in discomfort between 1–16 Hz when exposed to vertical vibration. Similarly, multiple studies have found that the transmissibility of vibration to the head from the feet and seat is greatest at frequencies below the range used in this study [14, 64].
Vibration transmission may also be influenced by changes to participant posture throughout the experiment and thus, alter reported discomfort [31, 42]. For instance, previous research has observed that changes in knee flexion alter vibration transmission to the head, with greater flexion resulting in reduced transmission [56, 63]. Throughout the procedure, it is likely that slight shifts in posture occurred and impacted transmissibility despite having an area marked on the platform for the participant to place their feet. Finally, the exposure duration in this study was not sufficient to predict long term effects or discomfort.
Future studies should evaluate self-reported discomfort ratings as an indicator of injury risk associated with exposure to vibration at resonant frequencies in a clinical setting. Testing in clinical environments would allow medical assessment techniques, such as vascular, neurological, and blood testing, to further investigate the risk of musculoskeletal and vascular injuries associated with FTV [65, 66]. Additionally, evaluation on a larger scale with a deeper assessment of injury risk may provide additional indicators of how discomfort ratings can be applied in an occupational setting. Organization-wide assessments could be accomplished by incorporating FTV discomfort measurements into administrative controls, for instance, as a component of WBV medical surveillance [67]. Regular self-reported discomfort measurements can be used in conjunction with periodic FTV exposure assessments to track and predict injury risk [43, 58]. Maintaining records of FTV discomfort and vibration frequency may help researchers to better understand the damage caused by regular exposure. Self-reported discomfort measurements could also be used to outline a set of standards for vibration exposure breaks for workers to follow dictated by their discomfort [68, 69]. For example, asking a worker LB-specific questions and requiring the worker to take breaks when discomfort reaches a set value.
Conclusion
FTV is a common occupational hazard that may induce acute and chronic injuries in regularly exposed workers [4, 52]. This study observed significant differences in discomfort based on the FTV frequency and body area assessed. Participants reported experiencing the most discomfort in the LB at higher frequencies, corresponding to the resonance of some structures in the foot. HN discomfort was observed to decrease as frequency increased; however, it was not statistically significant. The results of this study, coupled with previous work, suggest a potential relationship between resonant frequencies and participant discomfort [21]. Although this finding does not eliminate the need for proper vibration measurements, it may be used as an inexpensive tool for employers to assess injury risk due to FTV exposure at the resonant frequency of the LB [36]. Overall, further research is required to investigate the effectiveness of self-reported discomfort as an indicator of FTV injury risk in clinical and occupational settings.
Ethics approval
The experiment methodology was approved by the Research Ethics Board (REB) of Laurentian University (Sudbury, Canada). REB#20120419.
Informed consent
Voluntary informed consent was obtained from all participants in accordance with the Research Ethics Board’s approval.
Conflict of interest
The listed authors certify they have NO affiliations with or involvement in any organization or entity with any financial interest, or non-financial interest in the research and findings discussed in this manuscript.
Footnotes
Acknowledgments
We would like to thank the participants for their involvement in this research which focused on methods of injury prevention through identifying discomfort and pain when workers are exposed to foot-transmitted vibration.
Funding
This research was supported by a Natural Science and Engineering Research Council of Canada Discovery Grant [RGPIN/4242-2015].