
Abstract
BACKGROUND:
Few studies have addressed whether using manager or worker perceptions of safety policies and practices alone predict reported injury rates less accurately than using both.
OBJECTIVE:
This study provides an example and describes a method that can be used to address this issue with survey instruments designed to measure safety climate, policies, or practices.
METHODS:
Using multilevel logistic regression, we estimated the relationship between worker and manager perceptions of a given exposure and the odds of worker injury during the post-survey year for three safety scales. We tested whether surveying both workers and managers provides additional predictive value compared with surveying just one group,
RESULTS:
Injury in the year following the survey was significantly associated with worker scores on two of the three scales. Manager responses were not significantly associated with injury and did not significantly improve injury rate prediction when added to a model with only worker survey responses.
CONCLUSIONS:
The capacity of manager-only or worker-only perceptions of safety policies and practices to predict worker injuries should be established before choosing to survey just one or the other. The approach and findings in this paper can be applied to other survey instruments and in other settings to help make this choice.
Background
Organizations may use the responses of managers or workers to assess safety climate or practices [1–12]. They can use such surveys to identify priority areas for health and safety improvement and then change relevant policies and procedures to reduce injury rates [3, 14]. The extent to which surveys for this purpose can be useful depends in part on their ability to predict injury rates.
Employers and researchers may prefer to survey managers because surveying managers may be easier and less expensive than surveying a large worker group and may result in higher response rates. This may be particularly true in low-wage workforces in which workers do not regularly access work email or if literacy levels are low. However, if worker perceptions better reflect injury risk (that is, are more predictive of future injury rates), the value of surveying workers may outweigh the cost.
Studies have shown that there may be consistent differences between mean manager and worker perceptions of safety climate, policies, or practices in the same work setting, but there have been few studies addressing whether relying on both groups provides more useful information for research, practice, and policy than just relying on one or the other [5, 7–9].
We relied on a conceptual model of managers’ and workers’ responses to survey questions about workplace policies and practices, similar to a conceptual model applied to team organizational climate described by Perrigino et al. [15] and to the framework described in Marín et al. [7, 16]. The underlying theory is that workers and their managers may either observe different aspects of the same phenomena or may observe the same phenomena but interpret them differently (see Fig. 1).
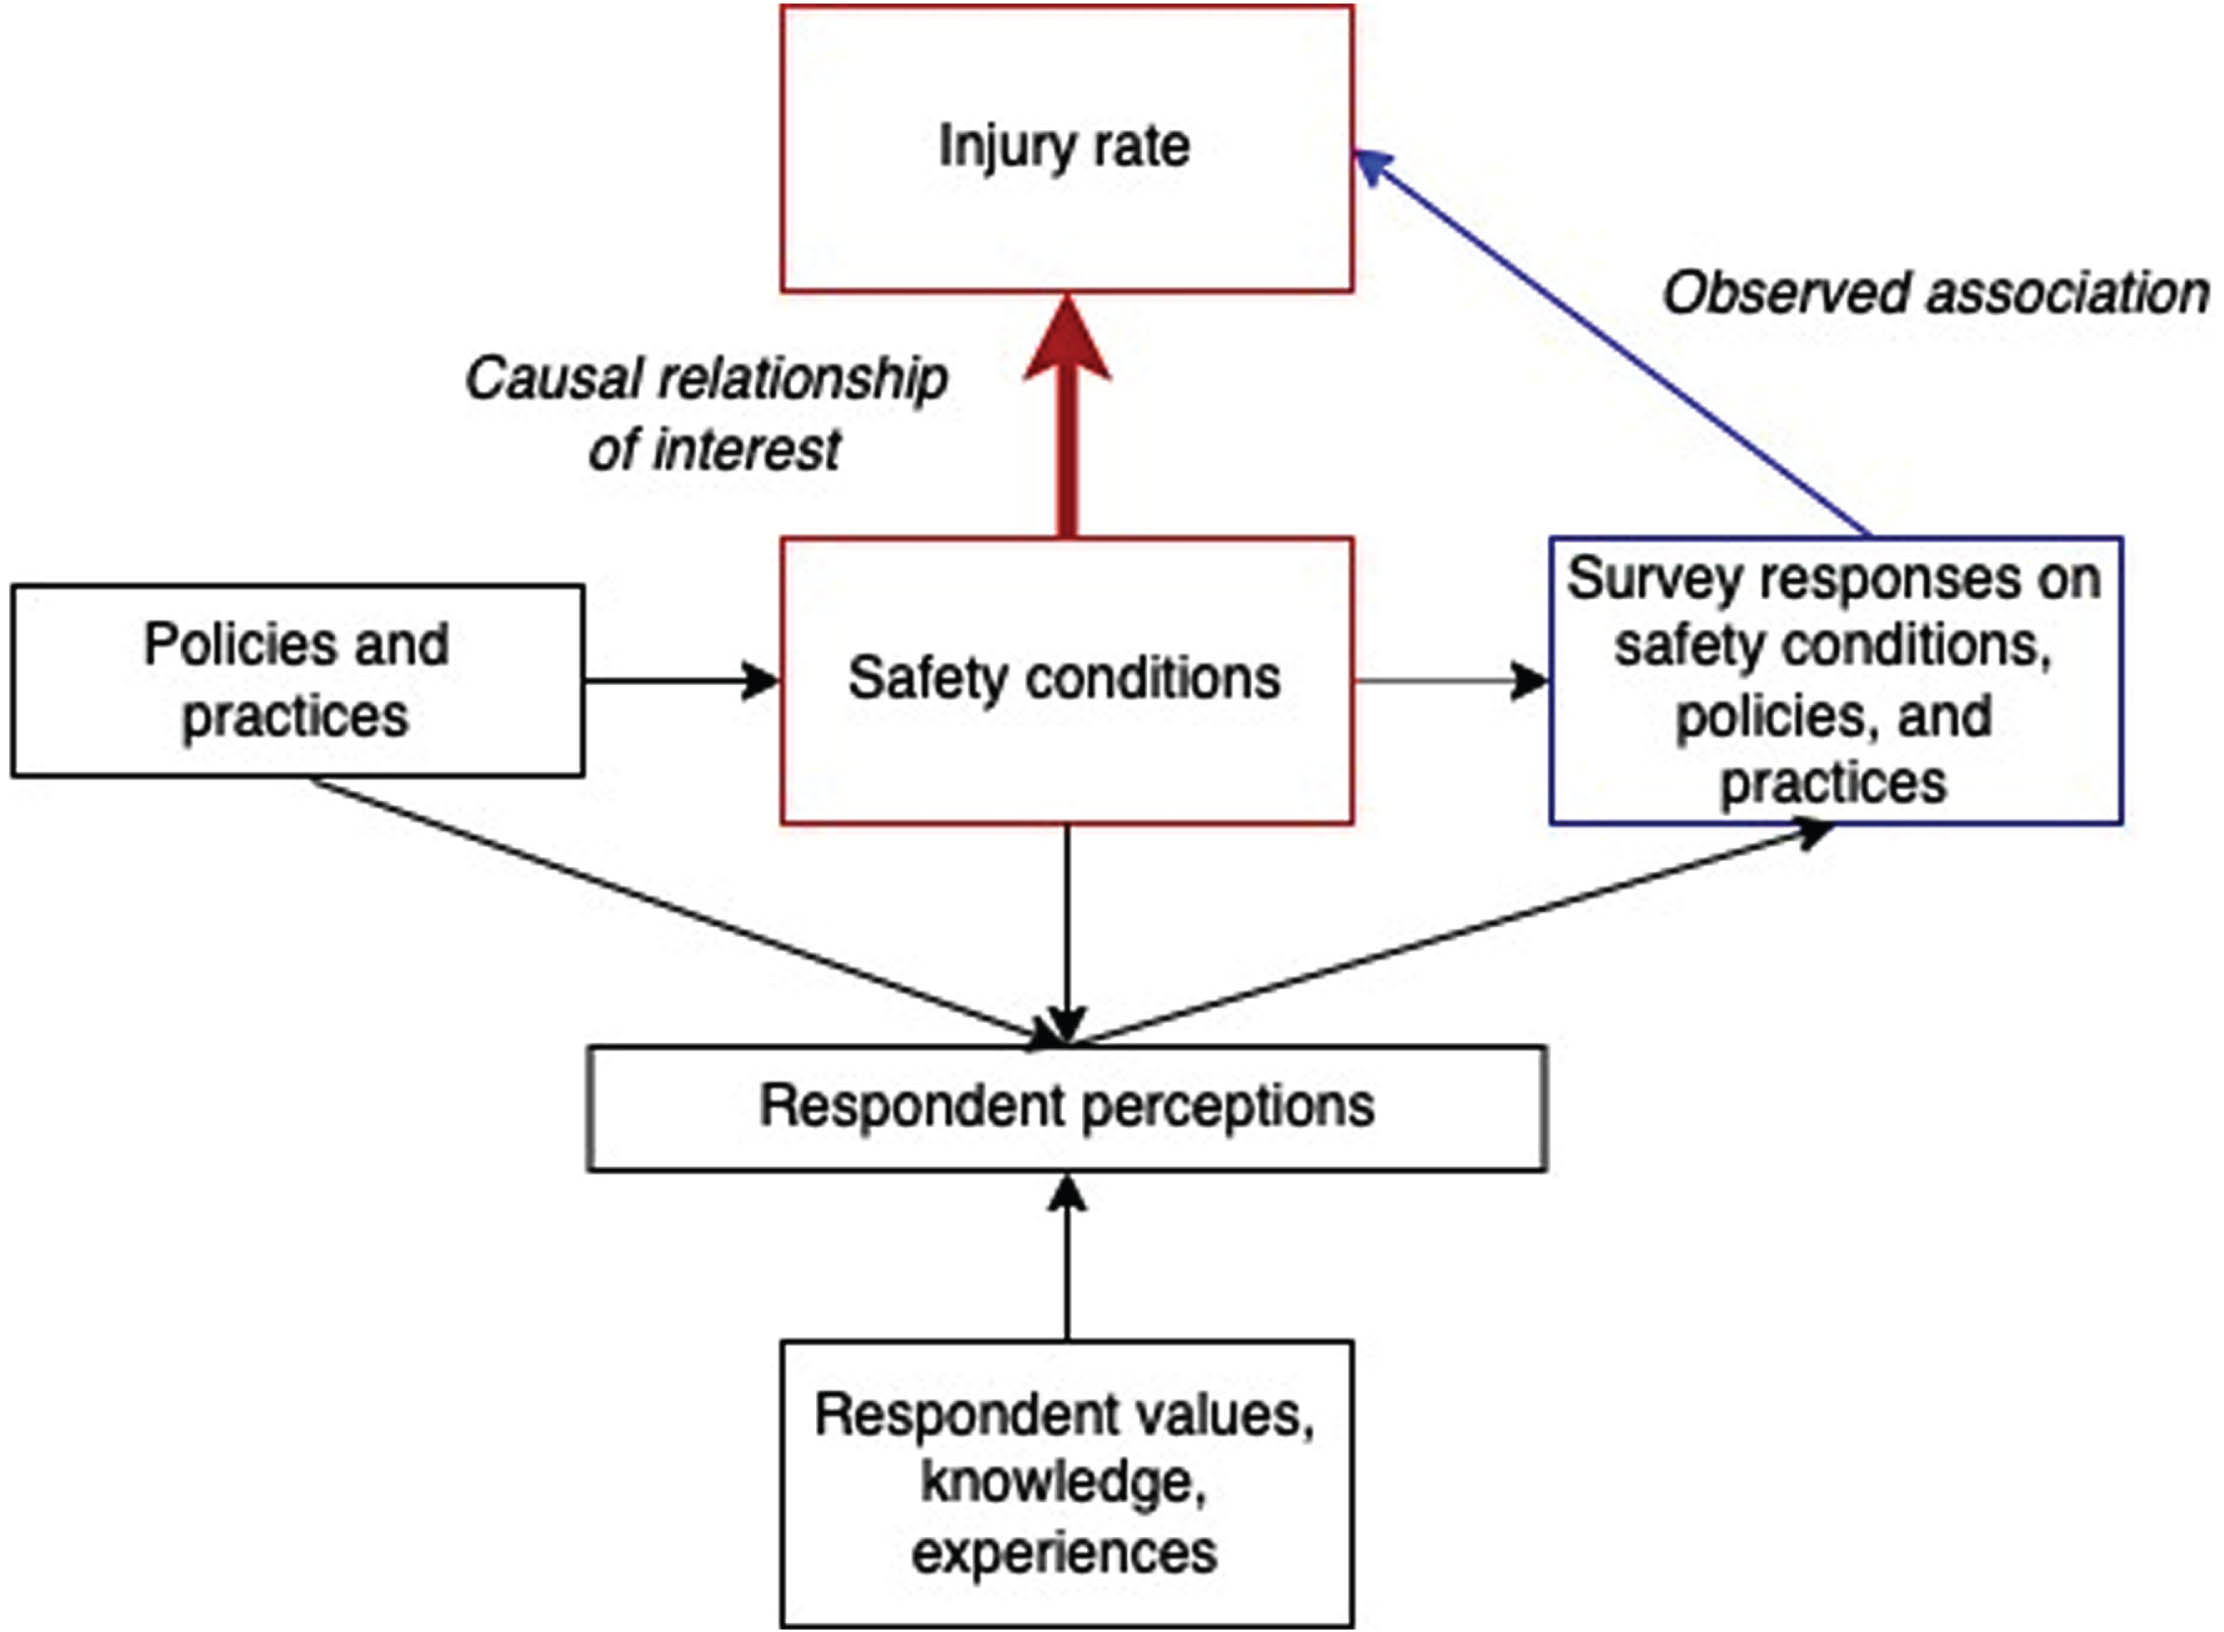
Conceptual model of relationship between survey responses and injury rates.
We illustrate this framework with a hypothetical example, using the following survey item: “Managers make sure that workers are able to take their entitled breaks during work.” In a hypothetical workplace, for each manager’s unit, workers are entitled to take a certain number of breaks daily. This is the workplace policy. However, workers and managers may see different aspects of how this policy is enacted. Managers may be more aware of organizational policies and be responsible for their implementation, while workers may be more aware of specific aspects of their jobs and practices on the unit. In the case of work breaks, managers may respond positively to requests for coverage so workers can take their breaks [17]. However, workers may not request coverage if there are high workloads, if they know that it will disrupt the workday of other team members, or if they fear retribution for taking breaks. If workers cannot take all their entitled breaks, managers still might assume that they do. However, workers may think that they are not receiving all their allotted breaks.
Workers and their managers may also have different beliefs about how many breaks workers are entitled to. In addition, workers may recall the breaks they missed more vividly than managers, and managers may more vividly recall their efforts to provide time for breaks. Although the reality – the absolute number of breaks taken – is shared, the perception of that reality may not be the same.
Managers’ perceptions may also be influenced by “social desirability bias,” as noted by Huang et al. [5] and Marín et al. [7]. Managers may consider themselves responsible for safety conditions, and better safety conditions thereby reflect well on their performance. This may lead to manager’s rating safety related aspects on their units higher due to the desirability of performing well in enacting safety policies and practices.
For other types of survey questions, the concept being measured is inherently subjective. For example, “The unit maintains excellent housekeeping.” Here, excellence is not defined using a shared metric and is in the eye of the beholder, influenced by one’s perception of what excellent housekeeping would be.
Research has generally shown that manager perceptions of organizational climate, safety climate, and related concepts are more favorable than worker perceptions [7–12, 18]. Although manager and worker responses may differ, they may still be equally associated with an outcome of interest. Given that manager and worker responses to survey questions about their work environment may differ, in this paper we ask how well these responses predict worker injury rates.
There are few studies that have explored this question, and their findings are inconsistent. In a study of limited-service restaurant workers, Huang et al. found that individual worker perceptions of safety conditions were associated with injury rates, while manager perceptions were not [8]. Similar results were found, perhaps not surprisingly, for workers working with a distant supervisor [5]. However, a study based in construction found that neither managers’ nor workers’ perceptions of safety climate had a statistically significant relationship with injury rates, but differences between worker and manager perceptions did [7]. A study of blue-collar workers in a university setting also found that worker-manager discrepancies were predictive of injury rates, although it did not examine worker and manager perceptions separately [9]. Also, a 2017 study found that workers’ safety climate perceptions were not associated with injury rates, but that safety officers’ reported safety management practices were [16]. We note that the substantial body of safety climate research, pioneered by Zohar and others, relies exclusively on worker responses [1, 2].
Assessing the extent to which worker and manager responses are informative is notably influenced by: (1) the responses themselves, to the extent that workers and managers have different perceptions; and (2) the number of responses. When worker responses are included in a model, the analytical sample size is larger, resulting in increased precision of the estimates (smaller standard errors).
Here, we offer three competing hypotheses about safety-related practices: Manager and worker perceptions of three measures of safety-related policies and practices are equally associated with injury rates. Using either provides as much information about future injury rates as using both. Manager perceptions of three measures of safety-related policies and practices are associated with injury rates. Worker perceptions are weakly associated with injury rates and add little or no additional information when both manager and worker responses are included in the same model. Worker perceptions of three measures of safety-related policies and practices are associated with injury rates. Manager perceptions are weakly associated with injury rates and add little or no additional information when both manager and worker responses are included in the same model.
This study attempts to illustrate an approach to answering three questions: (1) On average, do managers and workers have similar perceptions about safety policies and procedures within the same work environment, (2) Are assessments of safety policies and practices predictive of injuries, and (3) Does the answer depend on whom you ask? To answer these questions for the specific measures in this study, we analyzed the relationship between worker and manager perceptions about workplace safety policies and practices (measured using a survey) in two large tertiary-care hospitals and administratively-recorded worker injuries in the year following the survey. The answers to these questions have implications for a wide range of workplace surveys to determine whether both worker and manager responses provide additional predictive power compared to surveying just one or the other.
Ethical considerations
The study was approved by the Institutional Review Board of the Harvard T.H. Chan School of Public Health (IRB 18-1245). Our survey included a consent page, but signatures were not required because the participants’ primary risk was identification. The authors had no conflicts of interest.
Data
We used data from the Boston Hospital Workers Health Study, a cohort study of hospital patient care workers, from two large Mass General Brigham hospitals in Boston, USA [19]. The cohort database is composed of administrative data on age, gender, occupation, unit, shift, employment tenure, and hours worked linked with worker and manager surveys. All nurses, nursing assistants, and nurse directors (managers) at the hospitals are retained in the cohort even after leaving the institution, and each year newly hired workers are added to the cohort. The study team has periodically surveyed a random sample of the cohort, asking workers and their managers about their working conditions, health, and wellbeing. In 2012, we fielded a survey to 2133 workers and their managers, yielding 1595 responses (75% response rate) [19].
For this study, we used the data from worker and manager surveys linked to administrative data containing OSHA recordable injuries for each worker during the 12 months following the survey. We merged data from these sources at the individual worker level. See Table 1.
Descriptive statistics, study sample
Descriptive statistics, study sample
*Rate per 200,000 hours (100 person-years) worked.
Sample: For each worker surveyed, we determined if the worker had an OSHA-recordable injury in the year following the date of survey completion. The overall incidence rate of injury among surveyed workers was 9.8 per 200,000 hours worked (100 full-time equivalent employees). We matched managers to the units they indicated in the survey. If more than one manager was on the same unit, we surveyed the senior manager. There were 1492 worker and 72 manager responses for our analysis. Not all units had equal sampling fractions, so we weighted our analyses accordingly.
Variables: We created overall scale scores from individual survey responses: Ergonomic Practices (6 items), General Safety Practices (4 items), and Safety Leadership (1 item). The latter two are derived from the Organizational Policies and Practices (OPPs) questionnaire, developed by Amick et al. [20]. This questionnaire has been validated and has been widely used. Dennerlein et al. [21] adapted the ergonomic practices subscale for hospital patient-care workers, and we used this subscale in our study. The scale items are described in the Supplemental Materials. All items were answered using a 5-point Likert Scale (Strongly Disagree, Disagree, Neither Agree nor Disagree, Agree, Strongly Agree). Cronbach’s alpha for the ergonomic practices scale was 0.91 and 0.88 for worker and manager responses respectively. For the safety scale, the Cronbach’s alphas were 0.82 and 0.78, respectively.
The research was designed as a retrospective cohort study. We fit multilevel logistic regression models with worker injury (yes, no) as the response and the scale scores for both manager and workers as predictors. We also included the total number of hours worked during the study period to account for duration of exposure.
To assess the relative contributions of manager and worker scores, we estimated sets of nested models depicted as Models 1a and 1b and Models 2a and 2b below:
Where i refers to an individual worker surveyed within unit j. The term u0j is a unit random intercept, ‘ws’ refers to worker scores and ‘ms’ refers to manager scores, and hours worked also included in each model as an offset variable.
We used likelihood ratio chi-square tests to compare nested models within a set. For example, this test compares the log-likelihood (LL) value, a measure of goodness of fit, of Model 1a to that of Model 1b. The likelihood ratio test statistic is defined as –2*(LL(Model 1a) – LL(Model 1b)) and follows a chi-square distribution with degrees of freedom equal to 1 (because the difference in number of parameters between Model 1a and Model 1b is 1). Under the null hypothesis, Model 1b has a LL value equal to that of Model 1a. A null result would therefore mean that including the manager score to a model that already had the worker score does not improve the model fit. In other words, we can drop the manager score without loss of information about the response or loss of predictive ability. Alternatively, if the manager score adds predictive value to injury over and above worker scores, then the LL for Model 1b will be larger than that of Model 1a, and we will be more likely to reject the null hypothesis, concluding that the manager score should not be discarded. We used an alpha level of.05 for all chi-square likelihood ratio tests.
We also used the Akaike information criterion (AIC) as a measure of model fit. This measure also uses the log-likelihood but adds a penalty as the number of variables increases. A lower AIC represents a better model fit. We followed the STROBE guidelines for reporting observational studies.
Results
Table 2 shows the scores of workers and managers for the three scales. For each, the managers’ score was higher. That is, managers viewed implementation of safety policies and practices as better than workers did. Using a 2-sample t-test, all three pairs of means differed at p < 0.05.
Responses to questions about safety policies and practices
Responses to questions about safety policies and practices
*Worker-manager difference p < 0.001.
Table 3 shows odds ratios of injury for a one-unit increase in the ergonomics, safety, and safety leadership scales respectively. For two of the three measures, a higher worker score was associated with a significantly lower injury rate, with p < 0.05. For all three, the manager odds ratios were closer to 1.0 compared to the worker odds ratios. Moreover, none of the managers estimated odds ratios significantly differed from 1.0. Safety leadership responses were not significantly associated with injury odds for either.
Relationship between safety scales and odds of injury in the following year: multilevel logistic regression
To directly test our hypothesis, we computed the chi-square statistic of the difference in residual deviance between the model including both worker and manager scores and the models with only one of the two scores (likelihood ratio chi-square test). The results are shown in Table 4. For each of the three scales, this difference is small and not statistically significant for the worker-only model. On the other hand, the test statistic for the manager-only model was larger for all three and statistically significant for the first two. This implies that adding the manager scores does not appreciably improve predictions compared to the worker-only model.
Tests of added predictive value: manager and worker responses
As a further test, we computed the AIC for each model and scale. For all three scales, the AIC was lowest for the worker-only model, suggesting that this model was preferred to both the manager-only and the worker plus manager model.
In our study population, we found that worker responses to questions about safety policies and practices were associated with injury, but that there was no additional predictive value from including manager responses in these models. Indeed, the manager responses alone were at best weakly predictive of injury. While our study cannot determine the reasons for these differences, prior research suggests that workers are closer to hazards and thus may have more accurate perception of injury risk factors. Conversely, managers may want to see themselves as doing a good job and, thus, may overlook safety problems in their units [5, 7]. Alternatively, our null findings about the relationship between manager responses and injuries might be related to our sampling methods, question framing, or other aspects of study design.
Compared to using manager responses alone, using worker responses within the same model also increases the precision of the estimates (results in smaller standard errors) in this study. This is likely because there are more workers than managers and therefore a larger worker sample size.
Finally, we found that manager-reported perceptions of the safety policies and practices examined were more favorable than those of workers within the same units. This is consistent with results from other studies [7–10]. It may reflect several factors, including differential understanding of policies and procedures, different experiences of workplace hazards, different safety expectations, and managers’ self-perceived prioritization of worker health and safety, which could influence perceptions of actual working conditions on their units.
Earlier studies in different settings largely found that worker responses to safety questionnaires were predictive of future injury rates [5, 8], although this was not always the case [16]. These findings depend on the measures used and may also depend on the industry and occupations studied. The purpose of this study was not to generalize about the predictive value of worker versus manager perceptions. Rather, we present an example for how to determine, for a specific survey instrument, whether surveying one of these groups but not the other reduces researchers’ ability to predict injuries. Future studies examining the predictive value of worker and manager perceptions using existing safety climate instruments like the Nordic Occupational Safety Climate Questionnaire [22] could add to this understanding.
This study is based on employer-collected OSHA-recordable injuries. Past studies have shown that this data is substantially underreported compared to workers’ actual work-related injury rates [23–25]. If our concern is the relationship of safety scales to injury rates, this underreporting may lead to biased estimates, although we cannot infer the direction of this bias. The same is true of differential reporting by race/ethnicity [26], gender, or occupation. Also, there is evidence that better safety climate leads to more complete reporting [27]. This could lead to an underestimate of the relationship between both worker and manager responses and reported injury rates.
Conclusions
This study raises a cautionary flag. The safety climate concept has typically been considered as a measure of worker perceptions [1]. For ease of administration, increased response rates, or reduced cost, employers and researchers have, at times, administered workplace safety surveys only to supervisors or managers [4]. The results from the current analysis caution against such an approach, as we find that this practice may result in losing the ability to identify and address safety problems. The ability of a manager-only or worker-only approach to predict future injury rates should be piloted before relying on only one group’s survey responses to guide efforts to improve safety. The approach in this paper can be applied to specific safety climate instruments to determine whether, in a given worker population, surveying both workers and managers provides additional predictive power compared with surveying just one or the other. When surveying both workers and managers is impractical, our findings suggest that given a choice between administering a survey to only workers or only managers, researchers and practitioners should consider a worker-only survey.
Ethics approval
The study was approved by the Institutional Review Board of the Harvard T.H. Chan School of Public Health (IRB 18-1245).
Informed consent
Survey respondents indicated informed consent electronically before beginning the survey. Our survey included a consent page, but signatures were not required because the participants’ primary risk was identification.
Author contributions
All authors participated in the a) acquisition, analysis, and interpretation of data for the work; b) drafting the work and revising it critically for important intellectual content; c) final approval of the version to be published; and d) agreement to be accountable for all aspects of the work in ensuring that questions related to the accuracy or integrity of any part of the work are appropriately investigated and resolved. Leslie I. Boden, Matt Gregas, Melissa McTernan, Susan E. Peters, Gregory R. Wagner, and Erika L. Sabbath participated in the conception or design of the work.
Footnotes
Acknowledgments
We would like to thank Dean Hashimoto, MD, JD, Chief Medical Officer, Occupational Health Services, Mass General Brigham and Associate Professor of Law, Boston College Law School; and Karen Hopcia, ScD, ANP-BC, COHN-S, FAAOHN, Associate Director of Shared Services, Budget and Data Analysis, Mass General Brigham Occupational Health Services for their generous support and guidance in this research.
Conflict of interest disclosure
The authors declare no conflicts of interest.
Funding
Grant Sponsor: The National Institute for Occupational Safety and Health; Grant Number: U19 OH008861 for the Harvard T.H. Chan School of Public Health Center for Work, Health, and Well-being.