
Abstract
Grating-based differential phase contrast (DPC) imaging enables the use of a hospital-grade X-ray tube, but compromises the image quality due to insufficiently coherent illumination. In this research, a bench-top DPC cone beam CT (DPC-CBCT) was systematically evaluated and compared with the traditional attenuation-based CBCT in terms of contrast to noise ratio, noise property, and contrast resolution through phantom studies. In order to evaluate DPC-CBCT for soft tissue imaging, breast specimen and small animal studies were carried out. Phantom studies indicate that phase image has lower-frequency noise, higher CNR, and improved contrast resolution. However, phase image quality was degraded in soft tissue imaging due to coherence loss caused by small-angle scattering. Hence dark-field imaging was introduced to quantitatively investigate small-angle scattering caused by an object. Experimental results indicate that inhomogeneous objects affect phase contrast imaging, phase image is more sensitive to noise, and its performance is material dependent. Dark-field imaging could also be used to locate and reduce phase image noise and artifact caused by small-angle scattering.
Introduction
X-ray attenuation contrast imaging techniques, such as CT imaging and mammography, incur poor soft tissue contrast due to subtle variations in attenuation coefficients. Several X-ray phase contrast imaging techniques, including interferometry, diffraction enhanced imaging, in-line imaging and grating-based differential phase contrast (DPC) imaging, have emerged during the past two decades to address the limitation of attenuation contrast imaging [1–11]. It is reported that phase contrast imaging is able to increase dose efficiency [21, 22]. These techniques require coherent illumination to manifest phase contrast effect and were implemented with synchrotron radiation or micro-focus X-ray tubes. A hospital-grade X-ray tube became possible for DPC imaging, as a source grating was introduced to divide the illumination into a series of narrow line sources that produce improved coherence in one dimension. The compatibility of hospital-grade X-ray tube makes DPC imaging possible for wide clinical applications. However, the insufficiently coherent illumination compromises the image quality.
The purpose of this paper is to systematically evaluate a grating-based DPC cone beam CT (DPC-CBCT) imaging system built by our group, compare the image quality with attenuation-based CBCT, and discuss its advantages, disadvantages and potential for medical imaging. This paper includes our previous work [12, 13], as well as recent experimental data. The phase image quality was evaluated in terms of contrast to noise ratio (CNR), noise property, spatial resolution and contrast resolution by phantom studies. In order to investigate the system’s capability of differentiating contrast among soft tissues, human breast specimens, fresh pork specimen and mice were scanned. Both phase images and attenuation images were reconstructed and compared for each case. As an evaluation method, dark-field imaging was introduced to investigate the effect of coherence loss caused by the imaged objects. This work revealed the capability of DPC-CBCT for preclinical application, provided valuable reference information for the design of DPC-CBCT systems, and suggested directions for the future development of DPC-CBCT imaging.
Materials and methods
DPC-CBCT imaging
When an X-ray penetrates a material, the propagation is determined by the refraction index [14, 15]:
Figure 1 shows the design of our bench-top DPC-CBCT imaging system. The system was calibrated for radiation with an effective photon energy of 24 keV and the detailed system parameters are given by Table 1. Using a hospital-grade X-ray tube (Varian Rad-70D, Varian X-ray Products, Salt Lake City, UT), the system is able to produce X-rays with one-dimensional spatial coherence by utilizing an absorption grating (the source grating G0). The source grating divides the large focal spot X-ray source into narrow line sources, and each of these line sources is able to produce improved spatial coherence. The phase grating (G1) has negligible absorption but substantial phase shift, dividing the X-ray beam into two first order diffraction patterns. The refracted beams then interfere and form periodical fringes at a fractional or integer Talbot distance where the analyzer grating (G2) is placed. G2 is required because the fringes have a period of only several microns that is too small to be recorded even with a high resolution X-ray detector. If the incident X-ray beam encounters an object before it reaches the phase grating, the wavefront will be perturbed, causing local displacement to the fringes.
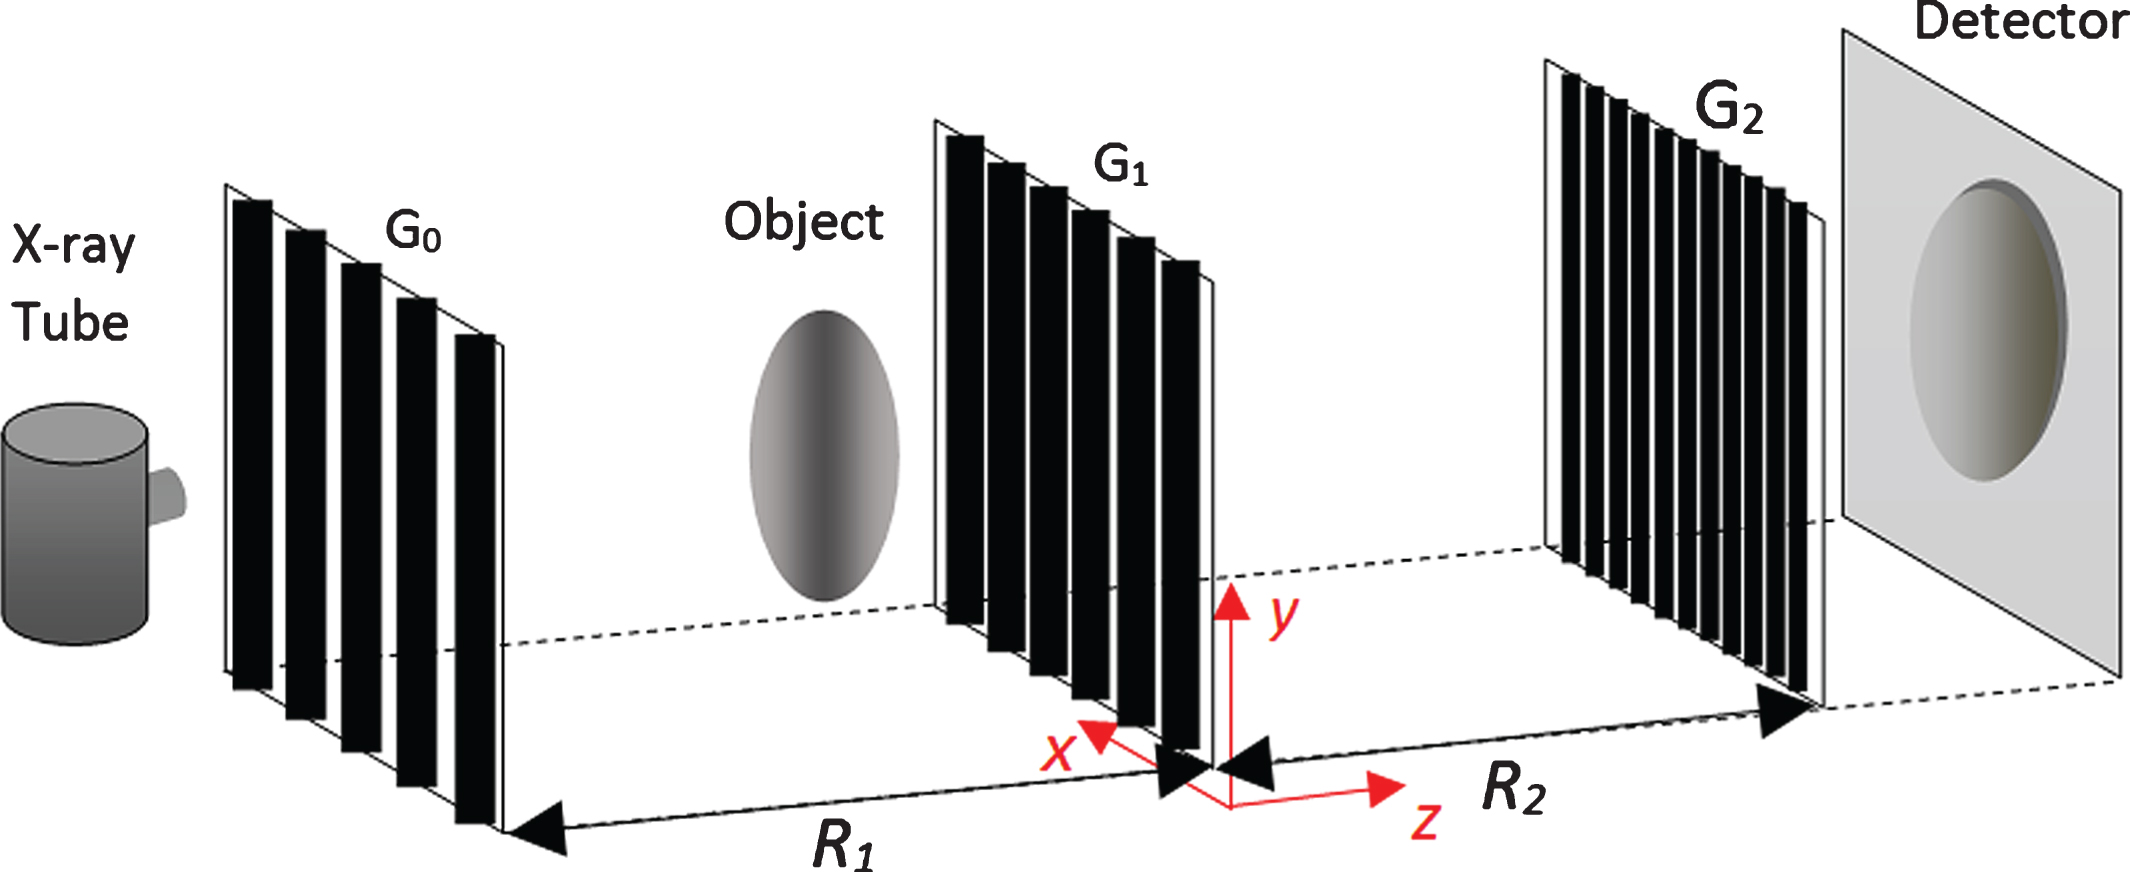
Design of grating-based DPC-CBCT imaging system.
DPC-CBCT system parameters
In order to retrieve the phase shift information, the fringe displacement is detected using the phase-stepping method: the analyzer grating is shifted within one grating period for a certain number of steps. An intensity image, also called a stepping image, is recorded at each step by the X-ray detector (RadEye High Resolution detector, Rad-icon Imaging Corp, Santa Clara, CA) whose pitch is larger than the fringe period. The stepping images show no fringe patterns but modulated by the position of the analyzer grating. Assuming N-step phase-stepping method is used, the stepping images are given by [5]:
The calculated image using (3) is called a DPC image, which is analogous to the projection image in attenuation contrast CT. A DPC image is actually the first order derivative of the phase projection because the interference pattern is formed by phase difference between adjacent beams. By acquiring DPC images along a circular orbit, the 3-D phase coefficient function ϕ can be reconstructed using filtered back projection with a Hilbert filter:
Talbot interferometry relies on the coherence of the illumination. An object may degrade the coherence of X-rays through small-angle scattering. Coherence is usually characterized by coherence length. In grating-based DPC imaging, we can characterize coherence property by fringe contrast, which is directly determined by the coherence level. The moiré image of the gratings gives the fringe contrast. When the gratings are well aligned, the moiré pattern becomes wide and not visible on the detector, but the contrast can be detected by the intensity change of the image background during phase stepping. Equation (2) indicates that, during phase stepping, the pixel intensity oscillates as a sinusoidal curve (Fig. 2). The visibility of the fringe contrast is defined by:
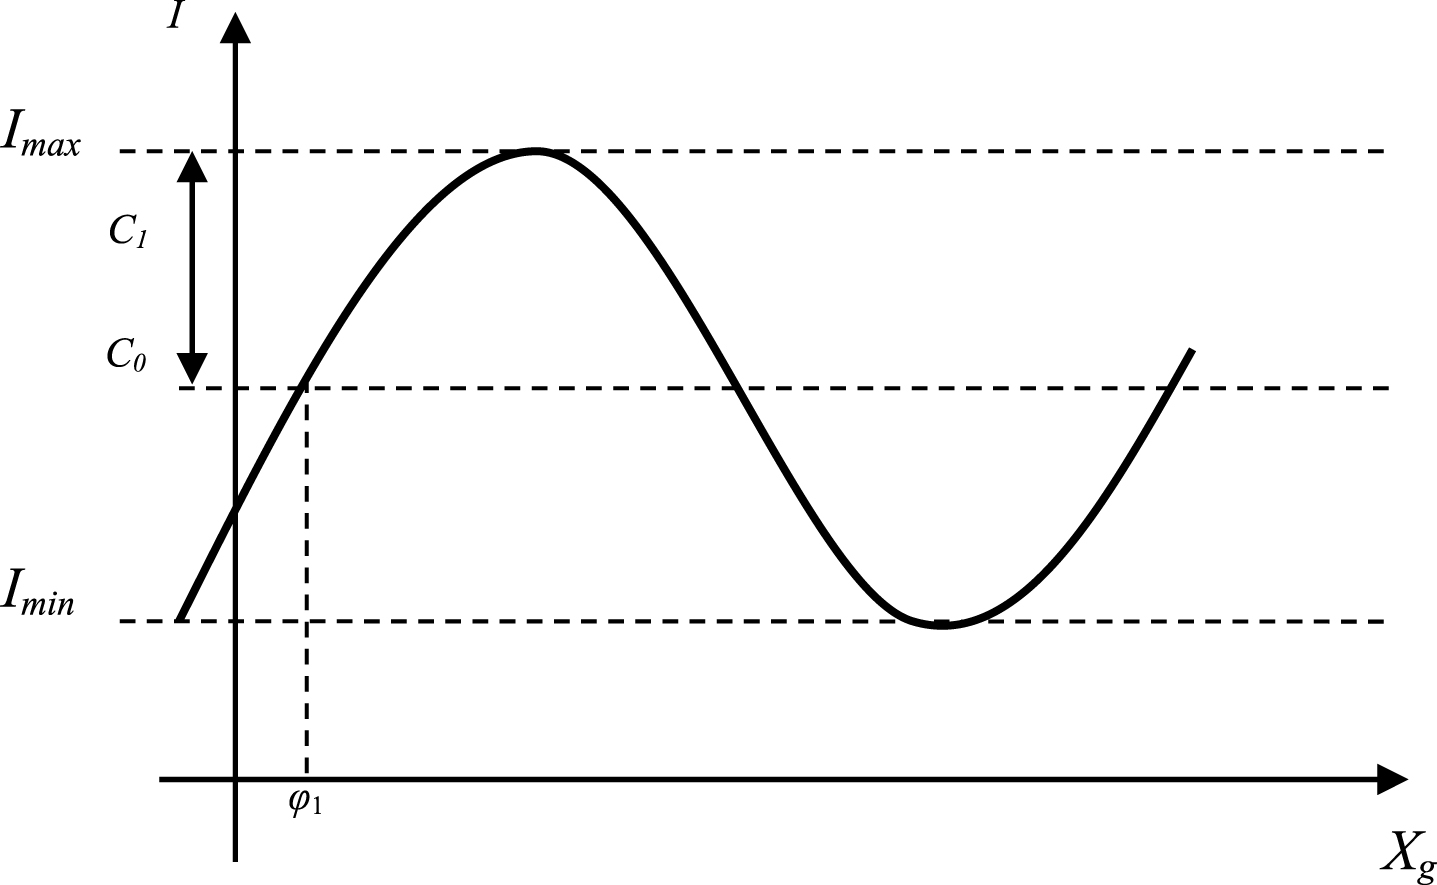
Intensity oscillation recorded by a detector pixel in phase-stepping procedure.
There is an imaging technique that manifests the visibility and is called dark-field imaging. It can be used to investigate the coherence loss caused by an object [8, 19]. Dark-field image can be obtained from DPC-CBCT scan data, and the pixel value is calculated by:
Where V r denotes the fringe visibility when no object is in the field, and V s the visibility when an object is in the field. It is straightforward that dark-field image measures the relative decrease in the visibility due to an object.
A cylinder phantom was designed to evaluate our DPC-CBCT imaging system. As shown in Fig. 3, the outer diameter of the cylinder is 25.4 mm. The acrylic wall thickness is less than 2 mm. The diameter of the inserted small cylinders is 7 mm. The phantom has four cavities that can host rod inserts and the bottom part of the phantom is filled with water for uniformity and noise evaluation. The inserts could be fluid containers or customized solid materials.

Illustration of the cylinder phantom design and insert materials.
Human breast specimen and pork specimen experiments were carried out to evaluate DPC-CBCT for soft tissue imaging. Several human breast specimens diagnosed as benign and with calcification were acquired from the Pathology Department of University of Rochester. The size of the specimen is approximately 50 mm long, 20 mm wide and 15 mm thick. Several euthanized mice were acquired from the Vivarium of the University of Rochester Medical Center to evaluate the performance of DPC-CBCT for small animal imaging. The mice were euthanized on the same day with the scan and then sealed inside cylindrical polyethylene containers with a diameter of 30 mm.
Phantom study
The four cavities of the cylinder phantom were inserted with Polyoxymethylene (POM), Polycarbonate (PC), Polyimide (PI), and Polytetrafluoroethylene (PTFE), and the rest part of the phantom was filled with water. The scan was performed at 100 mA, 40 kVp and 320 mS and 240 DPC images were acquired over the circular orbit. 8-step phase stepping method was used for DPC image retrieval. Attenuation-based CBCT scan was also performed at the same dose level for comparison. The noise property was evaluated by the water-only part of the phantom. Figure 4(a) shows one slice of DPC-CBCT reconstruction and (b) shows the corresponding slice of attenuation CBCT reconstruction. Figure 4(c) and (d) show the noise power spectrum for DPC-CBCT and attenuation CBCT respectively. The noise property in DPC-CBCT image is visually different from attenuation CBCT image. In attenuation image, the noise power is distributed at higher frequency area, whereas in phase image the noise power is dominated by the low frequency region. The low frequency noise shows up as a cloud-like texture which affects the detectability of details, especially low contrast structures with small sizes.
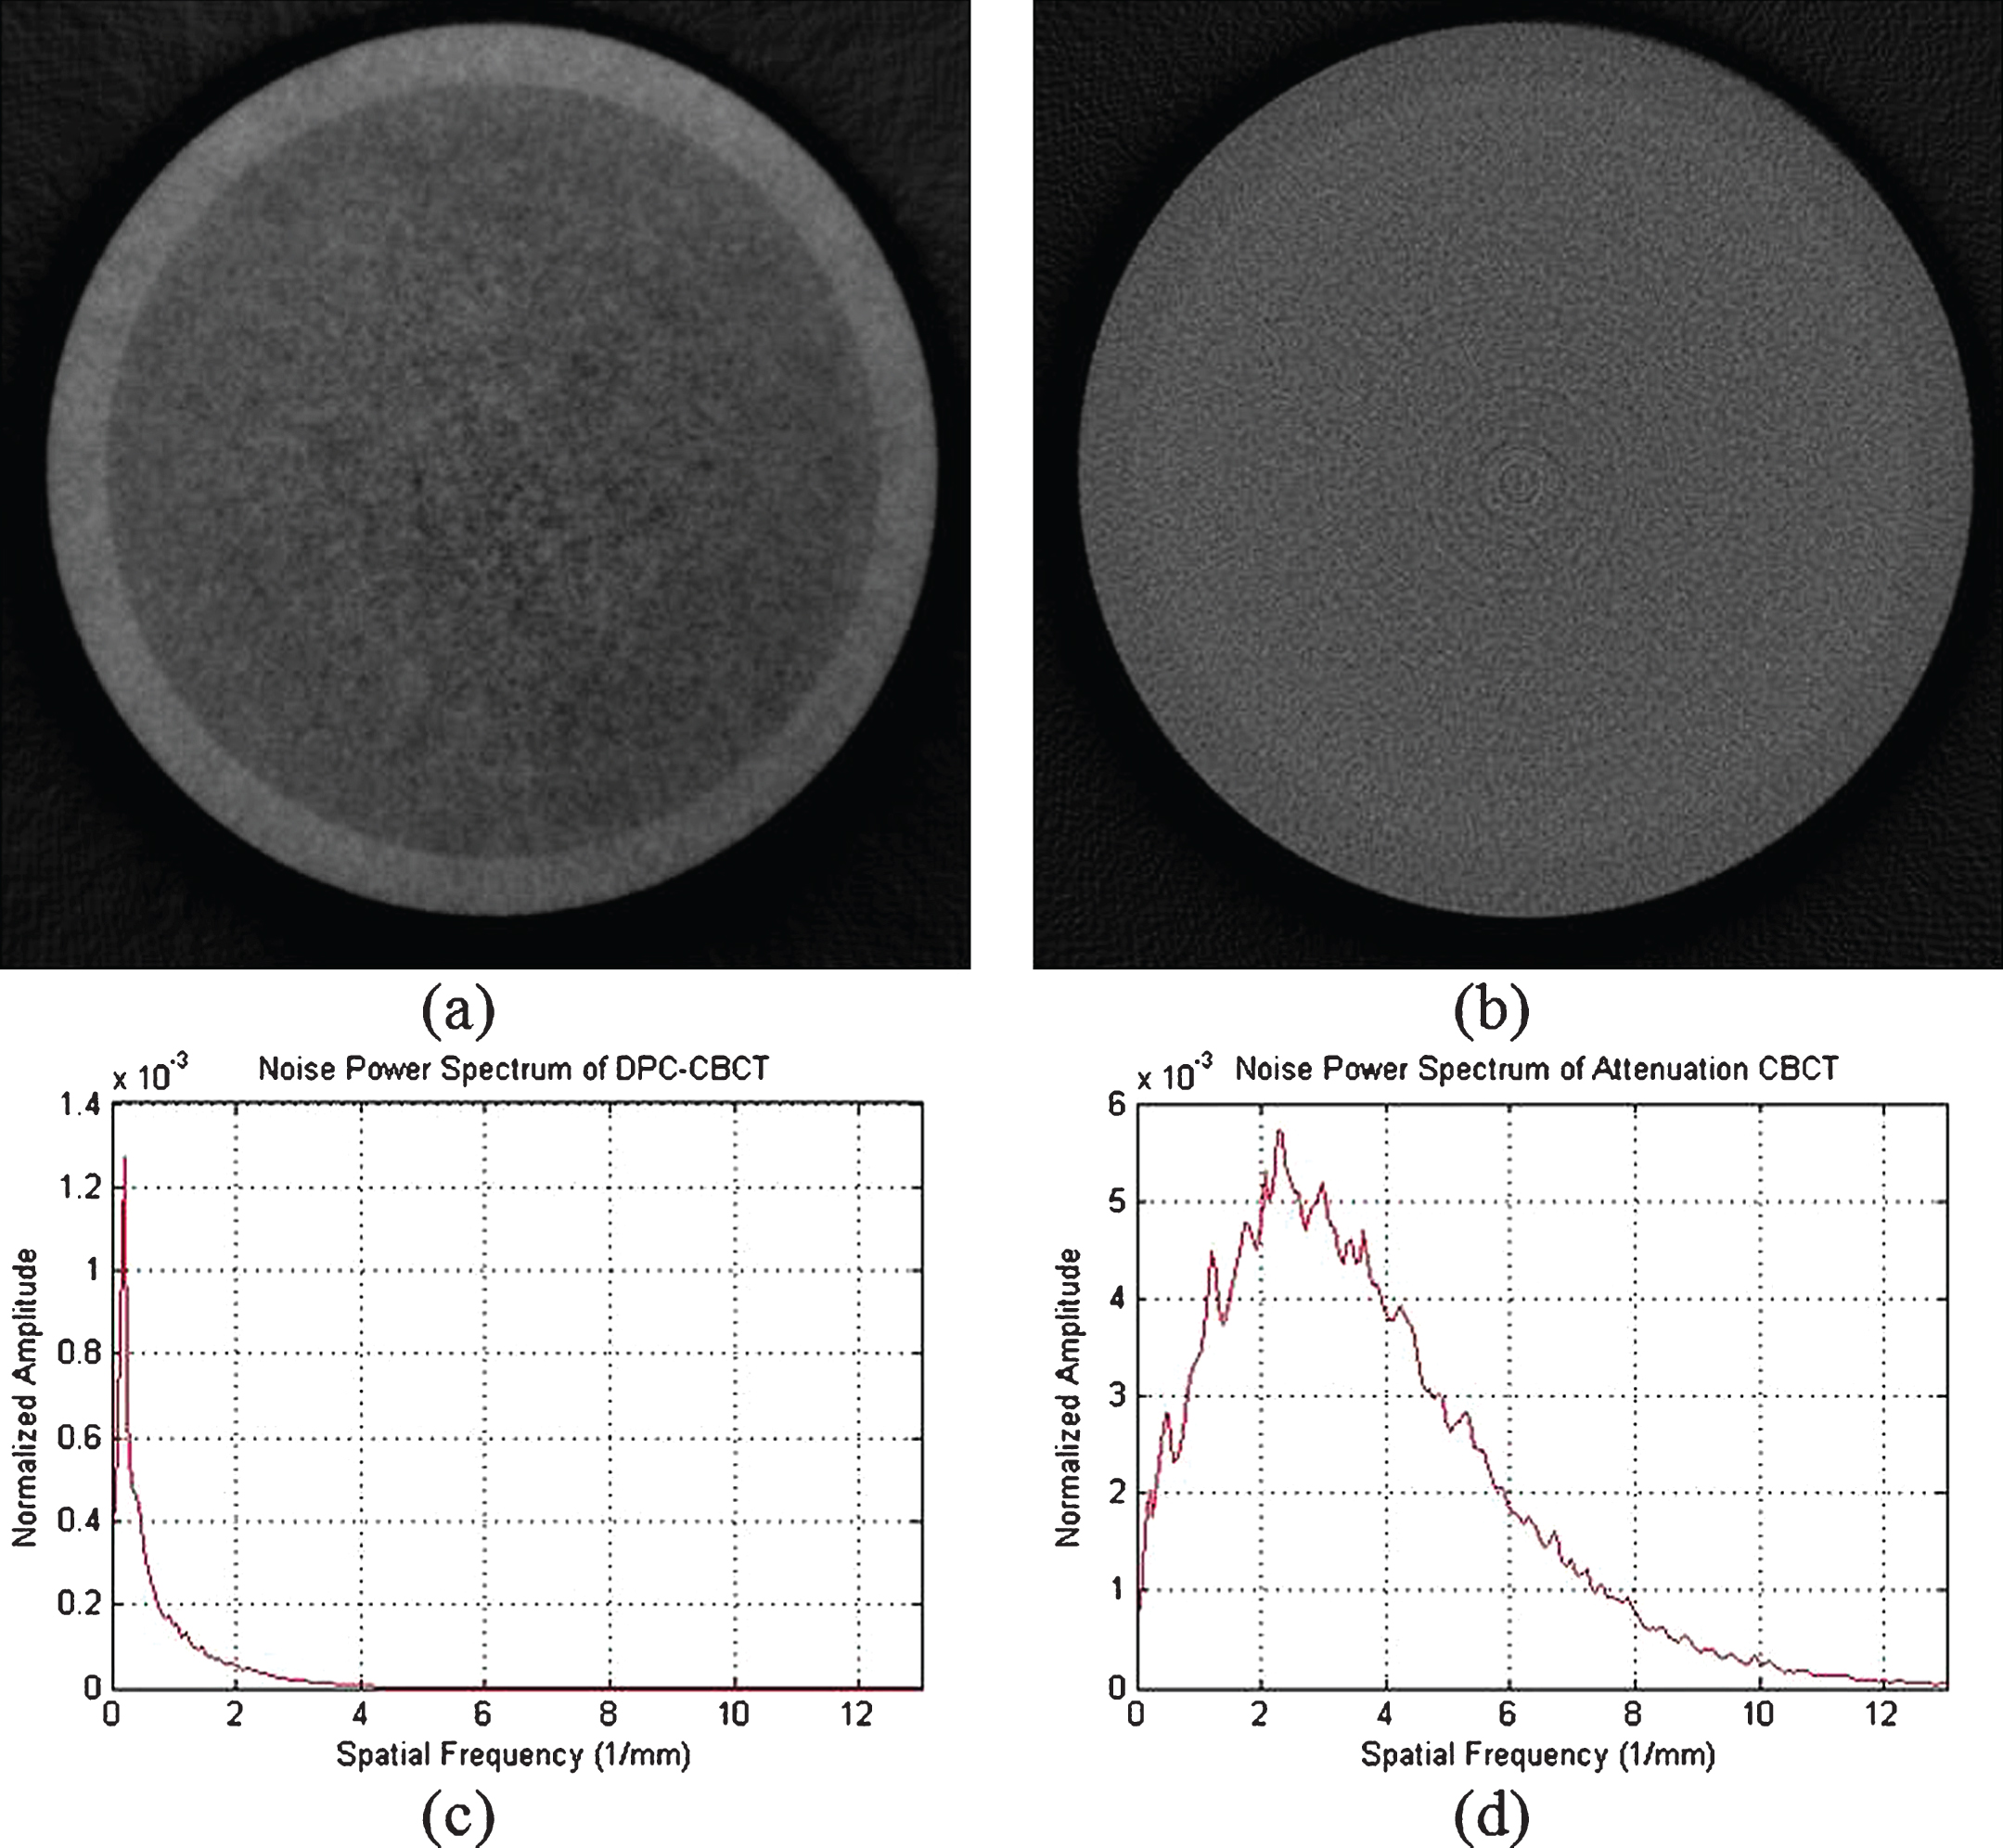
Demonstration of noise property in water only slices of (a) DPC-CBCT reconstruction image and (b) attenuation CBCT reconstruction, and noise power spectrum of (c) DPC-CBCT and (d) attenuation CBCT.
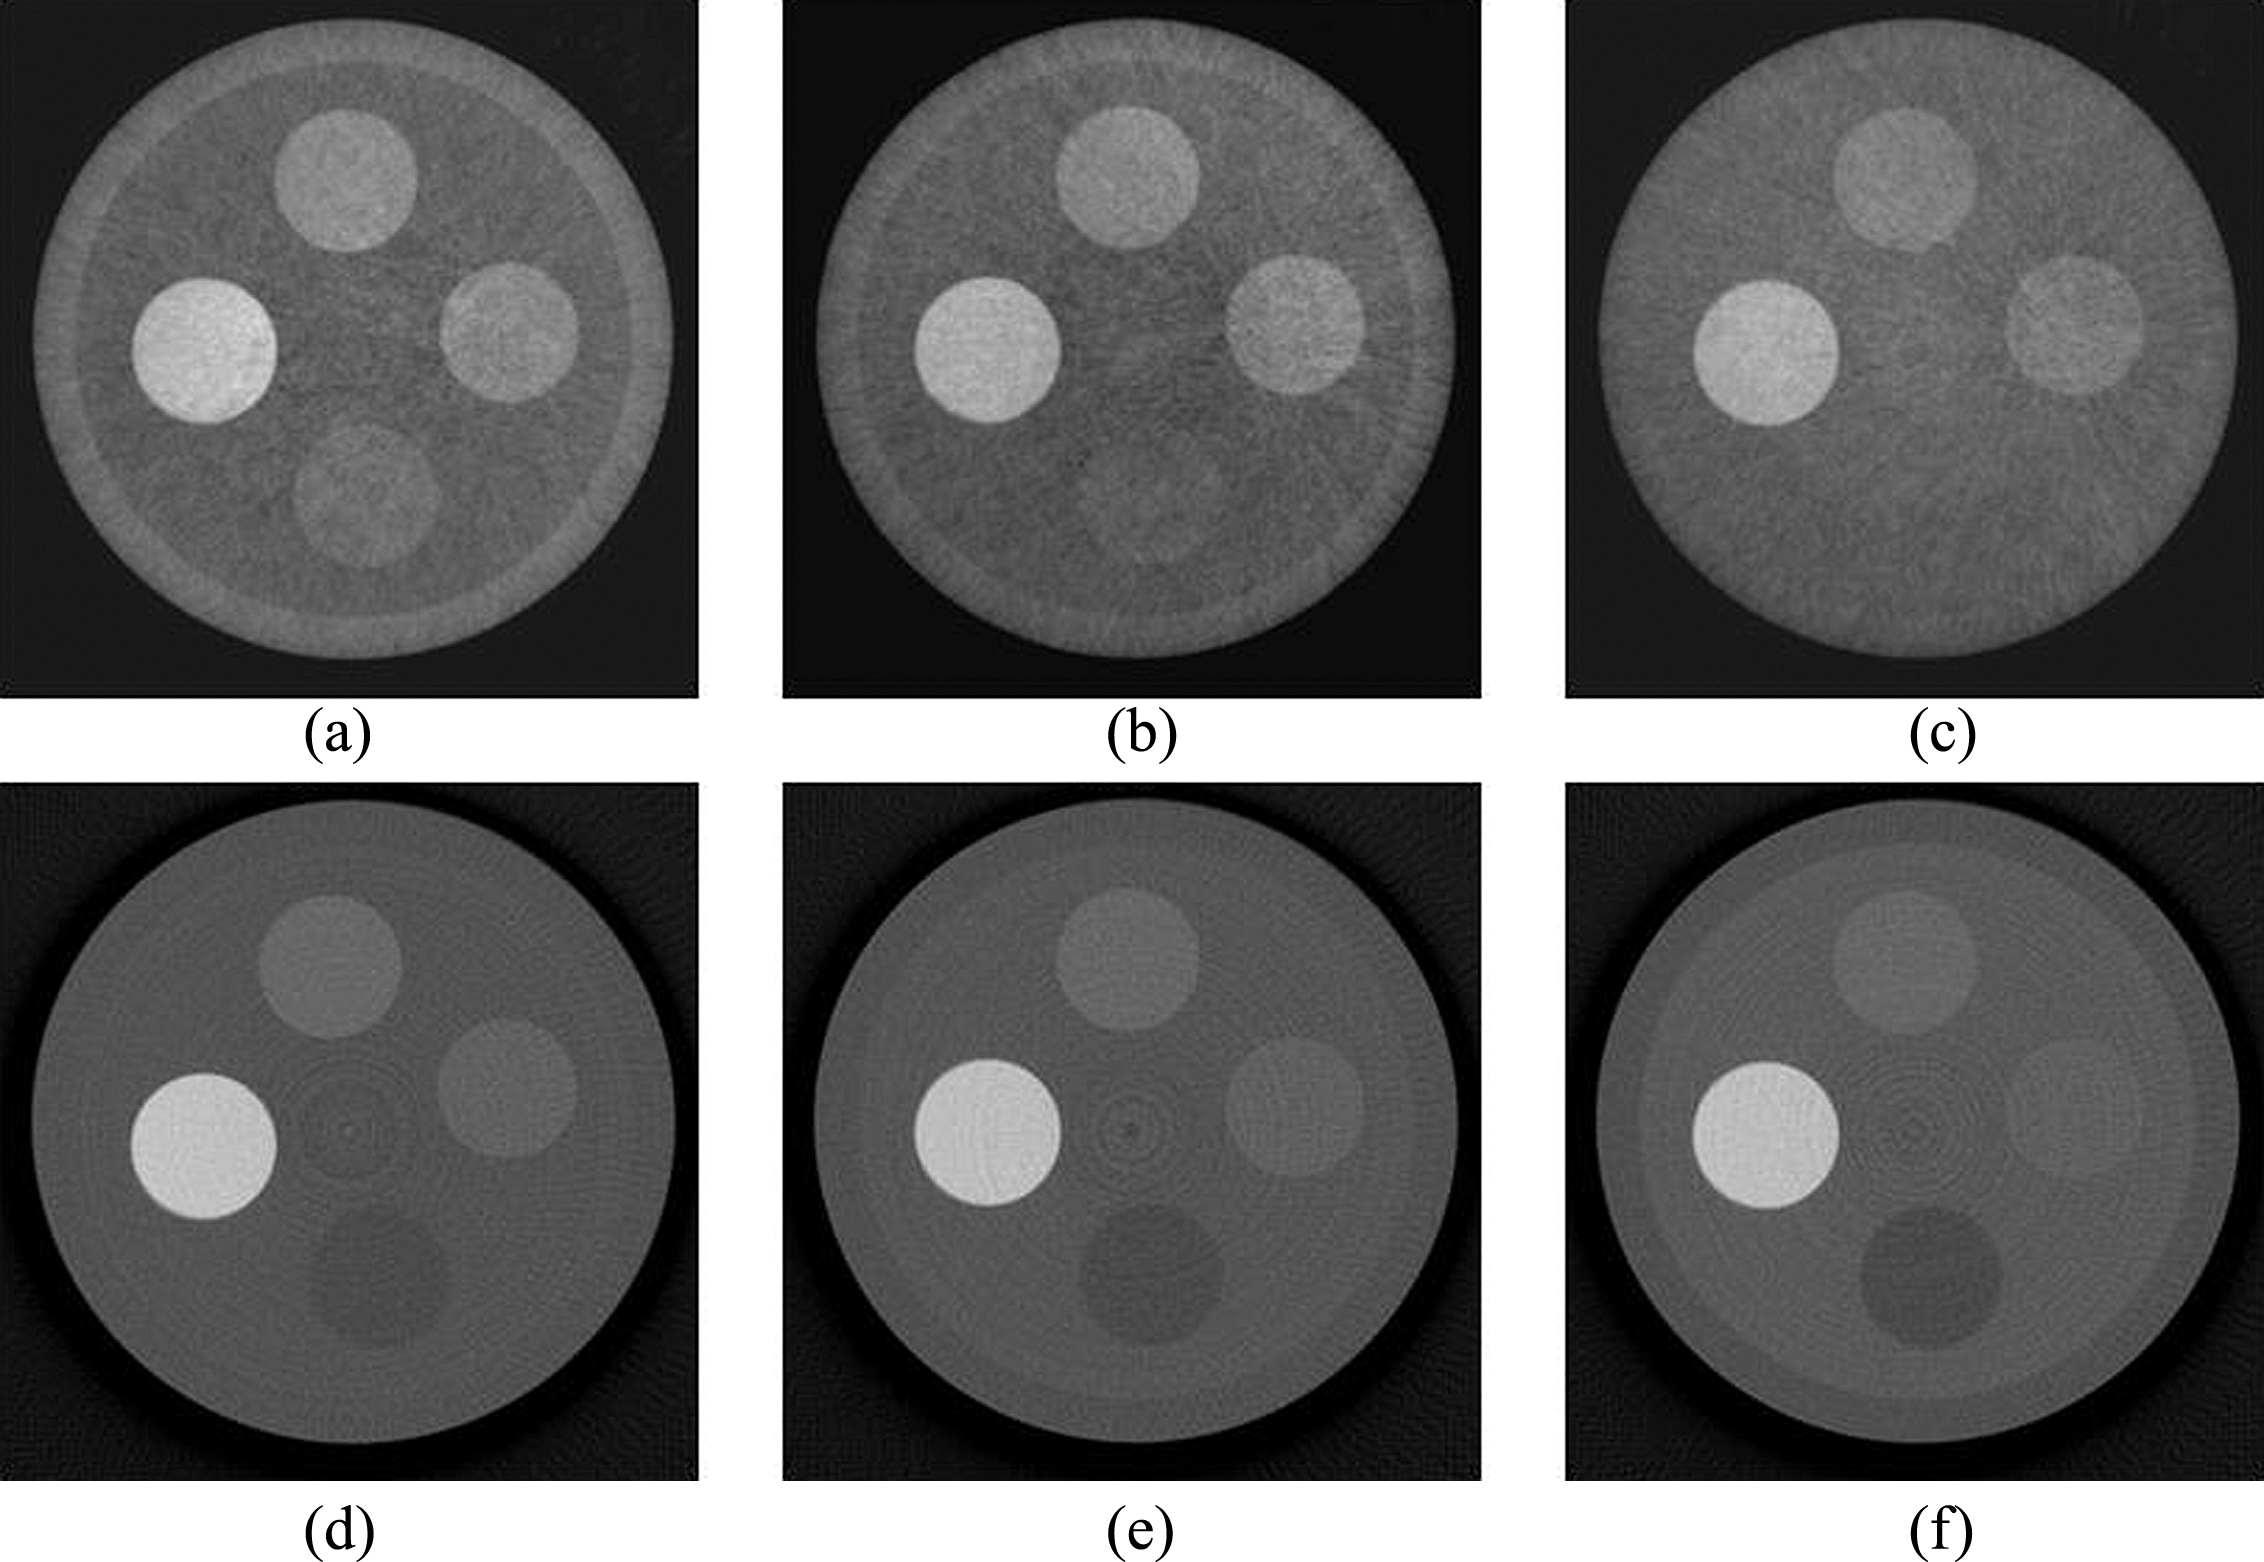
Our group has previously investigated the noise response to dose level and the result indicated that, similar to attenuation imaging, phase imaging noise also has a polynomial relationship with dose level but with a power index –0.7 instead of –0.5 [20]. In order to investigate the image quality of DPC-CBCT in response to different radiation dose levels, the cylinder phantom was scanned at three different tube currents: 50 mA, 100 mA, and 200 mA. Figure 5 demonstrates the tomographic reconstructions from both DPC-CBCT and attenuation CBCT. The CNR was measured on the material PI and shown in Fig. 6. It indicates that phase image outperforms attenuation image and the CNR become larger as the X-ray dose level goes up for both technologies. There are streak artifacts in phase images and the increase of radiation level reduces the artifacts. Lower radiation level causes more noise in DPC images as insufficient photon statistics cause more errors in the phase retrieval procedure. The noise in DPC images leads to streak artifacts in the tomographic reconstruction images. Whereas, the effect of low dose on attenuation images is less obvious (Fig. 5(d-f)). It indicates that DPC-CBCT is more sensitive to noise than attenuation CBCT and the bigger slope of CNR curve for DPC-CBCT in Fig. 6 agrees with this conclusion.
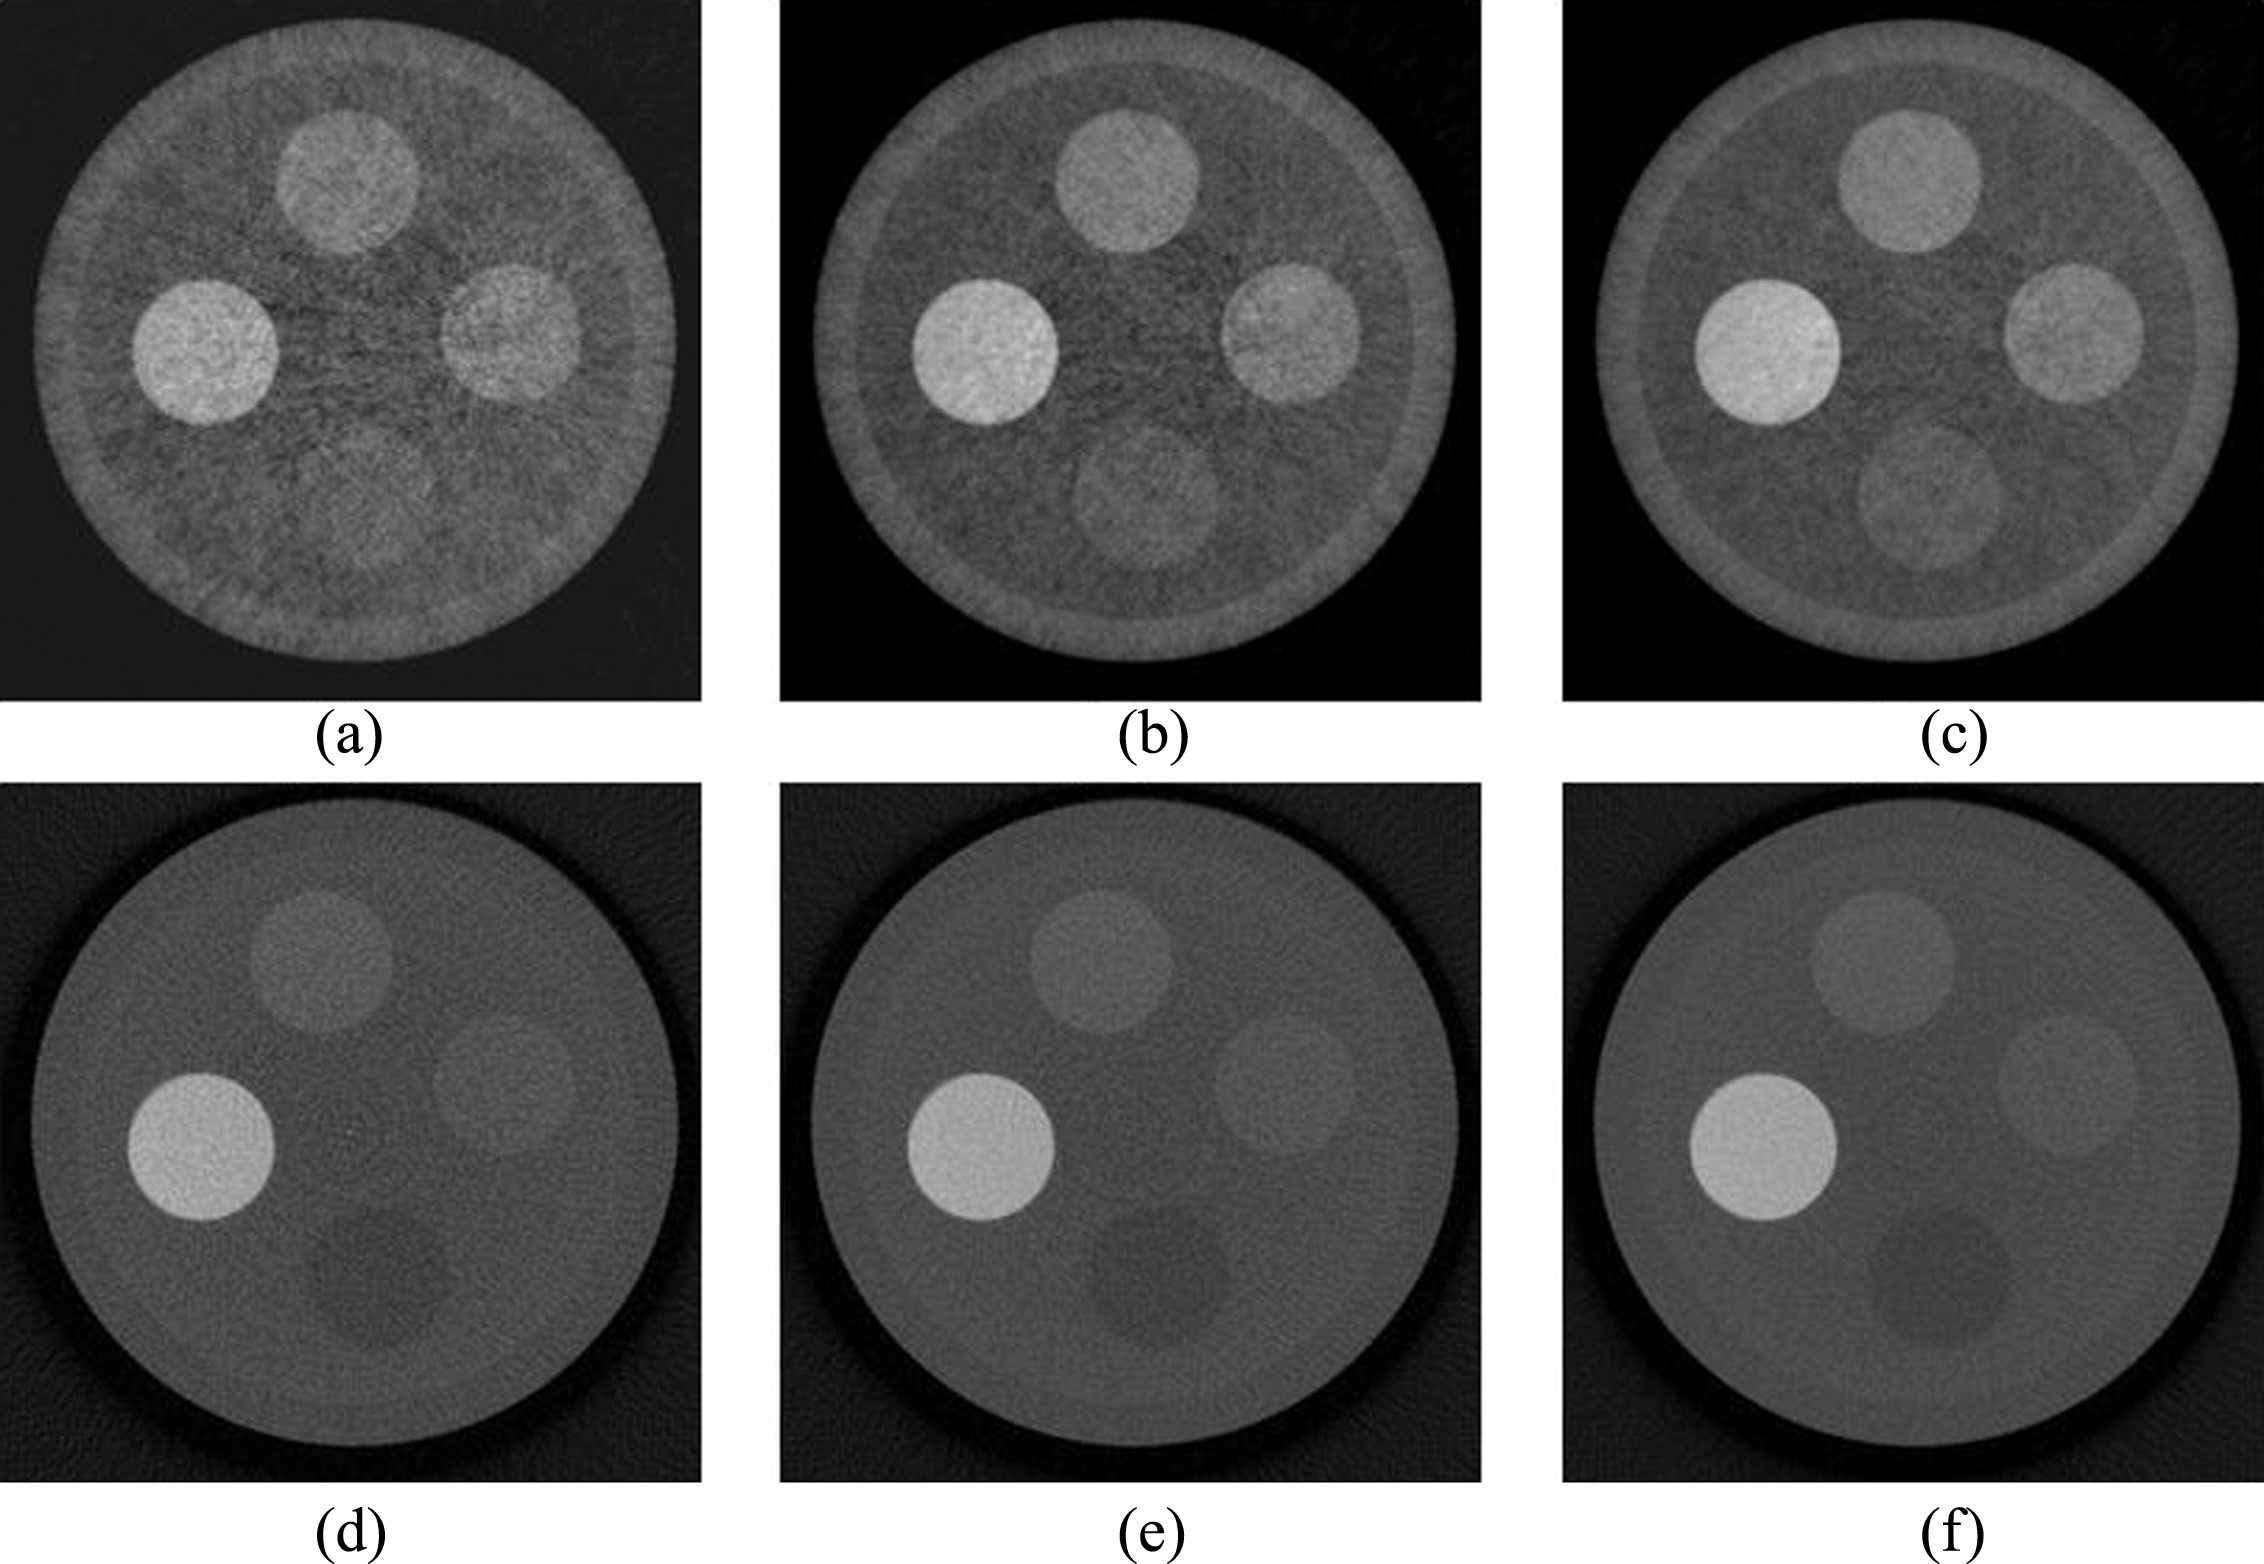
Image quality responding to different dose levels, (a-c) show DPC-CBCT results and (d-f) show attenuation CBCT results at the tube current of 50 mA, 100 mA and 200 mA respectively.
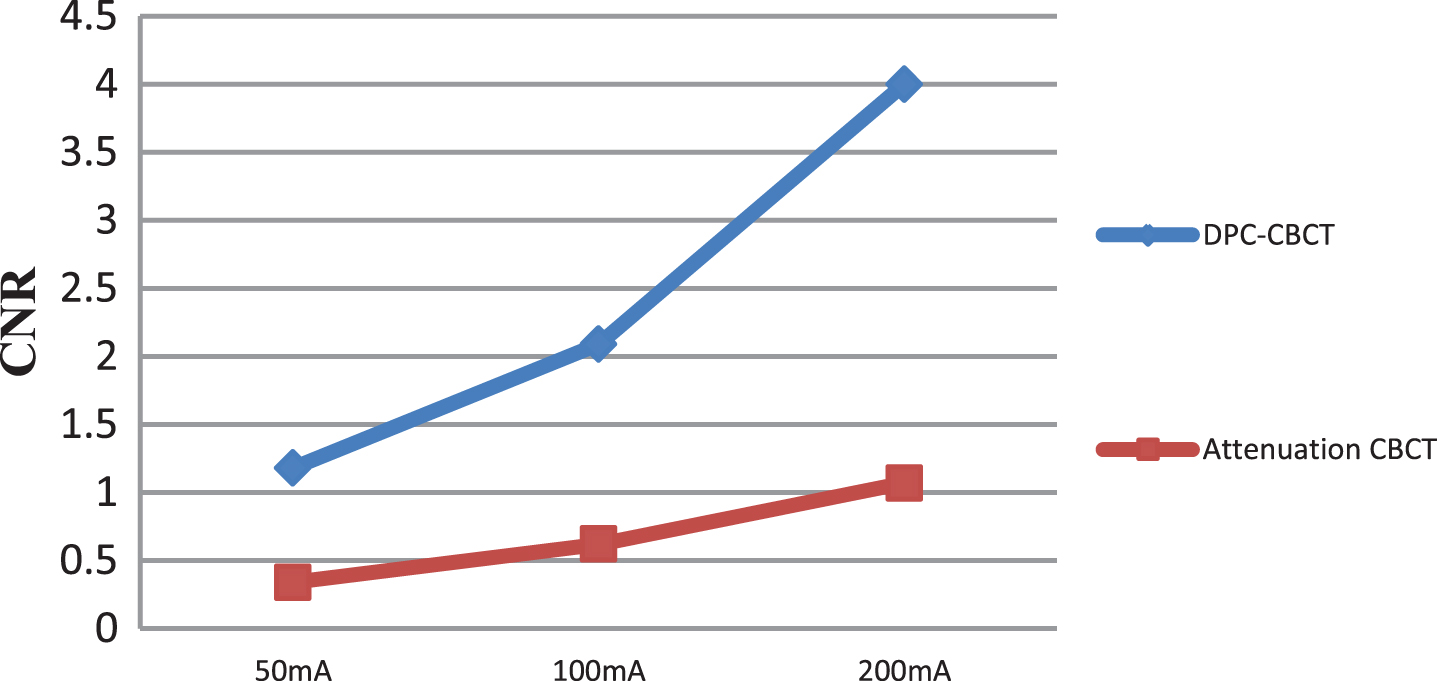
CNR of phase images and attenuation images measured at three different dose levels for material PI.
The investigation of contrast resolution was conducted by imaging the cylinder phantom filled with sugar solution of different concentrations. Figure 7(a-c) show the scan results of the phantom filled with water, 30% sugar solution, and 50% sugar solution, respectively. As the sugar concentration goes up, the phase coefficient of the background liquid becomes larger. The phase coefficient of PTFE is the closest to that of water and it is clearly visible in Fig. 7(a). In Fig. 7(b), when the 30% sugar solution replaced water, the background brightness was raised up, the contrast of PTFE against sugar solution was just big enough to be distinguishable. However, in Fig. 7(c), where the background brightness was further increased, PTFE is no longer visible and the inner boundary of the phantom wall also disappeared. This means that the acrylic wall, the 50% sugar solution and PTFE have similar phase coefficients. PTFE and sugar solution are used to estimate the contrast resolution of DPC-CBCT. The relative contrast of PTFE against background liquid in Fig. 7(b) is measured to be 2.1%, which means that DPC-CBCT system is able to differentiate materials with a contrast of 2.1%. As for the attenuation images, the sugar solution also raised the attenuation coefficient of the background since the background becomes brighter from Fig. 7(d) to (f). The phantom wall is barely distinguishable from the water in Fig. 7(d), yet clearly visible in Fig. 7(f) because the attenuation coefficient difference was raised by sugar solution. Phantom wall and sugar solution are used to estimate the contrast resolution of attenuation CBCT. Since the phantom wall is just detectable in Fig. 7(e) and the contrast against background was measured to be 3.5%, meaning that the contrast resolution of attenuation CBCT is 3.5%.
Tomographic DPC-CBCT slices of phantom filled with (a) water, (b) 30% sugar solution, and (c) 50% sugar solution. (d-f) are the corresponding attenuation slices.
Another set of experiments were carried out to investigate how DPC-CBCT differentiates physiological saline (0.9% saline solution) and dextrose solutions of different concentrations. The four cavities of the cylinder phantom were inserted with four small cylinder containers that contain 0.9% saline, 16% dextrose solution, 33% dextrose solution and 50% dextrose solution, respectively, and the phantom body was filled with water. The tomographic reconstruction images are shown in Fig. 8 and Table 2 displays both phase coefficients and attenuation coefficients (normalized to water) of the liquids. The small container walls appear bright in phase images and dark in attenuation images because the wall material (acrylic) has a bigger phase coefficient but a smaller attenuation coefficient than water. Figure 8 and Table 2 indicate that both the phase coefficient and the attenuation coefficient of saline are close to water, and that both coefficients of dextrose increase with concentration. The contrast between 16% dextrose and 50% dextrose is calculated to be 5.83% in the phase image and 3.29% in the attenuation image, meaning that DPC-CBCT imaging yields about 77% of improvement compared with attenuation CBCT in terms of contrast.
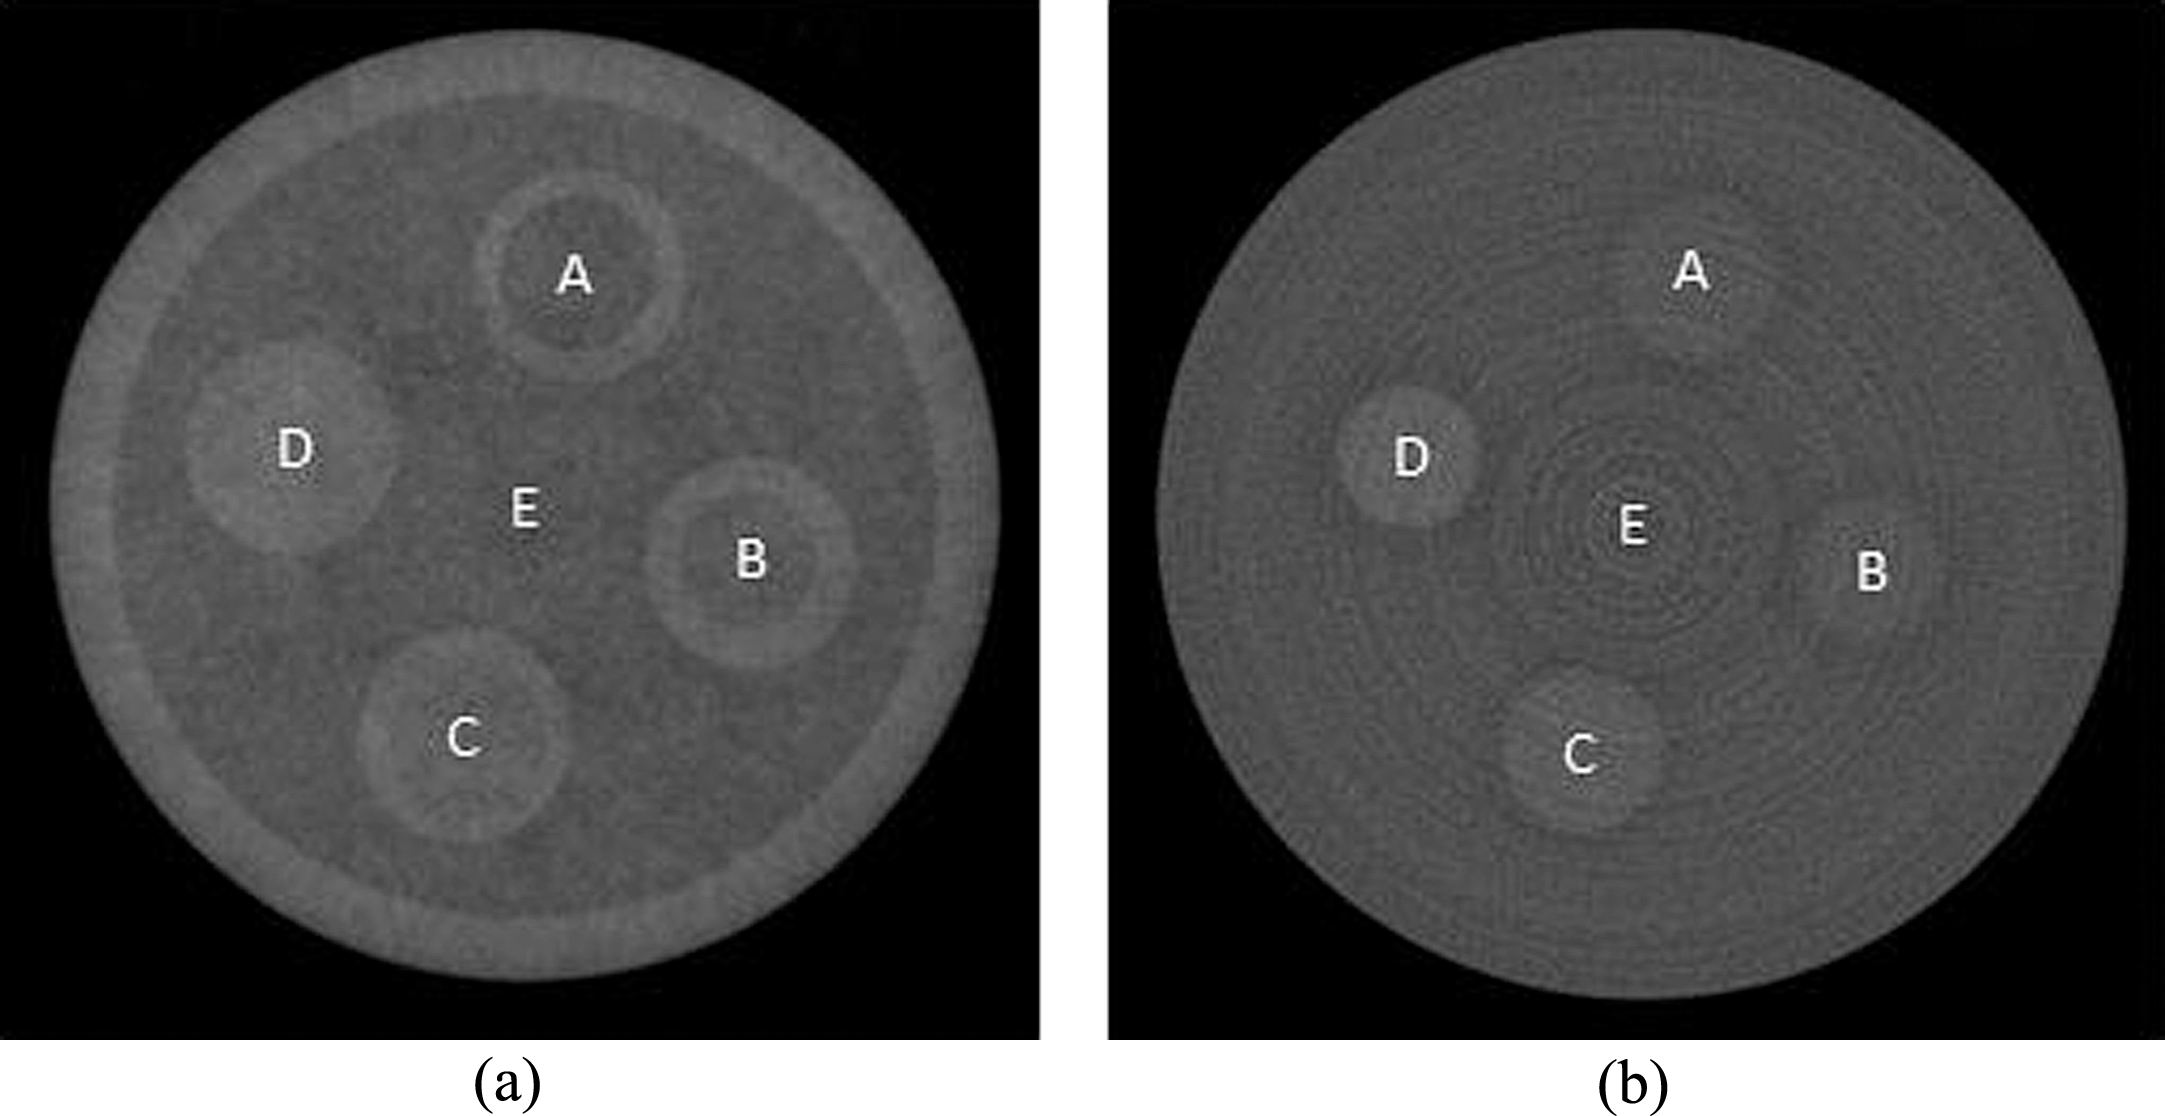
Scan of the phantom that contains saline and different concentration dextrose, (a) is a slice of the DPC-CBCT and (b) is the corresponding slice from attenuation CBCT (A: saline, B: 16% dextrose, C: 33% dextrose, D: 50% dextrose, E: water).
Normalized phase coefficients and attenuation coefficients of different liquids
Figure 9 shows the tomographic phase images and attenuation images for two human breast specimens. Two types of tissues (glandular tissue and fat) are detectable and the CNR in phase images is measured to be similar to that in attenuation images. The attenuation images obviously have better visual perception. The boundary between different tissues is sharper in attenuation images, whereas it is blurred by low-frequency noise in phase images. As indicated in Fig. 9(b), attenuation image is able to manifest the calcification (∼368 μm) very well, whereas in the phase image, the calcification is barely visible.
(a) and (c) show one tomographic slice of each specimen from DPC-CBCT, (b) and (d) show the corresponding slices from attenuation CBCT.
A pork specimen that consists of a layer of skin, a layer of adipose, and a layer of lean meat was also scanned. As shown by Fig. 10, the attenuation image again yields better sharpness at tissue boundaries. Phase coefficients and attenuation coefficients were measured for the three types of tissues, as given by Table 3 (normalized to adipose tissue). The contrast between adipose and lean is calculated to be 10.71% in phase image and 18.37% in attenuation image and their CNRs are similar. The phase image visual perception is inferior to that of the attenuation image due to low contrast and low frequency noise. A typical example is that there are a few small pieces of lean in the adipose near the skin, they are clearly visible in attenuation image but missing in phase image because they have a similar texture to the low frequency noise.
Tomographic images of fresh pork specimen from DPC-CBCT (a) and attenuation CBCT (b).
Normalized phase coefficients and attenuation coefficients of adipose, lean and skin in pork specimen
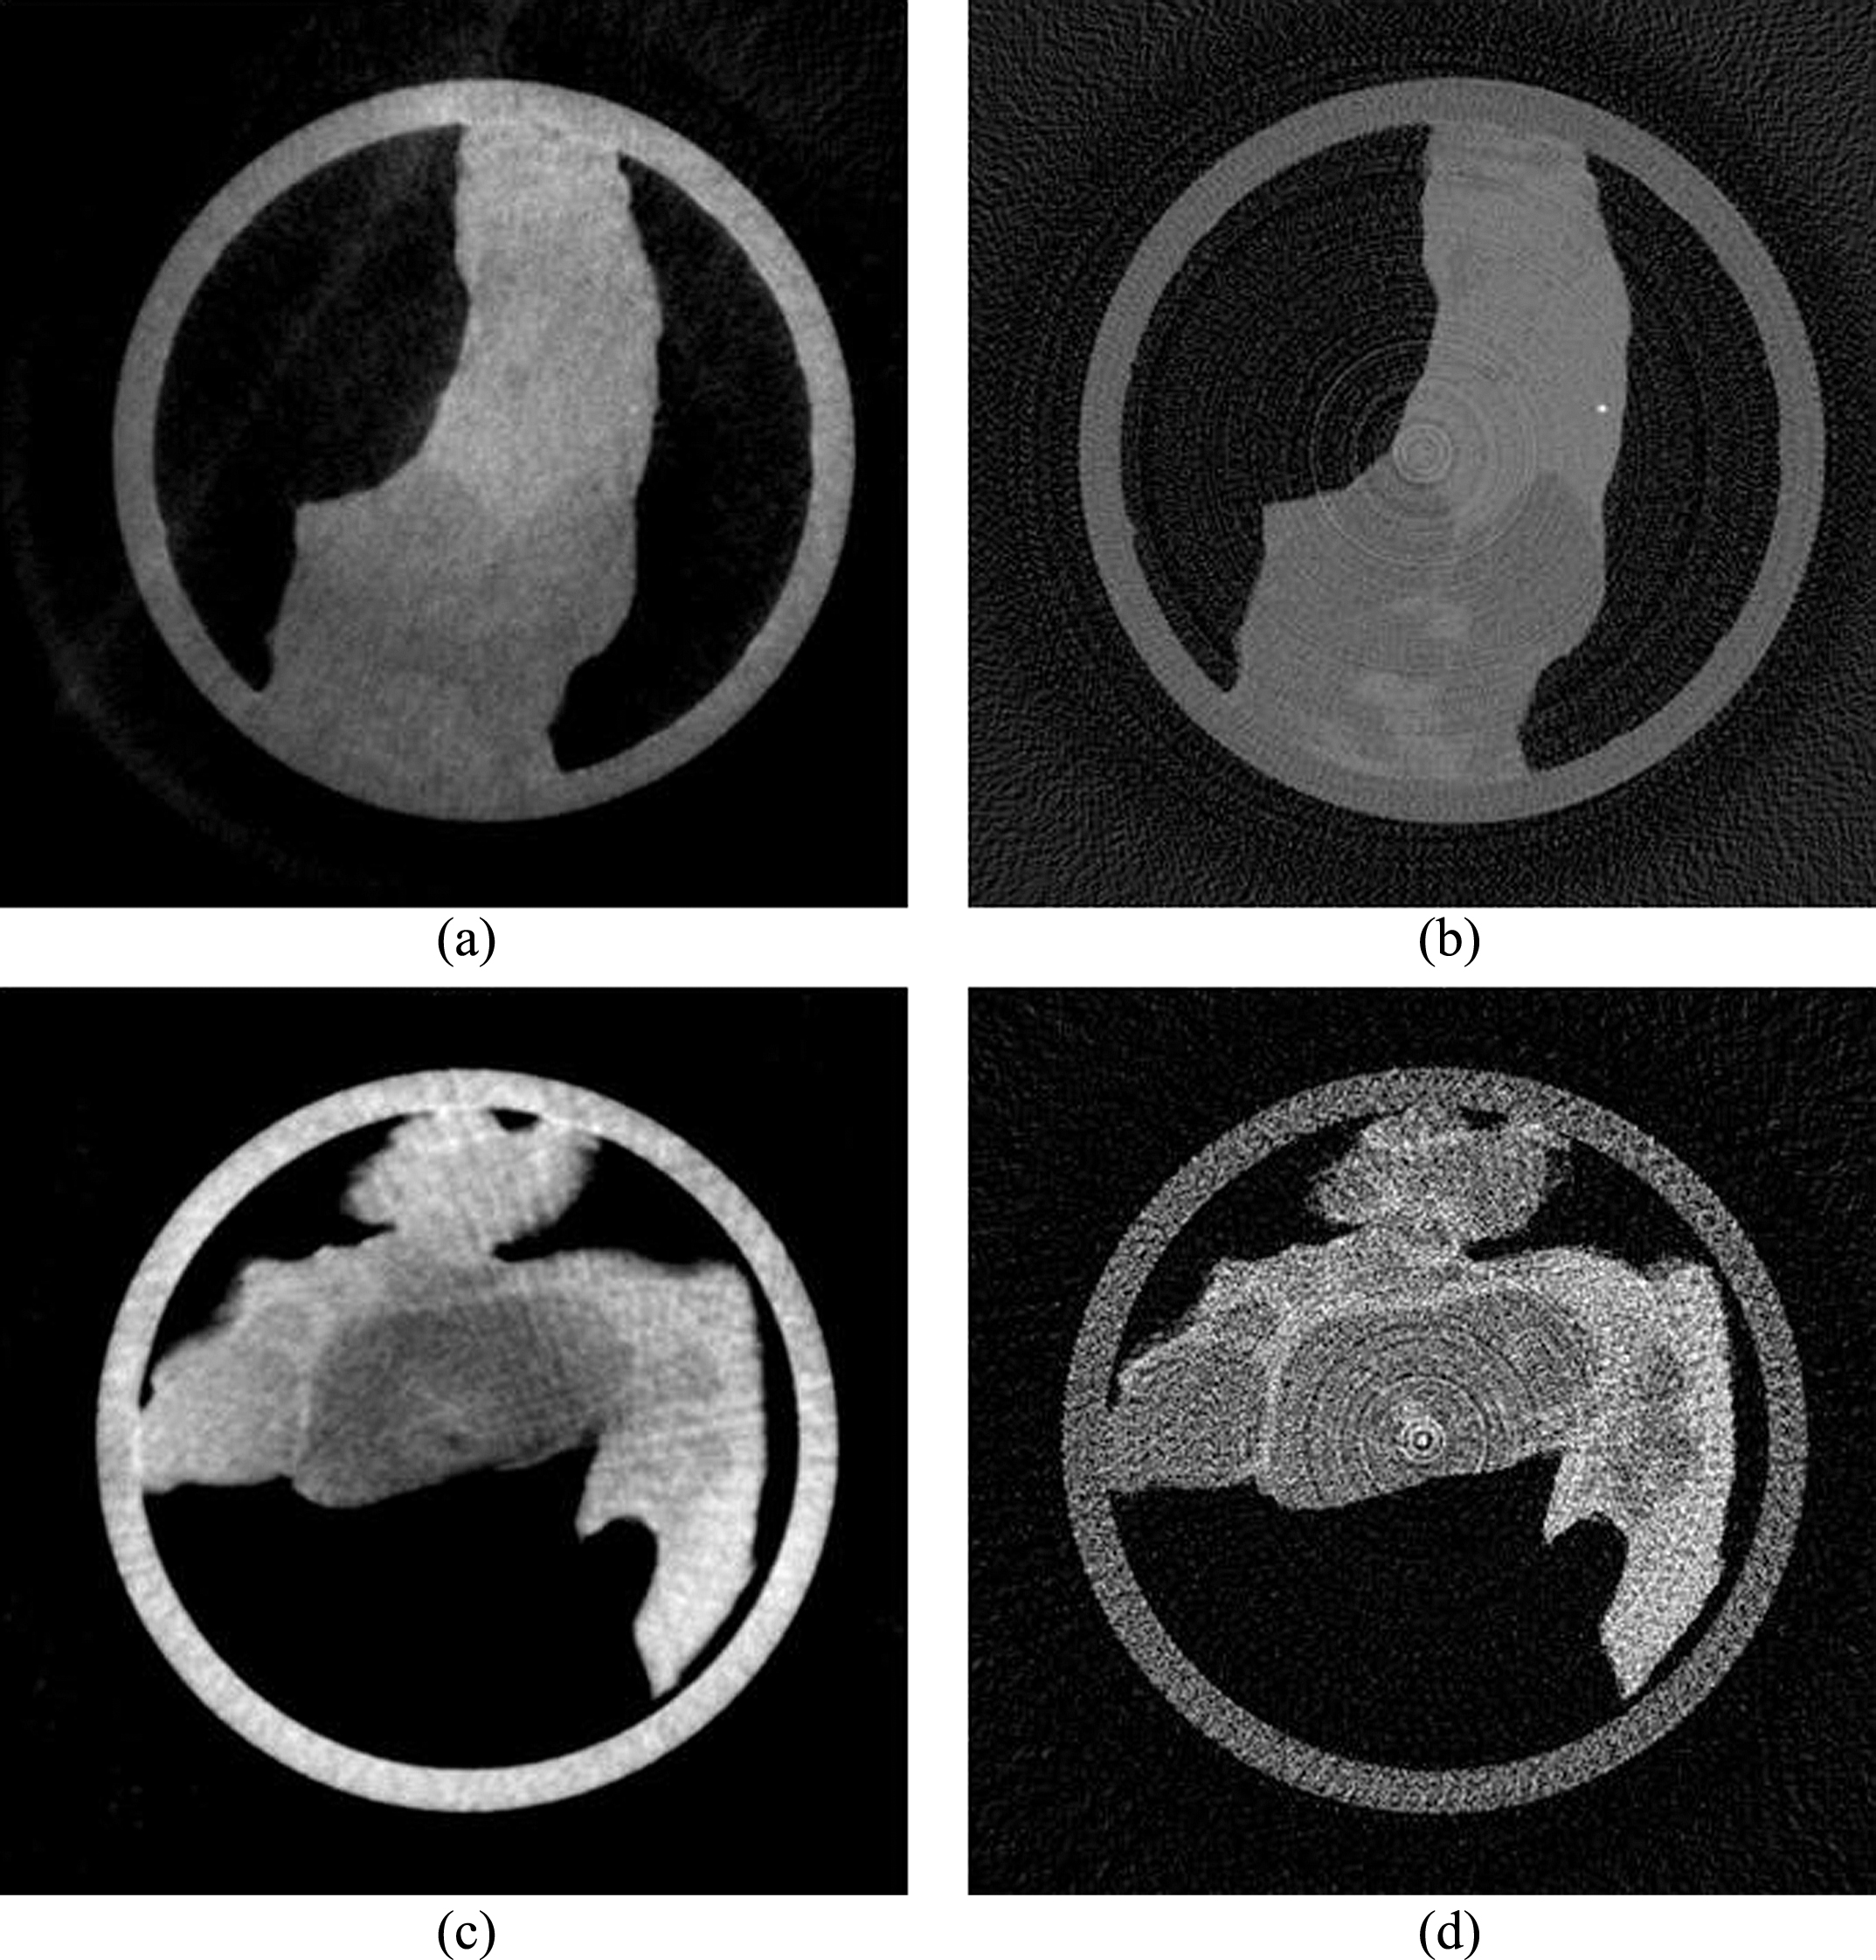
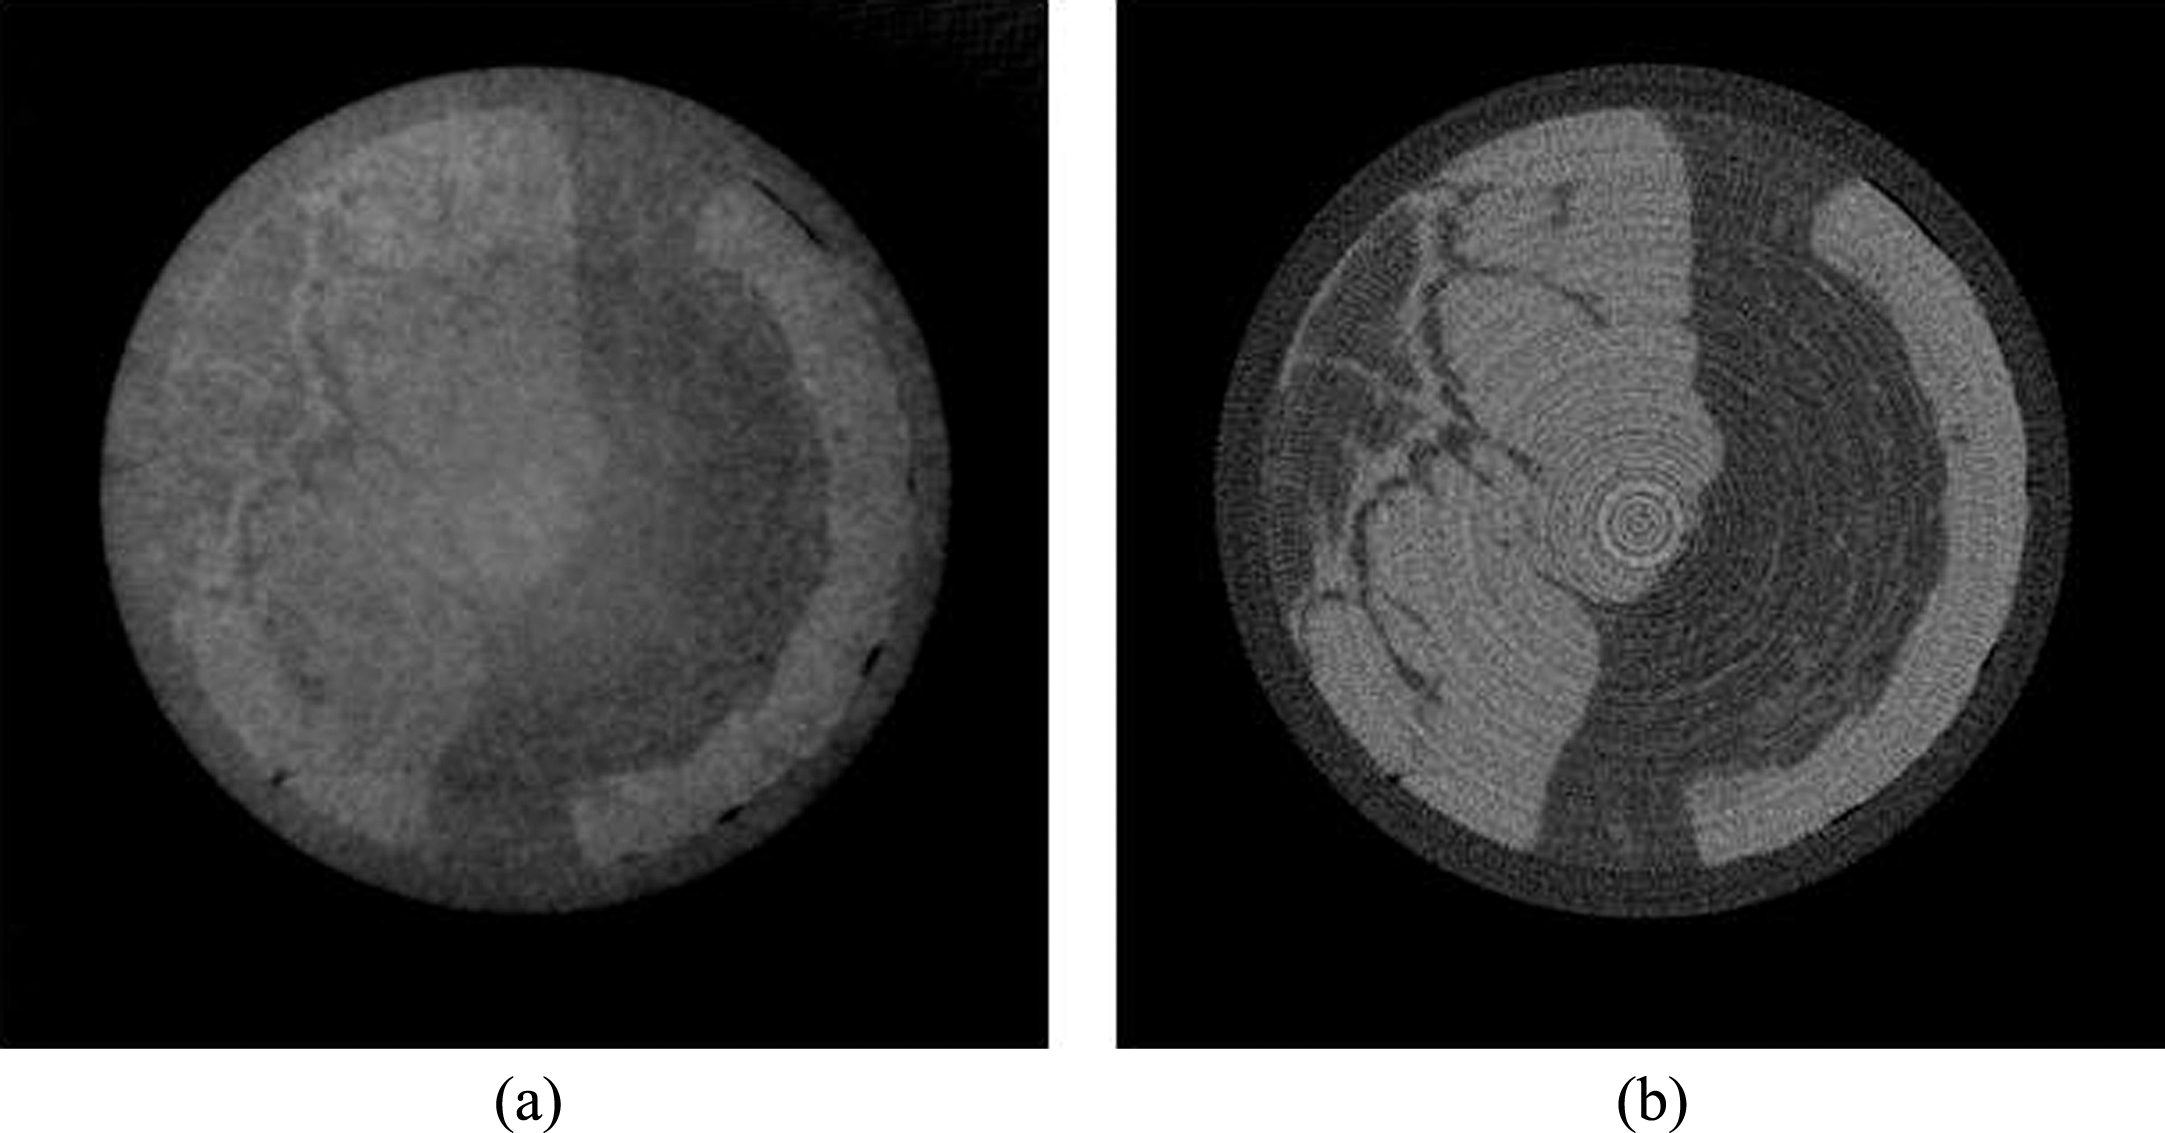
Figure 11 presents the scan result of a mouse. Attenuation image has better sharpness for the internal air and the bones. As for soft tissues, attenuation image yields better sharpness and detectability, whereas in phase image they are barely distinguishable due to low frequency noise, low contrast and severe streak artifacts around the mouse body. The second row of Fig. 11 presents an attenuation projection image and a DPC image. In the DPC image, the overall noise level is higher. The theory is that, as small structure, the skin hair causes significant small-angle scattering to X-rays and degrades the coherence property, and non-coherent X-rays lead to phase retrieval error. The mouse body is covered with hair and thus the overall noise is high. The peripheral area has much higher density of skin hair and thus results in pure error.

Experimental results of scanning a mouse, (a) and (c) are a tomographic slice and a projection image of attenuation CBCT, (b) and (d) are a tomographic slice and a DPC image of DPC-CBCT.
Although the phantom study indicates that the overall performance of DPC-CBCT is better than attenuation CBCT, the real tissue images from DPC-CBCT are outperformed by attenuation CBCT in terms of sharpness, tissue and calcification detectability. The basic reason of the inconsistent performance of DPC-CBCT is that phase contrast imaging greatly depends on the coherence of X-ray beams, and the coherence is easily degraded by the imaged object. Inhomogeneous objects, such as hairs, bones and soft tissues, usually have many internal density fluctuations or micron-level structures that produce small-angle scattering and create non-coherent X-ray beams. The coherence level determines fringe contrast, which is an important characteristic of a DPC imaging system. Noise can cause phase retrieval errors and low fringe contrast has a low tolerance to noise. DPC-CBCT shows better performance for phantom study because the materials and the liquids are relatively homogeneous. As attenuation contrast imaging does not rely on the coherence property of X-rays, its performance of imaging small animal and soft tissues is not affected. In order to quantitatively investigate X-ray coherence loss caused by an object, in the next section, dark-field imaging is used to reveal the level of micro-structures of an object.
Experimental results indicate that the fringe contrast is affected by materials. Pixel intensities during phase stepping in a mouse scan were tracked and demonstrated in Fig. 12. The background (air) shows very good fringe contrast with large amplitude and great sinusoidal trend, the tissue shows disturbed trend and reduced fringe contrast, but the hair shows no trend at all. Therefore, in the retrieved DPC image, the background and the container wall have low noise, the tissue has higher noise, and not surprisingly the hair is pure noise.
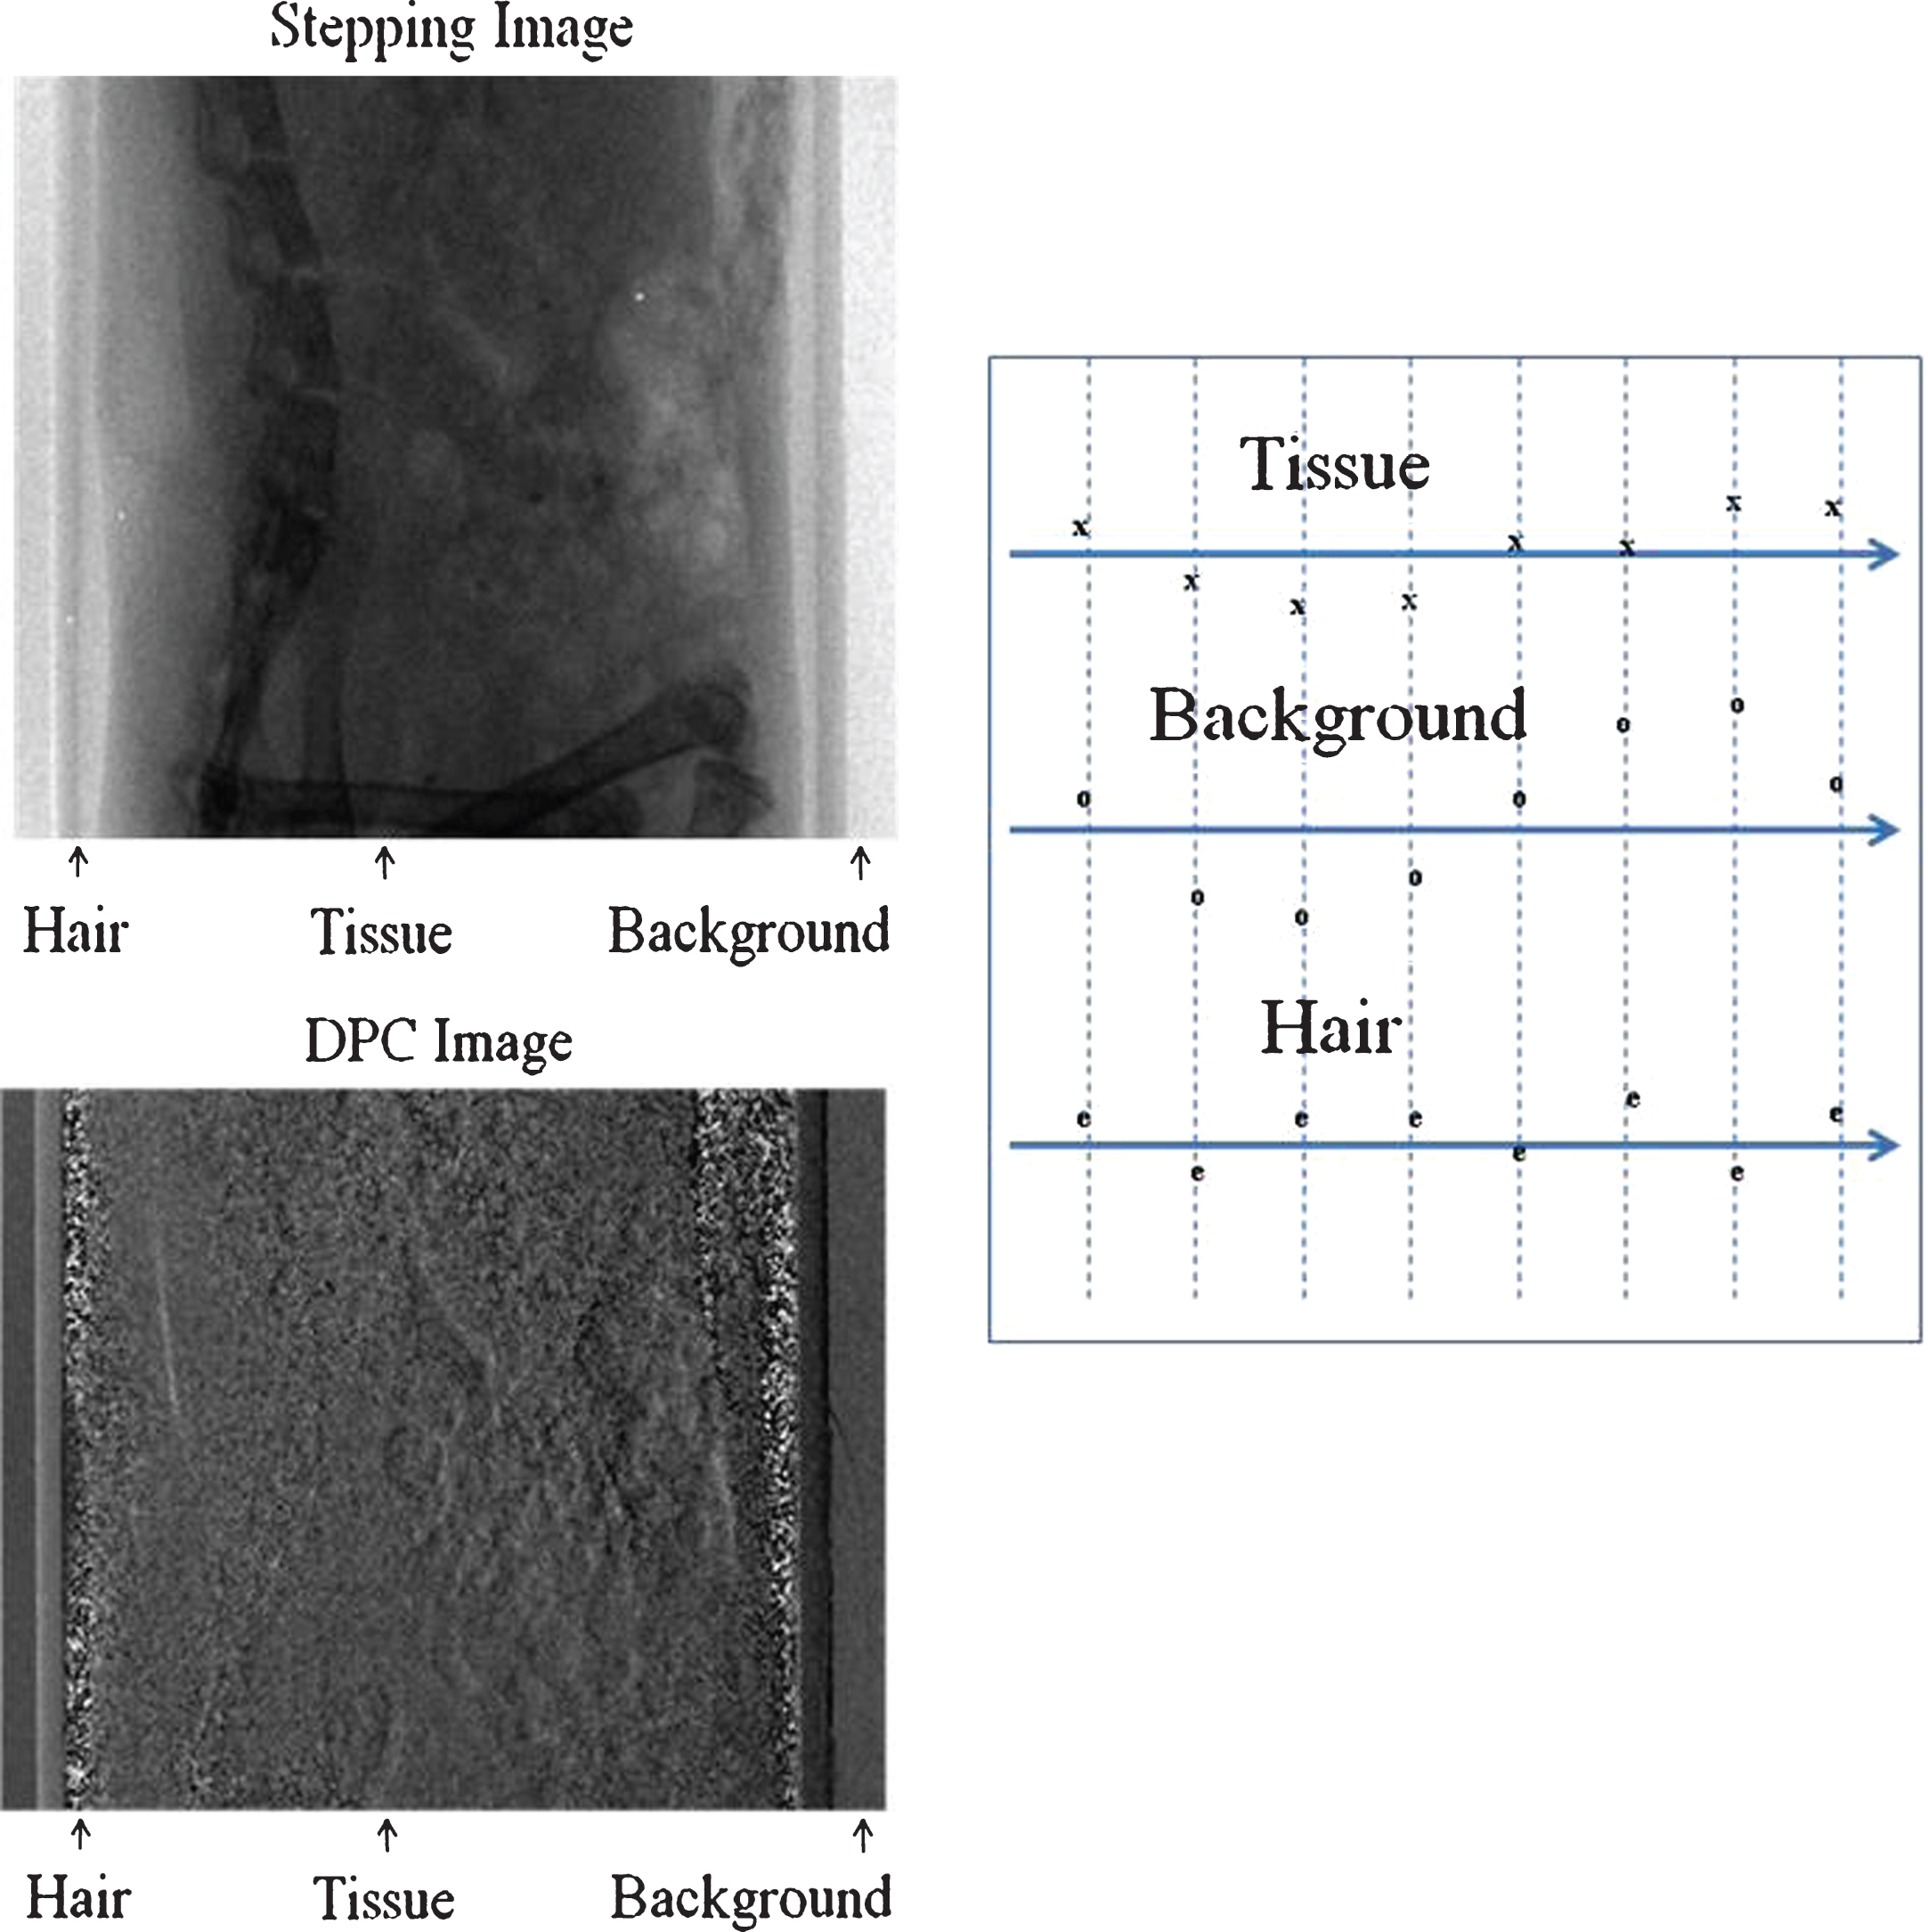
Demonstration of fringe contrast for different tissues. The plots on the right side represent the sinusoidal trends for tissue, background air, and hair. Eight data points on each plot were obtained as the average pixel values of the corresponding material in eight stepping images.
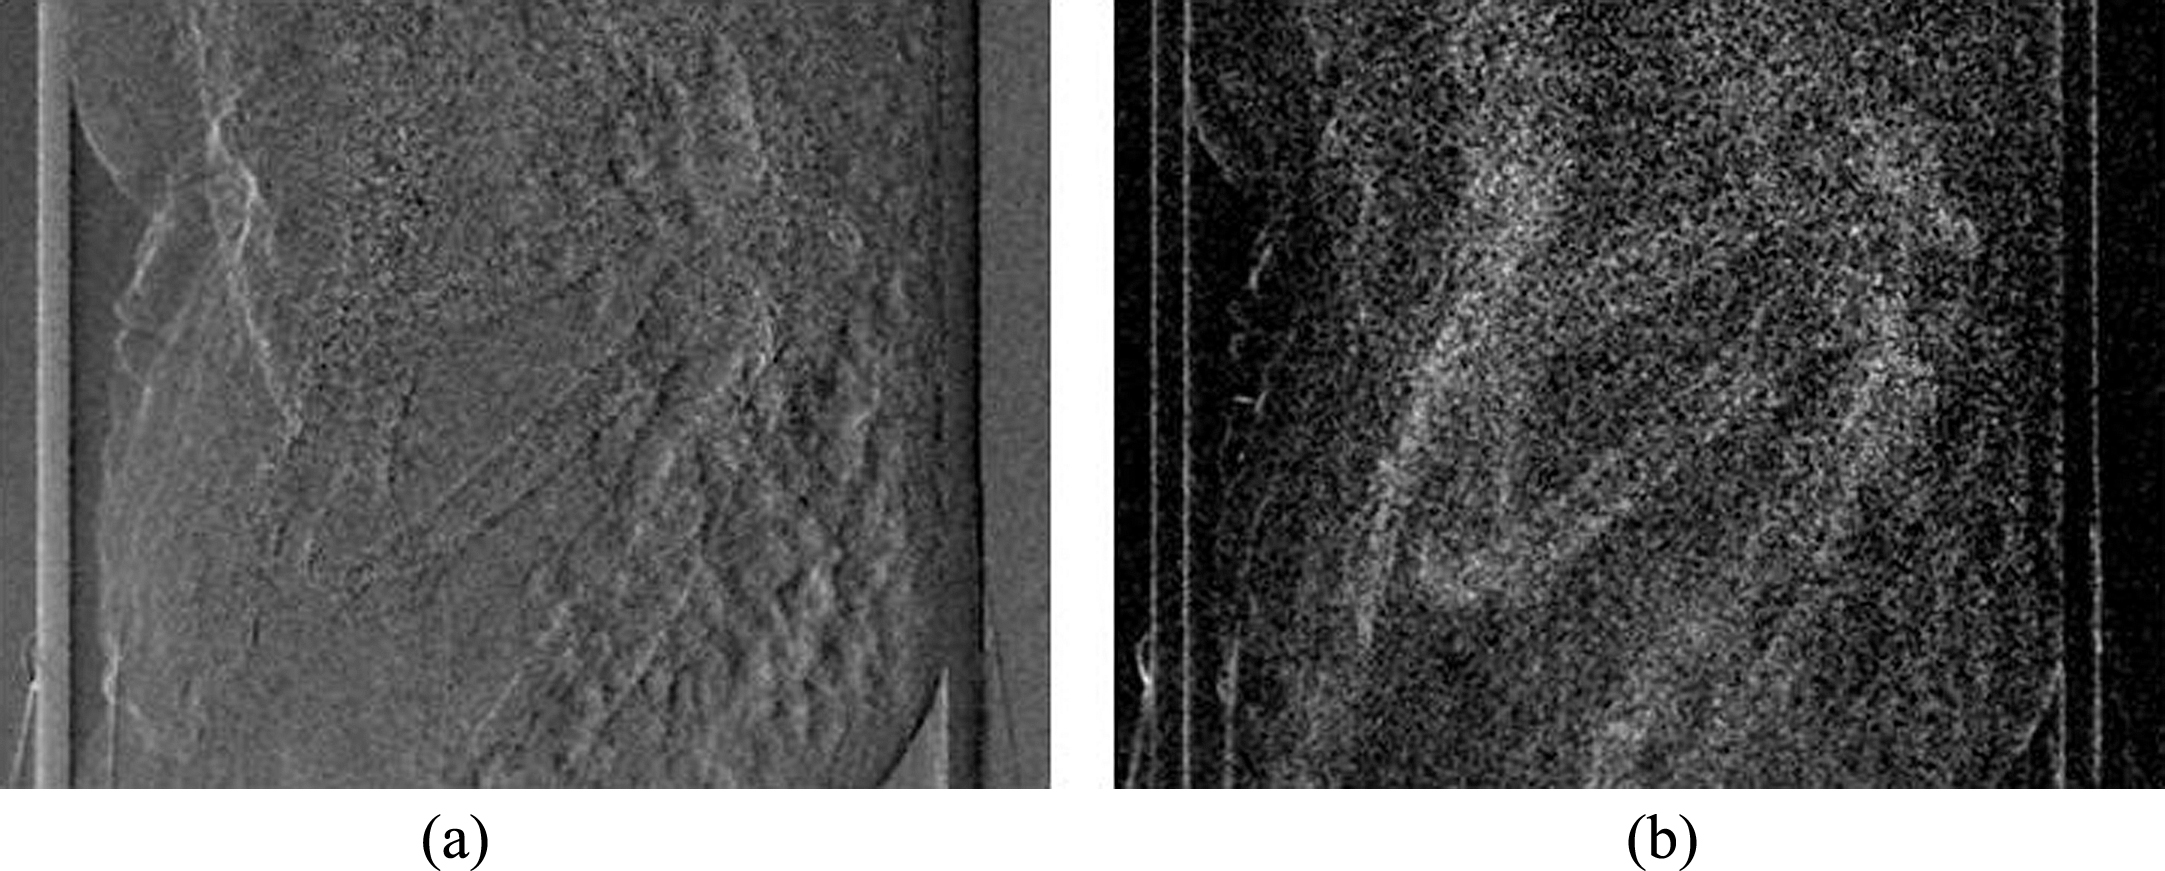
Figure 13 shows a DPC image and the corresponding dark-field image of the mouse scan. In the dark-field image, high pixel value means high small-angle scattering power, and obviously the hair areas are the brightest. The skin hair is not visible in the attenuation image (the stepping image in Fig. 12) because it has negligible attenuation effect, whereas, as fine structure, it can produce significant small-angle scattering and thus coherence loss. It should be noted that there is also significant coherence loss all over the body because it is covered by skin hair. This explains the reduced image quality and streak artifacts of the tomographic phase image.
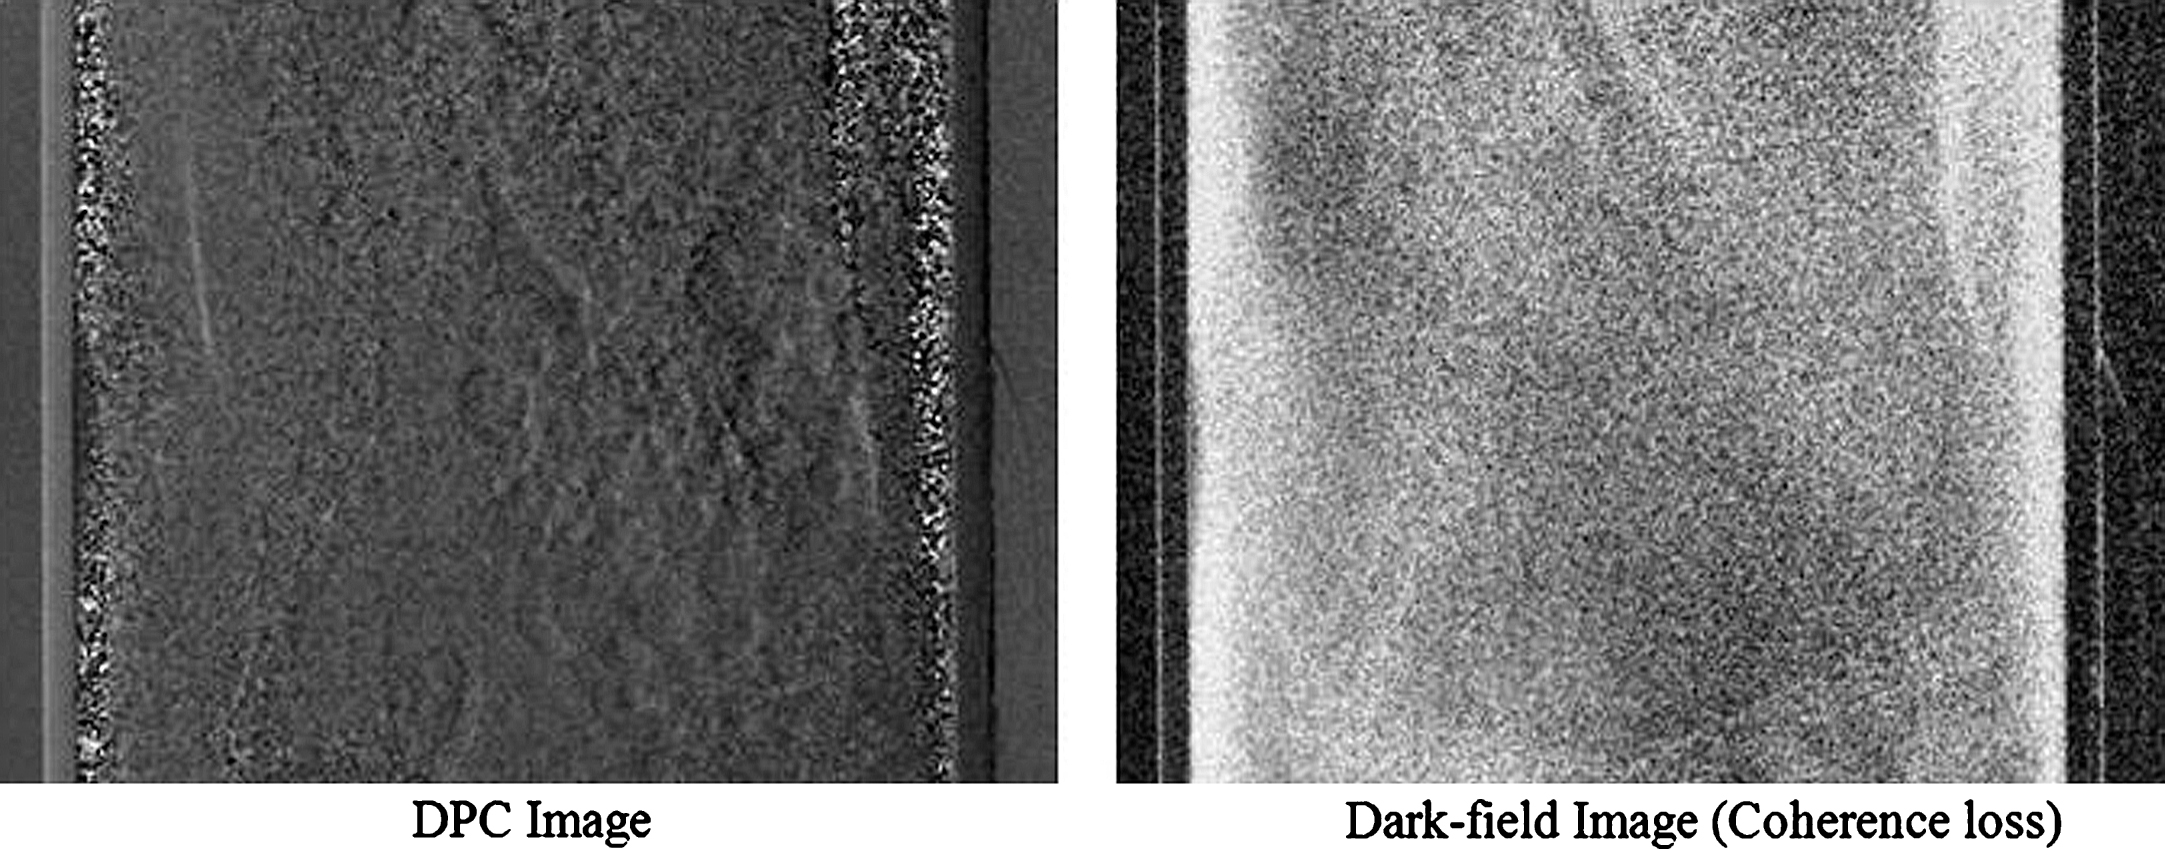
Comparison of DPC image and dark-field projection image of a mouse.
Since dark-field imaging provides quantitative fringe contrast loss, it could be used to locate phase retrieval errors in DPC images and reduce artifacts for phase contrast imaging. The idea could be simply described as: if the pixel value in the dark-field image exceeds a threshold value, the corresponding pixel in the DPC image is corrected by an averaging mask. The dark-field image guided noise reduction method is applied to the mouse data. Figure 14 shows DPC and tomographic images before and after correction. It is obvious that the corrected DPC image has much less phase errors and the tomographic image shows less artifacts.
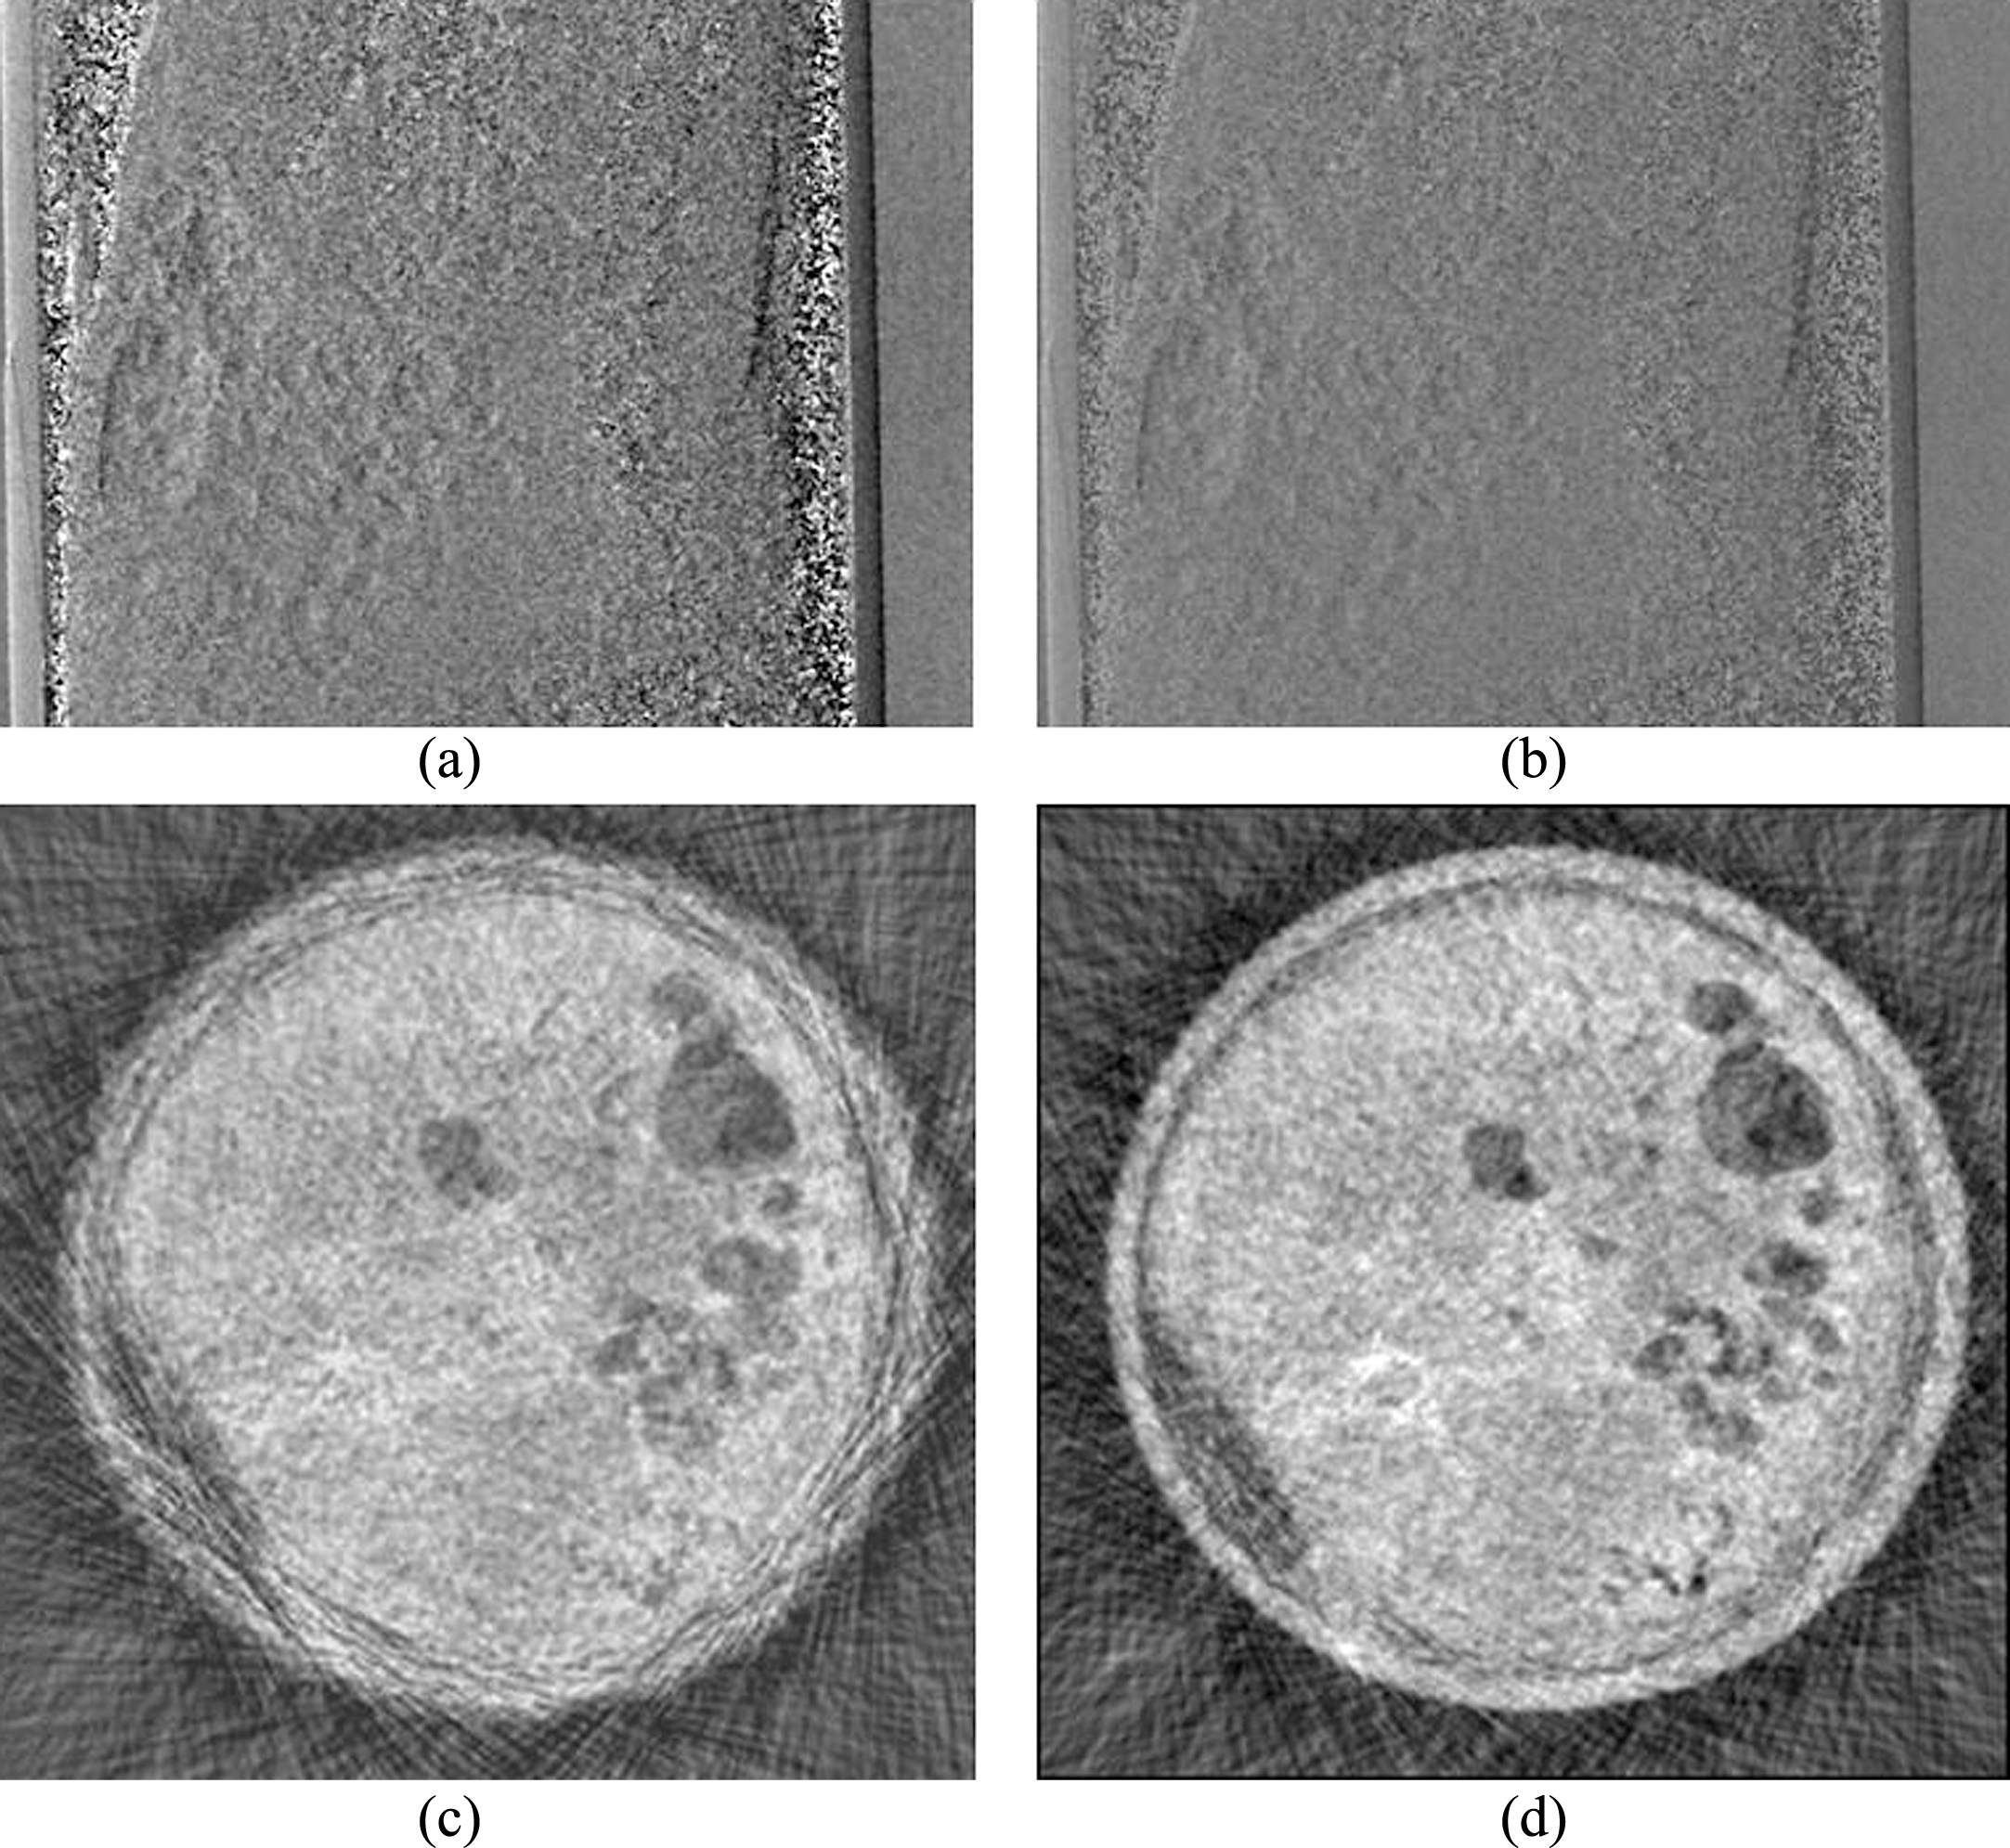
DPC image of an ordinary mouse (a) and the improved DPC image using dark-field image guided correction (b), (c) and (d) are tomographic slices before and after correction.
In another experiment, the skin hair of a mouse was removed and a DPC image and a dark-field image were retrieved (Fig. 15). Compared with Fig. 13, the overall brightness of the dark-field image is significantly reduced, and more details are revealed. This means that there is much less coherence loss. One can note that in the dark-field image, bones are brighter than other tissues, meaning that bones cause more small-angle scattering than soft tissues due to internal inhomogeneity. The fringe contrast was measured on each material as shown in Table 4. When no object is in X-ray path (background air), the fringe visibility is 90–95%. However, when soft tissue, bones, and skin hair are present in the field of view, the fringe visibility was reduced to 70–80%, 30–50%, and <20%, respectively.
Comparison of DPC image and dark-field image of a hairless mouse.
Fringe contrast of different tissues measured from mouse scans
As phase retrieval relies on the identification of the sinusoidal density oscillation during phase stepping, noise can deform the oscillation curve and result in errors. A computer simulation was performed to investigate the relationship between noise tolerance and fringe contrast. In the simulation, a virtual phantom was scanned and DPC images were retrieved. The phantom consists of a big cylinder with a diameter of 6 mm and a small cylinder with a diameter of 0.5 mm inside the big cylinder. Uniform white noise of different levels was added to each stepping image. The noise level is defined as the ratio of the noise amplitude to the oscillation amplitude I max in Equation (6). The investigation was performed at three different fringe contrasts (10%, 30%, and 50%), which were achieved by varying I min in Equation (6).
Figure 16 illustrates the effect of stepping image noise on the DPC images when the fringe contrast is 30%. Increased stepping image noise leads to increased DPC image noise. The fourth image can barely distinguish the small cylinder because high level noise deformed the oscillation trend. The last image hardly shows any pattern because very little phase information was correctly retrieved. Figure 17 plots the relationship between DPC image noise level and stepping image noise level. As the stepping image noise increases, the DPC image noise of fringe contrast of 10% was first maxed, and that of fringe contrast of 50% was lastly maxed. This means that lower noise level can cause total error to a lower fringe contrast. In other words, lower fringe contrast is less tolerant to noise.
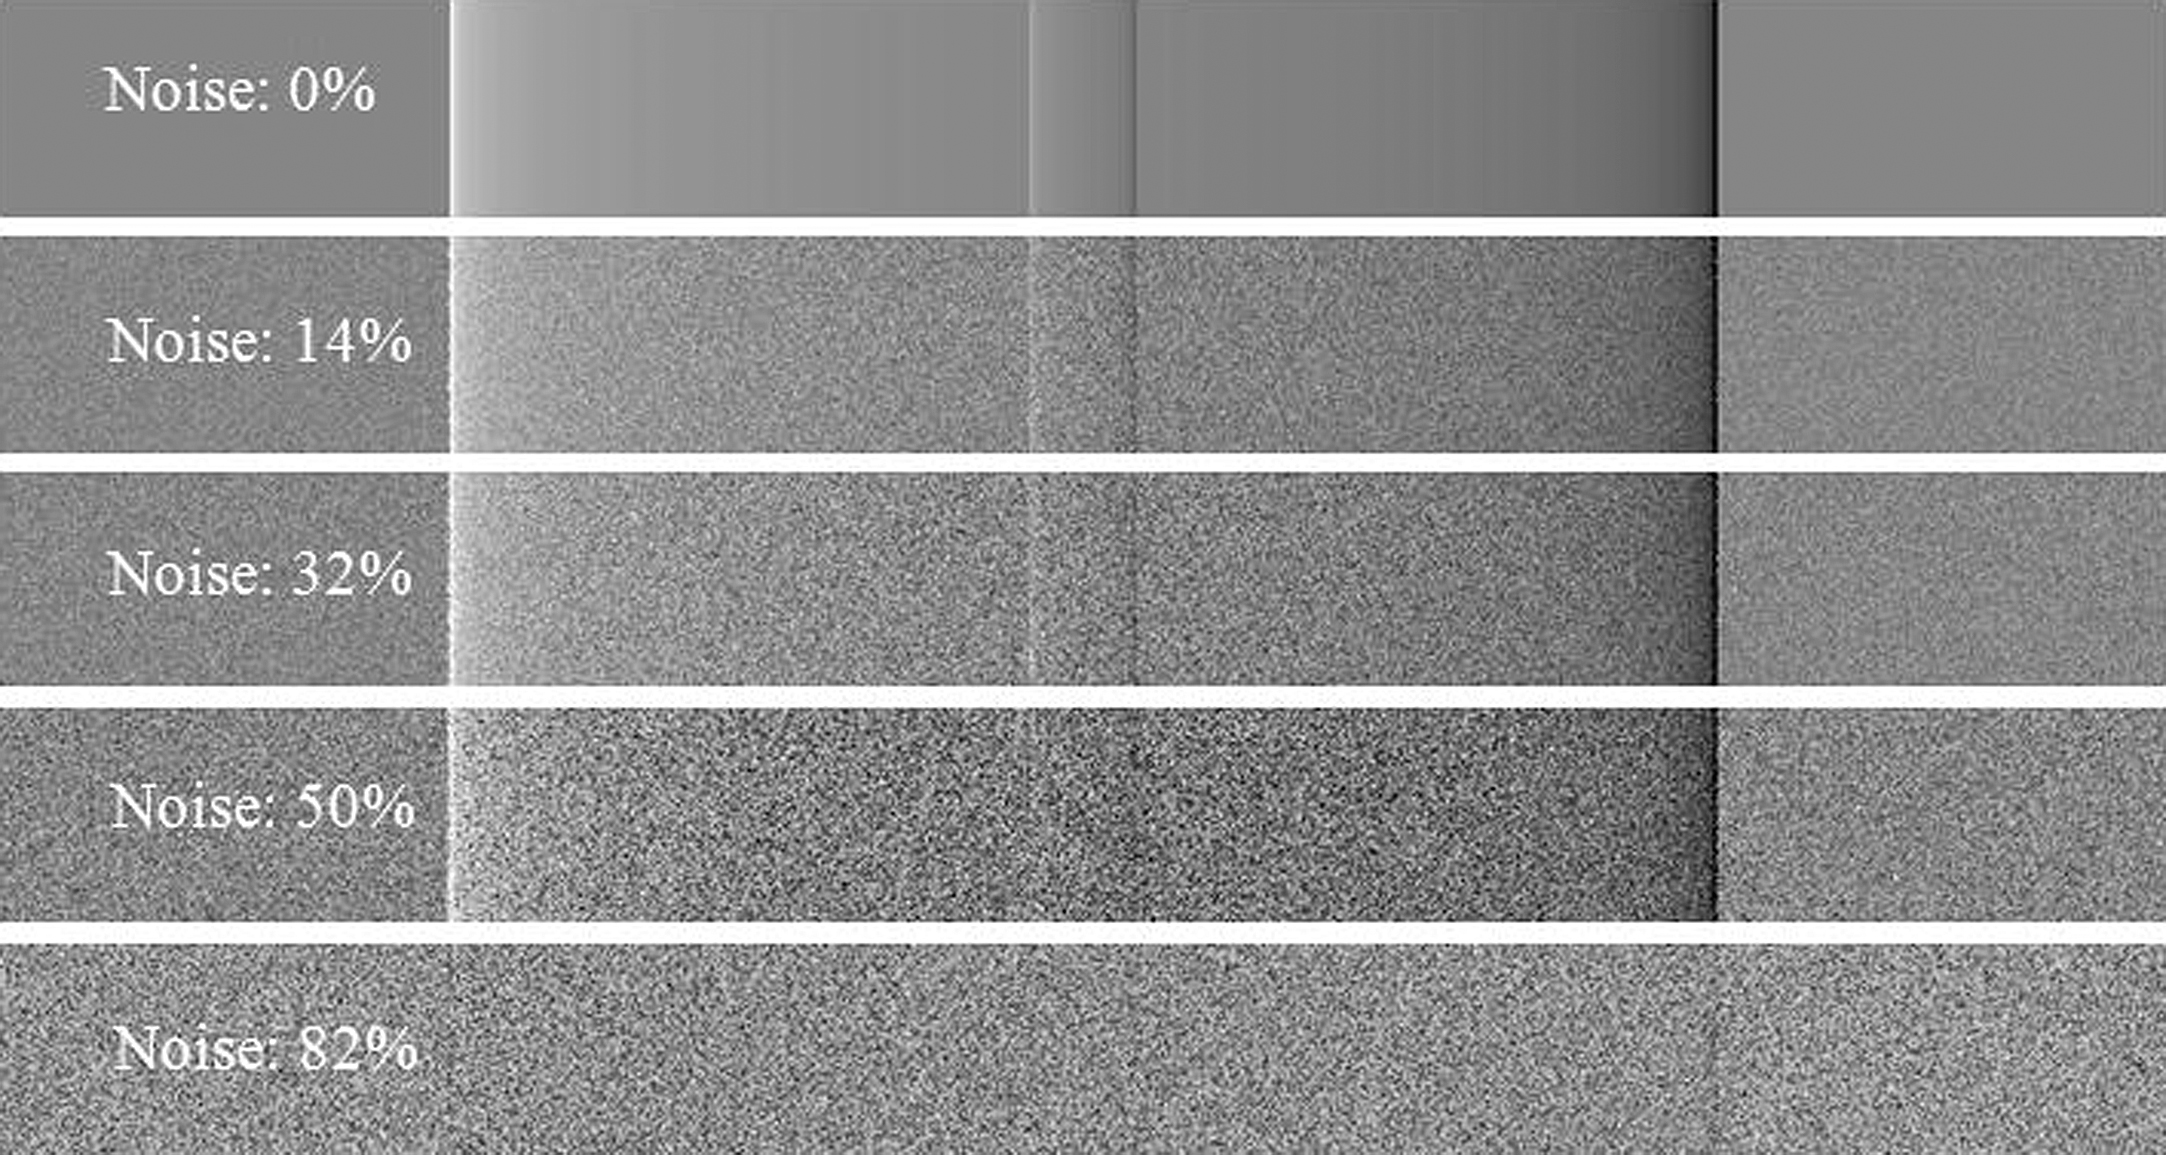
Influence of quantum noise on DPC image when fringe contrast is 30%, The labels indicate the noise levels of the stepping images.

DPC image noise in response to stepping image noise at different levels, the measurements were performed at three different fringe contrasts.
The use of hospital-grade X-ray tube opens the gate for wide clinical application of DPC-CBCT, but also comprises phase image quality due to deficient illumination coherence. The coherence property of X-ray beams reaching the phase grating is critical in phase contrast imaging because it directly determines the fringe contrast of the system. Good coherence leads to good image contrast, sharp details and low noise level, and also means that less X-ray dose is needed to achieve a certain CNR because higher fringe contrast tolerates noise better. The coherence is determined by the system’s hardware (e.g. X-ray tube, grating quality), but can be degraded by the object in the field of view because of sub-micron structures. Experimental results indicate that DPC produces better images for homogeneous objects. According to the phantom studies, DPC-CBCT doubled the CNR, and increased the saline solution contrast by 77%. However, the specimen studies indicate an overall poor performance of DPC-CBCT compared with attenuation contrast CBCT. In the mouse study, although the skin hair has negligible attenuation, the fine structure undermines the X-ray coherence and decreased the fringe contrast by about 50%. Attenuation contrast imaging, on the other hand, is not obviously affected by the X-ray coherence property or the micro-structure of the object as its signal origin is intensity variation instead of phase shift. Dark-field imaging verified our small-angle scattering theory and explained phase image quality degradation in soft tissue and small animal imaging by quantitatively mapping the coherence loss caused by small-angle scattering. Dark-field imaging is also useful for noise reduction, sample preprocessing and image quality estimation for phase contrast imaging.
In attenuation contrast CT, the X-ray exposure needed for a certain image noise level is determined by the overall attenuation of the object and can be calculated based on the detected photon flux. Whereas, DPC imaging noise is determined by the coherence property of the X-rays in addition to the attenuated photon flux. Sometimes an object with negligible attenuation can cause significant coherence loss. Therefore, X-ray exposure in DPC imaging should consider object attenuation, X-ray coherence level, and micron-level structures of the object. The computer simulation investigated the noise tolerance of different fringe contrasts. The results indicate that fringe contrast greatly determines the system’s performance. The simulation presents a method to predict the noise level in the retrieved DPC image in response to quantum noise and provides useful information for the design of a DPC-CBCT scan, such as material preparation, dosage control, etc.
The advantage of grating-based DPC-CBCT is that it provides 3-D image with higher contrast, and at the same time provides one more channel of image: dark-filed image. Whereas, there are limitations that hinder the wide commercial use of grating-based DPC-CBCT. First, phase stepping requires multiple exposures at each angle, which leads to complicated grating movement. The consequences include high radiation dose and prolonged scan time. Second, its performance is greatly affected by the fringe contrast of the system and is material dependent. Third, the gratings and movements add additional factors that contribute to signal variance. Fourth, there exists dose waste due to the fact that the detected X-ray intensity is weakened by the analyzer grating. DPC-CBCT has plenty room for improvement by ameliorating the system components. The major limitation is the X-ray source. An X-ray source with smaller focal spot size and larger power will improve the coherence of X-ray beams and create better fringe visibility. Confocal gratings allow cone-shaped X-ray beams pass parallel to the openings without unwanted partial attenuation or phase shift. Therefore, the imaging will be more efficient and the fringe visibility will be increased. We believe that DPC-CBCT has great potential to serve as a more advanced imaging tool for materials with weak X-ray absorption and difficult to image with attenuation contrast CT technologies. In the future, more work should be dedicated to the improvement of DPC-CBCT imaging system, and hopefully this technique will be eventually put into applications for clinical imaging and biomedicalimaging.
Footnotes
Acknowledgments
This project was supported by NIH Grants R01 CA 143050. The authors would like to thank the Pathology Department of University of Rochester for providing human breast specimens, and the Vivarium of the University of Rochester Medical Center for preparing euthanized mice.