
Abstract
In order to diagnose Parkinson disease (PD) at an early stage, it is important to develop a sensitive method for detecting structural changes in the substantia nigra (SN). Diffusion weighted imaging (DWI) and diffusion tensor imaging (DTI) have become important tools in supporting diagnosis of PD, with findings based on increased apparent diffusion coefficients (ADCs) in basal ganglia and decreased fractional anisotropy (FA) in SN. Based on the hypothesis that a diffusion kurtosis imaging (DKI) theory is a valuable method for PD diagnosis based on the non-Gaussian diffusion of water in biologic systems, the purpose of this study is to develop an image processing scheme (software) based on Image-J for the facilitating the application of DKI to assist PD diagnosis. Using the new DKI software enables to estimate the diffusional kurtosis and diffusion coefficients, which reflect the structural differences between regions of interest. The experimental results of applying the new software showed that diffusional kurtosis was highly sensitive to microstructural tissue changes, which were not noticeable in the diffusion coefficient values. Thus, the study results may suggest that applying the new image processing software can be useful for assessing tissue structural abnormalities, monitoring and following disease progression.
Introduction
Parkinson’s disease (PD) is a long-term degenerative disorder of the central nervous system that mainly affects the motor system. PD was officially recognized in 1817 by James Parkinson who published a detailed medical essay on the subject and is characterized by the selective loss of dopaminergic neurons in the substantia nigra pars compacta (SNpc) [1–3]. Motor symptoms first appear when around 50% of dopaminergic neurons are lost in the substantia nigra (SN). As a result, effectiveness of potential treatments is limited due to the low number of remaining neurons.
Diffusion weighted imaging (DWI) and diffusion tensor imaging (DTI) has revolutionized clinical neuroimaging by detecting in particular diffusivity measures in regions that are characterized by the degeneration of the dopaminergic neurons. DWI is a magnetic resonance imaging method that allows the movements of water molecules to be quantified [4] in vivo and non-invasively. The mobility of water molecules is also known as Brownian motion and is due to thermal agitation that is highly influenced by the cellular environment. DTI is a useful method to measure the diffusion of water inside living systems and also showing its directionality [5]. One of the aims of this article is to review and identify the principal findings regarding the SN as a marker that can aid in the diagnosis of disease progression and monitoring with DWI and DTI. Nevertheless, most studies with DWI and DTI use diffusion measures such as apparent diffusion coefficient (ADC); and fractional anisotropy (FA). ADC is the expression of isotropic diffusion, supposing that the diffusion is the same in all directions and FA signifies that the water tends to spread along a preferred axis. However, in many biological tissues (including the brain), the presence of barriers and compartments can all cause deviation from the Gauss form that is quantified by DKI [6, 7]. DKI is a DWI technique that allows the diffusional kurtosis to be estimated with clinical scanners using standard diffusion-weighted pulse sequences and relatively modest acquisition times [7]. The parameters provided by DKI mean kurtosis is sensitive to diffusional heterogeneity and suggest that DKI may be useful when investigating neurodegenerative diseases such as PD. Further certain recent studies have also reported that DKI improves the sensitivity in detecting developmental and pathological neural changes in PD than the conventional DTI [8].
Consequently, this article highlights the importance of the DKI method and also explores the parameters provided by DKI analysis. A software program in Java was developed in order to show the parametric maps of apparent diffusion coefficients and apparent diffusional kurtosis. The maps are generated automatically in order to compare the values in different regions of interest related to PD and the results created by the software are proposed as a possible aid in the search for biomarkersof PD.
Method
Non-Gaussian water diffusion with DKI
In the Gaussian diffusion model, it is assumed that water molecules diffuse uniformly. However, in many biological tissues the presence of barriers and compartments (e.g. intracellular and extracellular spaces) alter displacement within tissue. Stronger b-values are used (b > 1500 s/mm2) as the technique becomes increasingly sensitive to shorter molecular distances and the heterogeneous cellularstructures [9].
Quantification of the degree of diffusional non-gaussianity can be useful in characterizing the associated tissue structures in which the displacement probability distribution depends [7]. The diffusion-weighted signal intensity, S, can be regarded as a function of the “b-value,” which for a Stejskal-Tanner sequence is defined by b = (γδg) 2 (Δ - δ/3), Eq. (1). The γ parameter is a gyromagnetic ratio (2.765×10⁸ rad/s·T). The parameters g (strength), δ (length) and Δ (the chance for water to change its position within a fixed amount of time) are related with parameter b. One can then consider the Taylor series [10, 11],
DKI is based on a similar logic with the key difference being that Eq. (2) is replaced with the expression
This now explicitly includes the 0 (b2) term [12, 13]. Here k app is the apparent diffusional kurtosis, which approaches the true kurtosis K in the limit of short pulse durations [7].
With this approximation, one can estimate both D and K by fitting to the diffusion-weighted signal intensity data with three or more b-values (since there are now 3 unknown) in any given gradient direction. For exactly three b-values, b1, b2 and b3, the closed-form expressions are [14].
Note that D(12) and D(13) correspond to the DTI estimates of the diffusion coefficient for the b-values pairs of (b1, b2) and (b1, b3), respectively [7].
Several research groups have been interested in characterizing pathological processes that modify nervous tissue integrity by applying DWI in neurodegenerative diseases in Parkinsonian disorders [15]. Until now, the main findings regarding DWI, DTI and DKI demonstrate SN to be a “potential biomarker” in the diagnosis of PD, (as summarized in Table 1). Therefore, suggest that the decrease of FA values in the SN are associated with the increase of motor symptoms in PD patients [16–19]. There are also studies that support the reduction of FA values inside the SN in PD patients demonstrating high correlation with an increase of iron [18, 20]. As well α-synuclein immunohistochemistry is currently a mark in neuropahological evaluation of PD [21] and can even occur in early states [1, 2]. Subsequently, SN does appear to have potential as a biomarker.
Summary of main study results: Discriminate PD into SN
Summary of main study results: Discriminate PD into SN
Among other important findings reported that support kurtosis in the SN as a potential biomarker for imaging studies of PD and that may improve the diagnosis [22] are Wang et al. [23] who investigated the use of DKI in PD. A statistically significant increase was found in mean kurtosis in the putamen and SN in patients with PD, in comparison to a control group. These findings would suggest that inclusion of kurtosis data could complement traditional diffusion imaging to provide a more accurate model in regions that are characterized by the degeneration of the dopaminergic neurons and could be reflected by quantification of tissue structure. DKI offers an additional imaging biomarker (diffusional kurtosis) for detecting microstructural differences within SN and basal ganglia. Accordingly, DKI may be useful as a method for assessing tissue structure abnormalities but it is necessary for further research with decreased FA diffusion values [24–26] and increased ADC values [27] in early-stages of PD compared with controls.
The main objective of the present section was to develop software to investigate the feasibility, implementation of DKI theory described above [12]; an “open source” application was implemented in Java language. In this section DKI compartmental model is analyzed in order to evaluate mean apparent diffusional kurtosis from conventional DWI.
Software application
This software application describes a method, DKI which has previously been presented in an abbreviated form [12, 13], can be referred to Jensen JH, Helpern JA [7] for estimating the excess kurtosis of water diffusion in vivo by means of pulsed field gradient MRI. Parametric maps of D app and K app were created by fitting the image signal intensities on a voxel-by-voxel basis of the Eq. (2). The program was developed in Java, as a plugin for ImageJ, (http://rsbweb.nih.gov/ij/). This detailed method is illustrated in Fig. 1. The generated maps D12, D13, D app provide additional information that is used to quantify diffusional non-Gaussianity results K app map.
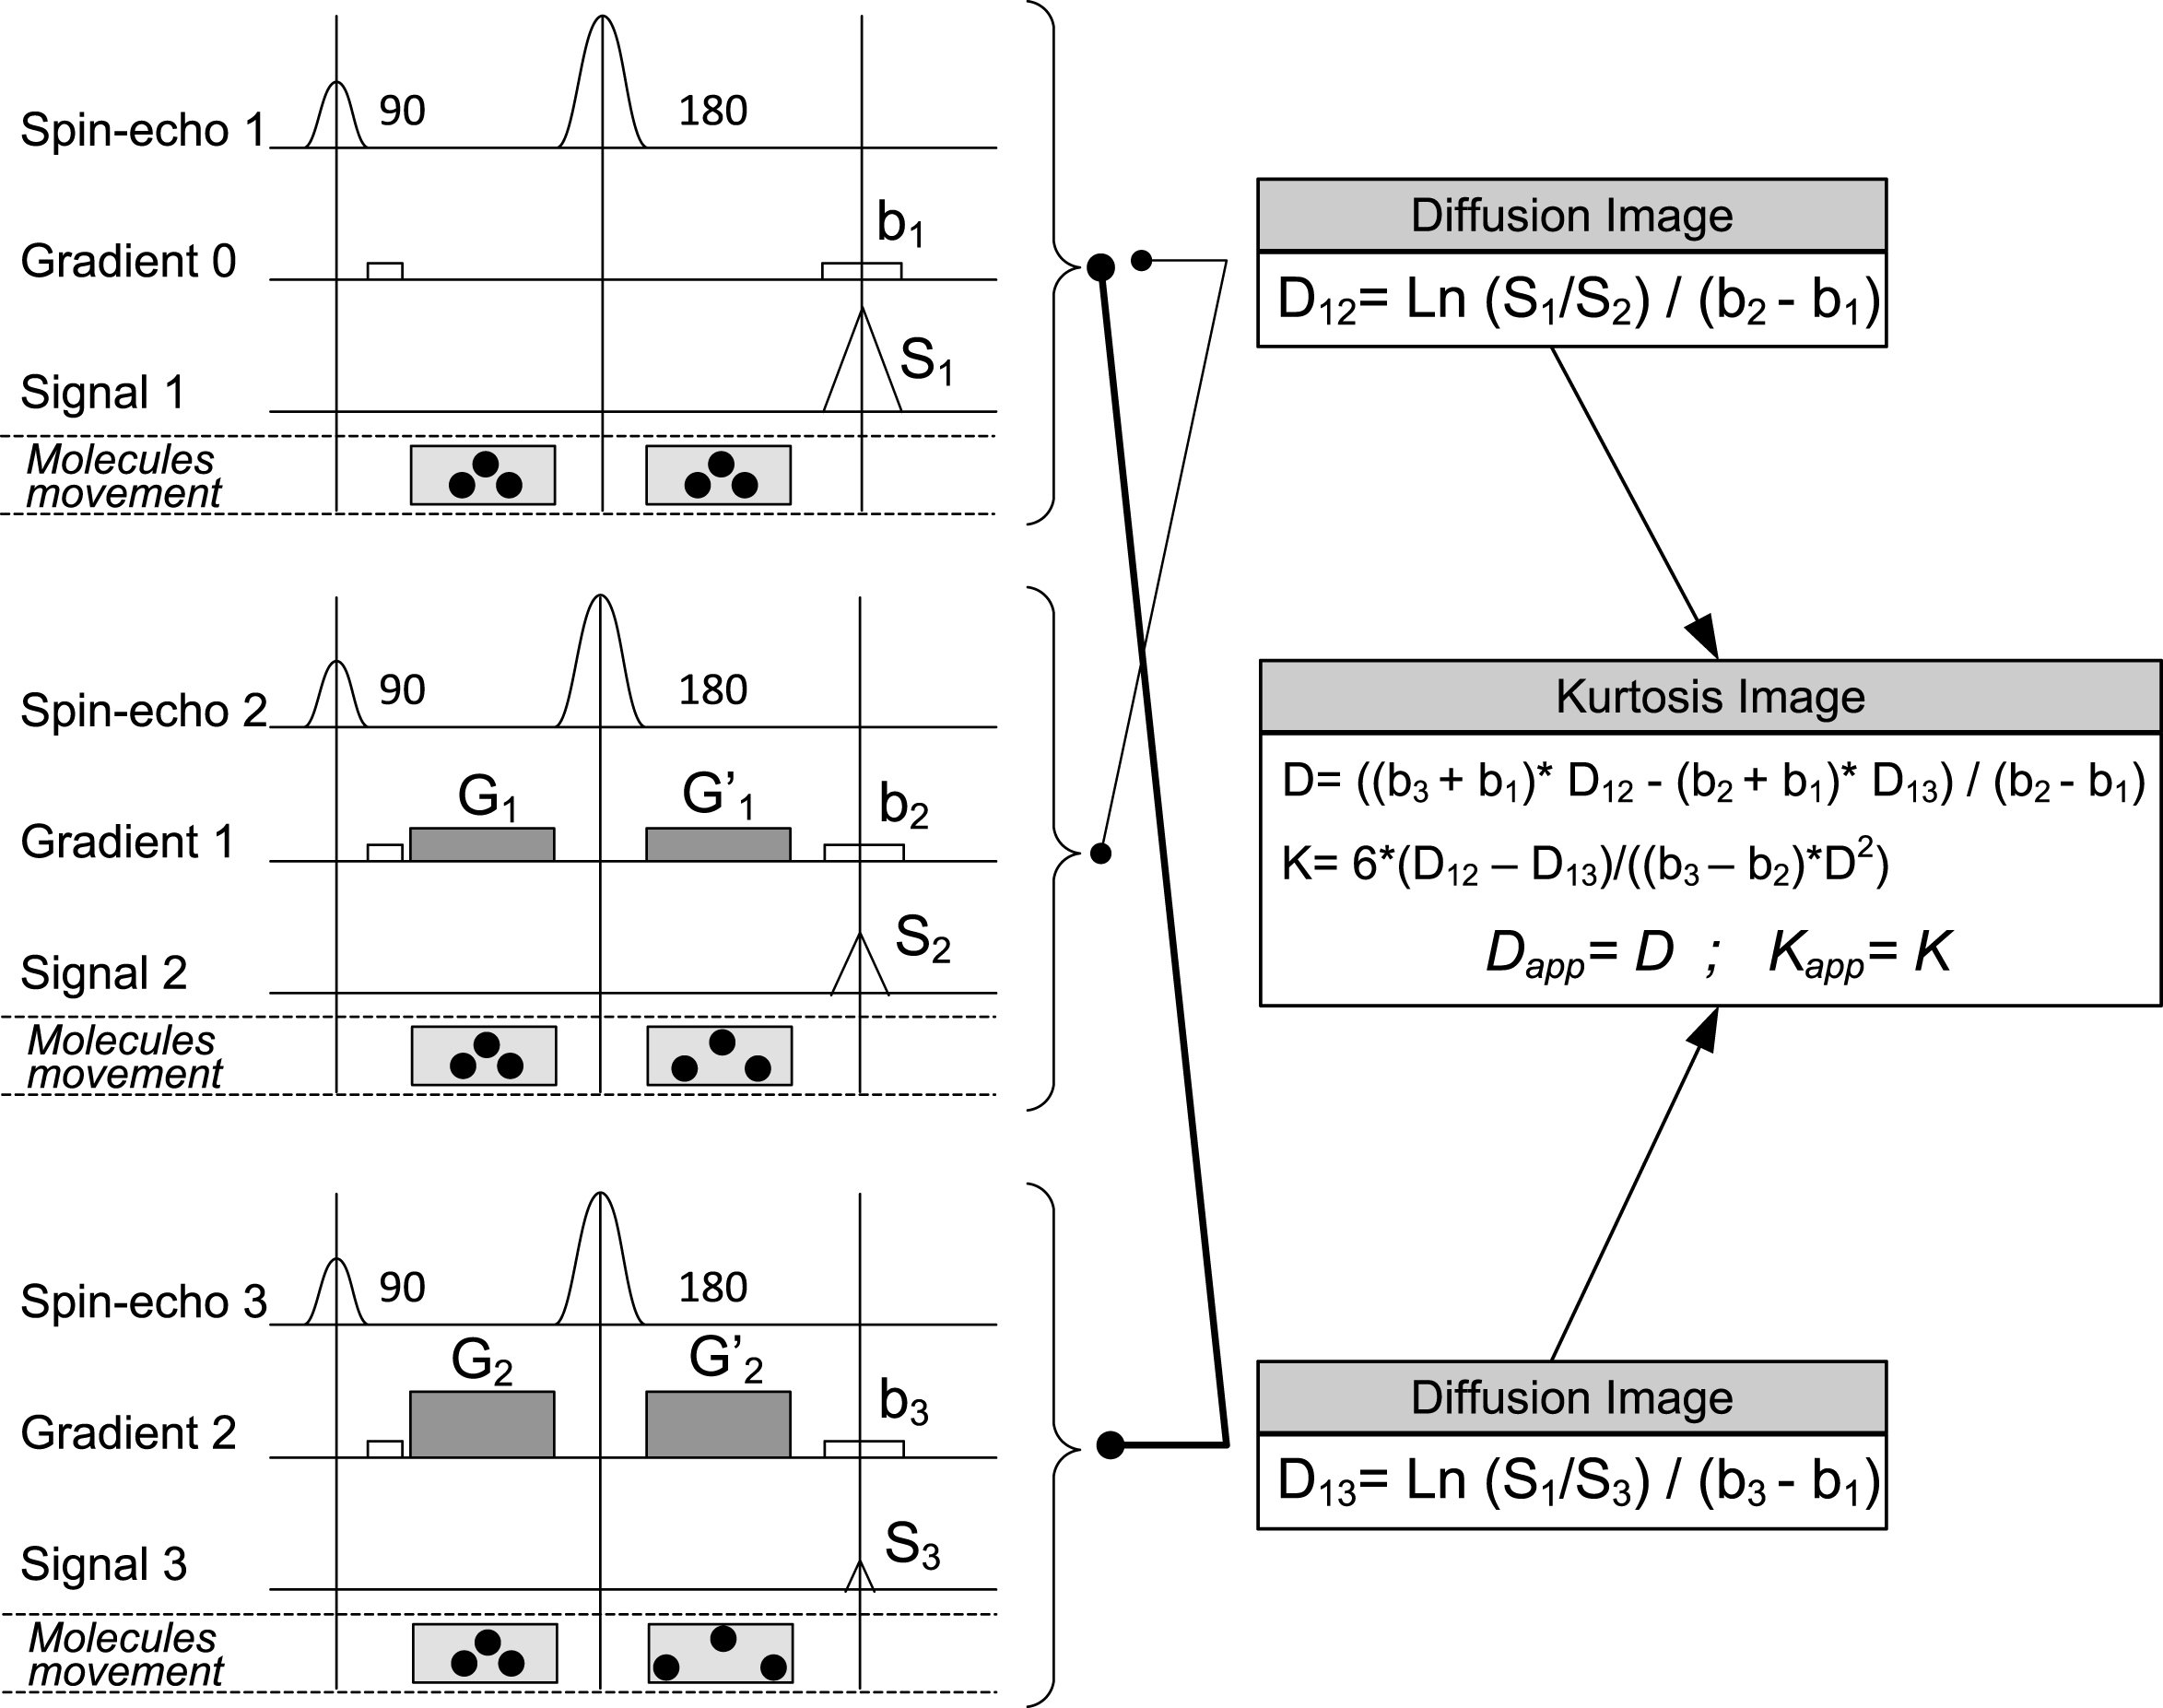
Kurtosis-Analysis Plugin in image-J. The first sequence (a) is without diffusion weighted, also called standard sequence (b1 = 0 s/mm2); the second sequence (b) is with stronger additional gradient G1(b2 = 1000 s/mm2); the third sequence (c) is diffusion weighted by stronger additional gradient pulses G2 (b3 = 2000 s/mm2). Each DWI stack is composed by a number of slices. KURTOSIS processing requires only three slices (b1, b2 and b3). For this reason it is necessary to select one slice per stack. After that, the software obtains D12 and D13 images from S1, S2 and S3. At the same time, the apparent diffusion image D app is obtained from D12 and D13. And then, the apparent diffusional kurtosis image K app is generated.
We designed and implemented a GUI using Image-J, which provides the user with a simple way to load a stack of images (file – import – image sequence). The GUI was developed in Java and integrated with Image-J, as shown in Fig. 2. Then, the user must type the corresponding b-values (one b value per each slice: b1, b2 and b3), as follows in Fig. 3. After that, the results are shown Fig. 4 in the following order: first ADC (D12), second ADC (D13), D map (Dapp map) and kurtosis map (Kapp map), respectively. For example, a region of interest (ROI) is shown in Fig. 5. In this example, the quantitative results are displayed by hovering the mouse pointer over the pixel area. Image-J shows the pixel intensities and coordinates in the status bar (as shown in Fig. 5).

GUI interface for starting kurtosis analysis, in this window the user can select the KURTOSIS calculation.

GUI interface for kurtosis analysis parameters.
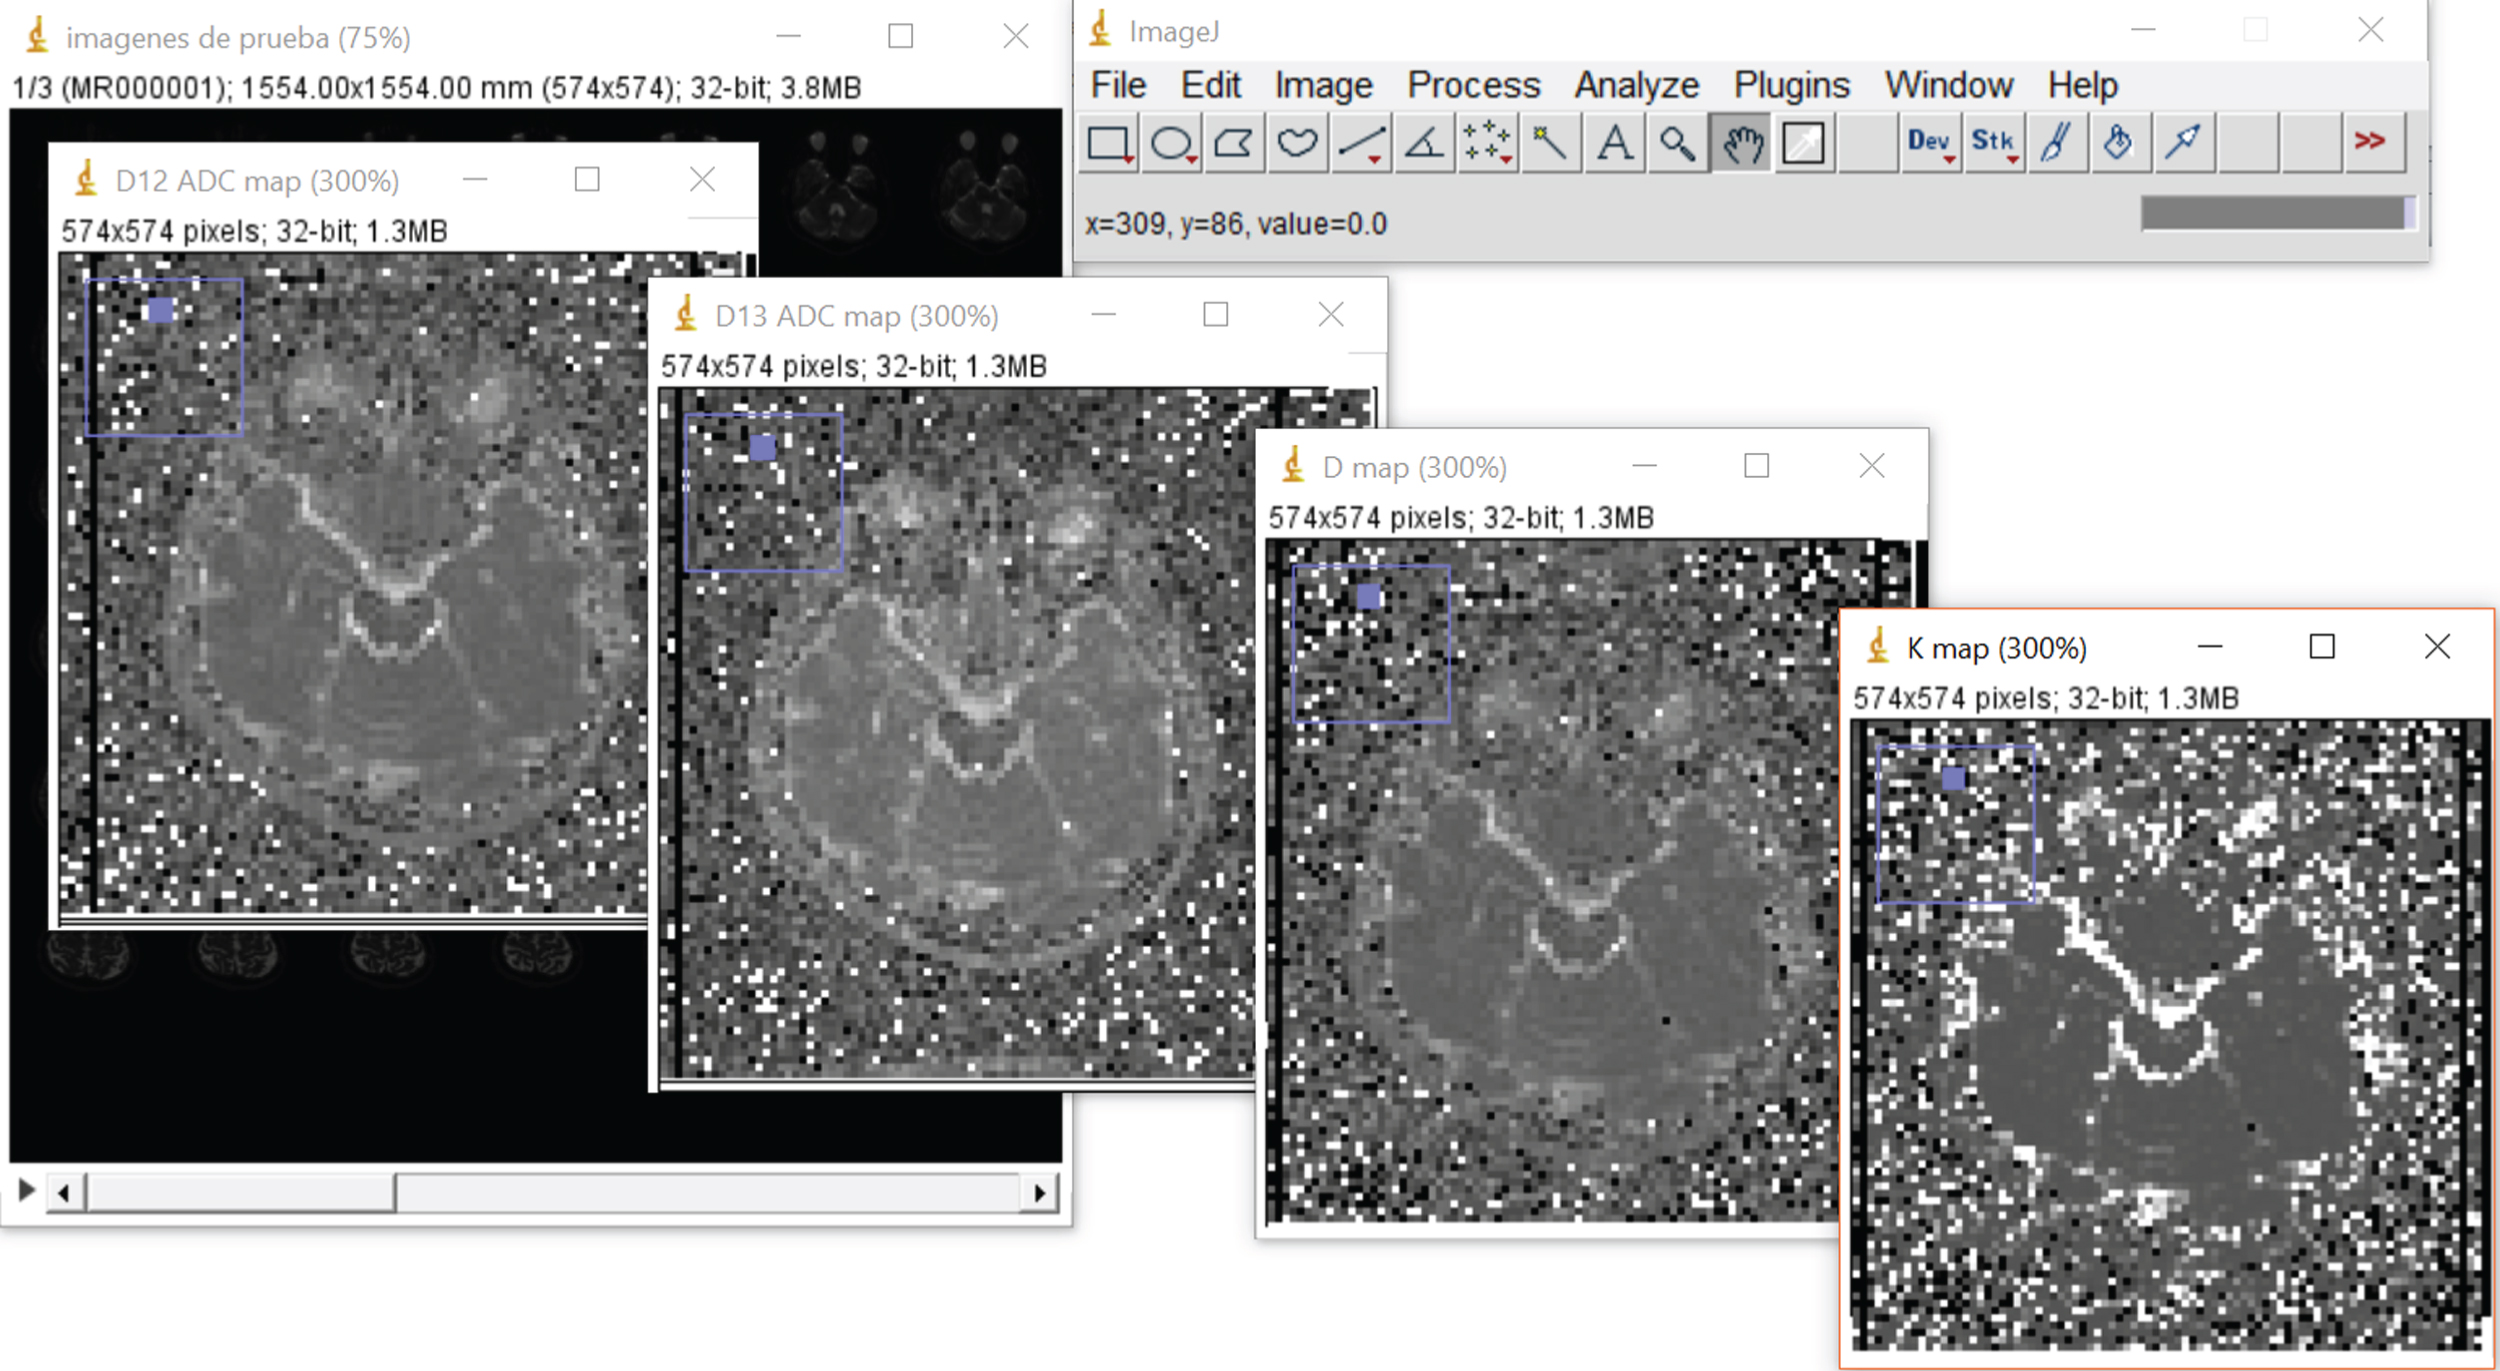
Results of Kurtosis Analysis: D12 (ADC map), D13 (ADC map), D map (Dapp map) and K map (Kapp map).
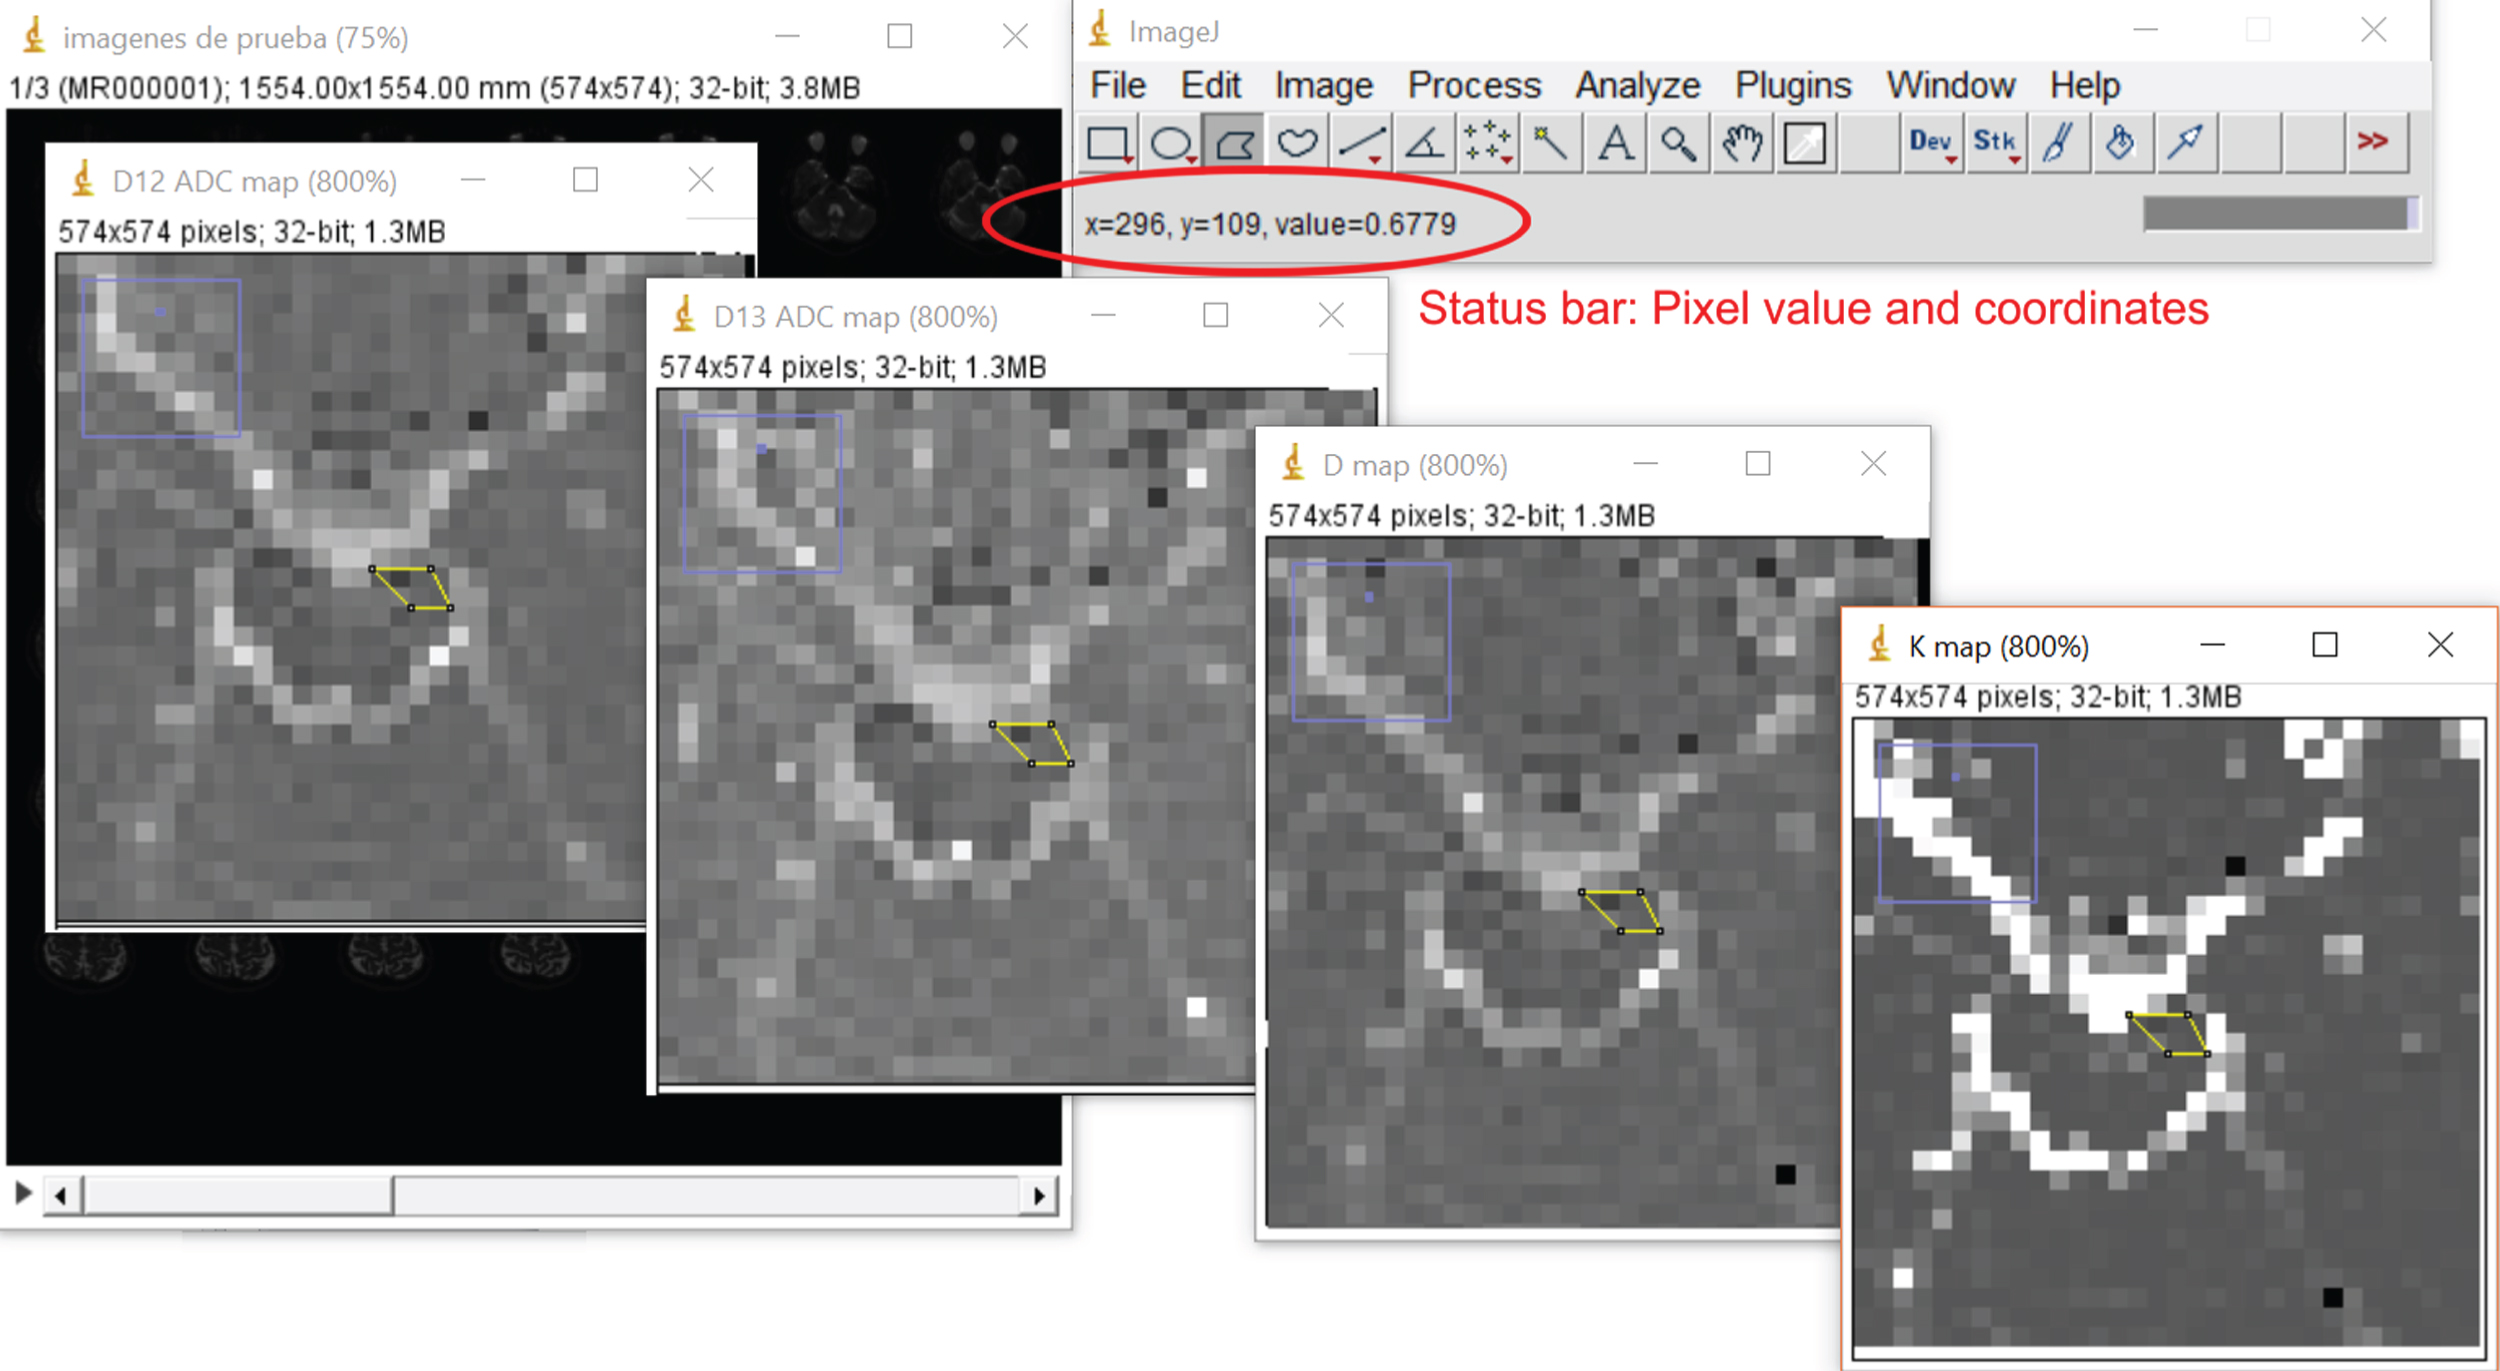
An example of the ROI selection of SN.
The preliminary results show how useful the software is for the diagnosting and monitoring of PD. There are three examples of this, one of which is in a healthy adult volunteer and the other three patients have been diagnosed with PD. The results of this are presented below.
The preliminary results show DKI parameters in one healthy adult volunteer. DWI images were acquired with 3 values of b (0, 1000, and 2000 s/mm2). Jens H. Jensen & Helpern assumed that diffusional kurtosis metrics can potentially be more sensitive to some tissue [7]. Region of interest analyses were performed around the areas of the midbrain, SN and the white matter to obtain quantitative estimates for typical values of the diffusional coefficients and the diffusional kurtosis. Interregional comparisons are used to construct Table 2, regions of interest were chosen by eye, each containing 12 voxels.
List of the computed parameters
List of the computed parameters
Note: data are mean±standard deviation.
DKI theory generates values of D12 (b-values of 0 and 1000 sec/mm2), D13 (b-values of 0 and 2000 sec/mm2) by applying Eq. (6), Dapp (Eq. (4)) and Kapp (Eq. (5)) respectively (values from reference [14]). (The diffusivities (D12, D13 and Dapp) areas are in units of μm2/ms, while Kapp is dimensionless). For Gaussian diffusion Kapp = 0, and nonzero Kapp shows indicator of non-Gaussian diffusion. On average D12, D13 and Dapp are values that considerably contrast between white matter and SN. However, Kapp values vary in regions with similar diffusion coefficients, as observations obtained in white matter. Additionally, Kapp shows a slight increase compared to the healthy volunteer in the areas of interest, but similar diffusion coefficients. Note: Kapp could be calculated with high b-values (about 2000 sec/mm2) to apply the DKI method.
The diffusional kurtosis can be estimated from different types of brain tissue. Higher kurtosis values imply more impediments to normal diffusion and greater complexity within the imaged system. Additionally, when stronger b-values are used (b > 1500 s/mm2) the technique becomes increasingly sensitive to shorter molecular distances and the heterogeneous cellular structures [9]. The preliminary results indicate that water diffusion is less Gaussian or imply more impediments in white matter than the other types of brain tissue (as shown in Table 2). But in a low kurtosis region such as SN or red nucleus show that D12, D13 and Dapp decrease more than high kurtosis regions (white matter) without excessive changes between them. These magnitudes of variations may suggest minimum differences in tissue structure. Therefore, these results indicate that water diffusion is more Gaussian in SN and red nucleus than white matter (Table 2). The software shows variations of values D12, D13 and Dapp versus Kapp at voxel level in the regions of interest. These values show changes that are compared to those of the mean diffusional kurtosis, they reflect the characteristics of the tissue and can be analyzed with the software and at the same time correlated with ADC maps (D12 and D13). Also, it is worth mentioning that D12 (ADC) value in red nucleus decreases in a PD patient compared to a healthy volunteer. These results require further investigation comprising of a bigger population. It is important to mention that the findings by Jensen and Hepern [29] report that Kapp can vary considerably for regions with similar diffusion coefficients.
A second preliminary example of a patient with PD, see Fig. 6 shows the diffusion coefficient or ADC from the DWI images that were processed using the developed software. The intensity of each voxel individually needs to be studied in order to investigate water diffusion. Consequently, the diffusion coefficient cannot be obtained from the signal intensity of one image. The red and blue arrows (Fig. 6) in the DWI images with b = 0 s/mm2 and b = 1000 s/mm2 show the relationship between gradient strength and signal intensity. In this example Fig. 6, the ADC map in voxel intensity of the red arrow is lower, this region becomes darker therefore the diffusion coefficient in this region is slow. The blue arrow becomes brighter that means the diffusion coefficient is fast. This is generated as an example to observe the attenuation signal. To emphasize that with the developed tool it is possible to observe the changes generated in the ADC map that also corresponds to maps D12 and D13 in the DKI theory. It is necessary to obtain more information at voxel level, for which the average diffusional kurtosis map obtained with this tool becomes a parameter highly sensitive to the expected changes at the microscopic level in PD and the isotropic tissue of SN.
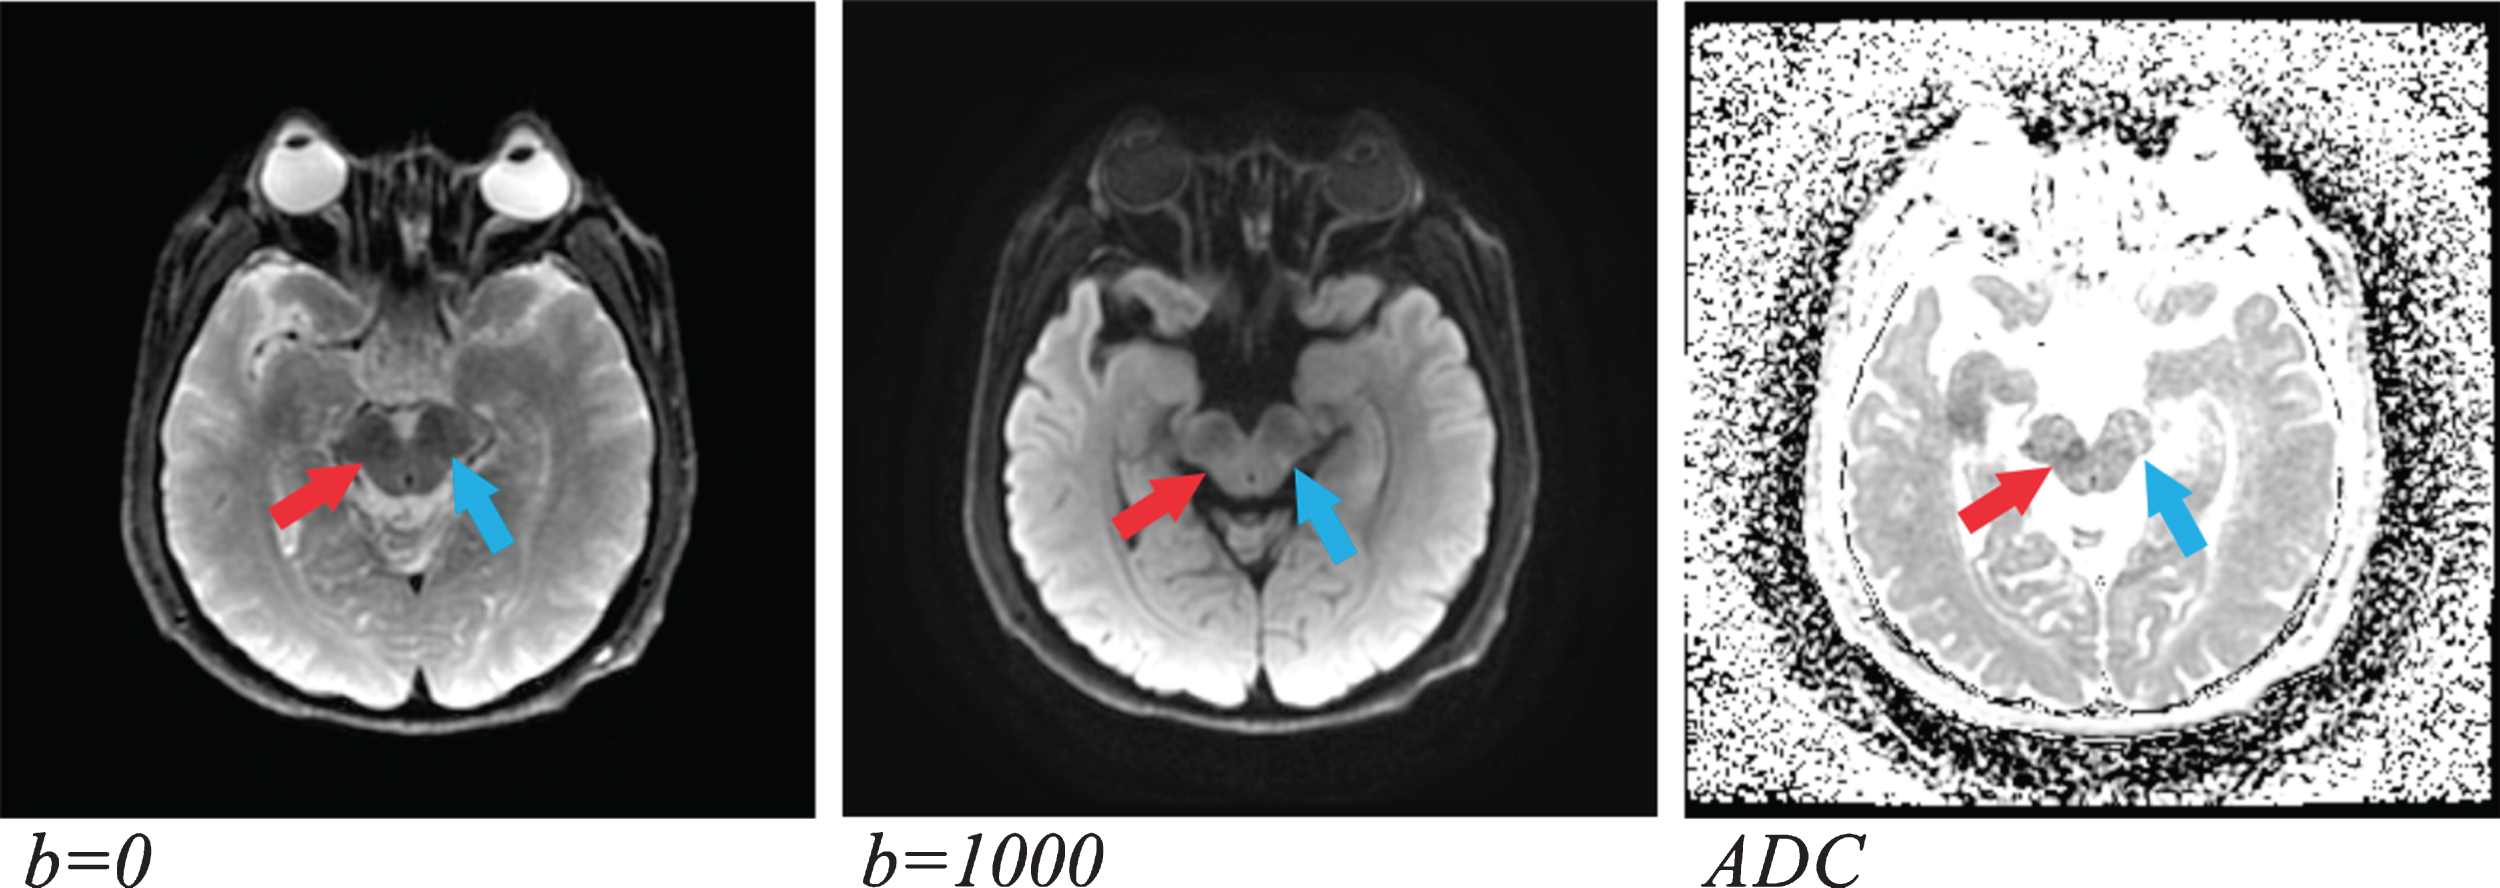
ADC calculation and MRI effect in a female patient, 42 years old with PD. Each slice has a different b-value. The left slice has a b value of 0 sec/mm2 and the middle slice has a b-value of 1000 sec/mm2. The ADC is calculated over the entire range of b-values used at imaging as a simple of monoexponential fit of log signal intensity versus b-values. , where S (b) is the diffusion-weighted signal intensity at a particular b-value and S0 is the signal intensity at b of 0 sec/mm2 (the ADC represents the slope of the curve). In this example, the blue arrow (SN area) has a large amount of signal loss, suggesting fast diffusion. In the ADC map, this region becomes brighter (approximately 0.907μm2/ms). The red arrow (red nucleus area), on the other hand has a much smaller signal loss. The diffusion coefficient in this region is slow and becomes darker in the ADC map, (approximately 0.512μm2/ms).
Another preliminary result, see Fig. 7 shows two cases of patients with PD, in these two cases the ADC map in different regions of the midbrain becomes darker, the diffusion coefficient is approximately 0.406μm2/ms. These observations are useful when investigating with future studies by applying higher b-values (b > 1500 s/mm2) which is one of the main characteristics of the DKI method. This emphasizes that the results can be influenced by the selective loss of dopaminergic neurons in the SN with a high increase of α-synuclein in SN [21], an appreciable concentration of iron in PD [18, 20], and disturbances of the microcirculation within the SN [29]. Nevertheless, it is necessary to confirm these observations with a larger population.
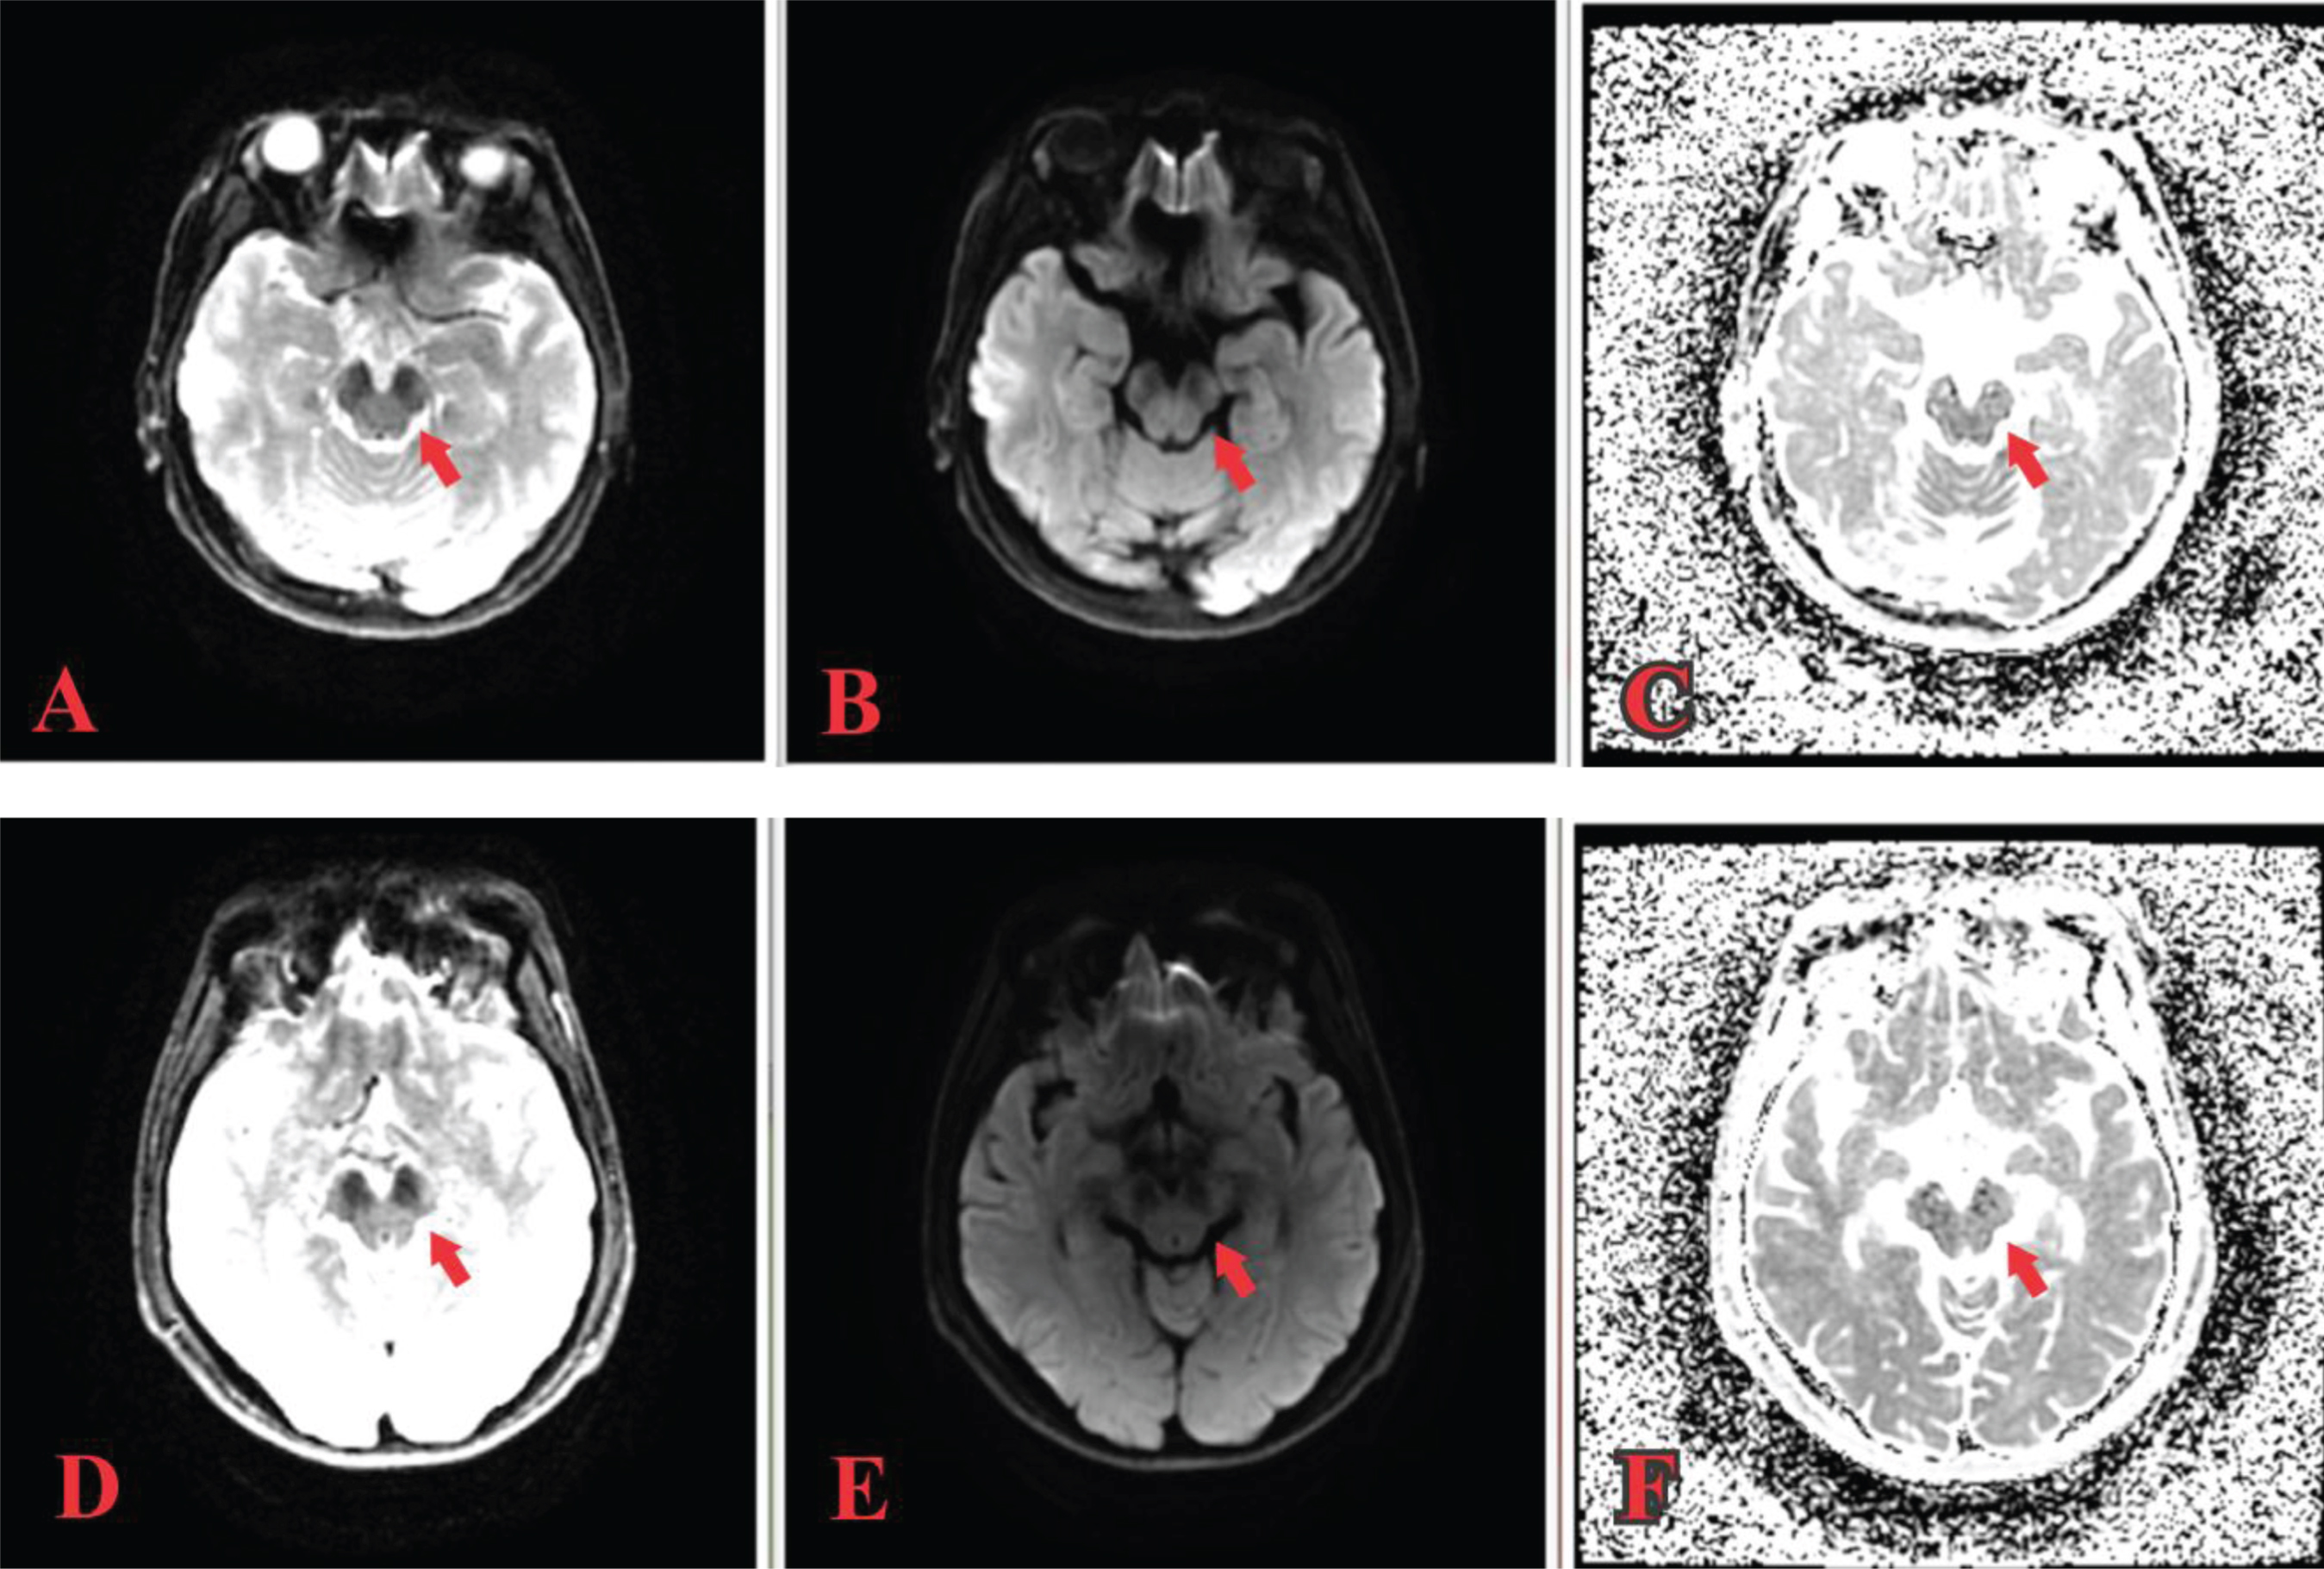
A) The figure shows three slices of a male patient, 61 years old with PD. (D) The figure shows three slices of a male patient, 52 years old with PD. The left slice (A), (D) has a b-value of 0 sec/mm2, the middle slice (D), (E) has a b-value of 1000 sec/mm2, the right slice (C) and (D) have the constant diffusion ADC for each PD patient.
The findings of the study suggest that DKI may provide a noninvasive biomarker for brain changes in patients with PD. The particular interest is in the DKI method presented with respect to DWI and DTI techniques as a new emerging technique. It is highly sensitive to microstructural tissue changes and therefore is extremely useful in neurodegenerative diseases such as PD.
Among the most interesting findings is the observation of D12, D13, Dapp values in the study regions such as in isotropic tissue, the fluctuation of these values do not undergo a great change between them, as in the SN. However, it is observed that with white matter, D12, D13, Dapp values do not experience a great change, although there is an increase in the average of kurtosis. High sensitivity is what needs to be highlighted as a proposal in future research, since it is possible to correlate the diffusion coefficients with the diffusional kurtosis.
The findings also focus the need to establish some type of parameters standardization to set the thresholds of ADC, D12, D13, Dapp and Kapp values for different types of atypical Parkinsonism. For this standardization, it is necessary to take into consideration the different parts of basal ganglia, midbrain and SN without disregarding its histological features. This software makes an in-depth analysis of the concept of kurtosis and adds more detail to the analysis by comparing the apparent diffusion coefficients and apparent diffusion kurtosis K app through the concept of DKI. Thus, it is likely that the neuroimaging methods will be largely a research tool in the area of biomarkers in the near future. The software application introduced in the study may be useful for assessing tissue structure abnormalities associated with a variety of neurodegenerative disorders and cancer assessment.
In summary, the new software presented in this study can be further developed and optimized, in order to obtain more parameters from the DKI method and allow exploration of additional information. An interesting assertion from the implementation of this tool is that it is particularly valuable in the investigation of isotropic structures and requires less demand in post-processing of images and software requirements. One of the major limitations is the study of population, the software tool needs to be used to explore PD and other neurodegenerative diseases further. It can also be used in studies that require high sensitivity to detect structural changes and achieve follow-up and monitoring of the disease.
Conclusion
The developed software tool implements the DKI method from the DWI images by obtaining information at voxel level of diffusional coefficients and diffusional kurtosis. This tool also provides an approach that characterizes two important measures: water diffusion (diffusional coefficients) and tissue structure (diffusional kurtosis). Therefore, the software tool is particularly useful in order to generate information regarding the microstructural changes of the SN and the parts of the basal ganglia involved in PD. The software is also highly efficient as a monitor and a follow-up of the disease. The parameters generated can be explored in a larger study population to establish diagnostic thresholds in PD.
Footnotes
Acknowledgments
Authors thank Chinese award Scholarship Council. We also thank the reviewers for the suggested changes to the manuscript, they have been extremely useful.