
Abstract
BACKGROUND:
Optimizing scan parameters for double inversion recovery (DIR) sequences remains difficult.
OBJECTIVE:
To evaluate a new method for optimizing DIR sequence scan parameters using T1 mapping and a newly developed analysis algorithm.
METHODS:
Twelve healthy volunteers underwent T1 mapping and DIR magnetic resonance imaging. The following steps were used for image optimization including: 1) measurement of gray matter (GM), white matter (WM), and cerebrospinal fluid (CSF) T1 values to create a T1 map; 2) calculation of optimized scan parameters by using a developed analysis algorithm; 3) performance assessment of DIR magnetic resonance imaging by using the calculated optimized imaging parameters. Additionally, we used scan parameters from previous studies to obtain DIR images in order to evaluate our new method. The contrast between GM and suppressed tissues was compared between these images and those obtained using the optimized parameters.
RESULTS:
Using our optimization method, WM and CSF regions were suppressed uniformly for all scan conditions. The contrast was significantly higher in images obtained using this optimization method compared to those obtained using previously published parameters (p < 0.01).
CONCLUSIONS:
It is possible to obtain superior DIR images by using an optimization method that involves T1 mapping and a newly developed analysis algorithm.
Introduction
Gray matter (GM) imaging is important in the investigation of many neurological diseases, including schizophrenia, multiple sclerosis, stroke, Alzheimer’s disease, tuberous sclerosis, and epilepsy, all of which are associated with changes in cortical GM [1–7]. Unfortunately, neocortical GM is difficult to capture because the neocortex is a thin, highly convoluted structure that folds back upon itself in an unpredictable manner [7]. High-resolution, thin-slice data are therefore necessary to investigate the neocortex. However, voxel size reduction during magnetic resonance (MR) acquisition reduces the signal-to-noise ratio; therefore, a compromise must be determined [7].
A further complication is the partial volume (PV) effect, whereby a single pixel may contain variable amounts of GM, cerebrospinal fluid (CSF), and white matter (WM) [7]. The PV effect can be reduced by reducing voxel size. Additionally, a double inversion recovery (DIR) sequence [8] has been designed to overcome the PV effect. Previous studies [9, 10] have successfully implemented DIR as a two-dimensional (2D) multislice sequence [7]. This DIR sequence extends the commonly used fluid-attenuated inversion recovery sequence for CSF suppression by adding a second 180° radiofrequency (RF) pulse, allowing the simultaneous suppression of signals from two different tissues with different T1 relaxation times [7, 8]. A WM-attenuated inversion recovery (WAIR) image with an enhanced GM region can be obtained using the DIR sequence while suppressing the WM and CSF regions. Similarly, a GM-attenuated inversion recovery (GAIR) image with an enhanced WM region can be obtained with the DIR sequence while suppressing the GM and CSF regions. To suppress two different tissues, the DIR sequence scanning parameters must be optimized. The typical parameters include two different inversion times (TI): a long inversion time (TI-1st), which is the duration between the two inversion pulses; and a short TI (TI-2nd), which is the duration between the second inversion pulse and the excitation pulse. Figure 1 shows the DIR sequence chart.
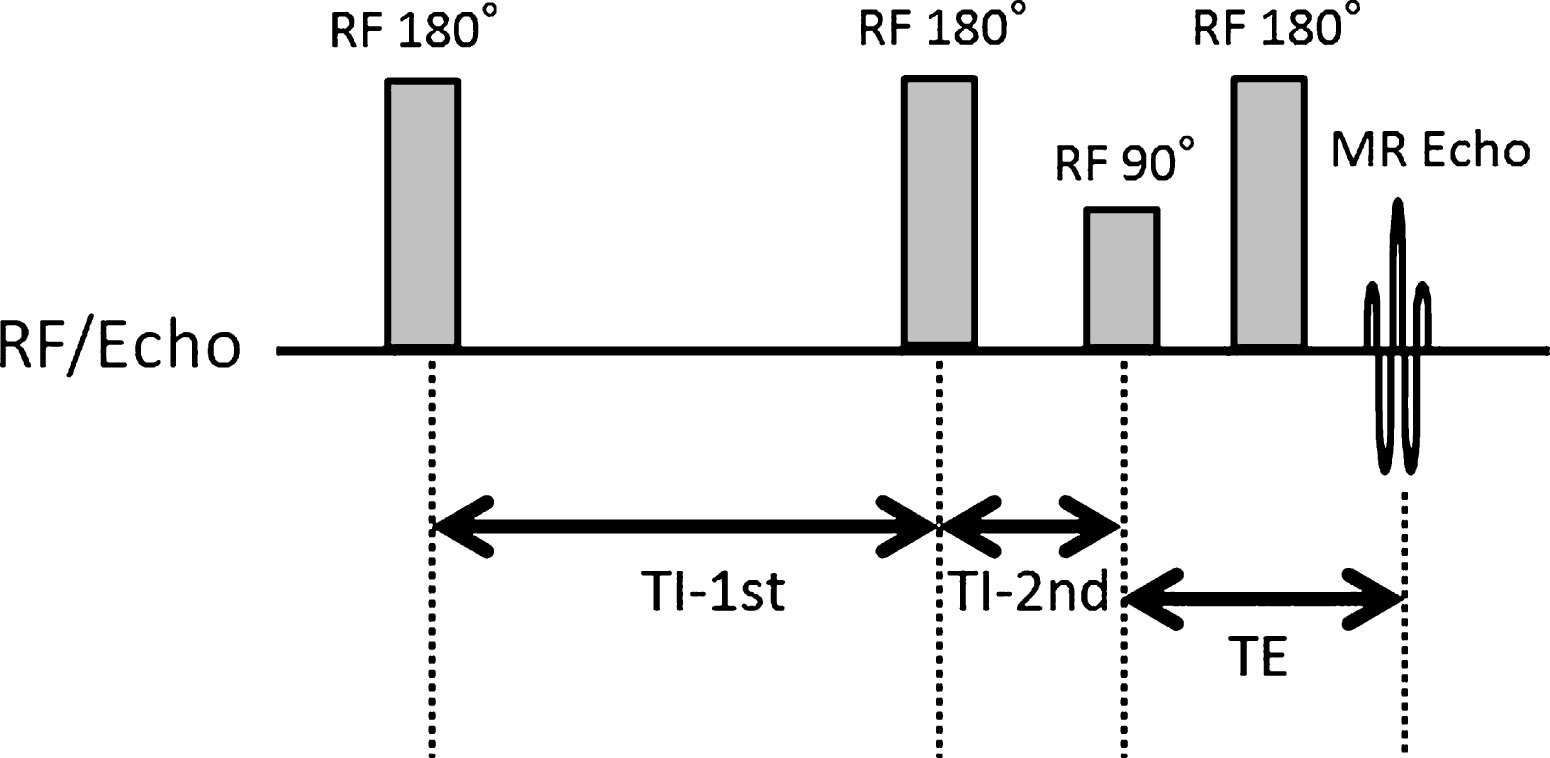
A sequence chart of the performed DIR MRI. TI-1st is the duration time between the two inversion pulses. TI-2nd is the duration time between the second inversion pulse and the excitation pulse.
It is difficult to optimize the typical parameters for individual DIR MR imaging (MRI). Therefore, nearly all published studies have used parameters from previous reports or parameters that are experimentally determined through phantom studies. In a report published by Redpath and Smith [8], they provide methods on how to determine typical parameters using repetition time (TR), echo time (TE), and the T1 value of each suppressed tissue. The purpose of this study was to evaluate a new method for optimizing DIR sequence scan parameters using a T1 map sequence and a newly developed analysis algorithm.
Participants and materials
Twelve healthy volunteers (9 men, 3 women; age range, 22–39 years; average age, 25.1 years) were included in this study. All volunteers underwent T1 mapping and DIR MRI with a 1.5-T MRI scanner (Ingenia 1.5T; Philips Medical Systems, Best, The Netherlands). This study design was approved by our Institutional Review Board, and all volunteers provided written informed consent for participation.
Optimization method for DIR images
Our method for optimizing the DIR sequence scan parameters comprised of the following steps: 1) measurement of GM and WM T1 values on the T1 map obtained from a mixed sequence, 2) calculation of the optimized DIR sequence scan parameters using the developed analysis algorithm, and 3) performance of DIR MRI using the optimized parameters. Measurement of T1 values
We obtained T1 and T2 maps of each volunteer using a mixed sequence. This mixed sequence utilizes a ratios and least squares algorithm [11] and simultaneously obtains T1 and T2 maps within only a few minutes. Scan parameters of the mixed sequence were as follows: spin echo relaxation time, 1000 ms; inversion time, 2260 ms; TE, 15 and 100 ms; TI, 500 ms; field of view (FOV), 256×256 mm; matrix size, 256×256; slice thickness, 3 mm. GM and WM T1 values were obtained from regions of interest that were drawn on the T1 map (Fig. 2). The T1 value of the CSF region is similar to water and therefore has a long T1 value that is difficult to measure. Therefore, the T1 value of the CSF region was manually defined as 4,250 ms [12].
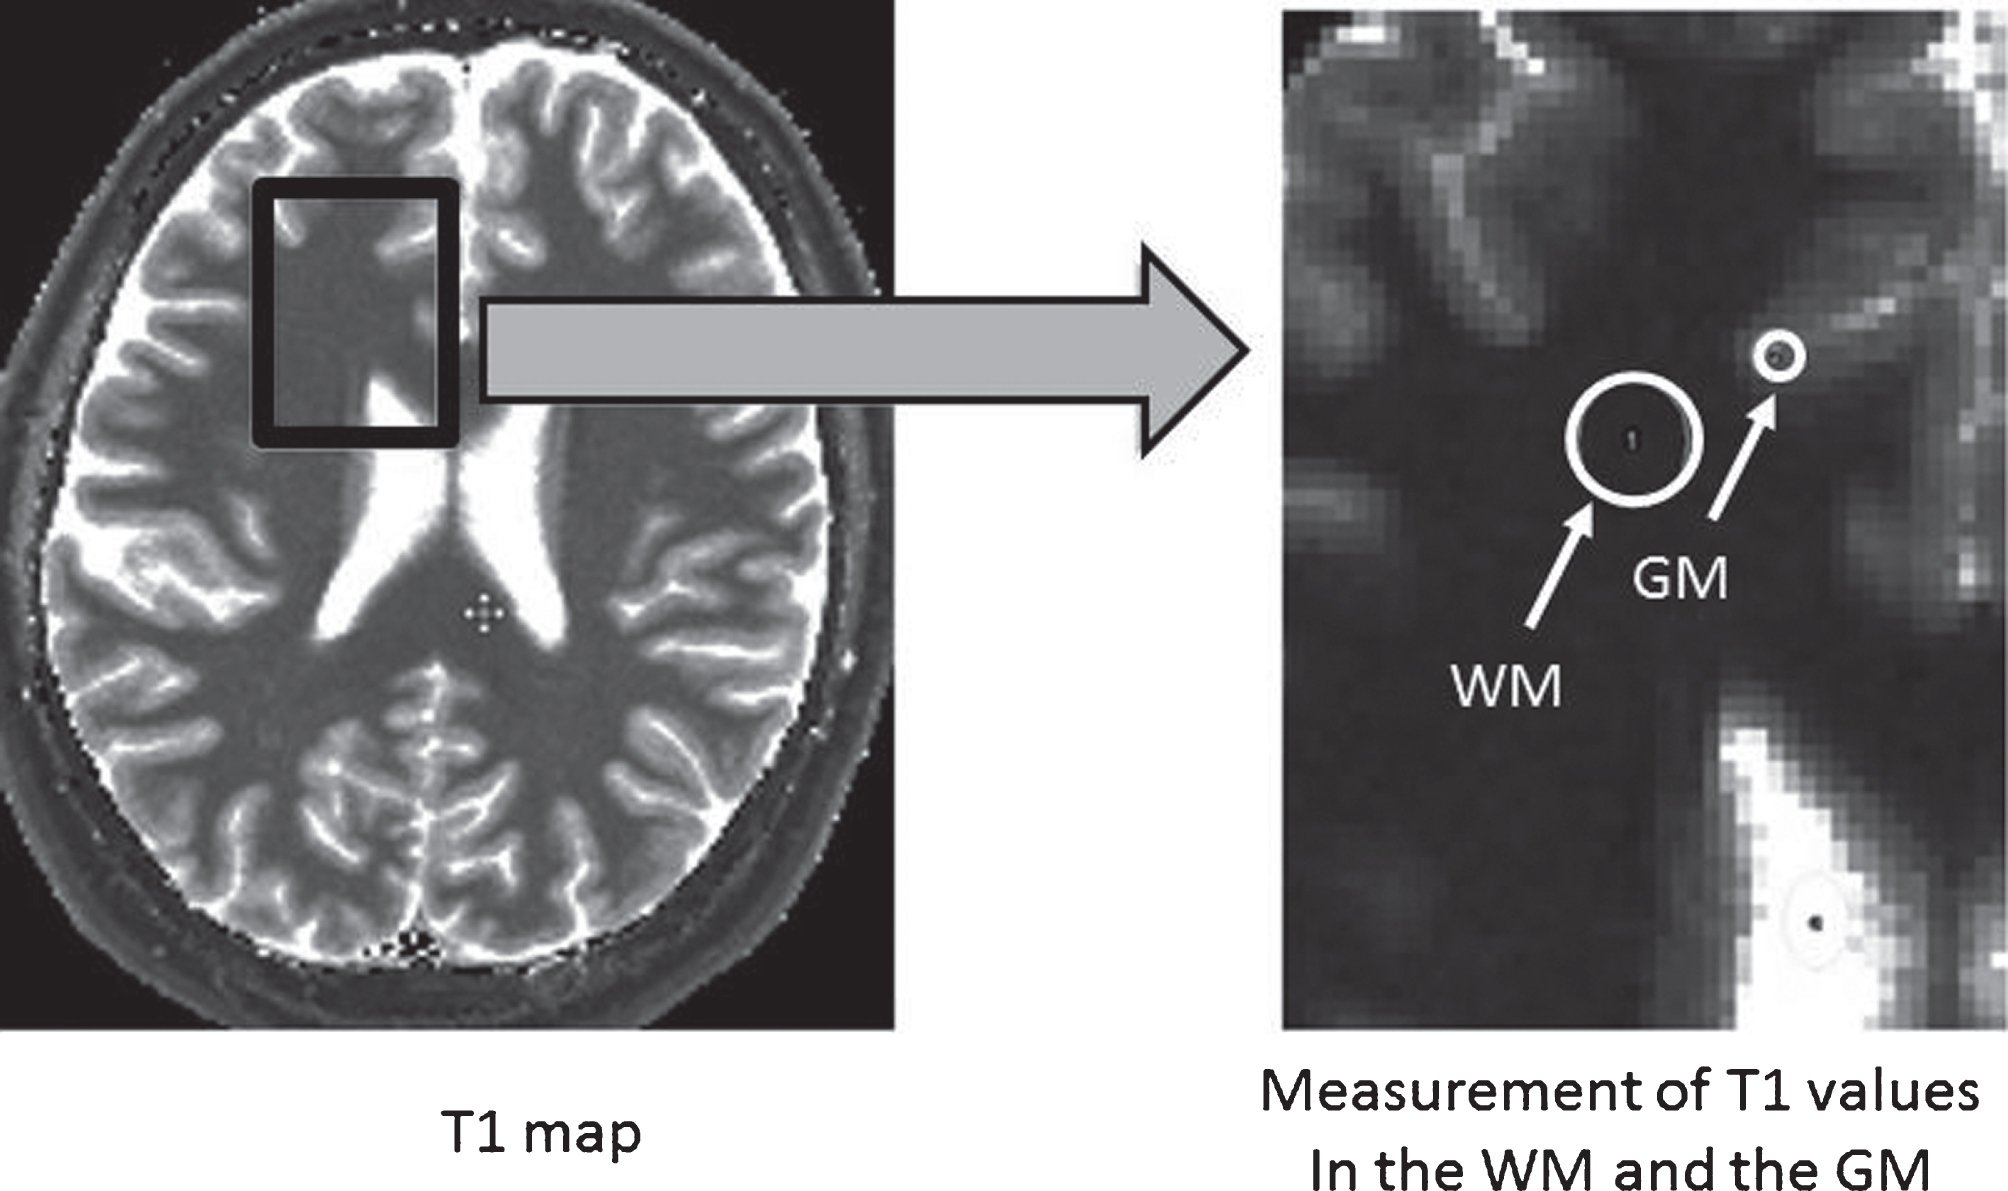
Measurement of T1 values of WM and GM on the T1 map. The T1 map was automatically obtained using a mixed sequence. It was possible to optimize DIR scan parameters for each individual volunteer using measured T1 values.
Calculation of optimized scan parameters of the DIR sequence
Software was used to calculate optimum TI-1st and TI-2nd values from several initial parameters (TR, TE, and the T1 values of two different suppressed tissues). Figure 3 shows a flow chart of the steps used to calculate the optimum TI-1st and TI-2nd values. The software calculated the simulated signal intensity of WM, GM, and CSF from a range of TI-1st and TI-2nd values using a DIR theoretical equation derived from the Bloch equation. Among the usable range of TI-1st and TI-2nd values, the minimal values of the two suppressed tissues (the WM and the CSF) were determined. The optimal TI-1st and TI-2nd values were those that yielded the most minimal WM and CSF values.
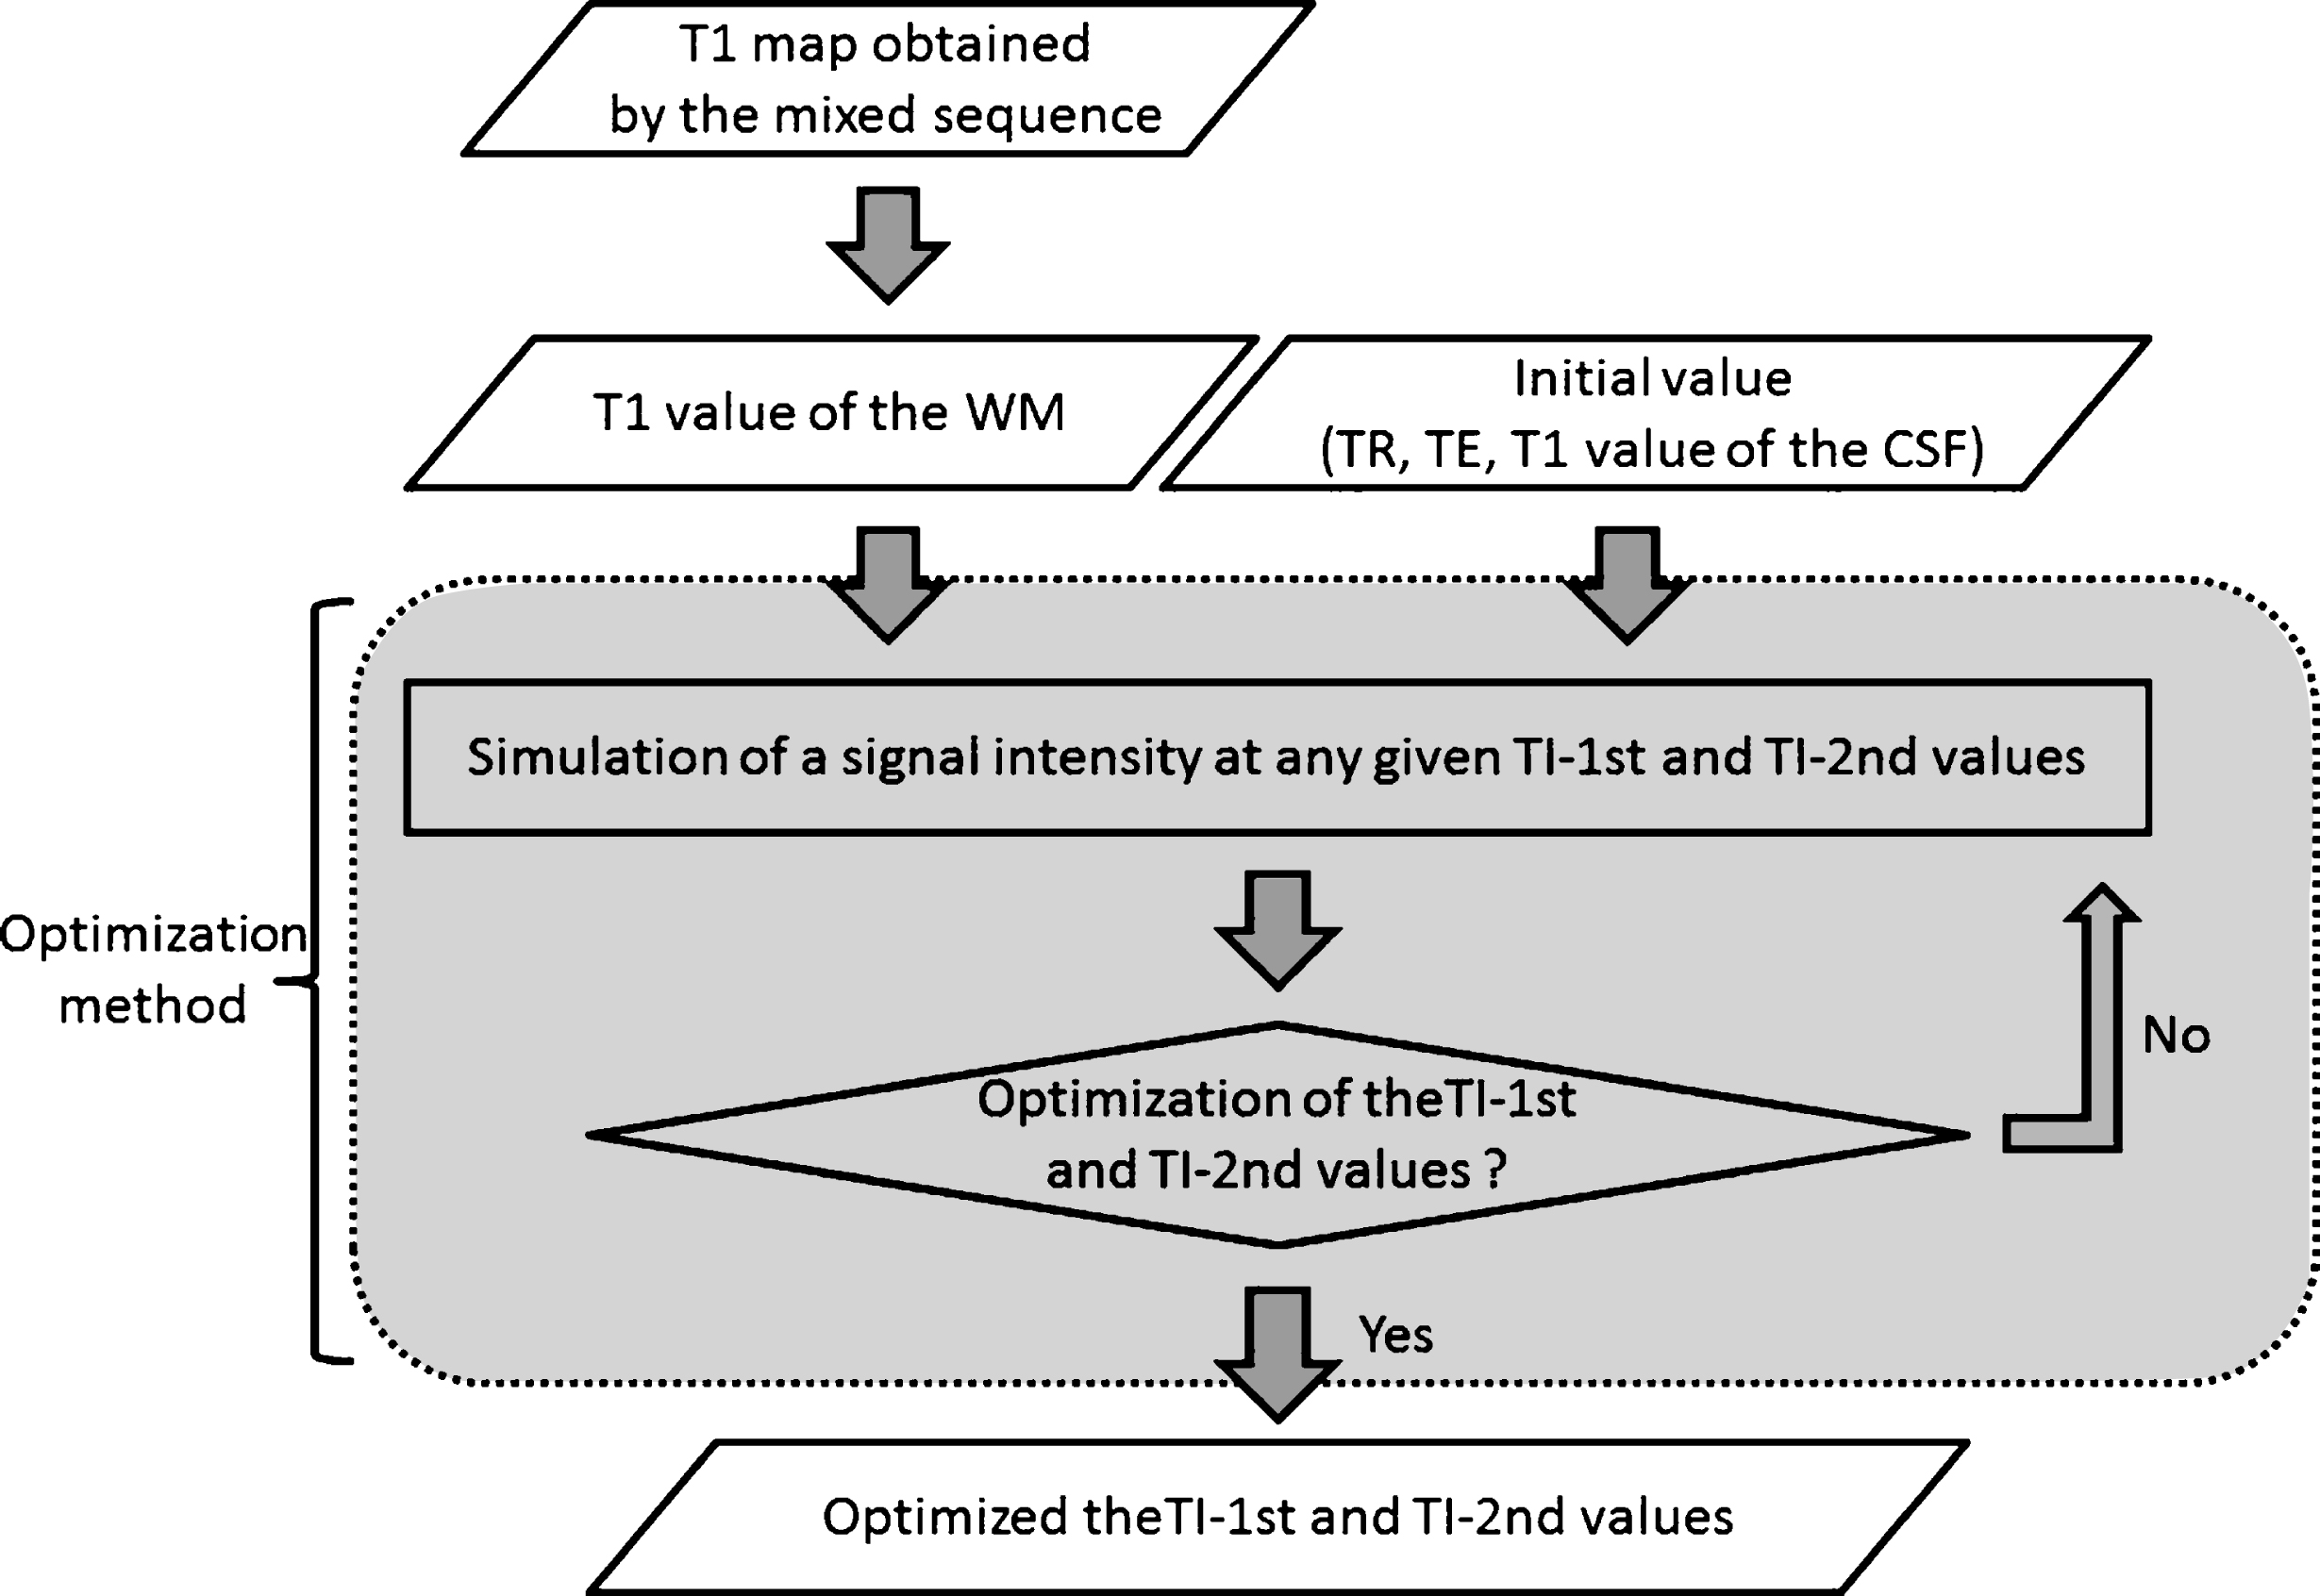
A flow-chart of the steps performed to optimize the TI-1st and TI-2nd scan parameters.
Performance of DIR MRI using the optimized parameters
The TI-1st was the inversion time between the first and second 180° inversion RF pulses, while the TI-2nd was the inversion time between the second 180° inversion RF pulse and the 90° RF pulse. These optimized DIR sequence parameters were calculated from several initial parameters (TR, TE, and others) as well as from T1 values of the suppressed tissues, which were obtained from the mixed sequence. Optimized DIR images, such as WAIR, were obtained from the DIR sequence by using individually optimized TI-1st and TI-2nd parameters. The other scan parameters were as follows: TR, 6500, 9805, and 12400 ms; TE, 50 ms; FOV, 240×240 mm; matrix size, 240×240; slice thickness, 3 mm.
To evaluate our optimization method, we obtained DIR images using scan parameters reported in previous studies [10, 13–15]. Both these scan parameters and the optimized scan parameters are shown in Table 1.
Scan parameters for the DIR sequence. “Optimized” values were calculated using our optimization method. “Previous” values are those provided in previous reports
Scan parameters for the DIR sequence. “Optimized” values were calculated using our optimization method. “Previous” values are those provided in previous reports
WAIR images were obtained using both optimized scan parameters and previously reported scan parameters, and contrasts between GM and suppressed signals (C-GM) were measured. A high C-GM signifies that GM can be clearly observed. C-GM was calculated using the following formula:
The WAIR images obtained using the optimized parameters and those obtained using previously published methods were independently evaluated by three reviewers, each with over 8 years of clinical experience, to assess overall image quality. The coordinator of the study showed the images in a random order on a medical liquid crystal display (LCD) for individual evaluation of 5 parameters of image quality by the reviewers, each of whom were blinded to the parameters of the WAIR images. The reviewers graded images for degree of tissue signal suppression (WM and CSF), contrast of GM, image noise, and sharpness (blurring of WM) using a 5-point scale (1, poor; 2, fair; 3, good; 4, very good, 5, excellent).
Statistical analysis
Statistical analysis was performed using commercial software (Prism 5; GraphPad Software, Inc., San Diego, CA. MATLAB R2016b; Mathworks, Inc., Natick, MA). The contrasts (C-GM and C-WM) between the current method and previous methods were compared using a Wilcoxon rank-sum test. In addition, the five image quality parameters that were scored by observer evaluation were compared via parameter-method using a Wilcoxon rank-sum test.
Results
Results of T1 values of the GM and WM and optimized scanning parameters
Table 2 shows the GM and WM T1 values obtained by mixed sequence. The mean GM value and standard deviation was 545.2±15.8 ms, while the mean WM value and standard deviation was 1199.7±75.0 ms. Table 2 also shows the optimized TI-1st and TI-2nd for each TR condition. These optimized parameter values were similar among all volunteers and were closely related to TR. As a result, personalized scanning parameters were calculated using individual T1 values and our optimization method for each TR condition.
T1 values of GM and WM and optimized TI-1st and TI-2nd scanning parameters obtained using the measured T1 values and our optimization method
T1 values of GM and WM and optimized TI-1st and TI-2nd scanning parameters obtained using the measured T1 values and our optimization method
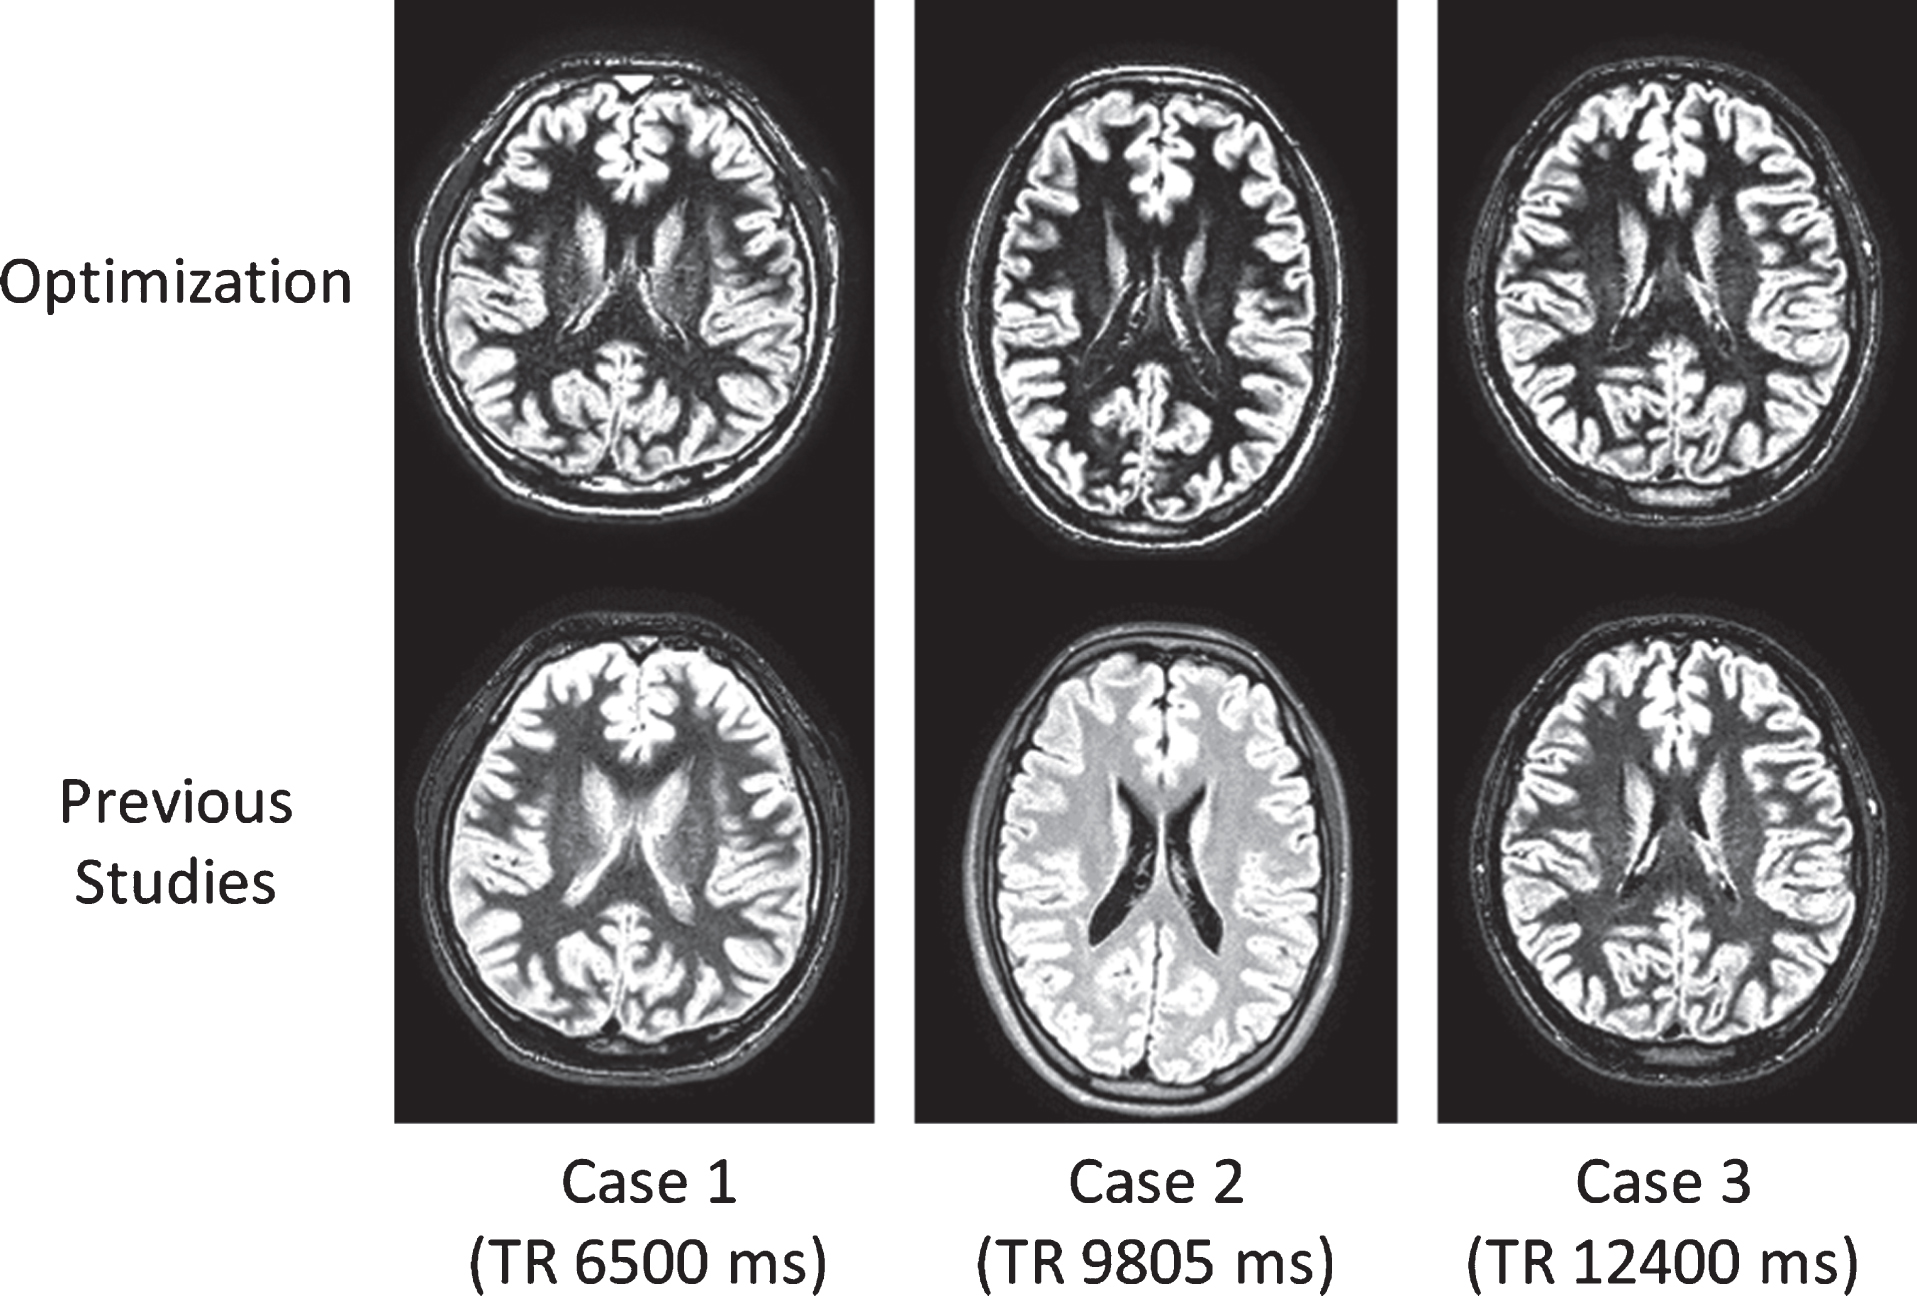
Figure 4 shows representative WAIR images obtained using optimized parameters and those obtained using previously published parameters. Using the optimized DIR sequence scan parameter method, WM and CSF were uniformly suppressed and GM was readily apparent in all scan conditions. In contrast, WM and CSF were not correctly suppressed when the scan parameters from previous studies were used. Figure 5 shows examples of WAIR images with incorrectly suppressed WM and CSF that were obtained using previously reported parameters. When the TR was 6500 ms, the CSF was not correctly suppressed in some cases. Furthermore, when the TR was 9805 or 12400 ms, the WM was not correctly suppressed in some cases. In particular, when the TR was 9805 ms, almost all cases showed WAIR images with poor contrast using the previously published imaging methods. In contrast, it was possible to acquire WAIR images in which WM and CSF were properly suppressed when using optimized scan parameters.
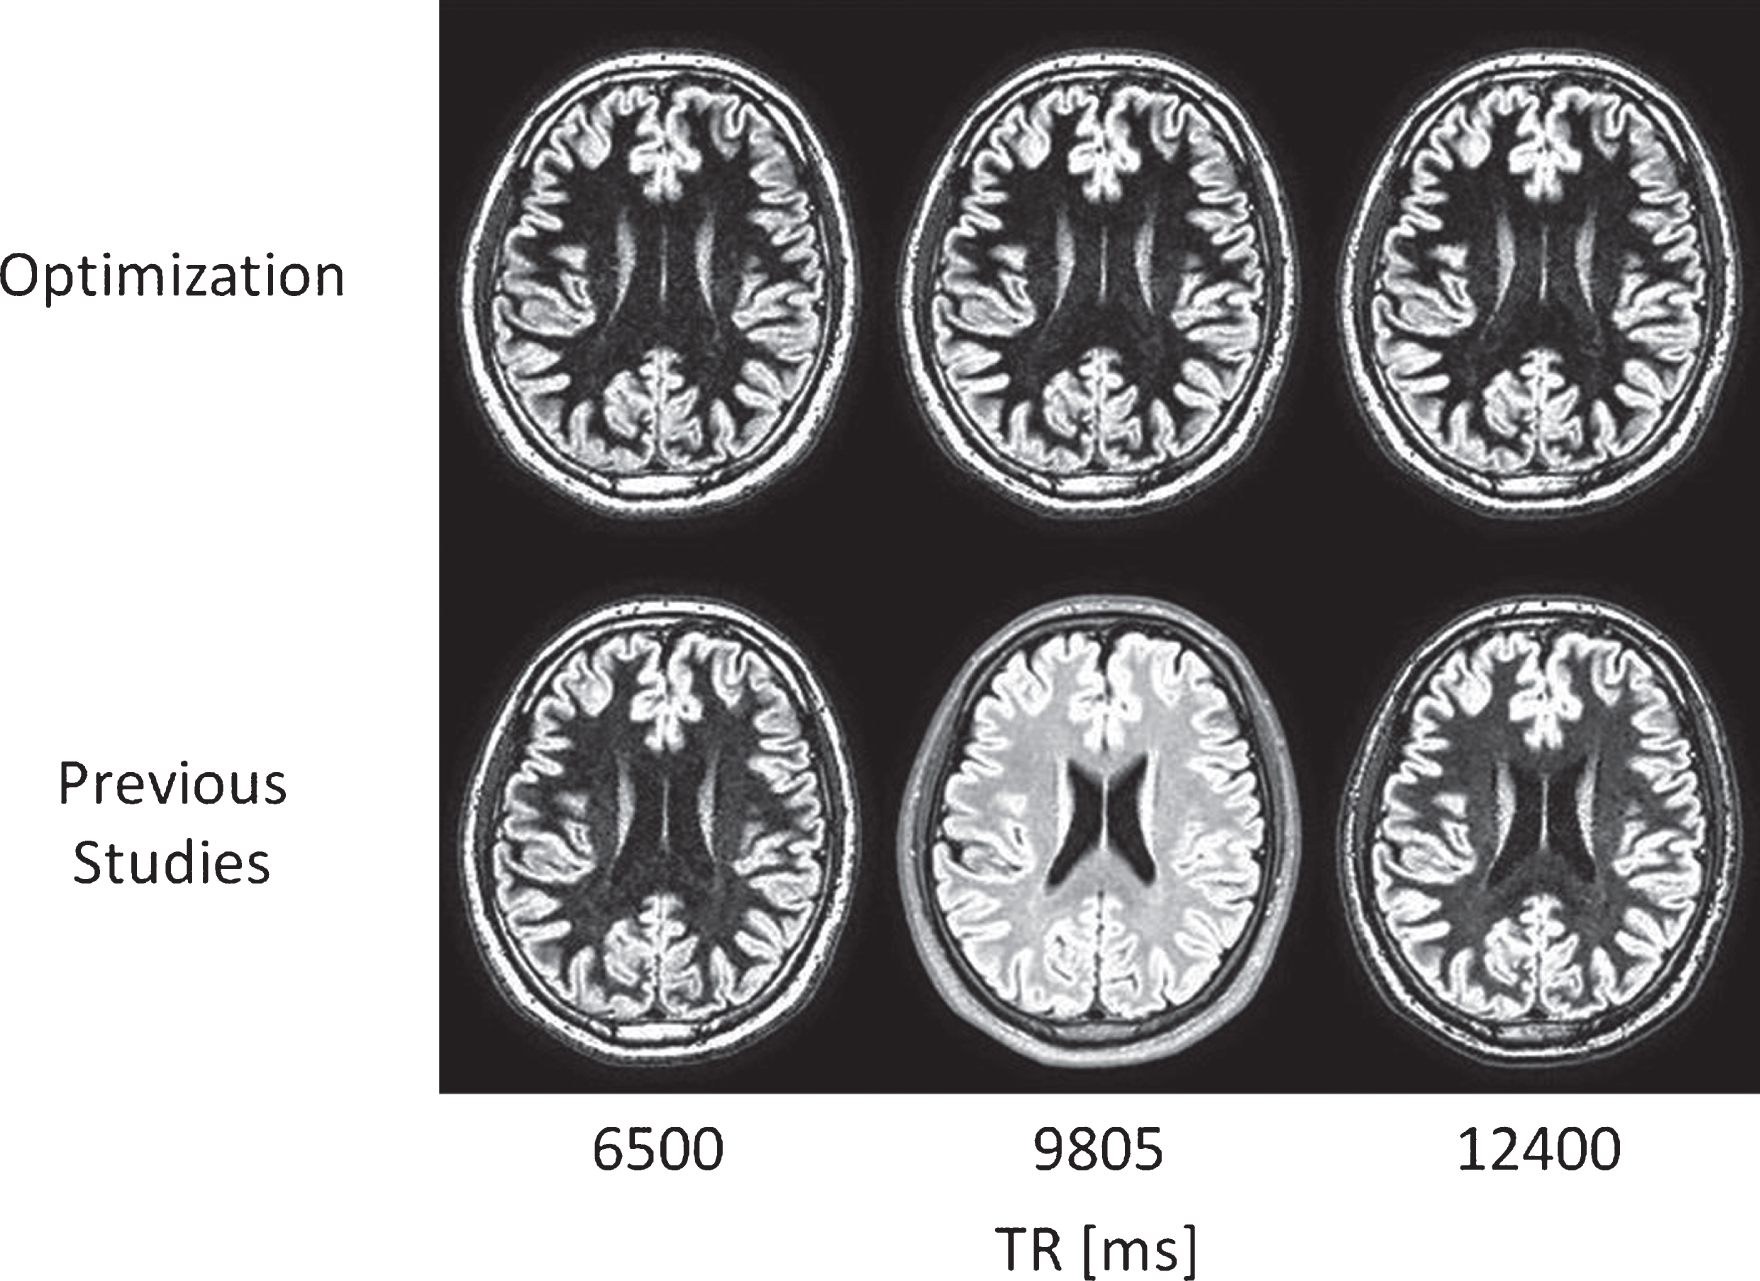
WAIR images obtained using optimized parameters and those obtained using previously reported parameters in one volunteer. The window width was the length between the 5th and 95th percentile values for each image. The window level was the median value of each image. Using optimized parameters, the WM and CSF regions were uniformly suppressed and GM was clearly apparent in all scan conditions. In contrast, GM and CSF were not correctly suppressed when the scan parameters from previous reports were used.
WAIR images in which WM and CSF were not correctly suppressed when using previously reported parameters. The upper row shows the WAIR images obtained using optimized parameters in the same volunteers. By using optimized scan parameters, it was possible to acquire WAIR images in which WM and CSF signals were correctly suppressed.
Figure 6 shows the C-GM results from images obtained under different TR conditions using optimized parameters and those obtained using previously reported parameters. At all TR conditions, the C-GM values were significantly higher when using the optimized parameters compared with the previously published parameters (p < 0.05). This result suggests that our method for optimizing parameters allows for the correct suppression the MRI signals of two different tissues.
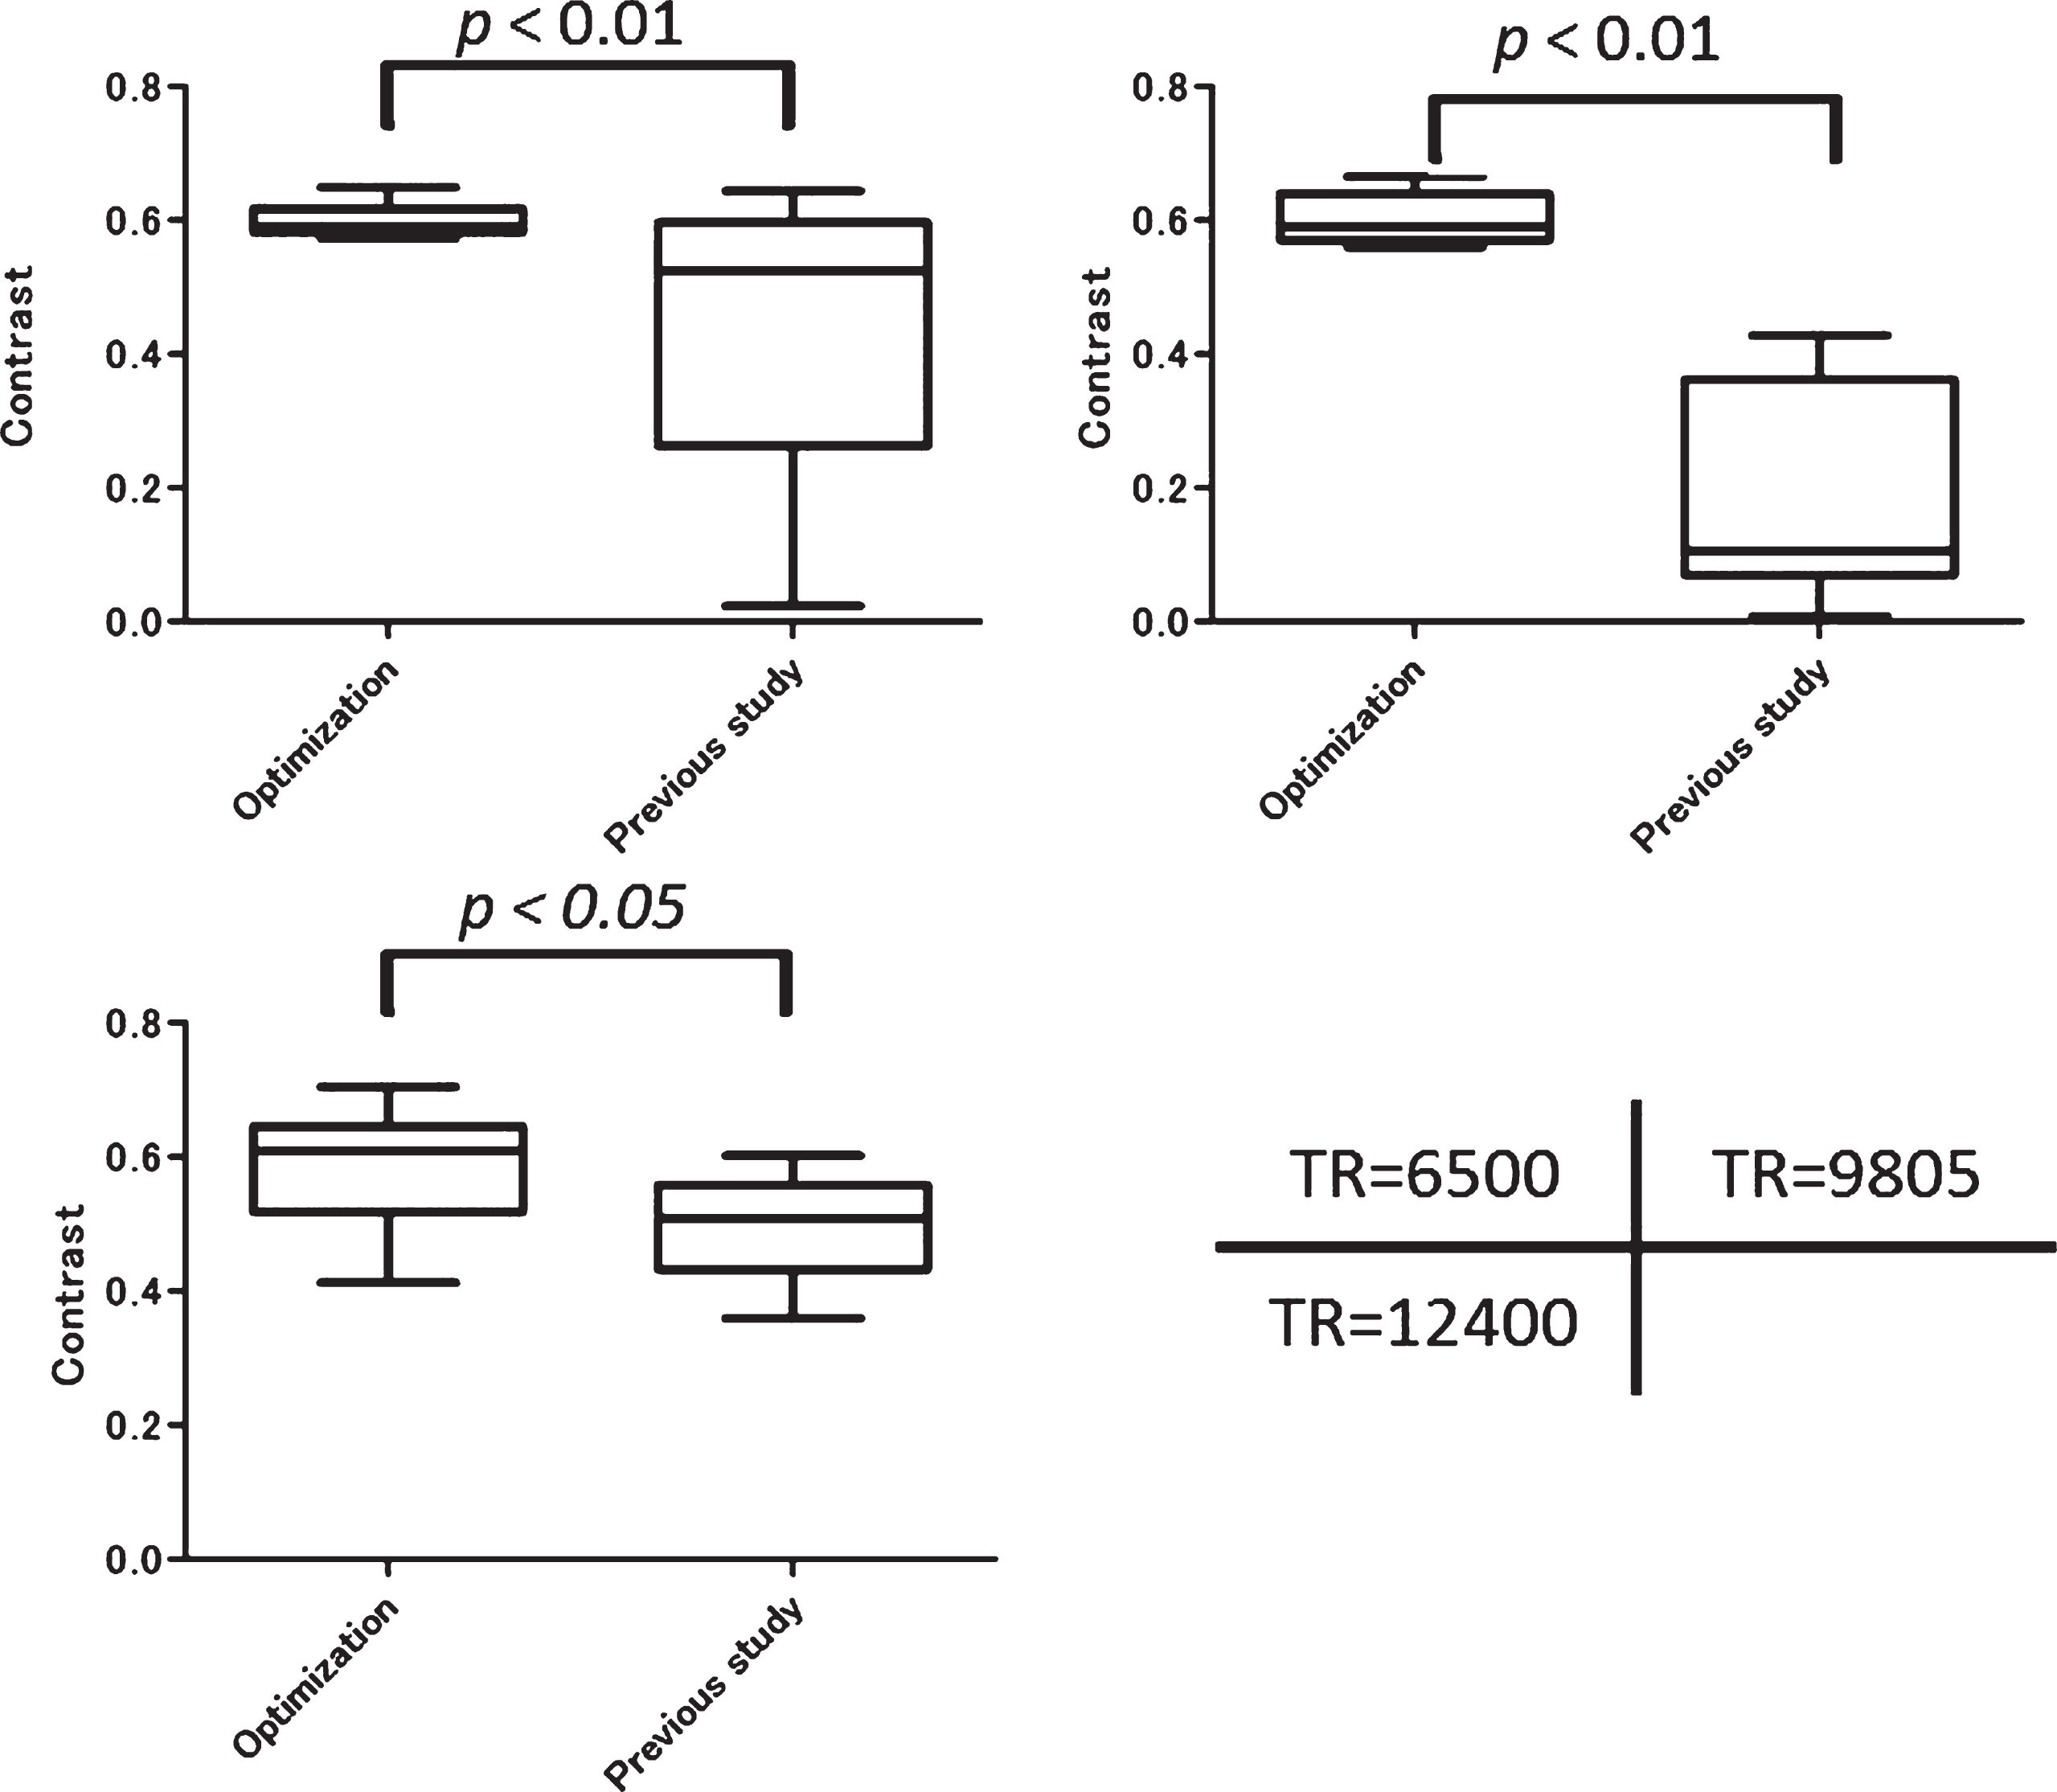
GM contrast (C-GM) values for all TRs. For all scan parameters, C-GM was significantly higher in images obtained using optimized parameters compared with those obtained using previously reported parameters (p < 0.05).
Five image quality parameters, including overall image quality, were qualitatively evaluated by three reviewers for both the images obtained using individually optimized parameters as well as those obtained using previously published imaging parameters. The averages of these scores are displayed in Table 3. The scores for WM signal suppression and those for GM contrast were significantly higher for the images obtained using optimized parameters compared to those obtained using previously reported parameters (p < 0.01). When TR was set to 6500 ms, the scores of CSF suppression were higher for the images obtained using optimized parameters compared with those obtained using previously reported parameters (p < 0.05). In other TR conditions, the rating scores of CSF suppression were not significantly different; however, rating scores of CSF suppression were higher than 4.7 in all conditions for images obtained using optimized parameters. There were no significant differences between parameter methods for either noise or sharpness.
Average rating scores obtained by observer evaluation. Asterisks indicate significant differences between the images obtained using optimized parameters and those obtained using previously reported parameters (p < 0.05)
Average rating scores obtained by observer evaluation. Asterisks indicate significant differences between the images obtained using optimized parameters and those obtained using previously reported parameters (p < 0.05)
In this study, we describe a method for optimizing DIR MRI sequence scan parameters that incorporates T1 mapping and a newly developed analysis algorithm. The WAIR images obtained using the resulting optimized parameters in all different scan conditions were similar to each other (Fig. 4), and these images showed significantly higher GM contrast compared to the images obtained using previously reported parameters. In addition, the rating scores of WM and CSF suppression were remarkably high for the images obtained using optimized parameters, and GM contrast rating scores were significantly higher in these images compared with those obtained using previously reported parameters (Table 3). Figure 5 shows WAIR images obtained using previously reported parameters that exhibit incorrectly suppressed CSF and WM. These cases required individually optimized scan parameters in order to obtain WAIR images in which WM and CSF signals were appropriately suppressed. Using our method, it was possible to optimize the scanning parameters for individual participants during MRI examinations. Although it is normally difficult to briefly measure the T1 values of each region, it is possible to obtain T1 values of these regions using a mixed sequence that provides T1 and T2 maps within only a few minutes. Many previous studies have described T1 values [12, 17]; however, there is a large range for these reported values. Further, T1 values are markedly different in female and male subjects [16]. Therefore, individual optimization of scanning parameters is necessary in order to correctly suppress two different tissues in DIR MRI. We were able to calculate optimized TI-1st and TI-2nd values from the known T1 values of the different suppressed tissues using a newly developed analysis algorithm.
DIR has been most often used to study cortical GM lesions, and the accrual of GM lesions has been shown to be correlated with disability in patients with established multiple sclerosis (MS) [18–21]. The presence of these lesions may also improve the specificity of current MS MRI diagnostic criteria [18, 21–23]. A recent combined histopathological and MRI study reported that 90% of cortical MS lesions observed via high-resolution three-dimensional (3D) DIR were confirmed histopathologically [24]. Using WAIR images, it is possible to evaluate and diagnose cortical GM lesions without the complication of the PV effect [7]. Therefore, to correctly diagnose GM lesions, it is desirable to obtain high-resolution WAIR images with correct suppression of GM and CSF signals. Our optimization method provided correctly suppressed DIR images in both standard 2D DIR as well as in high-resolution 3D DIR MRI.
This study has several limitations. First, this was a volunteer study due to the difficulty of obtaining clinical MR images using non-optimized scan parameters. A second limitation is that all MRI vendors lack a convenient sequence, such as the mixed-sequence, which measures T1 values of WM and other tissues in a short period of time, but our optimization method requires measurement of T1 values of the suppressed tissues without the CSF. Fortunately, it has recently been made possible to measure T1 values using the Look-Locker sequence, which can measure T1 values of each tissue in a short time [25]. In the future, easy-to-use measurement sequences, such as the mixed sequence and the Look-Locker sequence, may grow in popularity.
Conclusion
Based on our study findings, we conclude that it is possible to obtain correctly suppressed DIR images by using an optimization method for MRI scan parameters that is based on a mixed sequence and a newly developed analysis algorithm. This finding may be valuable for future imaging studies involving degenerative diseases.
Footnotes
Acknowledgments
This work was supported by JSPS KAKENHI Grant Number JP15K19206.