
Abstract
The study analysed the medical imaging technology business cycle from 1981 to 2009 and found that the volatility of consumption in Chinese medical imaging business was higher than that of the developed countries. The volatility of gross domestic product (GDP) and the correlation between consumption and GDP is also higher than that of the developed countries. Prior to the early 1990s the volatility of consumption is even higher than GDP. This fact makes it difficult to explain the volatile market using the standard one sector real economic cycle (REC) model. Contrary to the other domestic studies, this study considers a three-sector dynamical stochastic general equilibrium REC model. In this model there are two consumption sectors, whereby one is labour intensive and another is capital intensive. The more capital intensive investment sector only introduces technology shocks in the medical imaging market. Our response functions and Monte-Carlo simulation results show that the model can explain 90% of the volatility of consummation relative to GDP, and explain the correlation between consumption and GDP. The results demonstrated the significant correlation between the technological reform in medical imaging and volatility in the labour market on Chinese macro economy development.
Keywords
Introduction
The real economic cycle (REC) model is the most influential model for analysing the macroeconomic fluctuations in the developed countries in the 1980s and 1990s. King et al. [1–4], Christiano and Eichenbaum [5–11], Cogley and Nason [12, 13] and Gali [14–17] play an important role in the development of the dynamic general equilibrium model. The single sector basic model can explain the macroeconomic fluctuation of the United States and other developed countries to a great extent by introducing the impact of biomedical production technology in terms of medical imaging. For example, the consumption fluctuation is lower than the GDP fluctuation, and the investment fluctuation is much higher than the GDP fluctuation. But the basic model suffers from difficulties in interpreting the economic cycles of some countries in transition, where the volatility of consumption is more volatile than GDP. For China, consumption volatility and GDP fluctuations are also very close. However, sometimes its consumption volatility is higher than the GDP fluctuations, pertaining to the United States and other developed countries. The analysis of the correlation between consumption and GDP correlation coefficient in the medical imaging sector can give us insights in technological development of a country and its economy.
Although the REC model research in China is still lagging behind the technologically developed western countries based on medical imaging manufacturing, or research and development of medical imaging based diagnostics, some scholars have explained Chinese economic cycle by introducing a variety of biotechnology shocks, such as the fiscal shocks and government purchase shocks or through the hypothesis of a small country’s open economy [18–20]. In contrast to them, this paper assumes that there are three sectors of the economy—two medical imaging products consumer sectors and an investment sector. Here, the consumer sector is divided into labour-intensive and capital-intensive, as well as investment-intensive capital-intensive. The impact of three-sector biomedical imaging production techniques can explain about 90% of consumption volatility in China and the relationship between consumption and GDP, and it not only explains the fact that consumption is more volatile relative to developed countries, but also explains the volatility of consumption in different periods.
Data description and analysis
Since 30 years of reform and opening up of its biotechnology market in the field of medical imaging, China has experienced rapid economic development and its GDP annual growth rate is 9.8%. Figure 1 depicts the trend (logarithm) of China’s major macroeconomic variables: GDP, total consumption, and total investment from 1981 to 2009. The total social fixed asset investment we use as an indicator of investment, using the medical image technology retail consumption of the whole society as total amount of consumption indicators. From the chart the trend of macroeconomic variables can be seen that China’s strong economic growth trend. Although China’s economy is growing rapidly, there are some small fluctuations. This paper will examine the changes and characteristics of the Chinese business cycle after the removal of the growth trend.
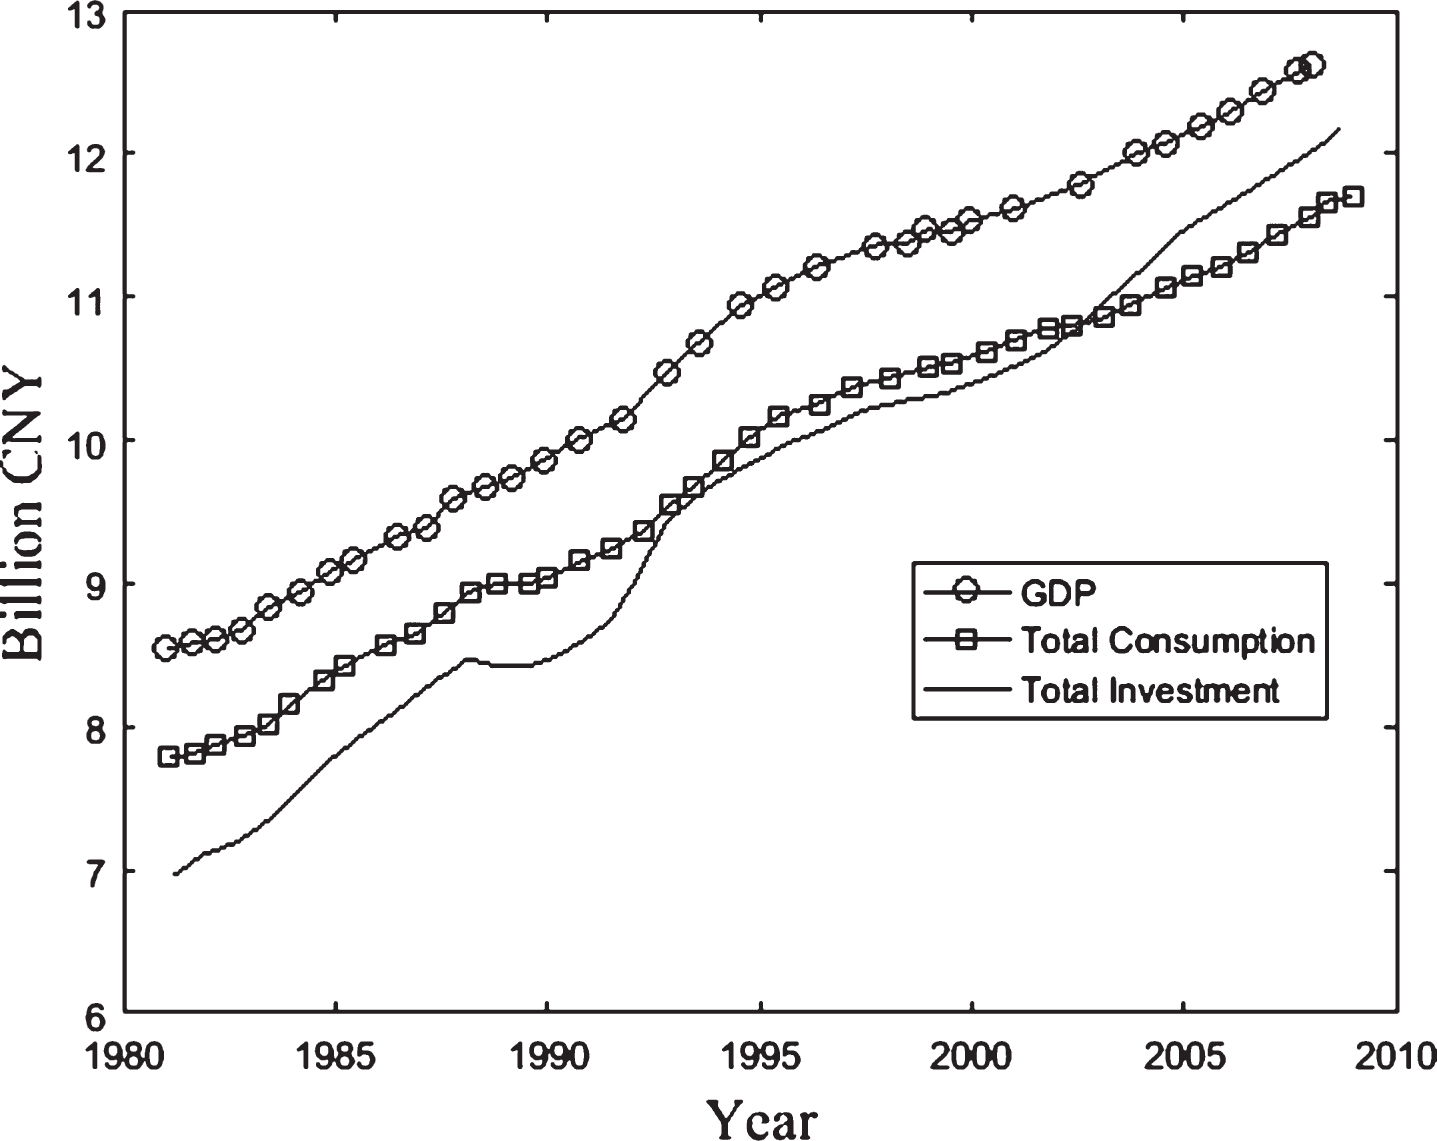
Economic variables trend.
We will use three methods to observe the variation of these variables since the growth trend is removed. The first is to make the regression with the time trend and the time to cast the residual; the second is to use Hodrick and Prescott (HP) filtering method [21–24]; and the third method is the use of the Baxter and King [25–28] proposed BP filtering method. Figure 2 to Fig. 4 depicts the changes of China’s economic cycle under these three methods in turn. It can be seen that the Chinese economic cycle obtained under the three methods is similar. To illustrate this point, Fig. 5 depicts the removal of cyclical changes after the trend graph, which shows HP method trend and BP method under the trend of almost coincidence.
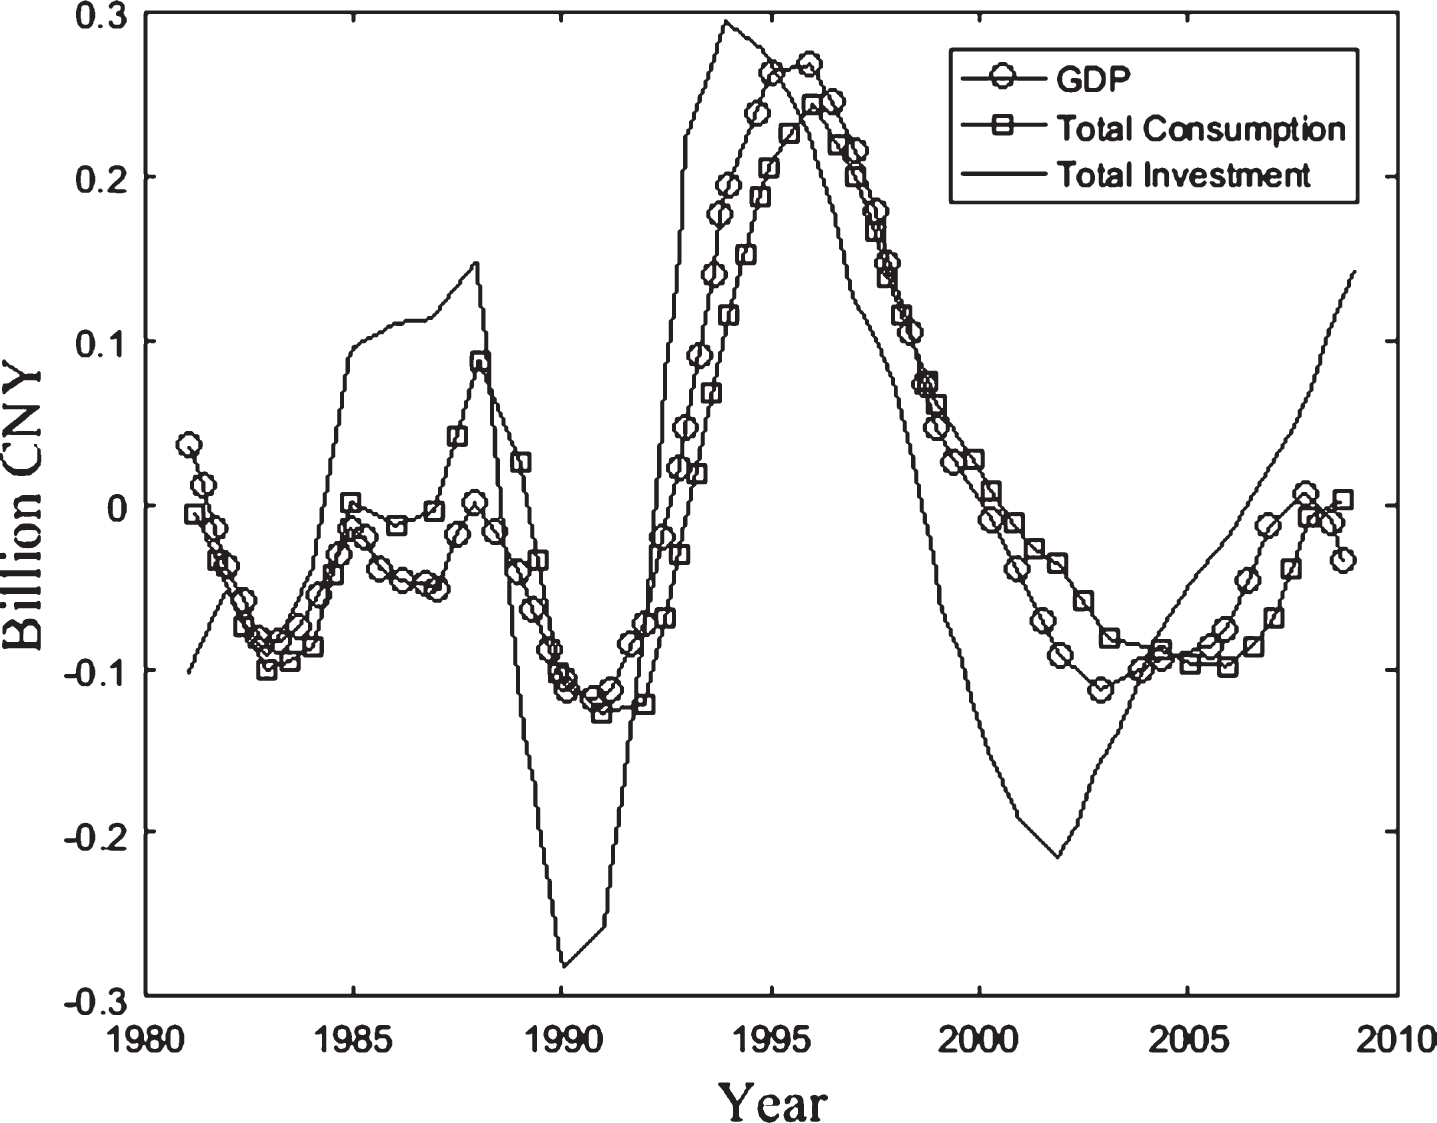
Cycle of economic variables after the time of the castration.

Cycle of economic variables after HP filtering.
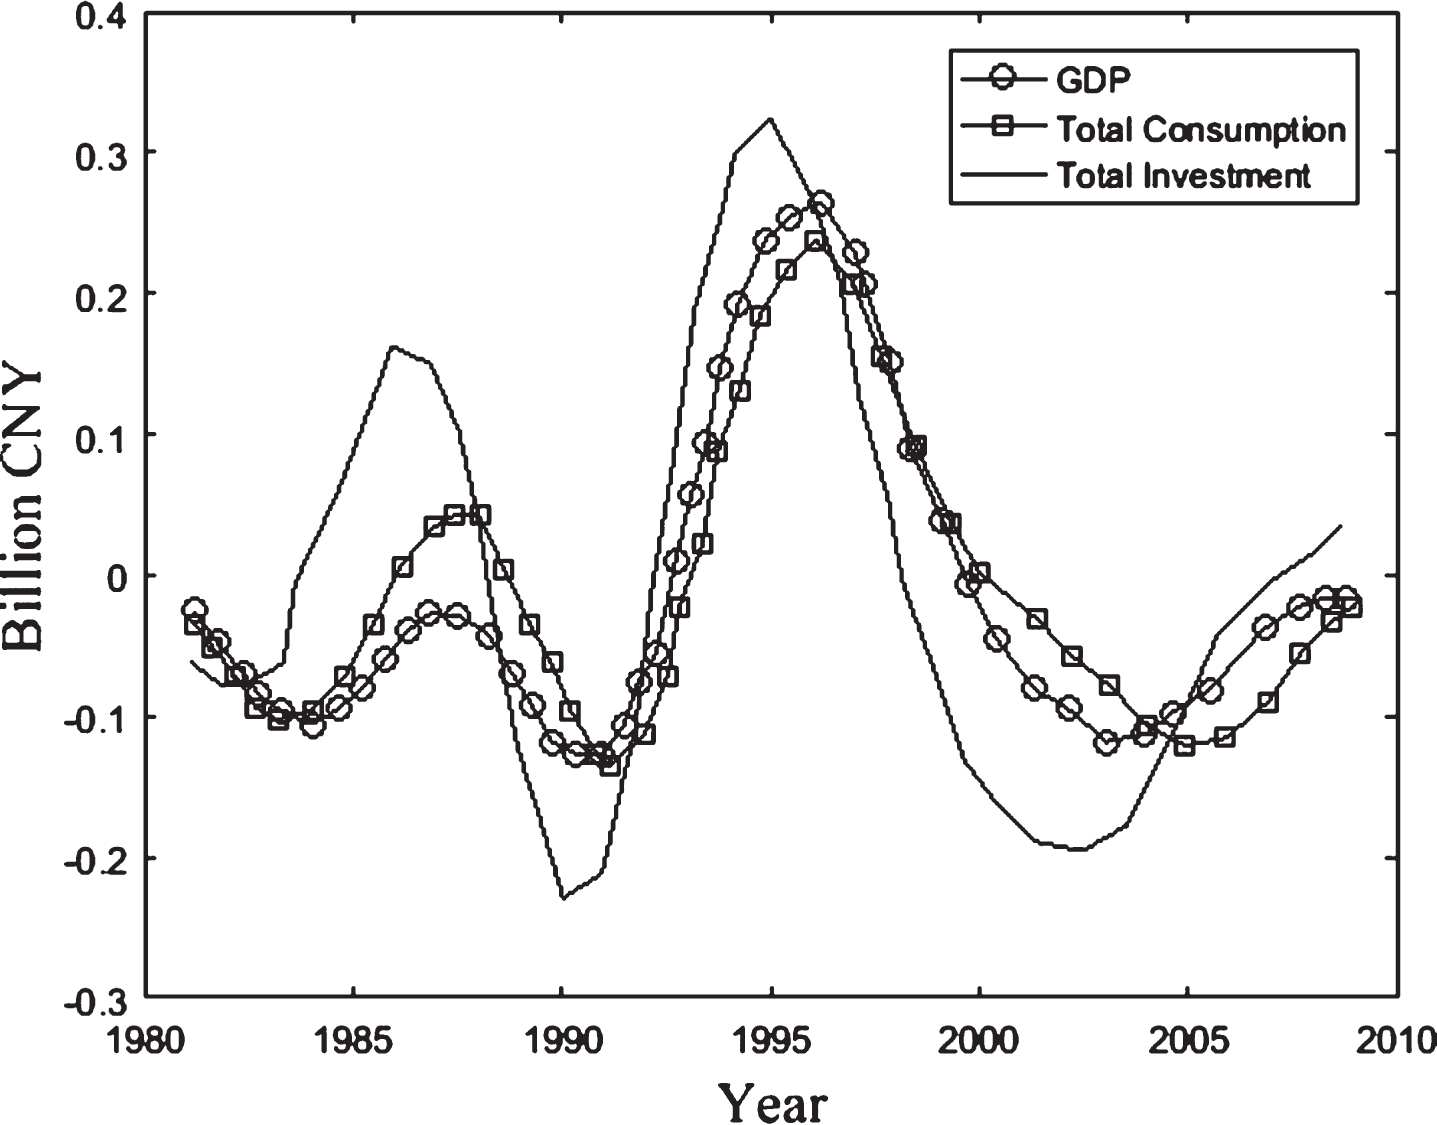
Cycle of economic variables after BP method.
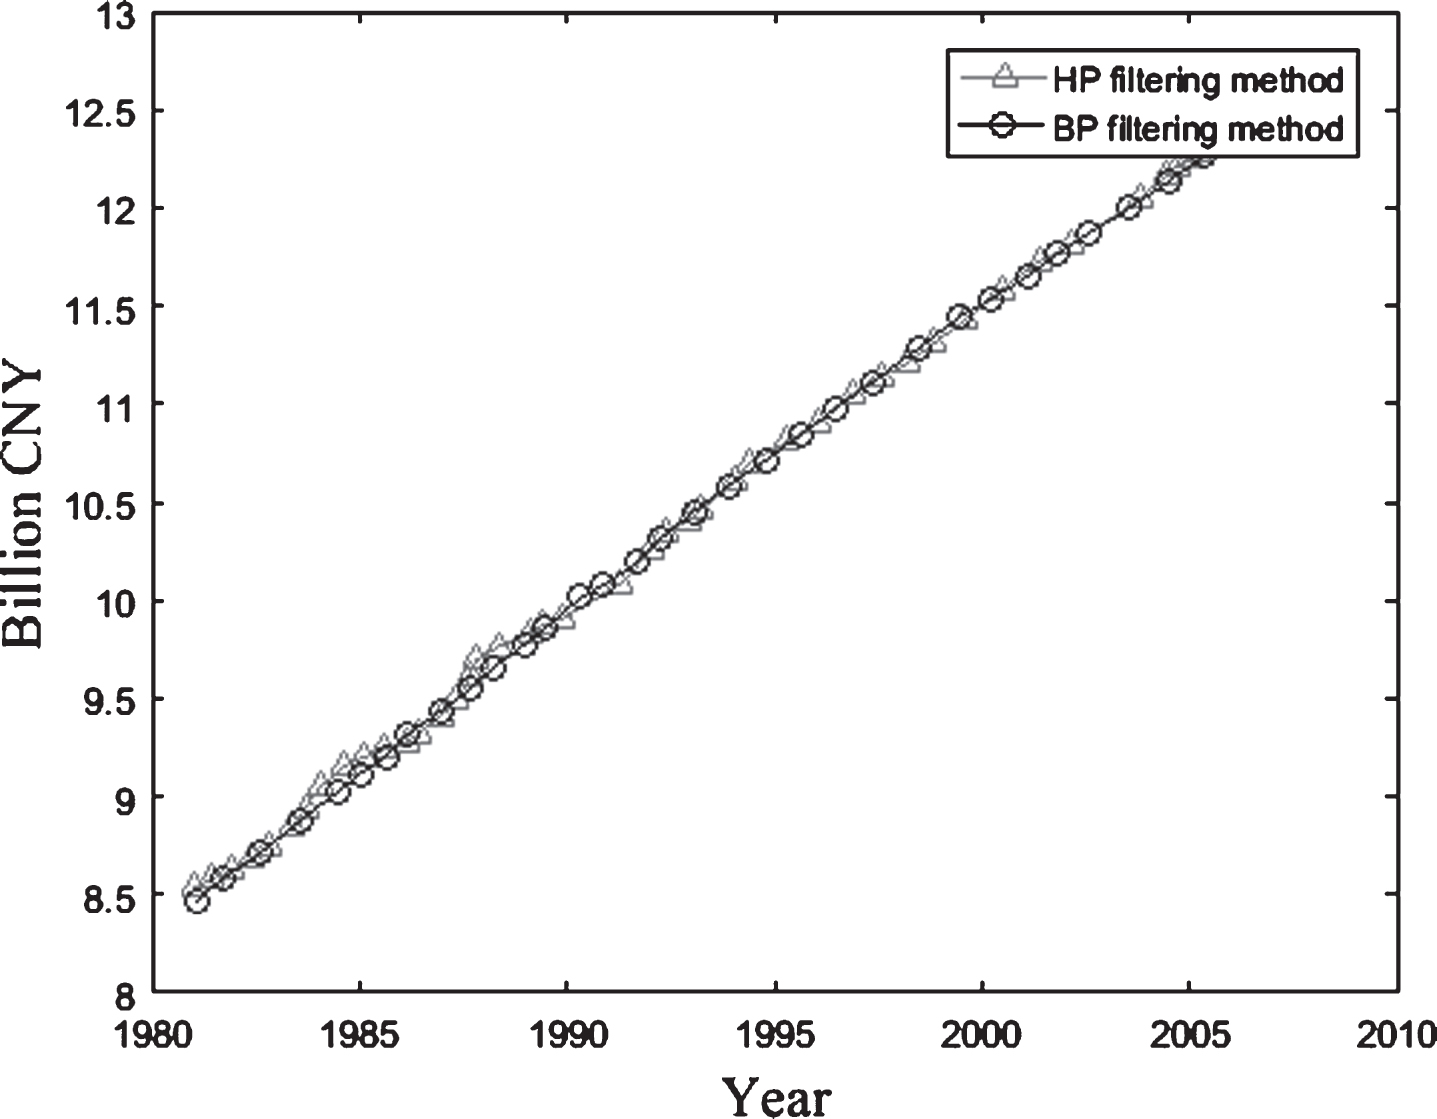
Comparison of GDP growth trends under HP and BP filtering methods.
From the Chinese economic cycle, it can be summarized that GDP, consumption and investment cycle changes pertaining to the biotechnological industries have the following characteristics: 1). Investment volatility is consistent with the technologically developed countries compared to the volatility of GDP; 2). Overall consumption fluctuations and the relationship between GDP volatility; 3). From 1981 to the early 1990s, the consumption fluctuation was much larger than the GDP fluctuation; 4). From 1990 to 2009, the GDP fluctuation was slightly higher than the consumption fluctuation. Therefore, China’s economic cycle relative to the technologically developed countries, the biggest difference is reflected in the biotechnological imaging based consumption, not only consumption fluctuations more than the developed countries, and volatility is still changing.
In order to explain the characteristics of major macroeconomic variables in China, in particular the difference between biotechnology-based and medical imaging technology based consumption and the technologically developed countries, we calculated the standard deviation of each variable under the HP and BP method and the correlation coefficient with GDP, which is shown in Table 1.
Volatility and relevance of each variable with GDP
Table 1 shows the overall consumption fluctuation range and GDP volatility gap is very small, GDP volatility of 1, then consumption of 0.91, and the two methods consistent investment fluctuations greater than the GDP volatility, which are 1.4 and 1.35. The correlation coefficient between consumption and GDP are 0.93 and 0.94, and the correlation coefficient between biotechnology investment and GDP is 0.72 and 0.78. However, consumer volatility was much higher than GDP volatility before the 1990s, reaching about 1.5. During this period, consumption and GDP are still highly correlated. After the 1990s, consumer volatility and overall similar, this time to Less than the volatility of GDP, but more than the consumption of developed countries relative to GDP volatility is greater. The relationship between consumption and GDP is still highly relevant. The correlation between consumption and GDP should be greater than other developed countries, such as the United States only 0.76. In order to explain these relations theoretically, we will set up a three-sector dynamic general equilibrium REC model to explain the fluctuation relation between consumption and GDP.
Three-sector model framework of analysis
In this section, we will consider a central planner problem by introducing a three-sector economy, a labour-intensive consumption sector, a capital-intensive consumption sector, and a capital-intensive investment sector. Consumer chooses consumer goods and distributes labour and capital in three sectors of the medical imaging technology market to achieve the expected utility maximization of their life, and the specific expected utility function is as follows:
Consumer utility depends on two medical imaging technology-based consumer goods, labour-intensive consumer goods, such as laboratory expendables and clothing, and capital-intensive products, such as biomedical imaging industrial products, medical scanners, and medical imaging electronic equipment. In addition, we assume that the consumer preference for these two consumer goods comes with equal weight. At the same time, the consumers’ utility also depends on their experiment time. The preference for leisure is relative to the parameter of consumer goods is θ, and the discount factor is ρ. The central planner is bound by the following:
(1) Investment sector – capital intensive:
(2) Consumption 1 sector - labour-intensive:
(3) Consumption 2 sectors - capital intensive:
The consumer chooses C1t and C2t based on the constraints and the capital and the labour in three departments assigns the realization to be biggest, and the concrete objective function becomes:
We used the Lagrangian method to solve the problem: the Lagrangian multipliers corresponding to C1t and C2t constraints are λ1t and λ2t, and the Lagrangian multiplier corresponding to the capital dynamic equation is λ3t. The following first-order necessary conditions are obtained:
The transversal conditions satisfied by the dynamic model are:
The GDP in the economy is defined as:
According to the biomedical imaging technological sector, wages and capital returns are equal, the use of capital reward equal price can be defined as follows:
The total labor time is defined as:
The general equilibrium of the problem consists of 21 first-order necessary conditions and the constraints, the definition of equation and technology impact process function (first-order autoregressive) a total of 21 equations. Due to first-order necessary conditions in four forward looking rational expectations equation, only one identical expected variable, so we need to re-change these equations into three state equations to retain a desired equation.
After obtaining the general equilibrium, we need to smooth the variables in the model, because the model in the production function set, the variables has been stabilized. Because of the non-linearity of the model, we need to logarithmically linearize the model on the steady-state solution, and therefore we need to calculate the steady-state solution. Here, we only need to calculate the steady state, the share of capital in various sectors, the share of labour and the total output of the various biomedical based departments, according to the first-order conditions and wages between the various departments and capital equal conditions can be calculated at steady state, the above shares are as follows:
The capital share of the investment sector:
Labour-intensive consumption sector Capital share:
Capital-intensive consumption sector capital share:
The total output share of the biotechnology investment sector:
The total output share of labour-intensive consumption sector:
The share of capital-intensive consumption sector in total output:
The labour-intensive consumption sector accounts for the share of total consumption
Capital-intensive consumption sector share of total consumption:
Investment sector labour share:
Labour-intensive consumption sector labour share:
Capital-intensive consumption sector Labour share:
After obtaining the steady-state solution, we will carry on the simulation analysis to the logarithm linearized model, finally obtains the following model frame:
Here, the Y and X are column vectors, and each variable represents the distance between the real values of the variables after the logarithmization and the steady state solutions. The values of the matrices given by M yy , M yx , M xx 0 , M xx 1 , M xy 0 and M xy 1 represent the elasticity of the corresponding economic variables, and Mxe represents the presence or absence of an impact in the biomedical imaging sector.
We will set the parameters of the model, most of our parameters from the standard REC model parameters, such as the utility function of the relevant parameters and technical impact of the relevant parameters. As for the parameter setting in the production function, we require that α〉0.5, andβ〉0.5. Since we examine the capital-intensive and labour-intensive sectors, we will assume that the capital-intensive nature of the investment sector is even higher than the capital-intensive sector, where the capital intensity is higher.
The substitution elasticity σ in the consumption function is 1, so that the utility function becomes the Cobb-Douglas form of the consumer goods in the standard REC model. The value of θ is 1.51, which means that the steady-state working time is about 1/3 of the 24 hours a day, which is consistent with the 8-hour work schedule prevailing in China.
Results
Analysis of impulse response function
We consider the impact of biotechnological shocks on the economy in two cases, one is the lack of flexibility in hi-tech labour supply, and the other is the elasticity of labour supply, which is compatible with China’s situation. Just after the reform and opening up to establish a socialist market economy, can be seen as a transition to a market economy, this time there are a considerable number of state-owned biotechnology based enterprises, the labour supply is very inelastic, because there are a lot of packet distribution. After the 1990s, with the market economic system (the 14th Party Congress in 1992), state-owned enterprises are constantly reforming, more and more researchers are free to choose a career, as opposed to the previous, the labour force Supply becomes more and more flexible. Therefore, we set the labour supply elasticity of the two scenarios to be described by the impact of biomedical imaging technology on the economy of different effects. We can introduce the technical impact of the single sector, the conclusion of which is similar to that of the three sectors when introducing technology shocks. For the sake of simplicity, we do not report the impulse response function of single sector biotechnology shock. The following analysis is the case that the three departments are facing technological shock.
Figures 6 and 7 show the impulse response functions for the biotechnological shocks of each major economic variable. The technical shocks we introduce are simultaneous to the three sectors in the biomedical imaging market. When the labour supply is inelastic, 1% of the technical shocks will lead to a GDP decline of about 5%, and then disappear as biotechnology shocks slowly return to steady-state path, and in this case, consumption. This is the reason why we find that consumption fluctuated more strongly before the 1990s. The face of technical impact of labour time will fall more, more than the decline in consumption. Other variables will have a 1.5% rise in investment, while the capital will rise first and then decline, the increase is due to an increase in medical imaging technology investment.
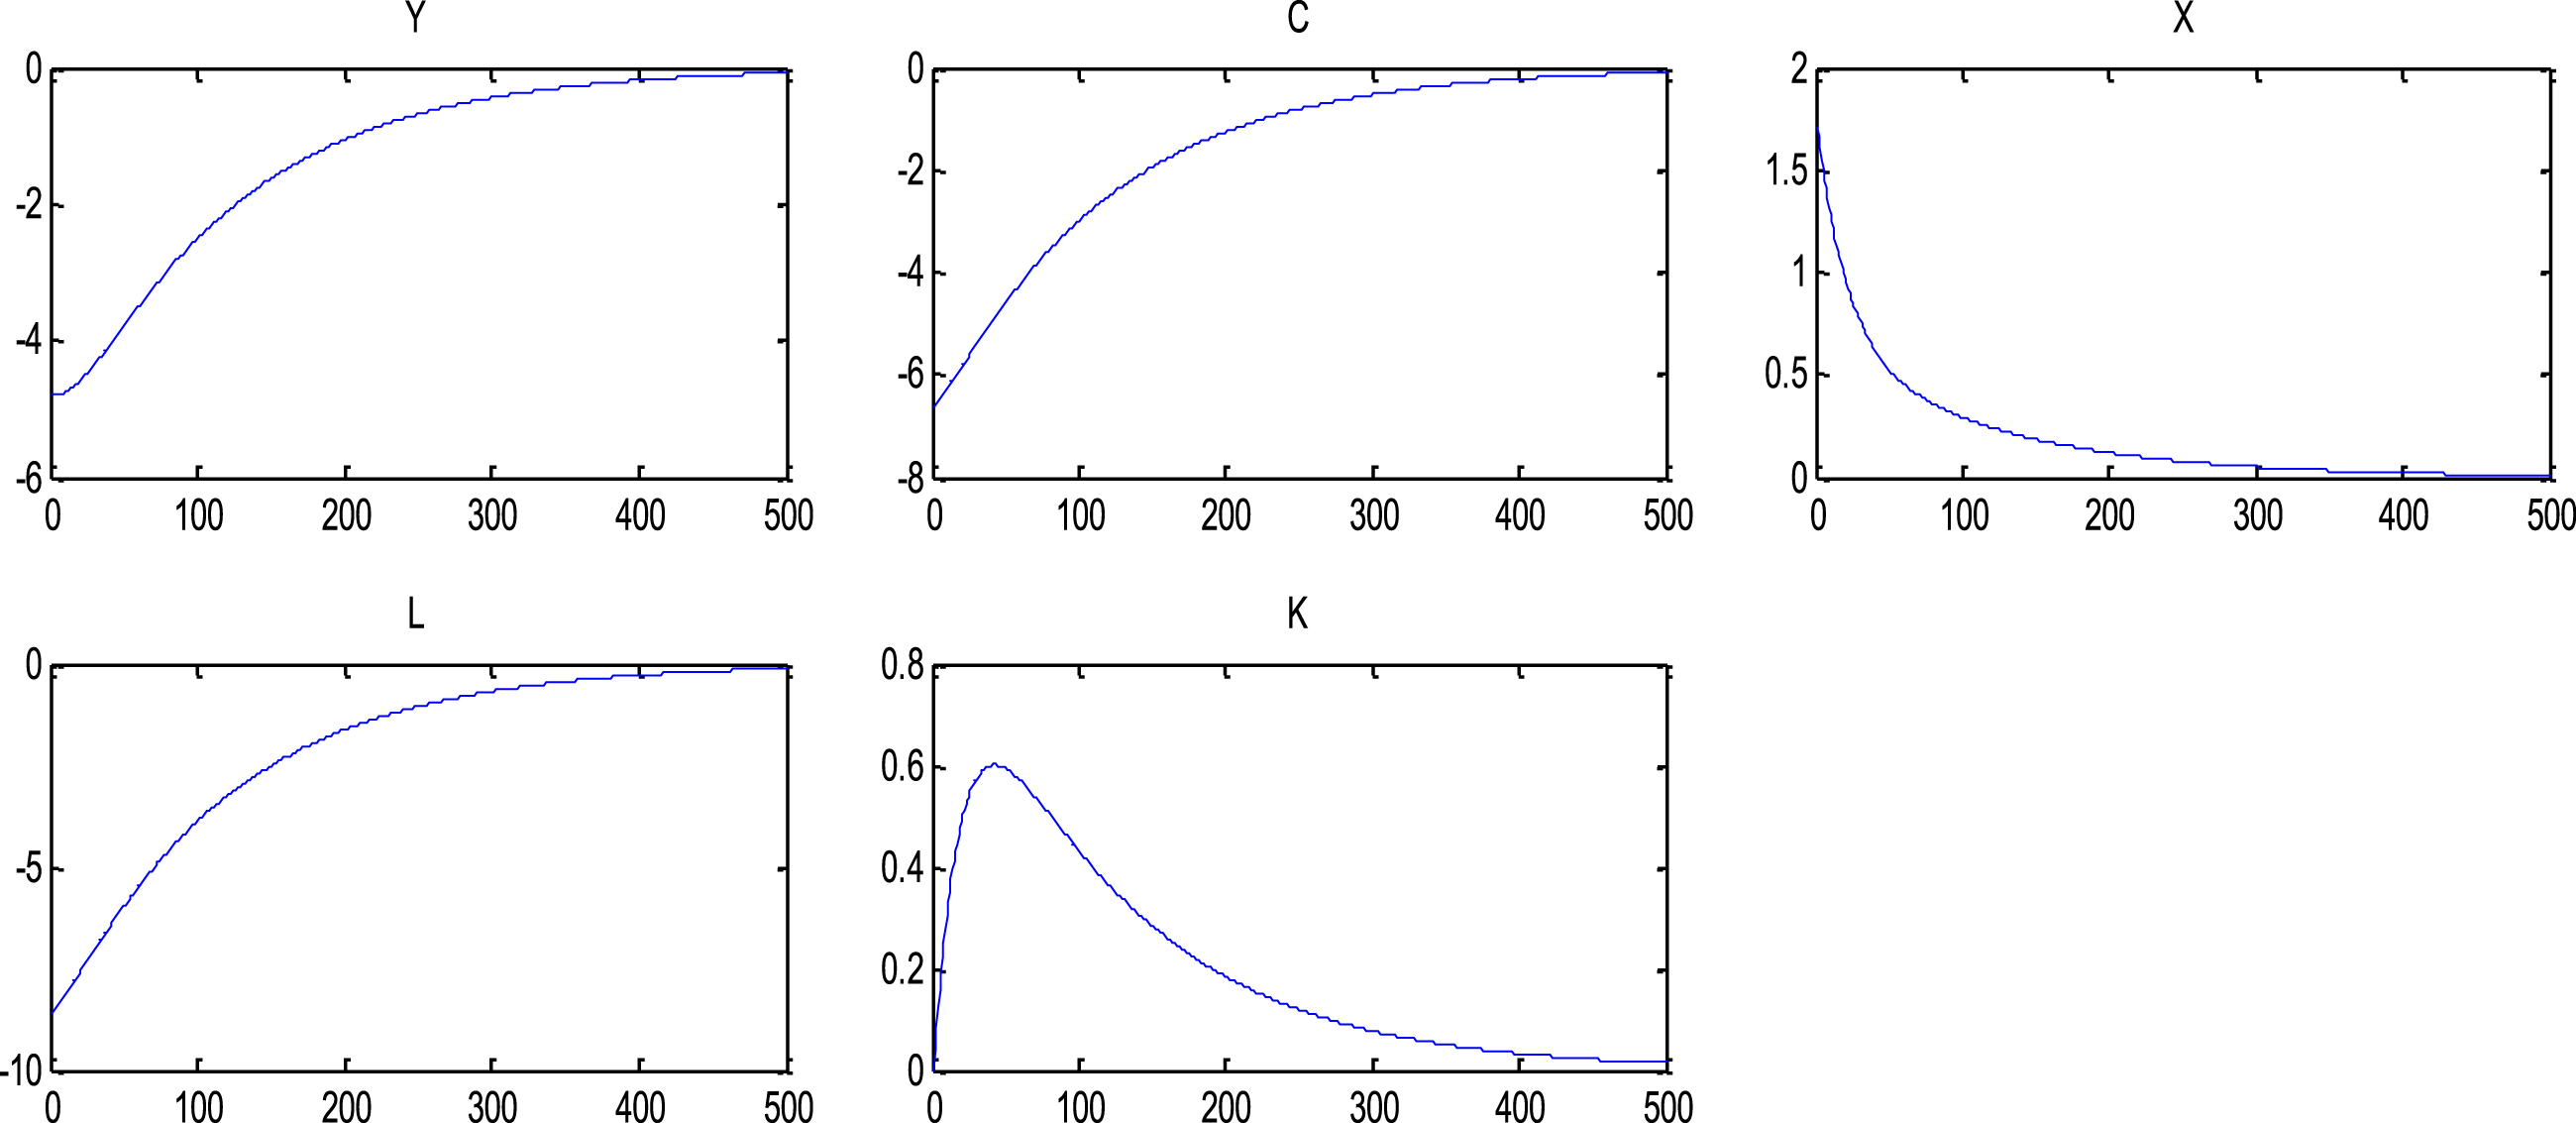
Impact of technology shock on economy (when hi-tech labour is inelastic).
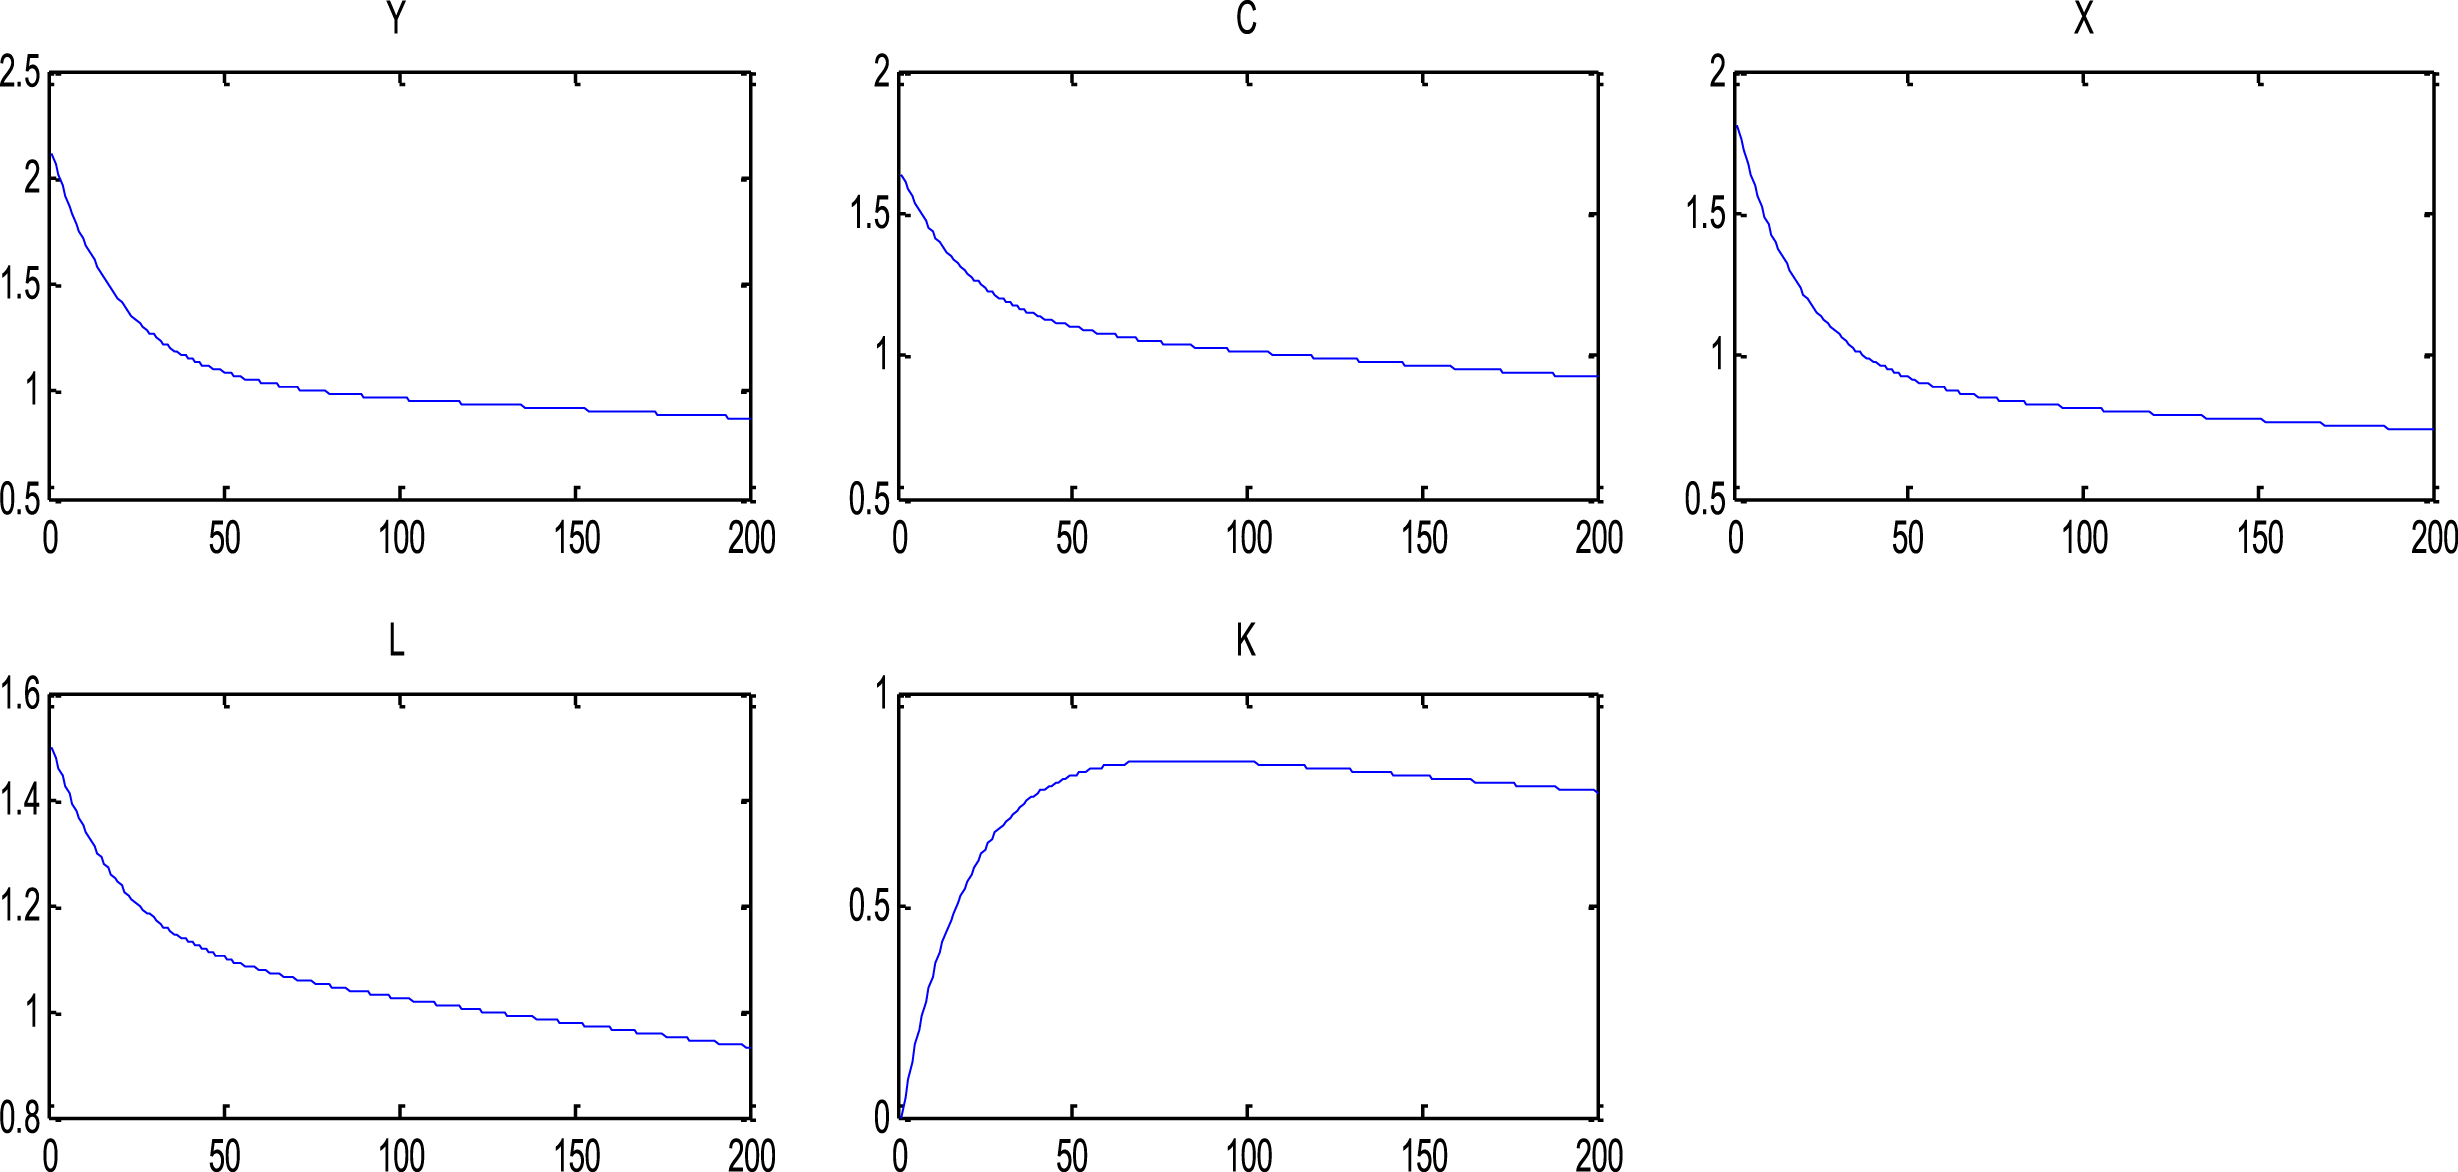
Impact of technological shock on the economy (when hi-tech labour is elastic).
In the context of a significant elasticity of labour supply, the impact of the three-sector technology shock on the economy is exactly opposite to that in the case of labour supply being inelastic. Facing a 1% positive impact of technology, GDP will have 2% increase, but this time consumption will increase 1.5%, this phenomenon is in line with our expectations, a positive impact on technology will make GDP and consumption, and the rise in consumption is not as significant as GDP, which is why consumption fluctuates less than GDP in this case. But we also find that, while consumption is not as large as GDP volatility, consumer volatility is greater than that of other developed countries. Other major economic variables, investment, capital, and labour also have positive effects.
Usually Monte Carlo method by generating suitable random numbers on a regular to solve mathematical problems. For those calculations are too complex to be resolved solution or no solution of problems, Monte Carlo methods are a powerful method for the numerical solution is obtained. Monte Carlo methods in mathematics is the most common application of Monte Carlo integration. In order to carry out a robust exploration of the above conclusions, we will use Monte Carlo simulation in our model, and then calculate the standard deviation of the simulation results and GDP correlation coefficient. Because we focus on the analysis of the relationship between consumption and GDP, we can omit the other variables. Table 3 shows that the relationship between consumption and GDP after the theoretical model is simulated 100 times in two cases (labour supply elasticity is lacking and significant). It is clear from the table that when the supply of labour is inelastic, the volatility of consumption is larger than that of GDP, the simulation result is 1.26, and the real data is 1.47 under the HP filtering method, which explains the consumption fluctuation of 86% Similarly, in the labour supply has a significant elasticity, consumer volatility is also less than GDP fluctuations in developed countries, the simulation results of 0.89, while the actual data under the BP filter method is 0.87, almost the same, and the US real data consumption relative to GDP Is 0.49, so our model not only explains that China’s consumption volatility is larger than the standard REC model forecast, but also that China’s consumption volatility is greater than GDP before the 1990s, and that the consumption volatility after that is smaller than GDP fact. In addition, the correlation between consumption and GDP, simulation results also show a very close relationship, and the relationship between the two is also much higher than the developed countries such as the 0.76 correlation coefficientof U.S.
Analysis of medical imaging shock
Analysis of medical imaging shock
Model Monte Carlo simulation results
Note: The brackets for the real data in China.
Through the analysis of Chinese economic cycle data, it is found that China’s macroeconomic variables have a special relationship, especially between consumption and GDP, the consumption fluctuation is much larger than that of technologically developed countries with strong medical imaging research platforms, and the fluctuation of consumption is greater than GDP volatility. In addition, the relationship between consumption and GDP is also much higher than the United States and other developed countries, which makes the standard single-sector REC model in the interpretation of the difficulties encountered. We have taken into account the different dynamics of labour supply elasticity through the establishment of three sectors, two consumption sectors, capital-intensive and labour-intensive, as well as the capital-intensive investment sectors, which is consistent with the reality of China’s economic reform. The impact of technology, and in the case of medical imaging research advancement, as described by the impulse response function and Monte Carlo simulation test, shows that our model can explain about 90% of China’s consumption and GDP fluctuations between the situation and the relationship between them and so on. The conclusion also has a strong policy meaning that the reform of the hi-tech labour market will have a great impact on China’s macroeconomic, and more free labour market system is conducive to China’s macroeconomic development, so we must emphasis on hi-tech labour reform pertaining to biomedical technology in order to promote the development of national economy in the future.