
Abstract
The malignancy risk differentiation of pulmonary nodule is one of the most challenge tasks of computer-aided diagnosis (CADx). Most recently reported CADx methods or schemes based on texture and shape estimation have shown relatively satisfactory on differentiating the risk level of malignancy among the nodules detected in lung cancer screening. However, the existing CADx schemes tend to detect and analyze characteristics of pulmonary nodules from a statistical perspective according to local features only. Enlightened by the currently prevailing learning ability of convolutional neural network (CNN), which simulates human neural network for target recognition and our previously research on texture features, we present a hybrid model that takes into consideration of both global and local features for pulmonary nodule differentiation using the largest public database founded by the Lung Image Database Consortium and Image Database Resource Initiative (LIDC-IDRI). By comparing three types of CNN models in which two of them were newly proposed by us, we observed that the multi-channel CNN model yielded the best discrimination in capacity of differentiating malignancy risk of the nodules based on the projection of distributions of extracted features. Moreover, CADx scheme using the new multi-channel CNN model outperformed our previously developed CADx scheme using the 3D texture feature analysis method, which increased the computed area under a receiver operating characteristic curve (AUC) from 0.9441 to 0.9702.
Keywords
Introduction
According to statistics from the American Cancer Society, lung cancer is the first most commonly diagnosed cancer and the first leading cause of death from cancers in the United States, which accounts for 27% of all cancer mortality [1]. Fortunately, early detection and diagnosis of benign or malignancy on those pulmonary nodules can effectively decrease the incidence of lung cancer. Though in the past decades, a large and increasing number of pulmonary nodules have been detected each year by means of the widely used computer tomography (CT) for lung cancer screening [2, 3], the task of evaluating a large number of detected nodules by the experts or radiologists can still be very time-consuming. Therefore, a much better computer-aided diagnosis (CADx) is expected to play an important role in the evaluating task, where the extraction of effective features from detected nodules is of the research interests.
In general, the features of lung nodules can be divided into two categories: clinical-based and image-based features [4]. Clinical-based features include patients’ age, gender, history of cancer, and history of smoking, and etc. [5–7]. It is noted that clinical-based features can only help CADx of lung nodules to some degree. With the development of CT imaging, image-based features of pulmonary nodules including both the geometry related features and texture related features have been extracted, e.g. size (diameter or volume), shape, morphology, and texture [8], as well as volume growth rate during a time period [9]. Meanwhile the convolutional neural network (CNN) feature has also gained great attention for lung CADx [4, 10] and has been applied rapidly in many research fields related to image classification and recognition rapidly in recent years. As a derivative of Multilayer Perceptron (MLP) neural networks optimized for two-dimensional pattern recognition, CNN delivers the state-of-the-art performance.
Though the independence on prior knowledge and human effort in designing features is one of the major advantages of CNNs, feature extraction methods presented in artificial designs are still useful supplements to CNN features [11, 12]. The aim of this paper is to explore the feasibility and validity of a hybrid model for pulmonary nodule malignancy risk differentiation by integrating the traditional feature extraction methods into CNN model. For CADx of lung nodules, CNN makes this difficult task as part of its network and acts like a trainable feature extractor with degree of shift, scale, and deformation invariance [13]. Literately, in 2016, Anirudh R et al. proposed a three-dimensional CNN for nodule location detection in lung CT images and achieved a sensitivity of 80% at 10 false positives per scan [14]. However, the cost of obtaining 3D labeled training data is really expensive and so does the 3D convolution. As a result, they applied “Multiscale CNN” to be a crucial key for Lung nodule detection. Roth et al. 2015 trained deep convolutional neural networks to be able to detect sclerotic spine metastases, lymph nodes, and colonic polyps and were able to increase sensitivity from 57% to 70%, 43% to 77%, and 58% to 75% for each task respectively [15]. Shen et al. [16] exploited CNN to differentiate lung nodules and proposed a Multi-crop CNN network structure to achieve a 0.93 AUC (the area under the receiver operating characteristic curves) and 87.14% accuracy on LIDC-IDRI by multi-scale cutting and merging of pooling. It is noted that the classification accuracy and AUC produced by CNN are higher than those produced by traditional methods. However, most existing algorithms in medical imaging only focus on segmentation and detection tasks through their designed CNNs, while less CNNs were designed for CADx currently.
In literature, convolutional neural network is a biologically-inspired, multi-layer feed forward architecture that can learn multiple stages of invariant features using a combination of supervised and unsupervised learning. Each stage is composed of a (convolution) filter bank layer, a non-linear transform layer, and a spatial feature pooling layer [13, 16]. Similarly to “complex cells” in standard models of the visual cortex, the spatial pooling layers lower the spatial resolution of the representation, thereby making the representation robust to small shifts and geometric distortions. In view of the above, CNNs have received widespread attention from researchers in different application domains.
Although convolutional neural networks have been used with success for a variety of computer vision tasks, their internal operation is not well understood by most of users to date. While back-projection of feature activation from the first convolution layer is possible, subsequent pooling and rectification layers hinder us from understanding higher layers as well. By analyzing the feature activations of the first and second layer, Zeiler et al. [17] observed that the first layer does only capture high frequency and low frequency information and the feature activations of the second layer show aliasing artifacts. By adapting the filter size of the first layer and the skipping factor used within the second layer, performance could be improved. In addition, the visualization shows the advantage of deep architectures as higher layers are able to learn more complex features invariant to low-level distortions and translations [17].
Traditionally, the number of parameters in CNN networks for visual tasks is reduced by restricting higher level units to receive inputs only from a “receptive field” of lower-level inputs [13]. It is a common practice to pick receptive fields simply based on prior knowledge. In local receptive field architectures for image data, we typically train a bank of linear filters that apply only to a small image patch. These filters are then convolved with the input image to yield the first layer of features. Each 2D grid of feature responses for a single filter is frequently called a “map” [17]. Though there are still spatial relationships among the feature values within each map, it is not clear how two features in different maps are related. Thus, when we train a second layer of features, we must typically resort to connecting each feature to every input map or to a random subset of maps [17] (though we may still take advantage of the remaining spatial organization within each map). At even higher layers of deep networks, this problem becomes extreme because those arrays of responses will have very small spatial resolution (e.g., 1 – by –1), resulting a large number of maps. As a result, we can no longer effectively make use of spatial receptive fields. This problem is exacerbated further when we use very large number of maps which are often necessary in order to achieve top performance [18]. In general, the input data for CNN processing is split into several features maps. It is performed by using different 2D kernels and convolution operation. The result of convolution defines features of input data, such as corners, curves, lines, etc. Feature occurrence is mirrored on feature map by corresponding receptive field location. After each convolution, layer follows by subsampling layer. The motivation of this study is to explore an effective way for strengthening the lung nodule feature map by traditional feature incentives, such as Histogram of Oriented Gradients (HOG) and Local binary patterns (LBP).
Another challenge in lung nodule differentiation is that in CT scanning, image quality has many components and is influenced by many technical parameters. Several components of CT image quality, such as noise, slice thickness, low/high contrast resolution, and clinically accepted radiation dose, may be affected by technical parameter selection. As a result, physicians may have varying reports on examining lung nodules. Thus, in this study, we will investigate whether by enhancing representation of inputs, such as enhancing the feature of the nodule, we shall bring any gains to our study. If so, the receptive filed should be sensitive to those enhancements. In addition, one main disadvantage of CNN based methods is that they usually need large datasets to train a feasible model. Therefore, as a supplement to the existing data set, this method enriches the feature expression of the data to a certain extent so that we can integrate those features into CNN network. Therefore, we propose a much effective model which not only takes advantage of CNN autonomous learned image features, but also the traditional features such as HOG and LBP operators. The contributions of our study are briefed as follows, Explore the feasibility and validity of a hybrid model for pulmonary nodule differentiation by integrating the feature extraction methods into CNN model. Resort to traditional feature extraction method for amplifying the feature maps by transforming the dataset into a triplet view (i.e., original, HOG, and LBP) in order to let convolutional layers and pooling layers respond effectively to stimulus. Enrich the feature expression of the datasets for training and generate more feature images to achieve a better performance.
The organization of the rest of the paper is as follows: Section 2 presents the details of our newly proposed method for lung nodule differentiation: subsection 1 defines the scope of data, subsection 2 and 3 focus on the discussion on the features for texture classification, and subsection 4 describes the new hybrid model for lung nodule differentiation. In Section 3, we report the experimental results of the newly proposed hybrid CNN models. The conclusion is given in Section 4.
Methods
The overall pipeline of the proposed method is shown in Fig. 1. Firstly, the location of the pulmonary nodule is manually drawn from the lung CT images by up to four radiologists. Then all the nodules volumes are extracted automatically from the pulmonary CT images by combining all the radiologists’ painting boundaries. Next, the hybrid features extracted from the pulmonary volumes will be fed into our proposed CNN models. Finally, the probability of a nodule being benign or malignant will be obtained by the Softmax classifier.
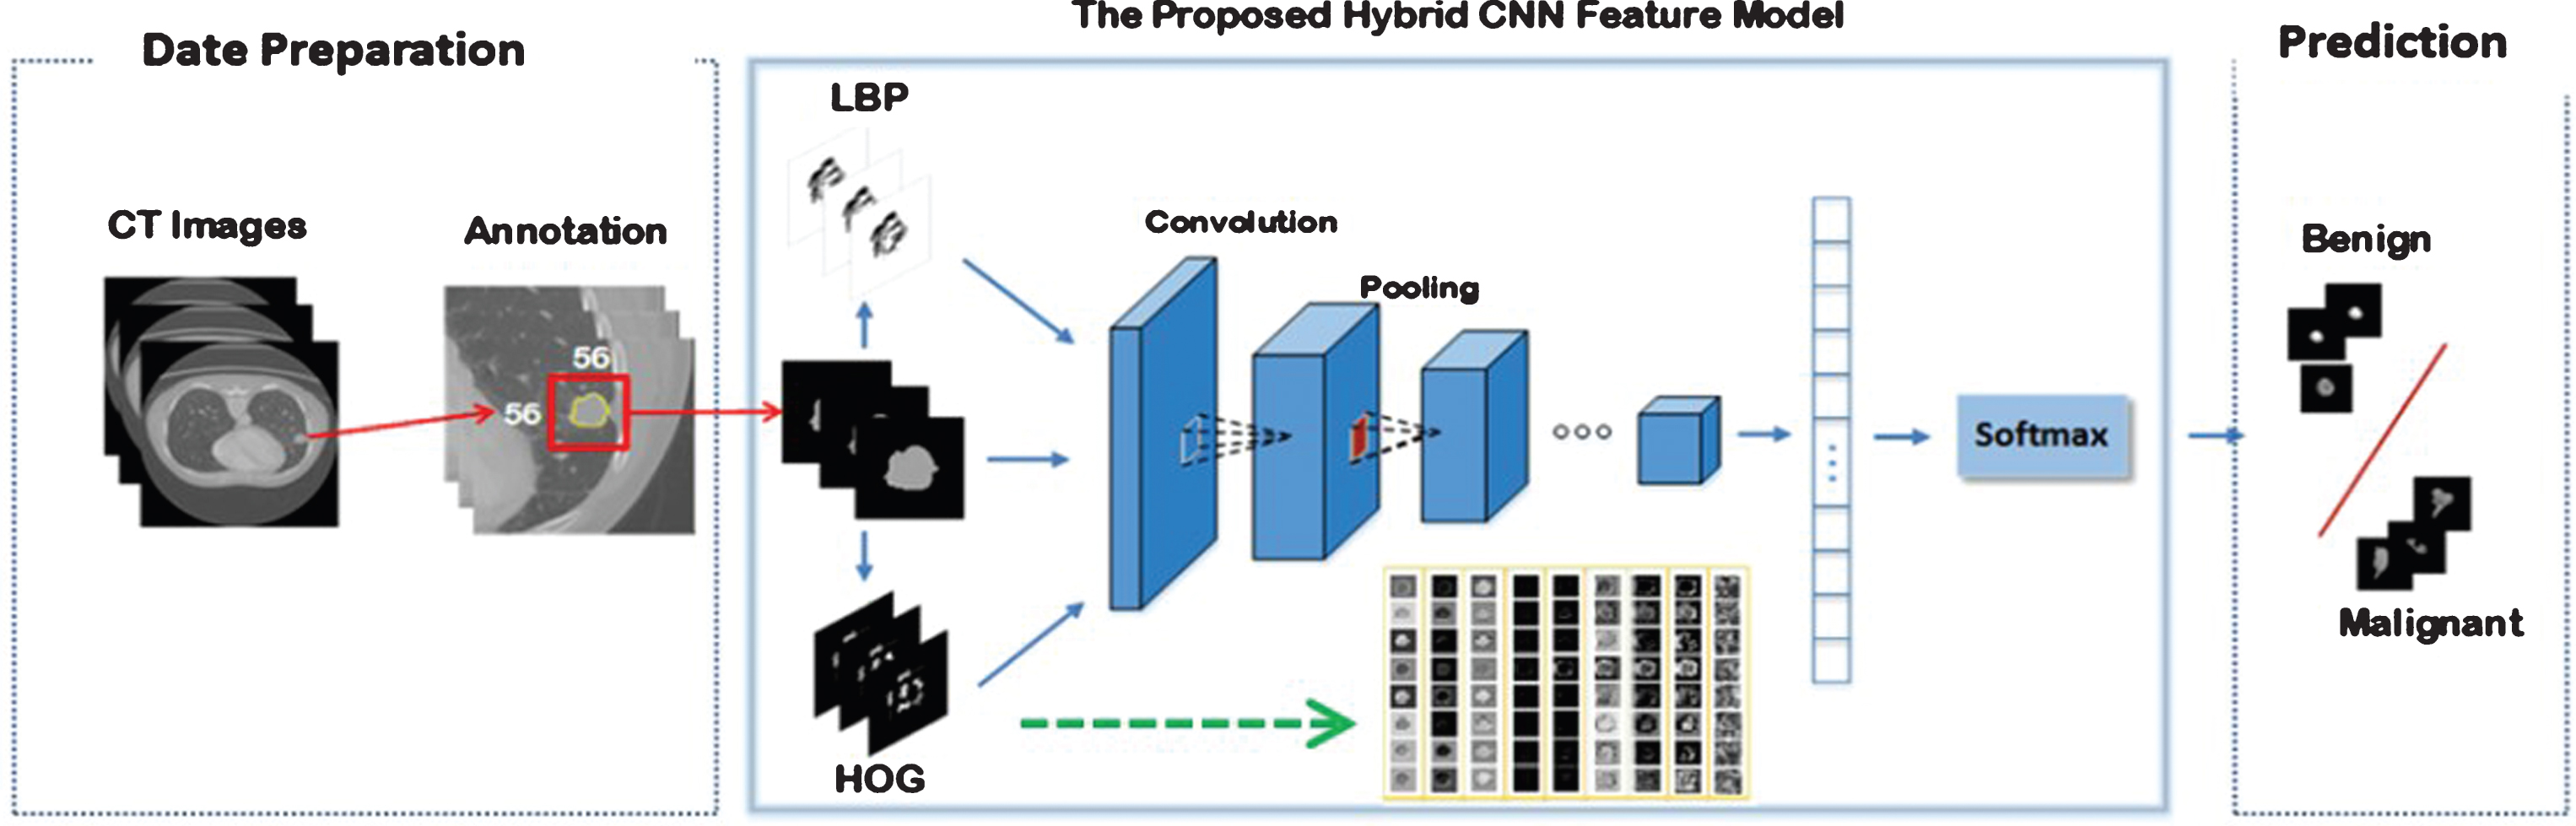
A schematic diagram of the proposed model.
The lung CT images used in this paper were obtained from the largest public database founded by the Lung Image Database Consortium and Image Database Resource Initiative (LIDC-IDRI) [19], which contains 1,018 patient cases. Each case includes images from a clinical thoracic CT scan and an associated XML file that records the locations of the pixels on the nodule boundary in each image slice and nine characteristics of the nodule detected by up to four experienced thoracic radiologists. These images were scanned by a wide range of different scanner manufacturers with different image slice thicknesses. All the slices are in the DICOM format with a size of 512 by 512 at a pixel depth of 16 bits. According to the rules of constructing the LIDC-IDRI database, the malignancy assessments of lung nodules are defined in five levels, i.e., 1, 2, 3, 4, and 5, from benign to malignant. Among them, “3” means the malignancy of the corresponding nodule is uncertain. Therefore, the nodules with label “3” were treated in two different ways: (i) they were grouped into those nodules labeled “1” and “2” as benign class (we chose this way in this study); (ii) they were grouped into those nodules labeled “4” and “5” as malignant class. In order to eliminate the inconsistencies related to the datasets, the region of interest (ROI) of the selected nodules in this study are those overlapped region by combining four radiologists’ marked areas as shown in Fig. 2.

Illustration of lung nodules and ROI extraction process.
Because the features observed from the nodules less than 3 mm in diameter are less significant, we mainly choose nodules with a range of 3–30 mm in this study. The pulmonary nodules are first grouped according to the labels given by the experts and then normalized into the same size (56 by 56) images. The reason for choosing 56 by 56 as the normalization standard is because we observed that the maximum diameter of nodules in this study does not exceed 55 pixels, which corresponds to the maximum diameter of nodules divided by the spatial resolution. Figure 3 illustrates the morphology of several typical lung nodules, where (a), (b), (c), (d), and (e) represents five different lung nodules types, respectively.
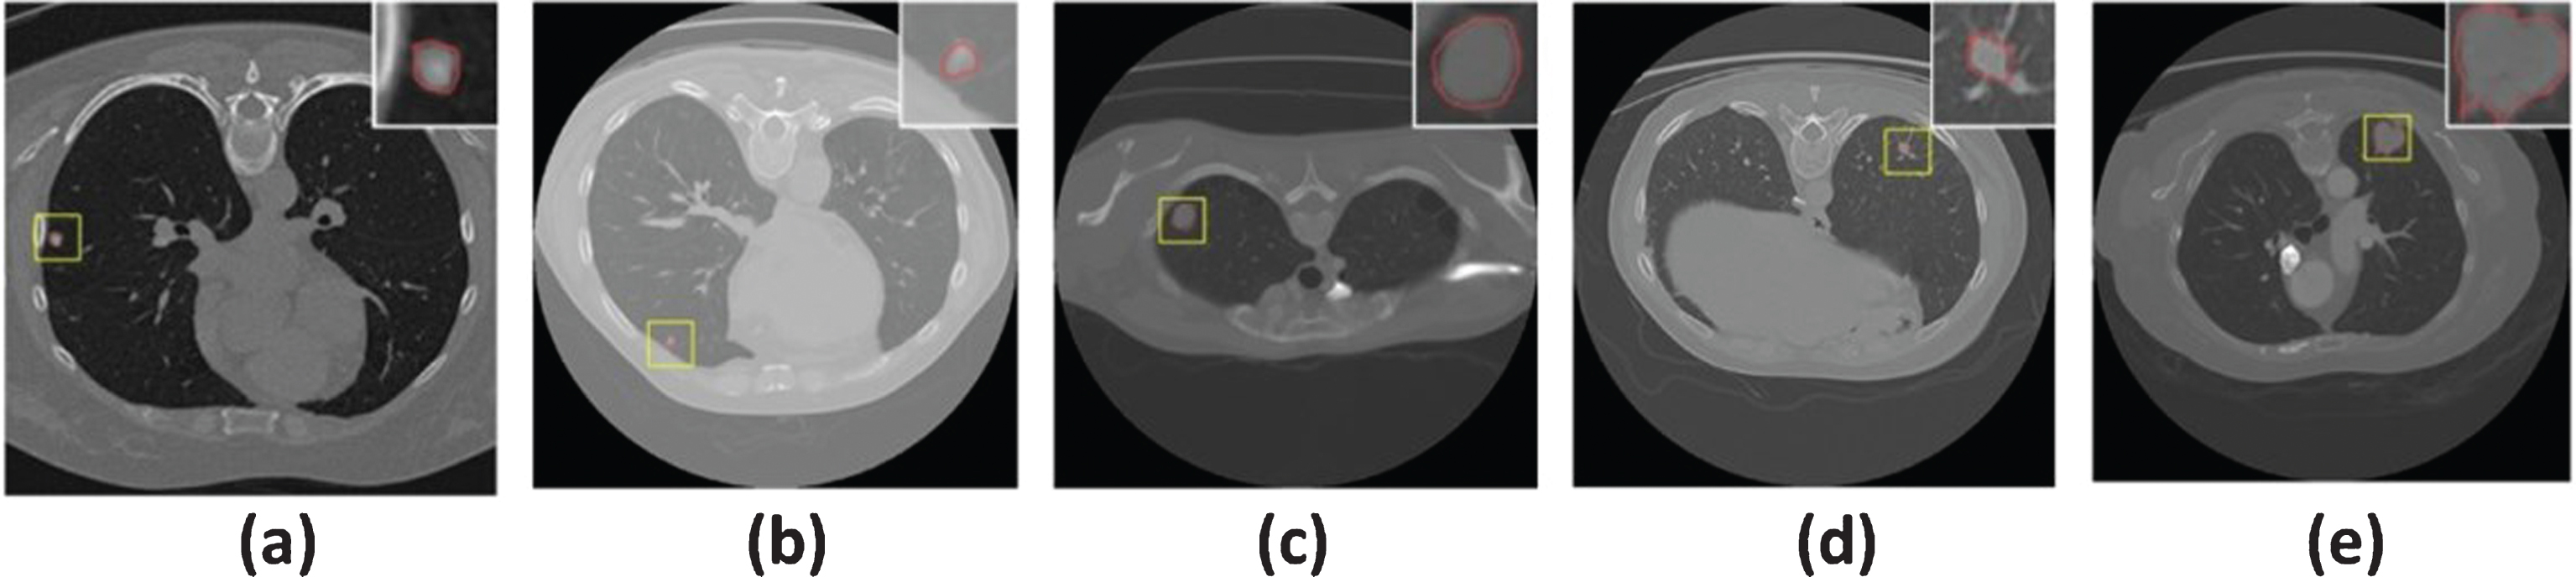
The morphology of several typical pulmonary nodules.
In order to clearly depict the appearance characteristics of lung nodules, Shingo Iwano et al. [20] clinically classified the lung nodules into seven categories: round or oval, lobulated, polygonal, tentacular, spiculated, ragged, and other irregular types according to the visual observation from 2D CT images [20]. As shown in Fig. 4, those lobulated, ragged, and spiculated nodules tend to be with greater probability to be malignant, while round or oval, polygonal, tentacular, and other irregular shaped pulmonary nodules are usually with a higher probability to belong to benign. Thus, shape and edge information of lung nodules are of much significance in CADx of benign or malignancy nodules. Please note, for the nodules shown in Fig. 4, we selected the most similar samples to the above-mentioned shapes as introduced by Shingo Iwano et al. [20] for illustration since it is very difficult to find a true nodule exactly the same.
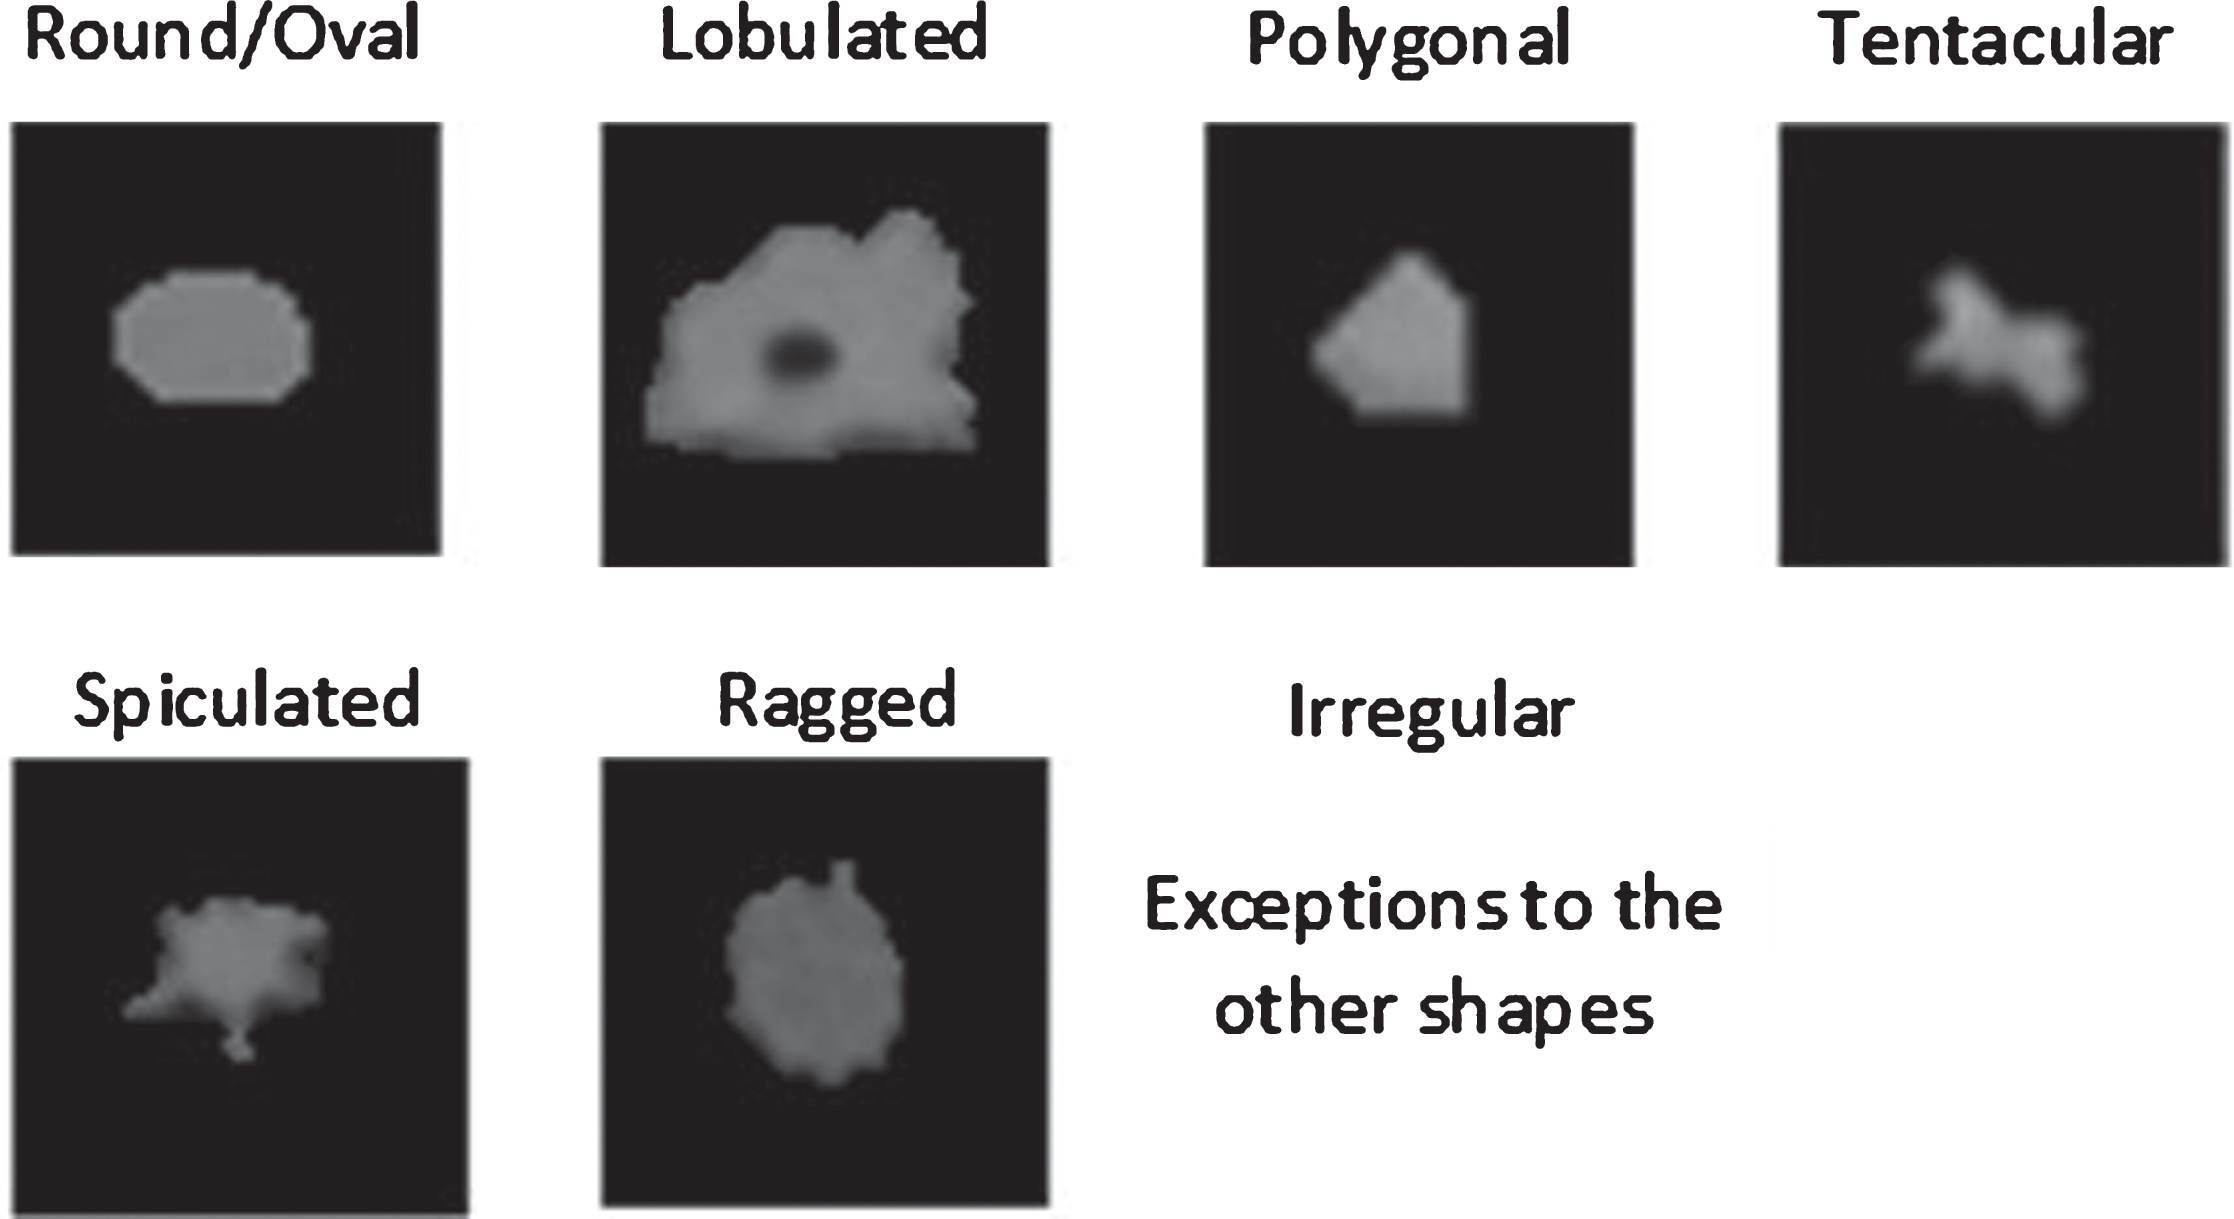
Shape description of the pulmonary nodules extracted from actual dataset.
The idea of HOG stems from the observation that local features such as object appearance and shape can often be characterized well by the distribution of local intensity gradients in an image [21]. HOG features are extracted from an image based on a series of normalized local histograms of image gradient orientations in a dense grid [22]. The HOG feature conveys information similar to that of an edge map, which also gives the representation of invariance to small and local geometric and photometric changes. The first-order derivatives of HOG features are computed as follows (Details of the algorithm were shown in the Appendix: Algorithm 1). For each pixel in I
x
, we have
For each pixel in I
y
, we have
Given such estimates of the first-order image derivatives, the gradient magnitude m θ are then computed as
And orientation θ computed as
As detailed in Algorithm 1, the gradient direction of each block is divided into 16 undirected histogram channels (bin), and then all the pixels in all directions of the histogram features are calculated to generate HOG features as illustrated in Fig. 5.
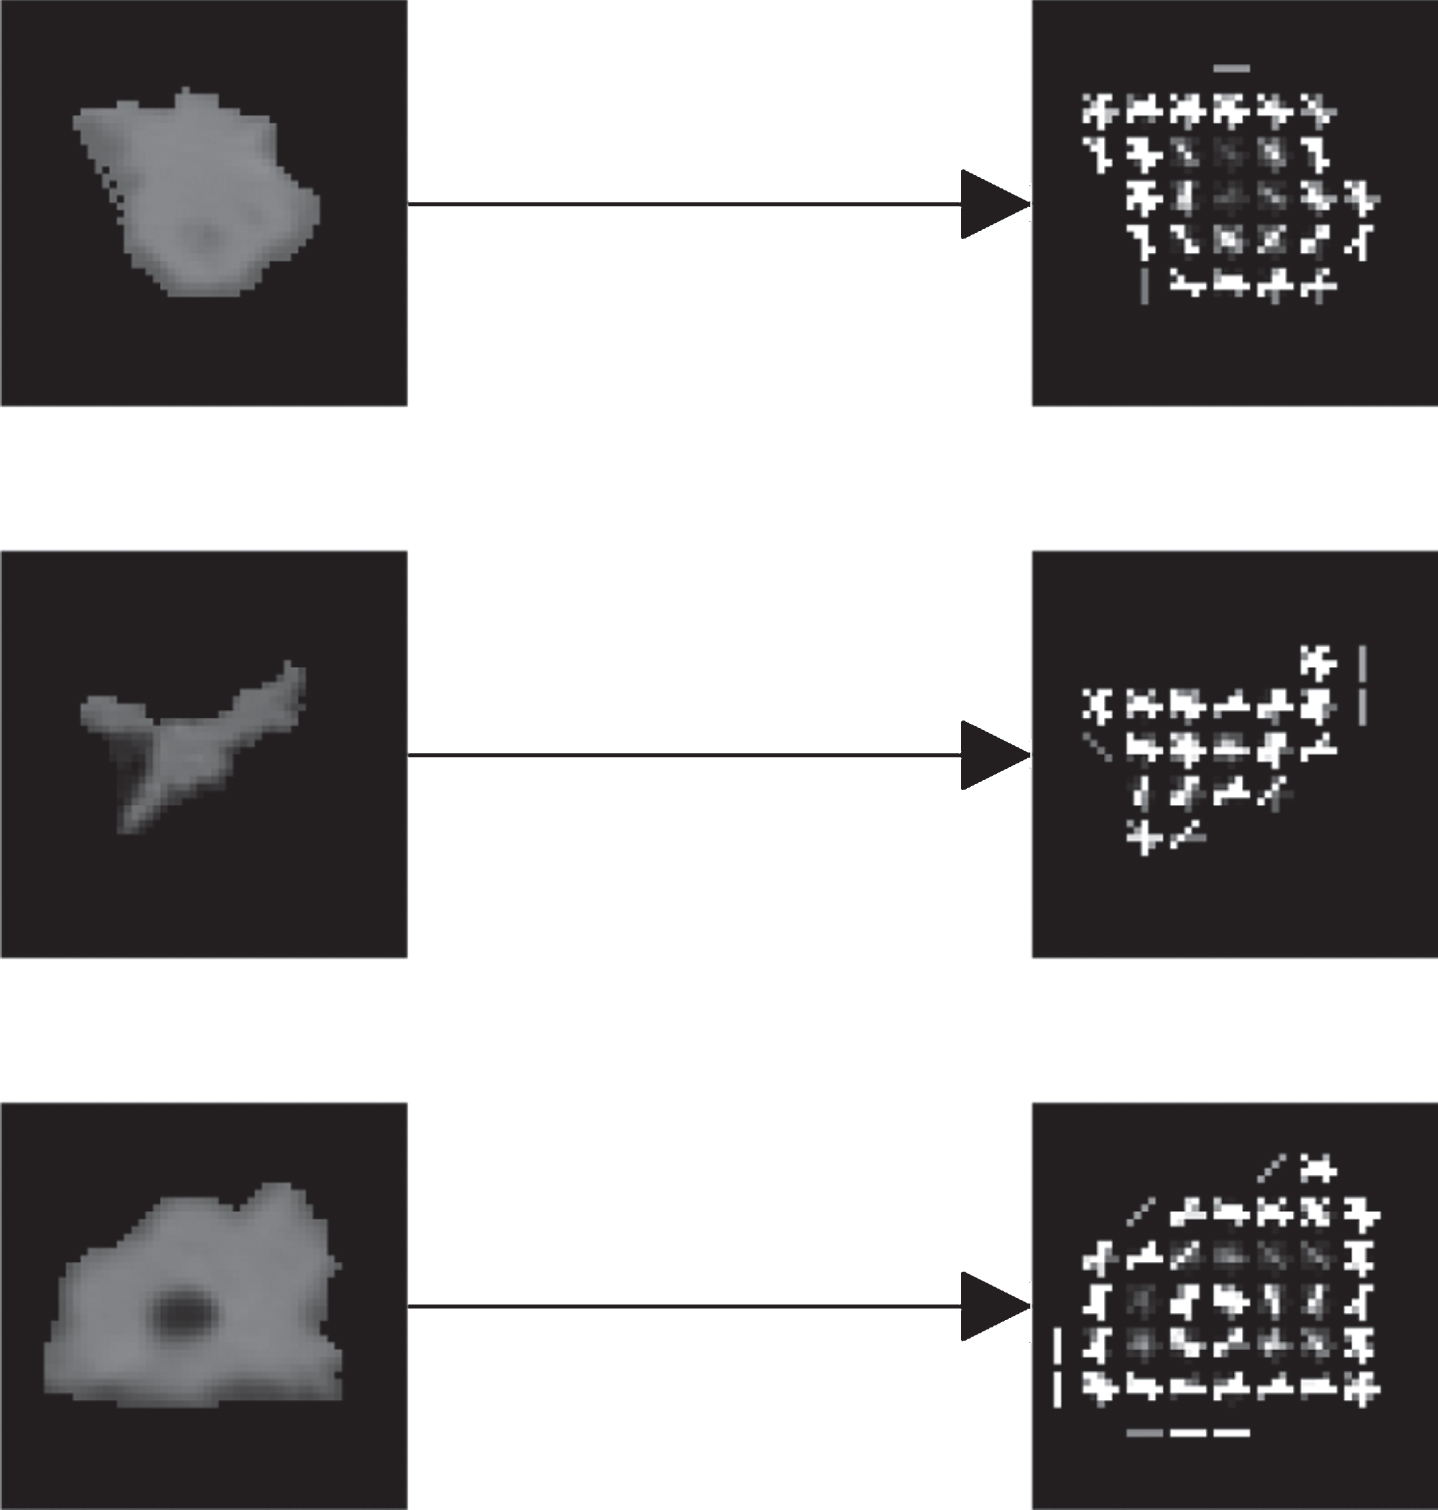
Illustration of HOG Features of typical pulmonary nodules.
LBP has been found to be a powerful feature for texture classification [23]. When combining with the HOG descriptor, it has demonstrated a considerably improved detection performance [24]. As a result, LBP texture operator has been successfully used for various computer vision applications, especially for face recognition [25]. Many favorable patterns were proposed based on different numbers of neighborhood pixels with different radii around the central pixel. However, the basic LBP operator introduced as a standard example and used mostly in practices is based on the eight neighborhood pixels [26]. If the gray value of a neighborhood pixel is higher than or equal to that of the central one, the value is set to 1, otherwise it is set to 0. The descriptor describes the result over the neighborhood as a binary pattern as follows:
The features of the image f (x, y) after feature extraction using the LBP algorithm can be represented by a histogram as shown in Fig. 6.

LBP characteristics of pulmonary nodules.
Although those previously proposed models for feature extraction (such as edge, shape and texture) are capable of representing certain characteristic of pulmonary nodules, they are still lack the ability of generalization and their performance varies respectively. By mapping the input data into the new space through linear or nonlinear transformation, convolutional neural network [11] performs very well on the task of extracting the inherent characteristics of the given images. An important part of the processing of visual information is the recognition and enhancement of edges similar to edge detection in human vision [27]. A typical technique in artificial intelligence consists of convolving the image with a certain filter (HOG or LBP) in order to enhance shapes and edges. As a result, the first stage of CNN involves filters which mostly resemble Gabor-filters. The CNN method which we based on was also originally designed as an improvement to the scale-space method. Taking into account complementary characteristics related to traditional texture method and CNN, we thus proposed a novel hybrid CNN model by incorporating traditional features into CNN. The complex distinguishable higher level features are composed of unique combinations of low level features in this hybrid model. This hierarchy from simple to complex features can be found in the filters of the CNN, where the first layer filters mainly consist of Gabor-like structures, while deep layer filters in the network contain features that can be recognized as objects. In this study, our method combines the texture features, such as LBP and HOG with CNN to enhance the first layer filters which is similar to human vision system in decomposing the image in its oriented spatial frequencies [28]. CNN network structure generally includes data input layer, convolution layer, pooling layer, full connection layer, and an output layer. Our hybrid CNN model aims to facilitate the data input layer by data fusion. While for the training, the main task is to learn optimal model parameters which involve minimizing a loss function.
A conventional CNN network structure for baseline
In general, a conventional CNN network structure consists of three convolutions, two pooling (Max-pooling) layer, a fully connected layer, and a softmax layer as shown in Fig. 7.
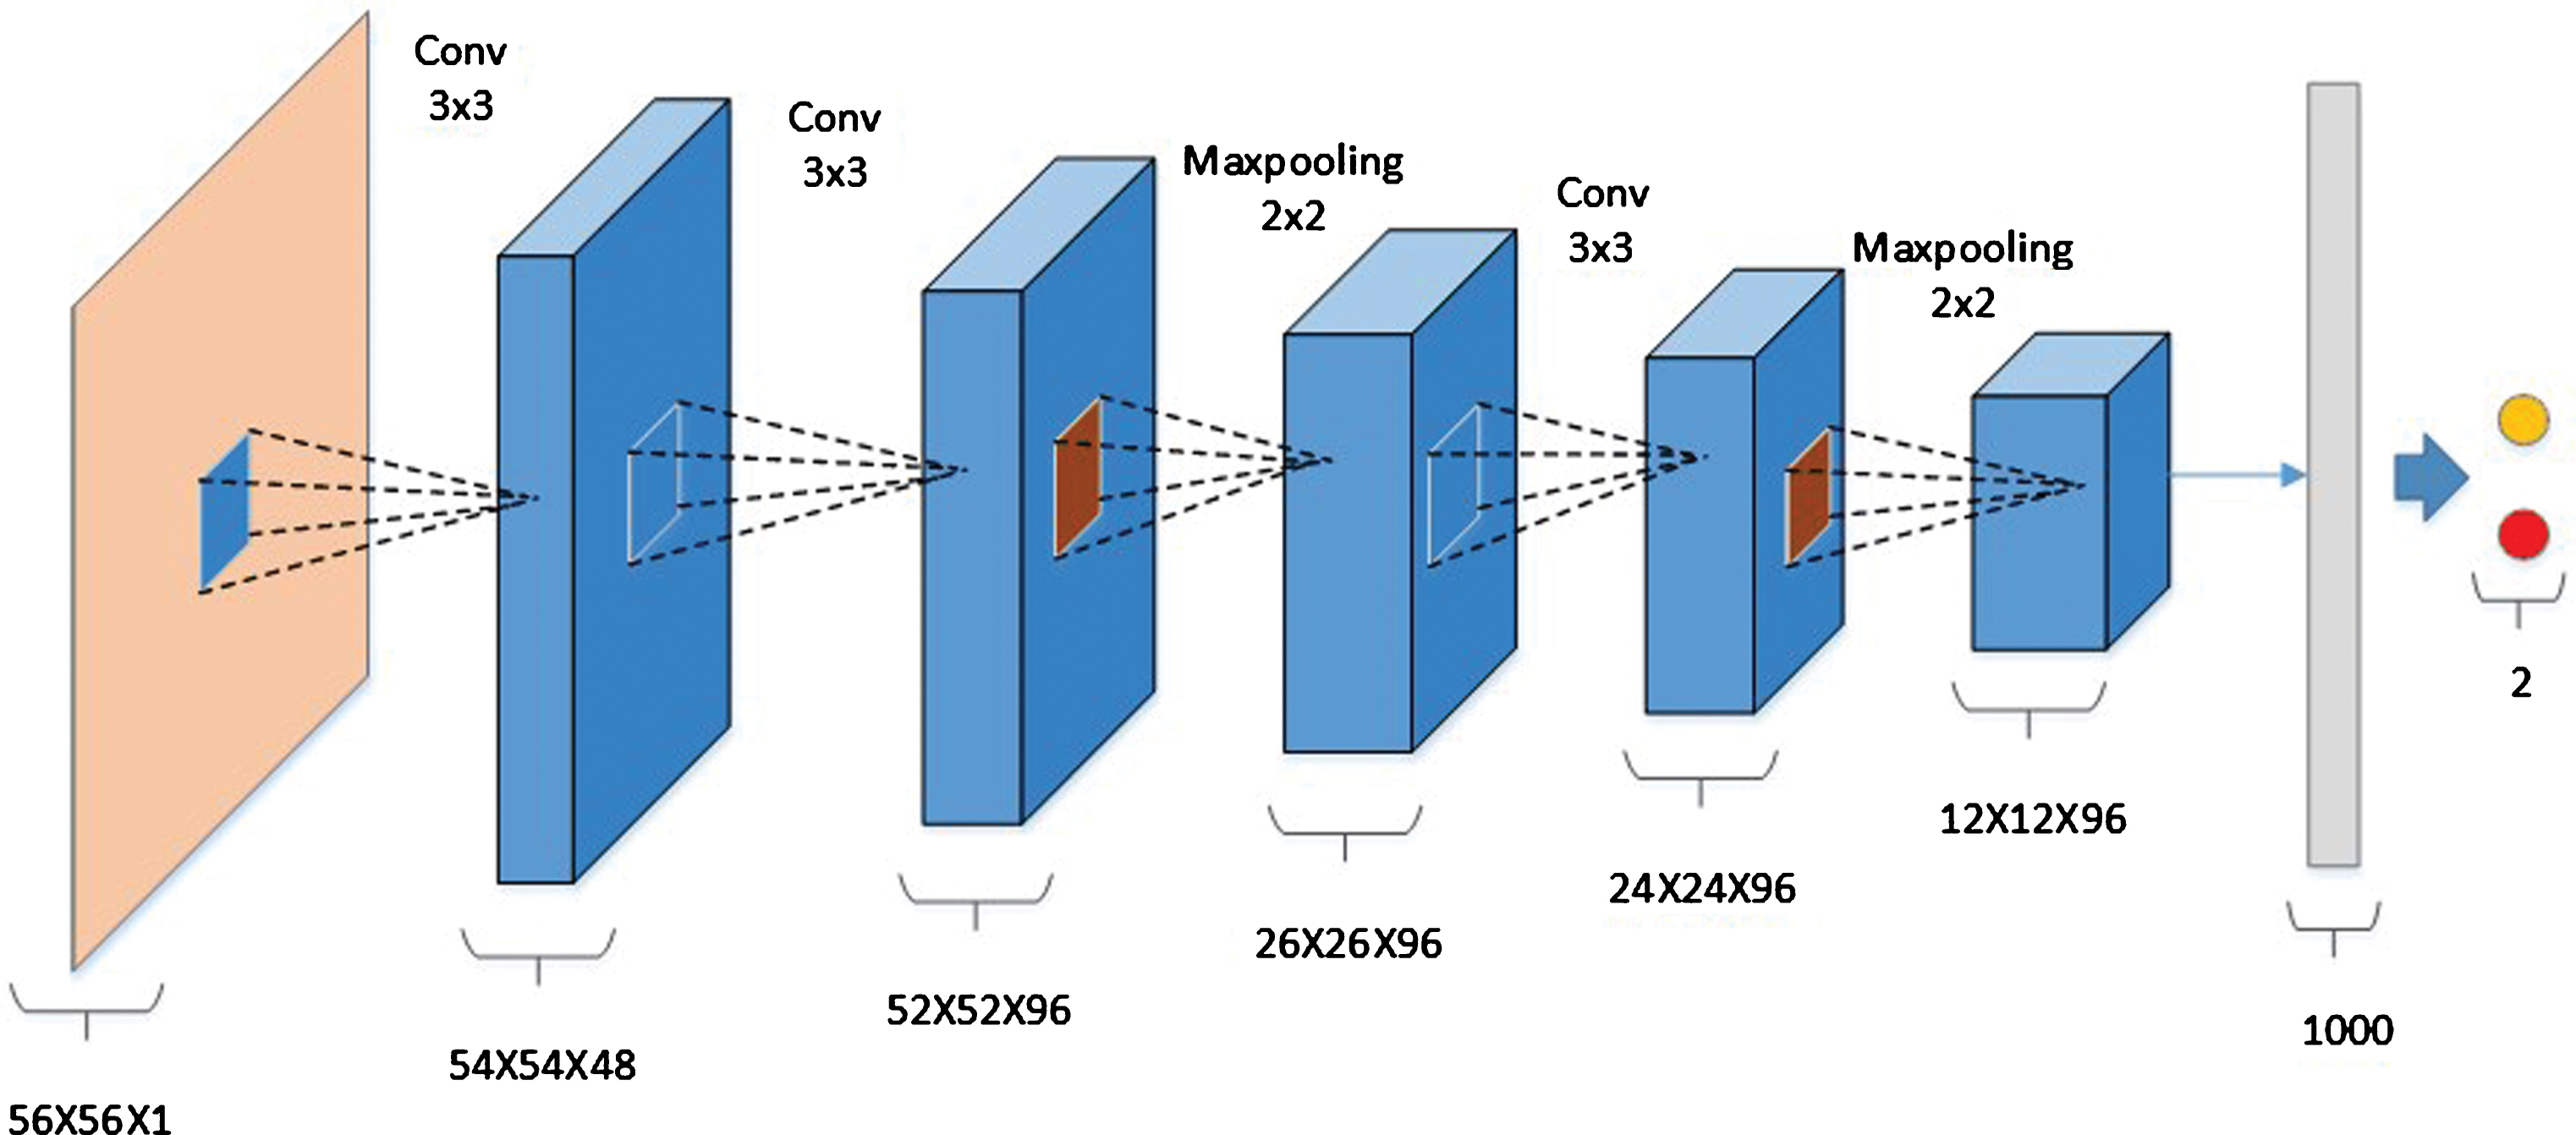
A conventional CNN model for differentiation of lung nodules.
Specially, the input for this structure is 56×56 single-channel gray-scale image containing lung nodules, and the output of the softmax classifier is the probability of a nodule being benign and malignant. We use the Relu function instead of the tanh function as the activation function in order to speed up the training speed and improve the performance. Dropout is used to control the updating of the parameters at the full joining layer. The detailed parameters of the conventional model are described in Table 1.
C: Convolution layer; F: Fully connected layer; P: Pooling layer; R: Activation function (RELU); D: Dropout; Channel: the number of outputted feature maps
Although CNN is believed to be capable of extracting lung nodules with feasible distinguishing features, it is found that HOG features and LBP features are fused with CNN in a specific way in view of the significant differences in shape and texture between the benign and malignant nodules. In this study, the following two features based hybrid CNN methods are comparativelyproposed:
–Multi-branch CNN: In the training stage of CNN, the neural network structure is divided into three branches, i.e. gray-scale, LBP, and HOG characteristics, respectively;∥After the HOG features and LBP features of the lung nodules were extracted separately, both features are used as the input of different branches of the CNN and further being processed with convolution. At last, they will be connected in a full connection layer. As shown in Fig. 8, the proposed branching feature fusion network structure has several convolution operations with different scales.∥–Multi-channel CNN: At the beginning of training of CNN, LBP features and HOG features are integrated into different channels of the input image so that local information and global information have been taken into account in training a CNN model.∥Although the feature fusion method can effectively exploit the features combined, the complexity of the network is increased by 2 times, and the training time is also very consuming. Therefore, we propose a multi-channel feature fusion CNN model as shown in the Fig. 9. The original image is combined with both the HOG feature map and the LBP feature map, resulting a fused input layer changing from 56×56×1 to 56×56×3. Its network structure is similar to the traditional CNN model, as shown in Fig. 7.

Multi-branch CNN Model.
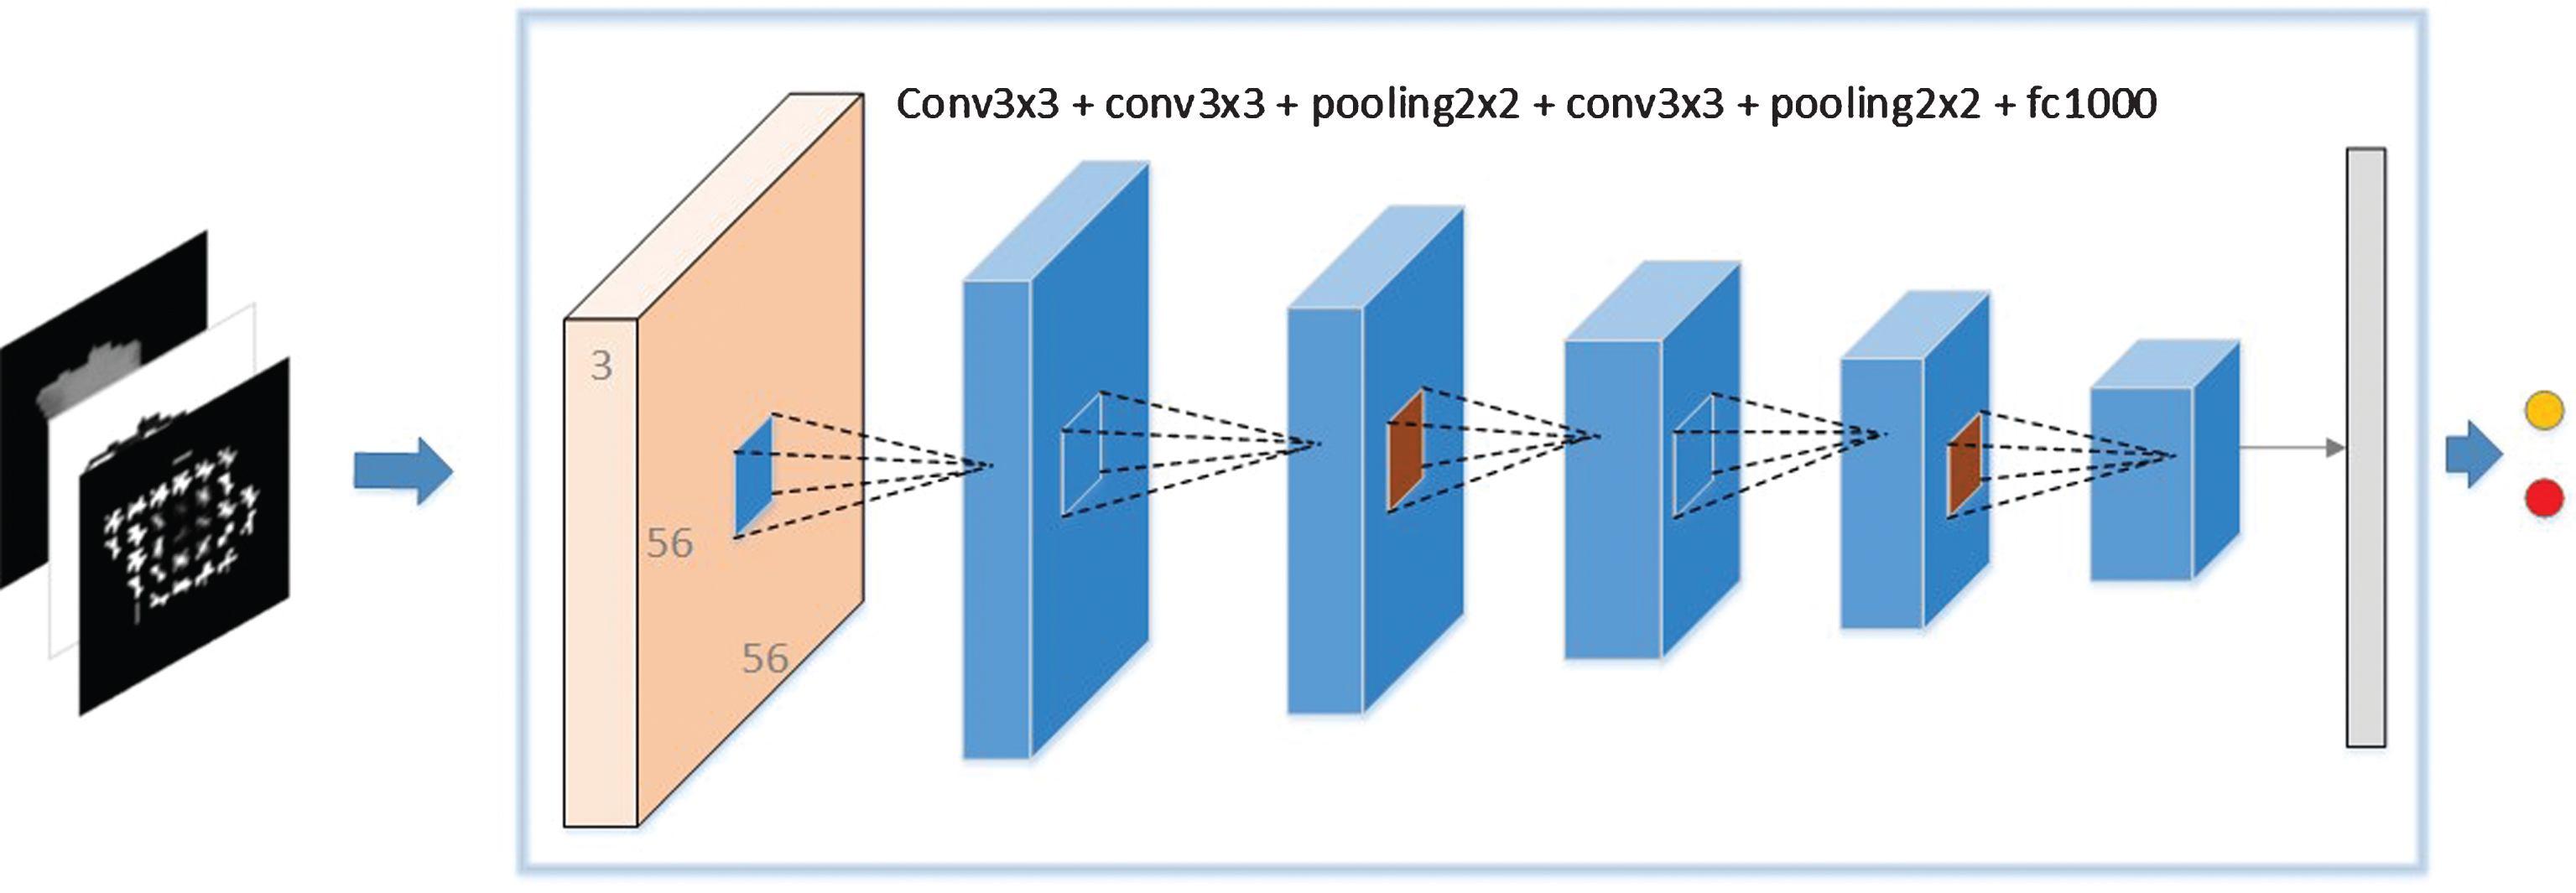
Multi-channel feature fusion CNN.
In probability theory, the output of the softmax function is used to represent a categorical distribution, i.e., a probability distribution over K different possible outcomes. In practice, the softmax function is often used in the final layer of neural networks, which are applied to classification. Such networks are commonly trained under a log loss (or cross-entropy) regime, giving a non-linear variant of multinomial logistic regression. We here describe the cost function in our proposed models as softmax regression. Suppose that we have a training set S = {(x(1), y(1)), …, (x(m), y(m))} of m labelled examples, where the input features are x(i) ∈ Rn+1, and the labels were y(i) ∈ {0, 1}. Our hypothesis tookthe form:
Dataset preparation
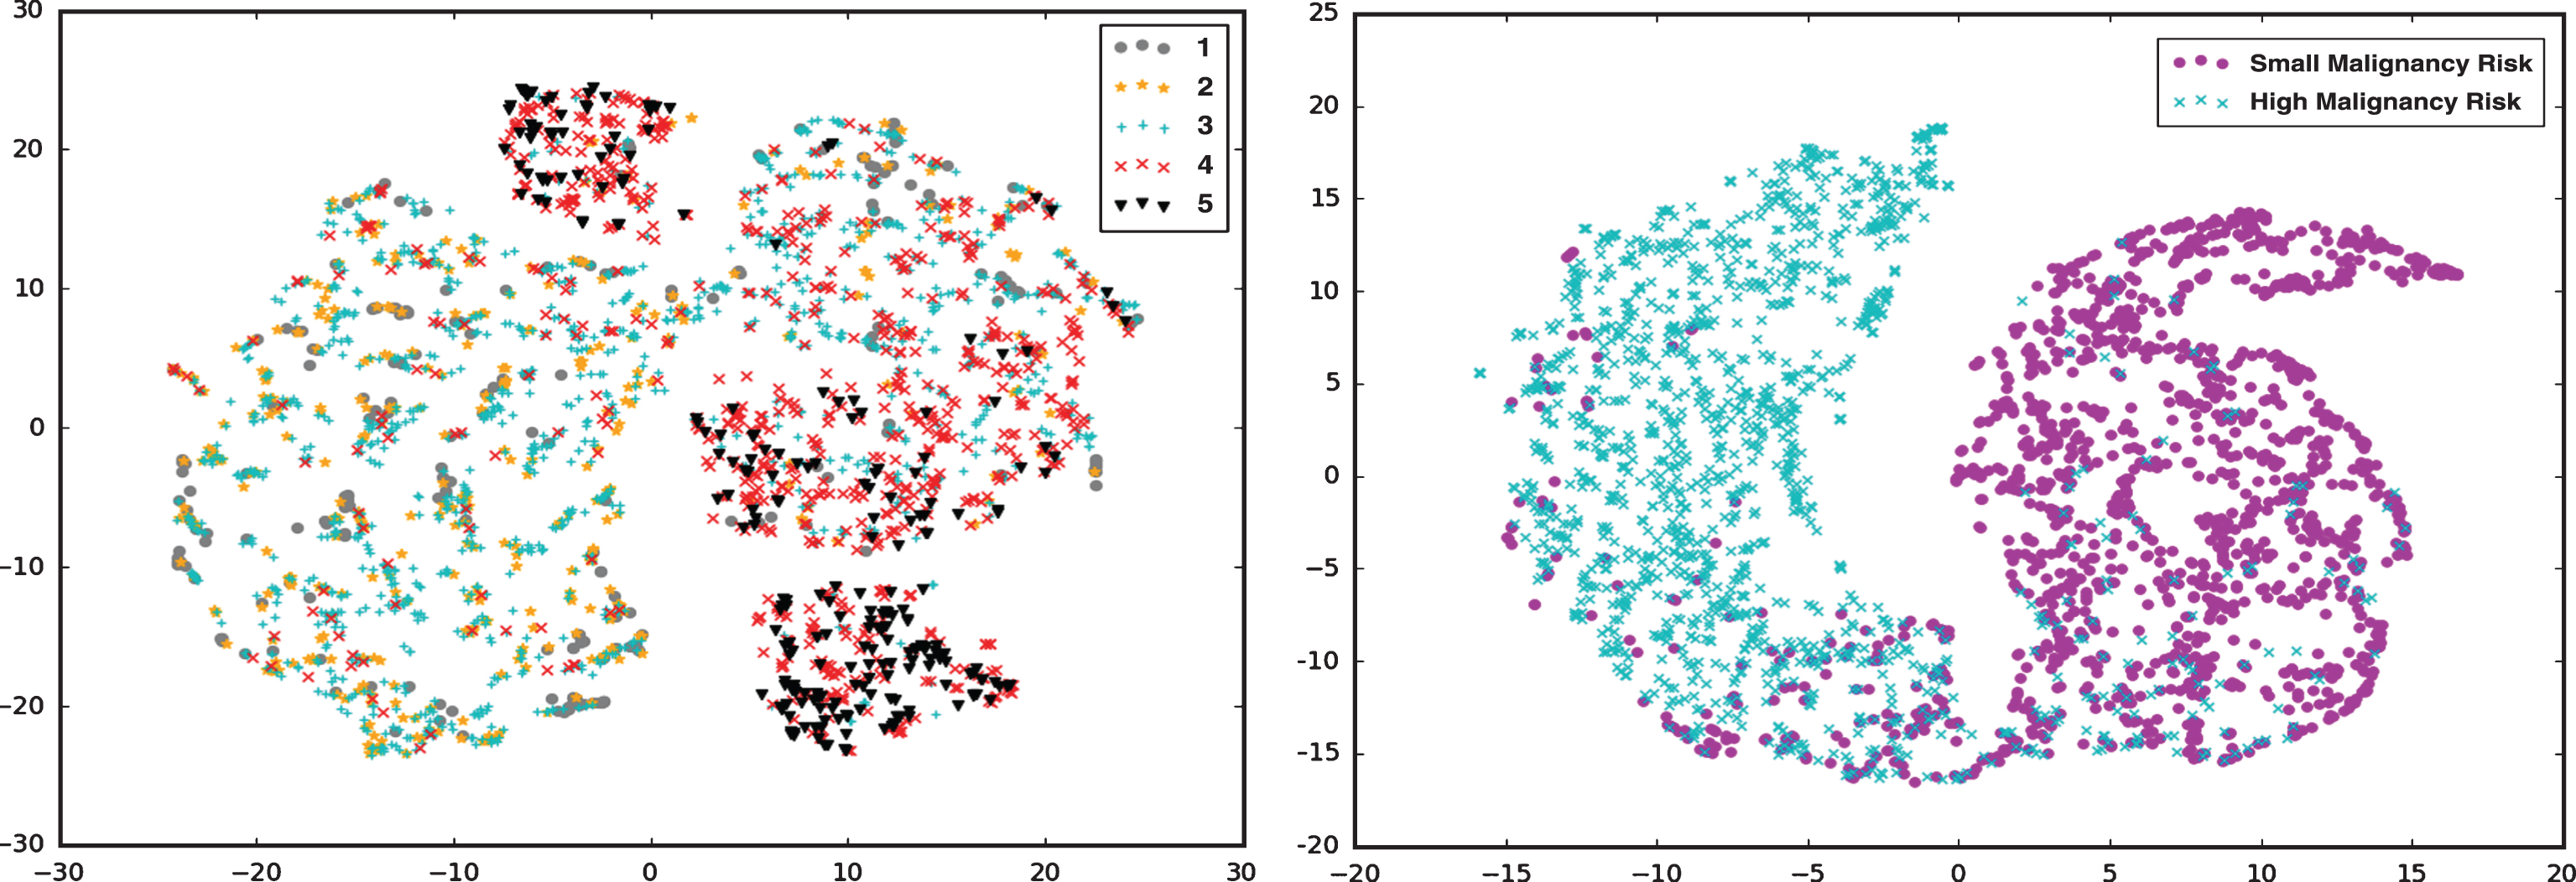
The lung nodules used in the experiment were nodules extracted as detailed in section 2.1. The dataset includes 1455 low risk and 1455 high risk pulmonary nodules to be malignant, and the dataset was expanded by image inversion. The final dataset contains 5820 images, training set (60%), validation set (15%) and test set (25%). In the experiment, the features in the full connective layer were extracted, and then the feature dimension was reduced to 2 by the t-SNE algorithm [29] in order to visualize the feature distribution as shown in Fig. 10. Experimental results showed that classification of five classes of lung nodules has a relatively poor differentiating capacity. As mentioned in section 2.1, those nodules labeled from 1 to 3 are grouped into benign category, whereas those labeled from 4 to 5 are grouped as malignant category. More specifically, as shown in Fig. 10, we observed that the task for lung nodule malignancy risk predication based on 5 categories individually is not feasible since there is potential inter-reader variability existing in labeled LIDC datasets. If we group 1–3 categories as small malignancy risk and 4-5 categories as high malignancy risk, their feature attributes can be better distinguished in spatial distribution.
Illustrations of feature distribution.
In order to evaluate the accuracy and effectiveness of the proposed hybrid CNN model, we conducted a number of experiments, including the Receiver Operating Characteristics (ROC) curve and the AUC. The dimension of full connection layer n
h
= 100, 500, 1000, the kernel size n
s
= 3, 5, 7, the number n
c
= 48, 96, 144. The results were used to examine which network structure was more effective. In order to determine whether the fusion of different features works, the two fusion methods proposed in section 2.4 are respectively performed to verify the effectiveness of fusion ways. The models as mentioned above were implemented on the KERAS (https://github.com/fchollet/keras) deep learning framework. The HOG and LBP features are extracted based on the scikit-image [30] and the proposed models are trained by the GPU (NVIDIA Tesla K80). CNN Model with Different Parameters:
For fair comparisons, the traditional CNN network structure was used as the model baseline. The results showed that the size of the whole layer and the size of the convolution kernel have a great influence on CNN classification performance. The experiments suggested that it performed much better when n c for the first layer is set to 48, the second and third layers are set to 96 [31]. The results also illustrated that the larger the parameters of the full-join layer, the much more discriminative for features, achieving a better performance. But, when n h >1000, there will be over-fitting observed. Meantime, when only the size of the kernel changes, the accuracy will change correspondingly. Hence, the value of n s should be determined according to experiments. Table 2 illustrated various performances under different parameter configurations. And bold font is used to index the best performance with a configuration of n h = 1000 and n s = 3.
Accuracy and AUC of Conventional CNN with various parameters
Accuracy and AUC of Conventional CNN with various parameters
Branching CNN model
In the model section, two CNN models with different feature fusion methods were proposed. At the beginning of each pipeline, we calculated the LBP and HOG feature maps as the input. As shown in Table 3, the experimental result indicated that the models respectively performed very well when the HOG parameters with Cell_size = 8 and the LBP with parameters P = 16, R = 1.
Accuracy and AUC for varying HOG and LBP feature parameters
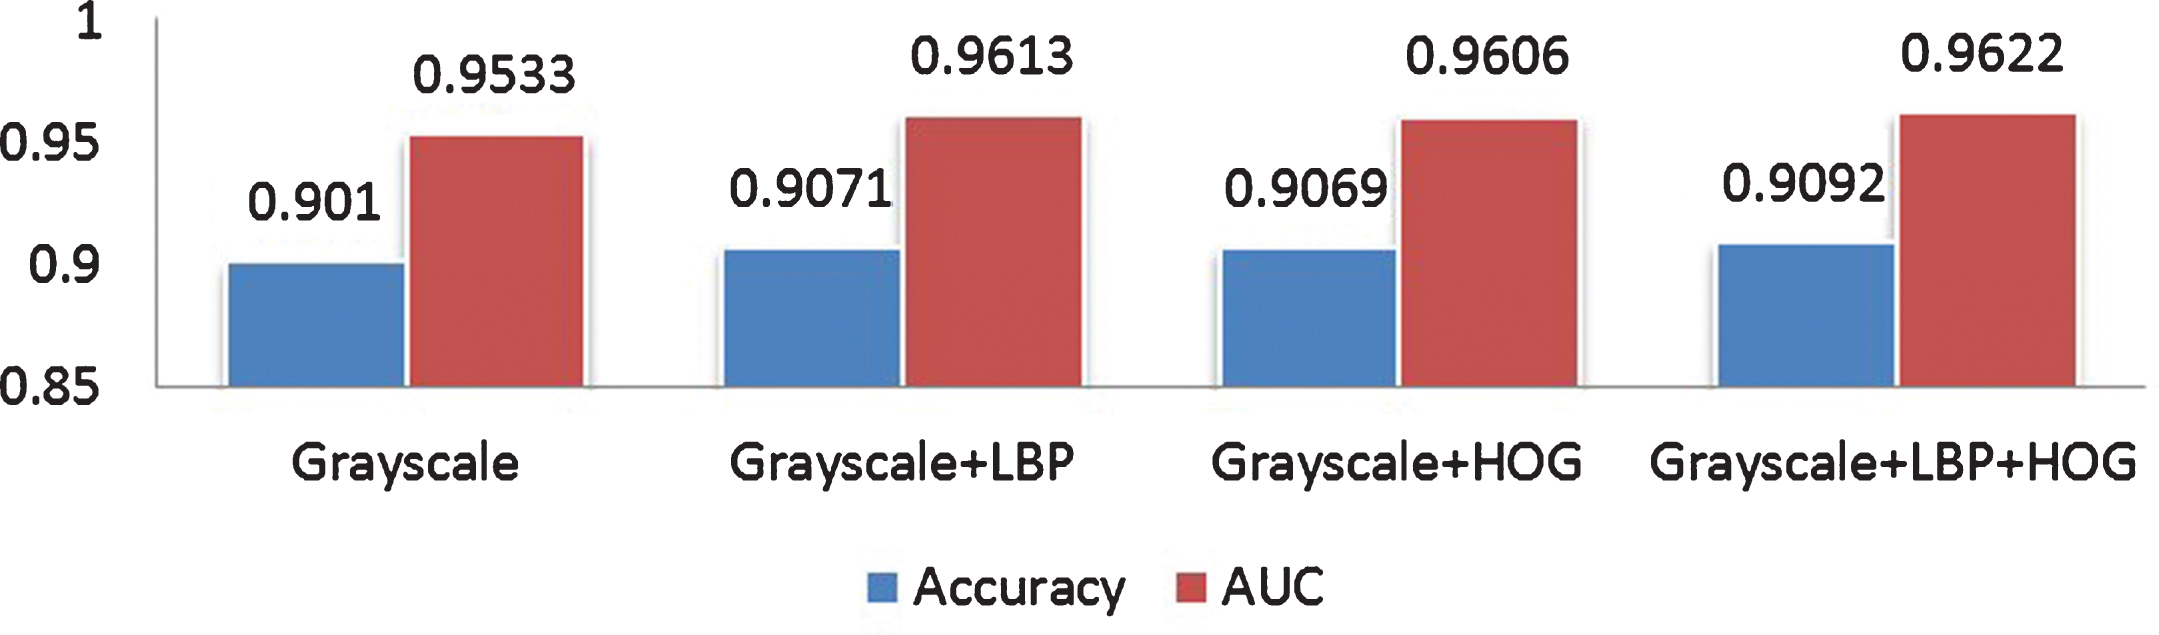
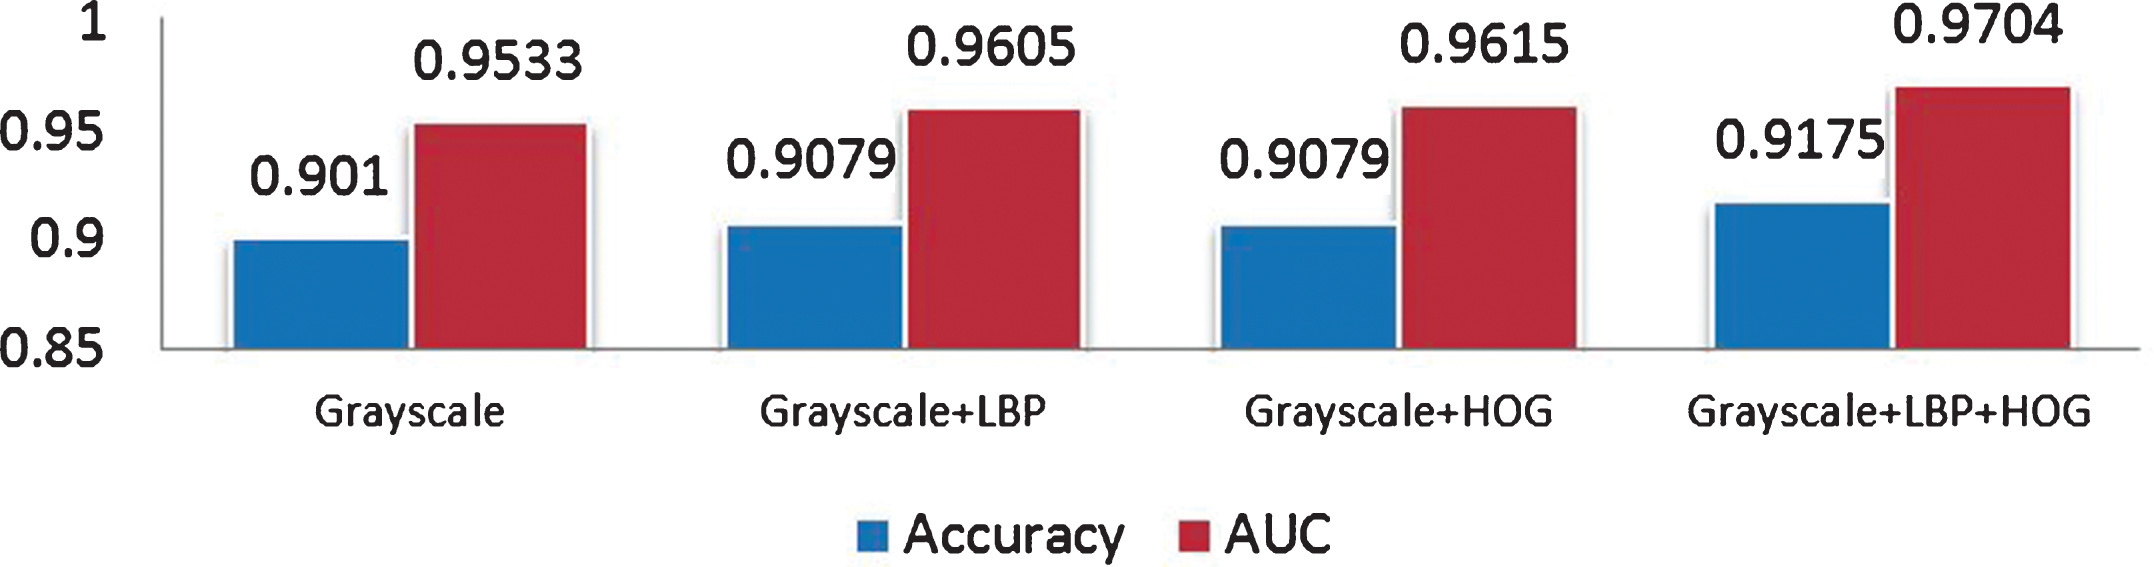
For the CNN model of multi-branch feature fusion, two configurations were considered: one is the three-way branch network structure, where more branches are stitched in a basic model and then finally connected at the full connection layer as shown in Fig. 8; the other one is to reduce the number of branches of both feature maps of LBP and HOG by one convolution layer as shown in Fig. 8. Figure 11 illustrated the experimental results for the first configuration, while Fig. 12 showed the experimental results after adjusting the network structure. Both results suggested that for homogeneous CNN in which the network structures for each branch of three-way model are isomorphic, the performance of the algorithm cannot be improved much, whereas for the heterogeneous CNN in which each network structure for whose branches varies, an improving performance can be found.
Accuracy and AUC of varying Branching CNN at the same scale.
Accuracy and AUC of Branching CNN at different scales.
Accuracy and AUC with varying feature of Multi-Channel CNN.
Multi-Channel CNN Model
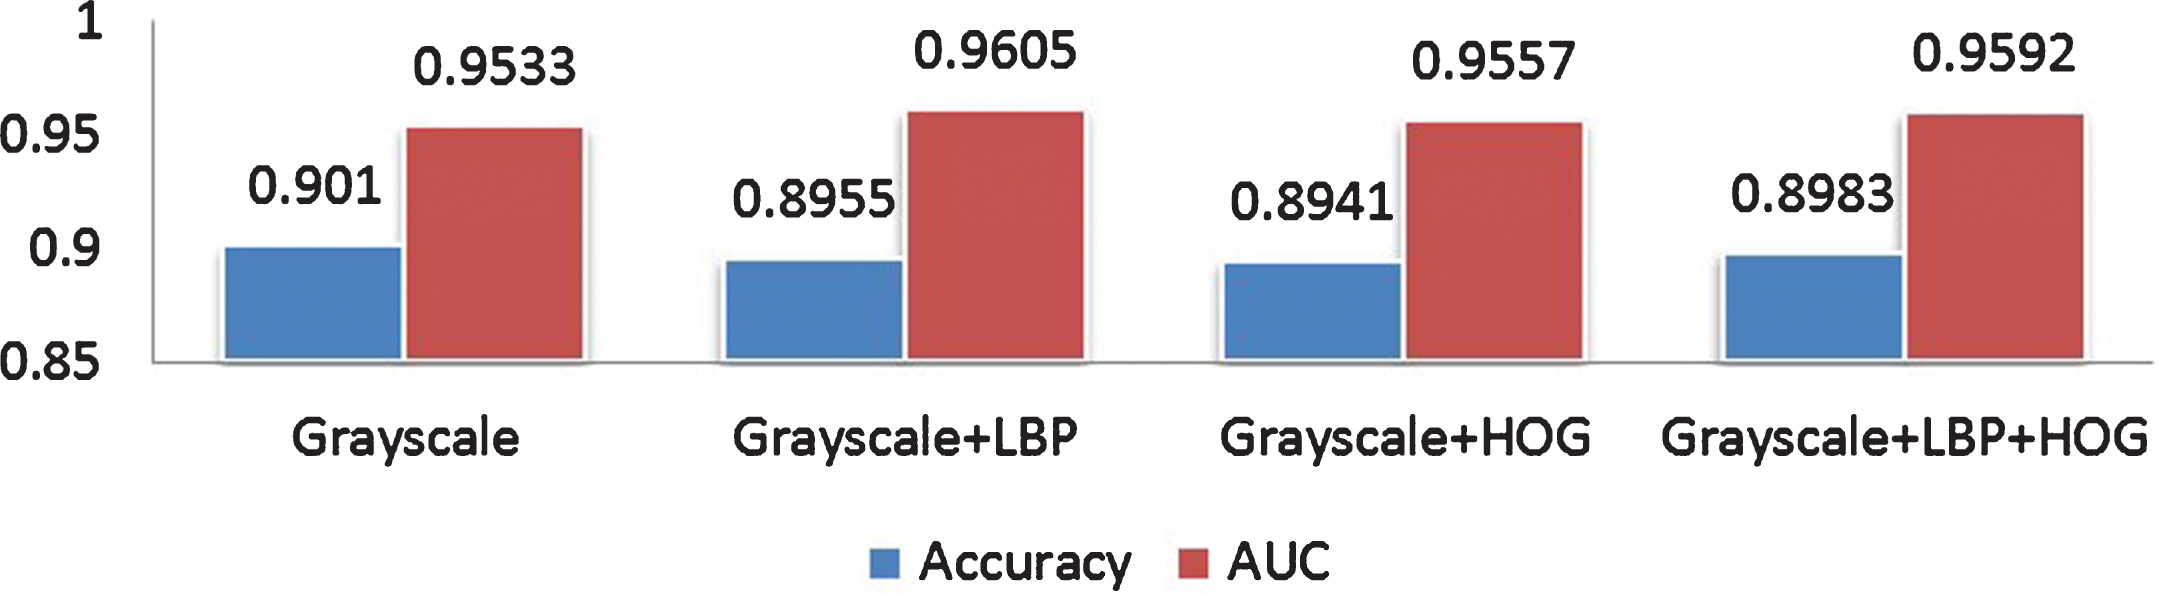
For the multi-channel feature fusion model as shown in Fig. 9, the gray scale, LBP feature and HOG are trained as the input of CNN. We performed analysis of the accuracy and AUC of the model on the test set. The experimental results showed that compared with those models by using only the original pulmonary nodule gray scale, adding the feature maps of LBP and HOG improved the performance with an accuracy increased by 0.017 and the AUC increased by 1.65% as shown in Fig. 13. Comparison among models
We also performed experiments with three different configurations for further comparison, i.e., the traditional CNN model, the branch feature fusion CNN model, and the multi-channel feature fusion CNN model. In order to visualize the advantages of each algorithm, the outputted features of each model were reduced to three dimensions by t-SNE algorithm, and the MATPLOTLIB library (http://matplotlib.org/) of python was used to plot their spatial distribution patterns as shown in Fig. 14. It showed that the CNN models after feature fusion demonstrated performance gains in discrimination of benign and malignant lung nodules compared with the conventional CNN model. The CNN model with the multi-channel feature fusion has the best performance, followed by the branching feature fusion CNN model.

Feature distribution: conventional CNN (left), branching CNN (middle), and multi-channel CNN (right).
In order to avoid bias and demonstrate robustness, we repeated the training, validation, and testing process by randomly reassigning the cases into three groups 3 times. The final ROC curves of the three models were shown in Fig. 15, where the dashed line represented the traditional CNN models; the cyan indicated the CNN model with the multi-channel feature fusion; and the blue represented the CNN model with branching feature fusion. For further comparison, the p-values for three tests were calculated respectively. Since p-values for three tests were all less than 0.05, it is concluded that feature fusion CNN models demonstrated a robust performance. As shown in Fig. 15, the multi-channel model outperformed the rest two models. Comparisons with the Existing Methods
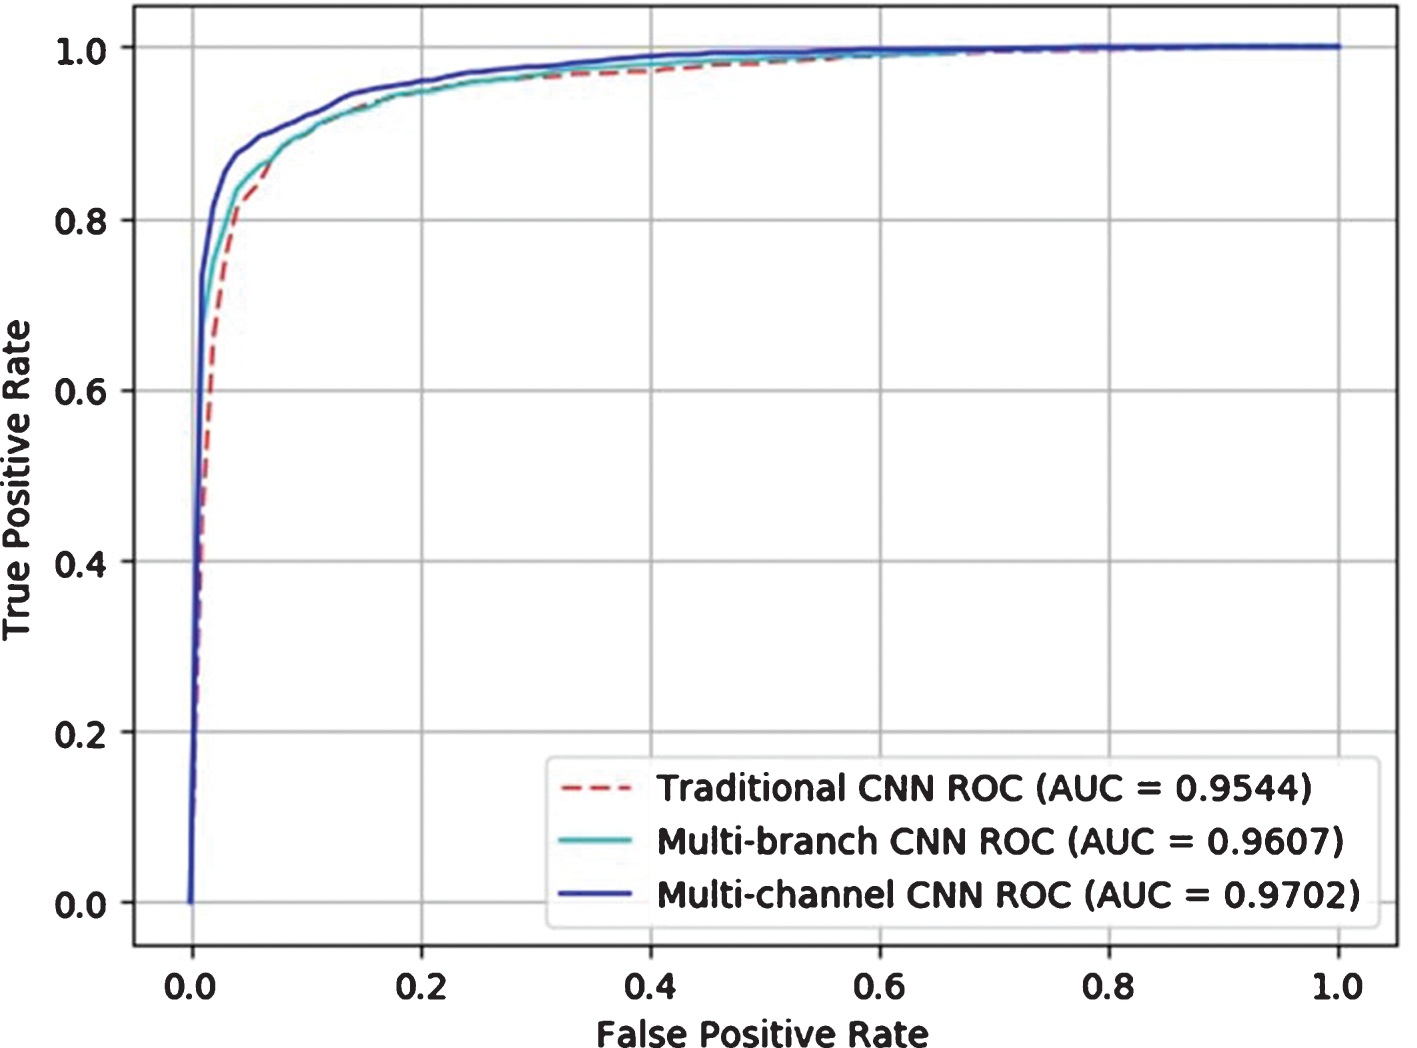
ROC for conventional CNN model and feature fusion CNN models.
We also compared our proposed model with the current existing CADx methods for lung nodules in literature. As shown in Table 4, our method outperformed other traditional methods previously presented.
Accuracy and AUC of different models: the blue stands for the results given in the original literature
In this paper, we proposed a deep leaning model via multi-feature fusion to improve the risk differentiation of benign and malignant pulmonary nodules in CT images. After multi-feature fusion, the model can combine the LBP feature and HOG feature to capture the significant feature information of benign and malignant pulmonary nodules more effectively. Experiment results showed that the hybrid fusion CNN model outperformed other existing methods, achieving the highest AUC value of 0.9702. The validation on classification reflects the feasibility of our proposed model for computer aided diagnosis of pulmonary nodules. Although deep learning has strong self-learning ability, by integrating the multi-feature fusion, we can build up the important feature information in the initial stage, improve the classification accuracy, and speed up the convergence rate of the model, leading more effectively in disease prediction. The strength of deep learning networks is in learning multiple layers of concept representation, which corresponds to different levels of abstraction. For CT images, the low levels of abstraction describe edges in the image, while high layers in the network refer to object parts and even the construction information of objects. In conclusion that it would benefit the high level feature abstraction of CNNs by means of enhancing the useful low level details. Since the traditional feature extraction methods are However, one thing should be mentioned that this study can only predict likelihood or risk level of nodules to be malignant (not classification between malignant and benign nodules).
Footnotes
Appendix A: Algorithm
Acknowledgments
The authors would like to thank Miss.Mingxia Fu, Junyi Du for the discussions on the CNN models, and give thanks to Mr.Zhiqang Li and Bingshen Xu for the data preparation. This work was partially supported by NIH grant No.CA206171 of the National Cancer Institute, and the PSC-CUNY award 68315-0046, 69279-0047.