
Abstract
BACKGROUND:
Iterative image reconstruction in Digital Breast Tomosynthesis (DBT) is a developing modality that produces three-dimensional (3D) reconstructed images of a breast to detect suspicious lesions. Algebraic reconstruction technique (ART), one of the iterative image reconstruction methods, was applied to reconstruct 3D data of breast and is becoming as one alternative method for the conventional image reconstruction techniques such as filtered back projection (FBP) in DBT imaging.
OBJECTIVE:
A new majorization-minimization (MM) algorithm was presented for TV denoising of signals. In the field of DBT, however, the algorithm has not yet been applied. In this study, we proposed a new method of “ART+TV3D+MM,” which applies (MM) algorithm to the images reconstructed by ART+TV3D for different imaging dose levels to investigate a possible reduction of radiation dose.
METHODS:
Projections of a real breast phantom (CD Pasmam 1054) were acquired with a Siemens MAMMOMAT DBT system. The proposed new method was repeated and tested with 3 different radiation dose levels. The quality of the images reconstructed using the proposed new method were compared with those generated by the commonly used FBP method using both qualitative and quantitative assessments.
RESULTS:
The new method showed superior results in terms of visual assessment, contrast to noise ratios (CNR), full width at half maximum (FWHM) values and 1D profiles compared with FBP of the Siemens MAMMOMAT. CNR values were evaluated for two different region of interests (ROIs). For instance, CNR values of ROI-2 of FBP and of new method were 1.670 and 1.978 at 100 mAs, respectively. Moreover, while CNR value of ROI-1 of FBP at 100 mAs was 0.955, CNR value of ROI-1 of using new method at 100 mAs was 48.163. FWHM values for FBP and the new method were 2.328 and 1.765 at 56 mAs, 2.032 and 1.661 at 100 mAs, and 2.111 and 1.736 at 199 mAs, respectively.
CONCLUSIONS:
The results support that using the new method of “ART+TV3D+MM” could help decrease the radiation dose level, which is one of the most critical limitations of DBT imaging.
Keywords
Introduction
Algebraic reconstruction technique (ART) introduced by Kaczmarz [1] is an iterative algorithm, and can be used to reconstruct three-dimensional (3D) images of a breast. Herman [2] performed first medical imaging application of ART. It can be an alternative method for analytical image reconstruction techniques, such as filtered back projection (FBP). Digital Breast Tomosynthesis (DBT) acquires a few projections of the breast within a limited view angle. These projections can be reconstructed into 3D data using ART [3–6].
Two-dimensional (2D) or 3D TV minimization can be applied to the reconstructed images obtained by ART to increase the quality of the images and to overcome out-of-focus slice blurring challenge of the images [5]. TV minimizes l1- or l2-norm of the gradient of an image in general description [7]. So far 3D TV minimization has been applied to only the limited number of studies, whereas the majority of the applications were focused on 2D TV minimization [5, 8]. In addition, as used to TV denoising, a new algorithm, majorization-minimization (MM) [9], was introduced for signal processing [10]. The MM algorithm finds the maxima or minima of a function by exploiting the convexity of the function to optimize a developed iterative algorithm [9–11]. Although in DBT studies this MM algorithm has not been applied before our group demonstrated a proof-of-concept recently [12]. An implementation of the MM algorithm was applied to the 3D DBT imaging of an analytical phantom, mimicking a breast, and of a real breast phantom with only one radiation dose [12].
The radiation dose is a major issue in DBT studies. Obtaining high quality and low noise images with low-dose radiation is desirable as well. The techniques for improving image quality such as image post-processing, filtering, and optimization have attracted more attention in DBT [13, 14]. In fact, a balance must be established between increase and decrease of the imaging dose. Increasing the dose decreases the electronic noise effects in the individual projections of DBT; however, the dose reduction is desired to decrease radiation absorption of a patient.
In this study, using three different imaging dose levels for a real breast phantom, we further propose the MM algorithm based on 3D TV minimization to analyze the effect of dose increase, in comparison with FBP method of Siemens MAMMOMAT [15] (Inspiration system, Siemens AG, Healthcare Sector, Erlangen, Germany). For both qualitative and quantitative evaluations, a CD Pasmam 1054 [16] breast phantom (Southern Scientific Ltd, West Sussex, United Kingdom) scanned using MAMMOMAT was used in the experiments.
Materials and methods
A general geometry of a DBT system is illustrated in Fig. 1. In this study, we worked with Siemens MAMMOMAT DBT modality, which scans the breast over an angular range of approximately 47 acquiring 25 projections. Specifically, the DBT system has three main parts; a static detector, two plates for compressing the breast, and an x-ray source moving in an arm (see Fig. 1). In the Siemens MAMMOMAT, the distances d (the detector to the bottom compression plate), r (the detector to the rotation position of the source), and h (the detector to the x-ray source) are 17 mm, 47 mm, and 650 mm, respectively. The size of the detector is 3584×2816 pixels [15]. The distances d and r were taken from DICOM header information.

The geometry of DBT system [12].
In this study, we performed ART and ART+TV3D to apply our proposed method ART+TV3D+MM for the projections of CD Pasmam 1054 real breast phantom acquired at 56 mAs, 100 mAs, and 199 mAs of doses. The dose is a linear function of tube current-time milliampere-second (mAs) product that is one of the important parameters of radiation exposure, which affects the quality of the reconstructed images [17, 18]. Assuming that let other parameters be constant, there is a proportional relationship between the level of mAs and the patient dose, and an inverse proportional relationship between the level of mAs and the noise of the reconstructed image [18]. A few studies were performed to evaluate the relationship between the radiation dose and image quality at low dose levels in DBT [19–21]. Afterwards, we compared the results of the proposed method ART+TV3D+MM with the results of FBP method of Siemens MAMMOMAT.
We used Siddon’s algorithm [22] to calculate the system matrix-A needed for the reconstruction. In a 3D grid structure, the intersection lengths of every single voxel with the ray on its path and the indices of the intersected voxels by the ray are calculated by the algorithm of Siddon. In [22], Siddon presented a definition of an exact algorithm was made for calculating the ray sum that follows a path through a 3D computed tomography. The concept of ART [1] works on solving for
ART formula stated in Equation (1) [1] provides an updating process to obtain the desired image in each iteration by initializing an estimation of the image [1, 12].
TV minimization stated in Equation (2) is applied to images reconstructed by ART [5, 24].
where Y is the vector form of projections, X is the vector form of the object desired to estimate, A is the system matrix, λ is TV regularization coefficient, and TV (•) is TV minimization operator. The steepest descent algorithm is used for minimizing TV (X).
Here,
In Equation (3), Xi,j,k represents the intensity value at voxel (i,j,k), i = 1,2, ... I; j = 1,2, ... J; k = 1,2, ... K. I, J, K are the dimensions of 3D object in the directions of X, Y, Z respectively.
Additionally, Majorization-Minimization (MM) algorithm solves a sequence of optimization problems G
p
(x), for minimizing a convex cost function F (x) by using the following formulation [9–11].
25 projections acquired via MAMMOMAT were reconstructed by performing ART with one iteration. Voxel values of the 3D data for each projection were updated ray by ray, and for all projections the updating was repeated to complete a single iteration. During each iteration of the proposed method, 3D TV minimization, expressed in Equation (2) [5, 12] was applied to the 3D data reconstructed by ART, and then the MM algorithm was applied to the 3D TV minimized image.
The convergence criterion for stopping the iteration, variation (%) (6), was set for MM based on the difference of the mean value of a chosen region of interest (ROI) (μ
ROI
) from one iteration (r) to the next [6].
The iteration number of MM algorithm was chosen based on Equation (5) [6]. The graph of variation (%) of the ROI for MM algorithm is shown in Fig. 2. We terminated the inner iteration of MM when values of the variation (%) were under 5%. In our studies, it happened after the 3rd iteration. However, in order to give more consistency to this convergence, iteration number 5 was chosen.

Convergence criteria for inner iteration of MM algorithm.
The acquisition was performed at Hospital da Luz S.A., Lisbon, Portugal. The projections were acquired with short x-ray pulses at angles of (–25.19, –22.98, –20.78, –19.12, –17.22, –15.14, –13.45, –11.41, –9.54, –7.48, –5.63, –3.55, –1.92, 0.29, 2.23, 4.00, 5.797.84, 9.99, 11.64, 13.49, 15.6, 17.76, 18.92, 21.77) with 28 kVp. Siemens MAMMOMAT reconstructed the projections via filtered back projection (FBP) method and afterwards FBP reconstruction images were filtered by “section thickness filter” of Siemens AG [25, 26]. The reconstructed images consisted of 44 slices with 3112×2260 pixels each and the resolutions in XY plane and in axial direction of each slice were 0.085 mm and 1 mm, respectively.
In this study first, we performed both algorithms, ART and ART+TV3D, to perform ART+TV3D+MM and reconstructed 601×472×8-size images at three different radiation dose levels. Our results of the reconstructed images by ART+TV3D+MM were compared with those of the reconstructed images by Siemens MAMMOMAT’s FBP down-sampled to 600×440 pixels and 8 slices. Layer-1 was chosen as the layer of interest (LOI). For all reconstructions, a preset value was used for TV regularization coefficient (λ). The regularization terms (λ) of both ART+TV3D and ART+TV3D+MM were chosen a fixed value as 5. There exists no golden standard for choosing the regularization term. Ideally, it is well known that the term (λ) is chosen inversely proportional to the signal-to-noise ratio (SNR) [27].
Contrast to noise ratio (CNR) defined in Equation (6) and full width at half maximum (FWHM) shown in Fig. 3 were used to analyze the results quantitatively in the methods.
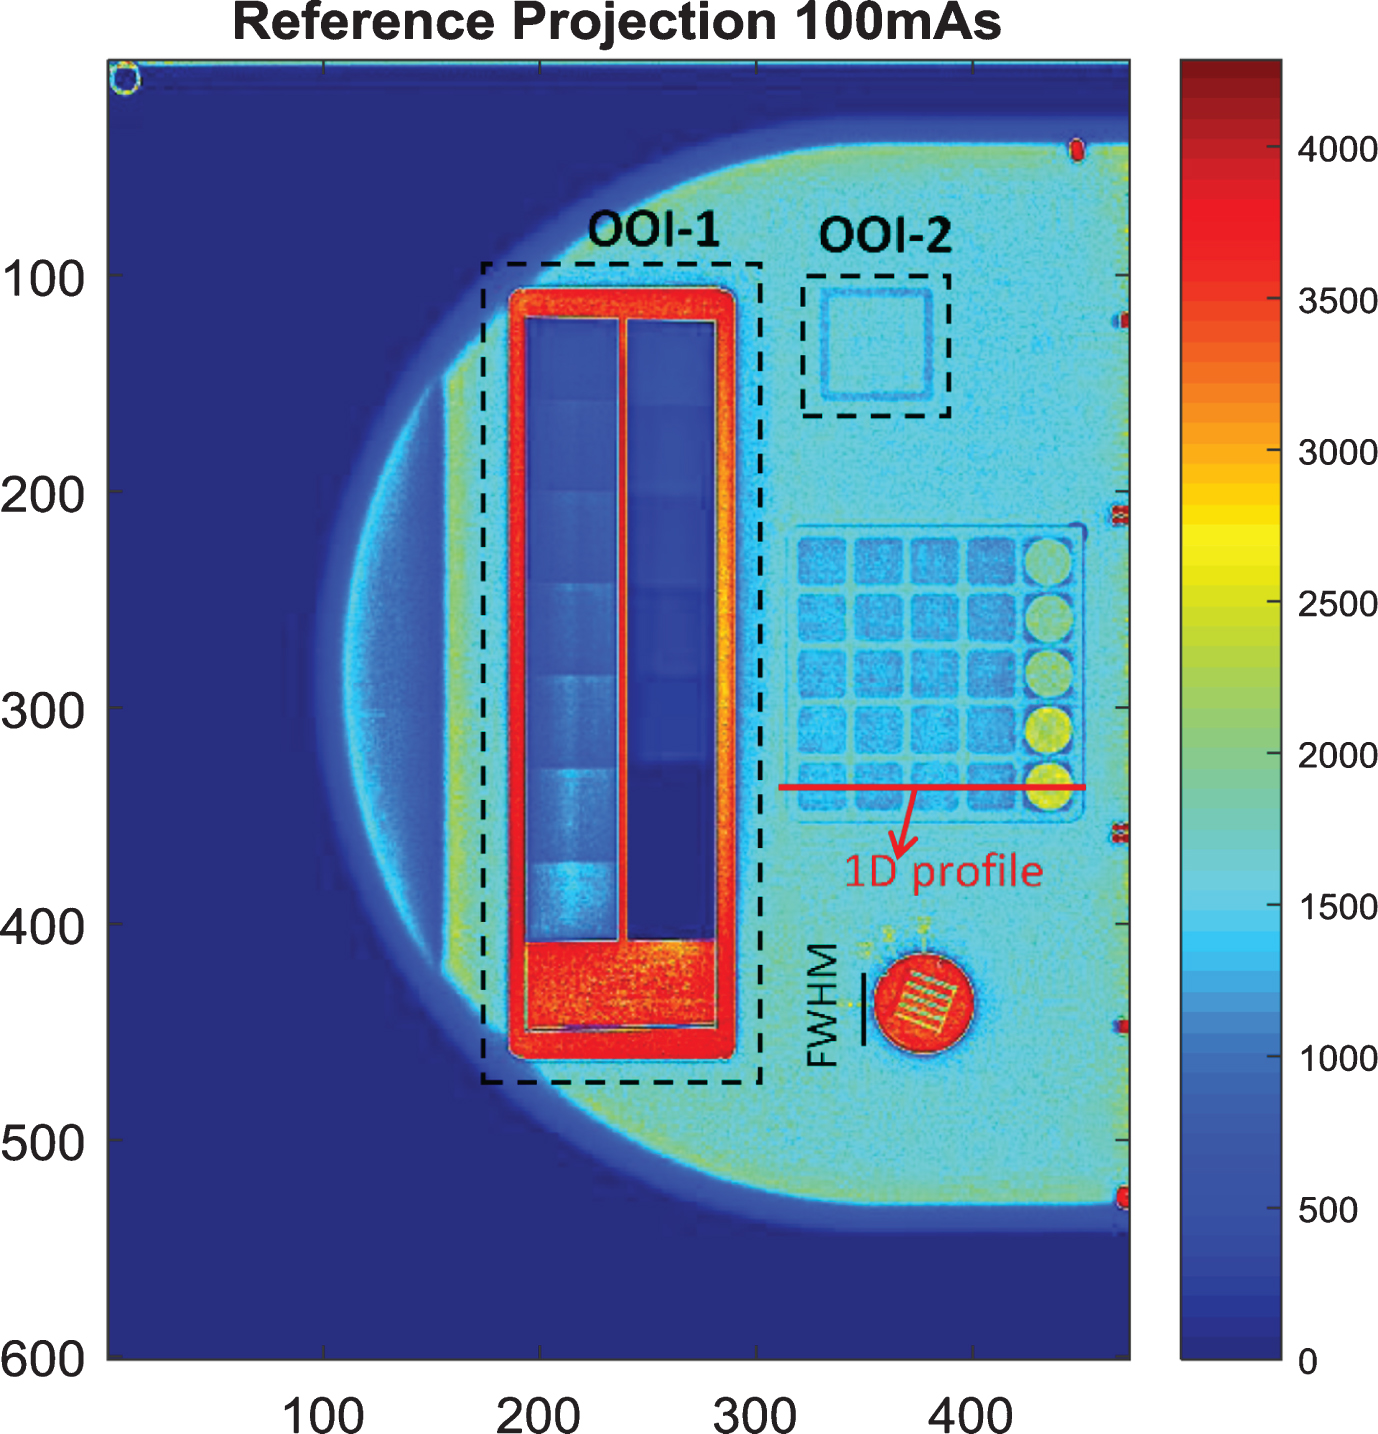
OOI-1, OOI-2, FWHM and 1D profile in the reference projection (601×472 pixels) at 100 mAs-dose level at angle of 0.29.
μ ROI and μ Background stand for the mean values of a ROI and background selected around that ROI, respectively. σ Background is the standard deviation value of the background of the ROI. The detectability of the fine details in the results was also examined qualitatively.
All tests were executed by using MATLAB R2015b running on a computer that has two Intel Xeon E5_2660 CPUs@ 2.2 GHz with total of 16 cores, two Tesla K20 NVIDIA cards, 64 GB RAM, and 64 bit CentOS 6.4 system. Our MATLAB code included three main steps; calculating the intersection lengths and their indices, building the system matrix, and performing the proposed method. Finally, we compared the methods both quantitatively by using CNR and FWHM values and qualitatively by enlarging OOI-1, OOI-2, and 1D profile to see fine details in terms of sharp edges, which indicates the detectability of the masses.
When we evaluated the reconstructed images of FBP and ART+TV3D+MM in Fig. 4, OOI-1 was blurred in the reconstructed images by FBP (left column), compared to the reconstructed images by ART+TV3D+MM (right column) for all doses. All data were processed in 8-bit dicom data. Enlarged OOI-1 is illustrated in Fig. 5; the enframed rectangular window shape clearly was distinguished in ART+TV3D+MM, whereas the same shape was not clear in FBP. ART+TV3D+MM provided improved reconstruction by increasing the sharpness of OOI-1. On the other hand, this shape was blurry for all doses for FBP. When we zoomed in OOI-2 of both FBP and ART+TV3D+MM for all dose levels, it was visually observed that ART+TV3D+MM images had higher quality than FBP images in terms of quality of detectability of the square-shape (see Fig. 6). It was understood that both OOIs were easily distinguished in the three doses of ART+TV3D+MM in terms of preserving the edges compared to FBP.
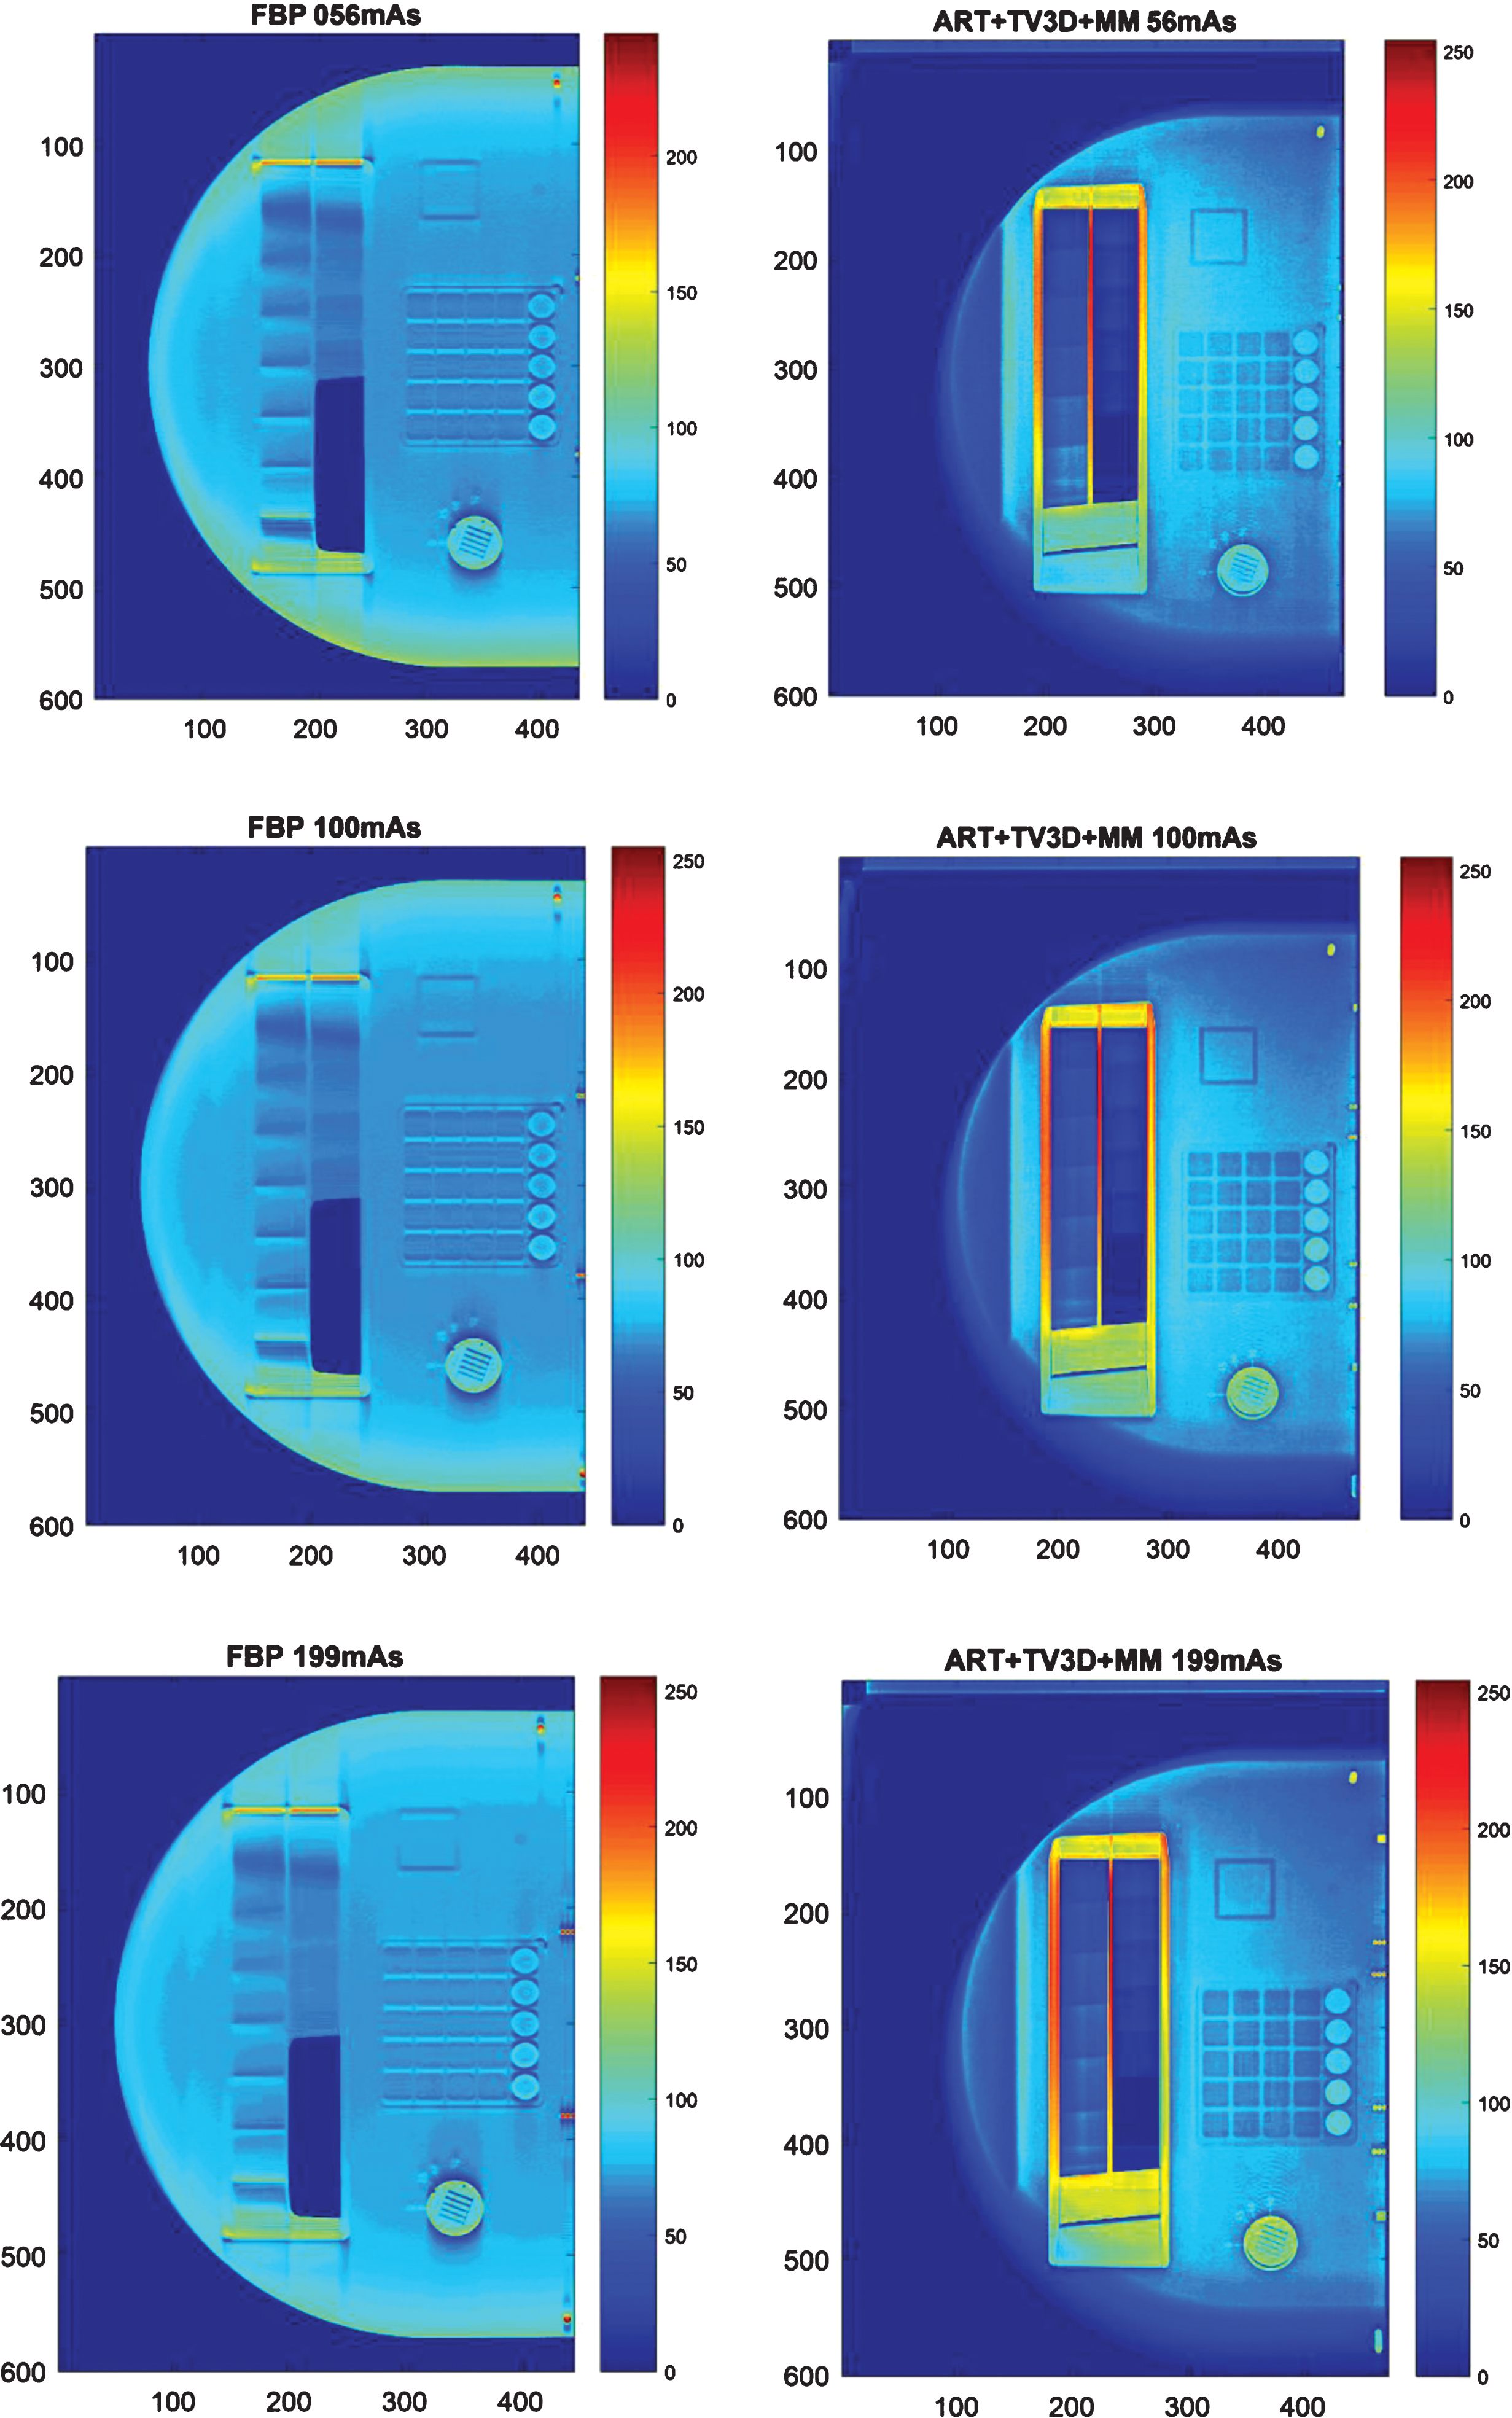
FBP (600×440 pixels) (left column) and ART+TV3D+MM (601×472 pixels) (right column) for 56 mAs (1st row), 100 mAs (2nd row), and 199 mAs (3rd row).
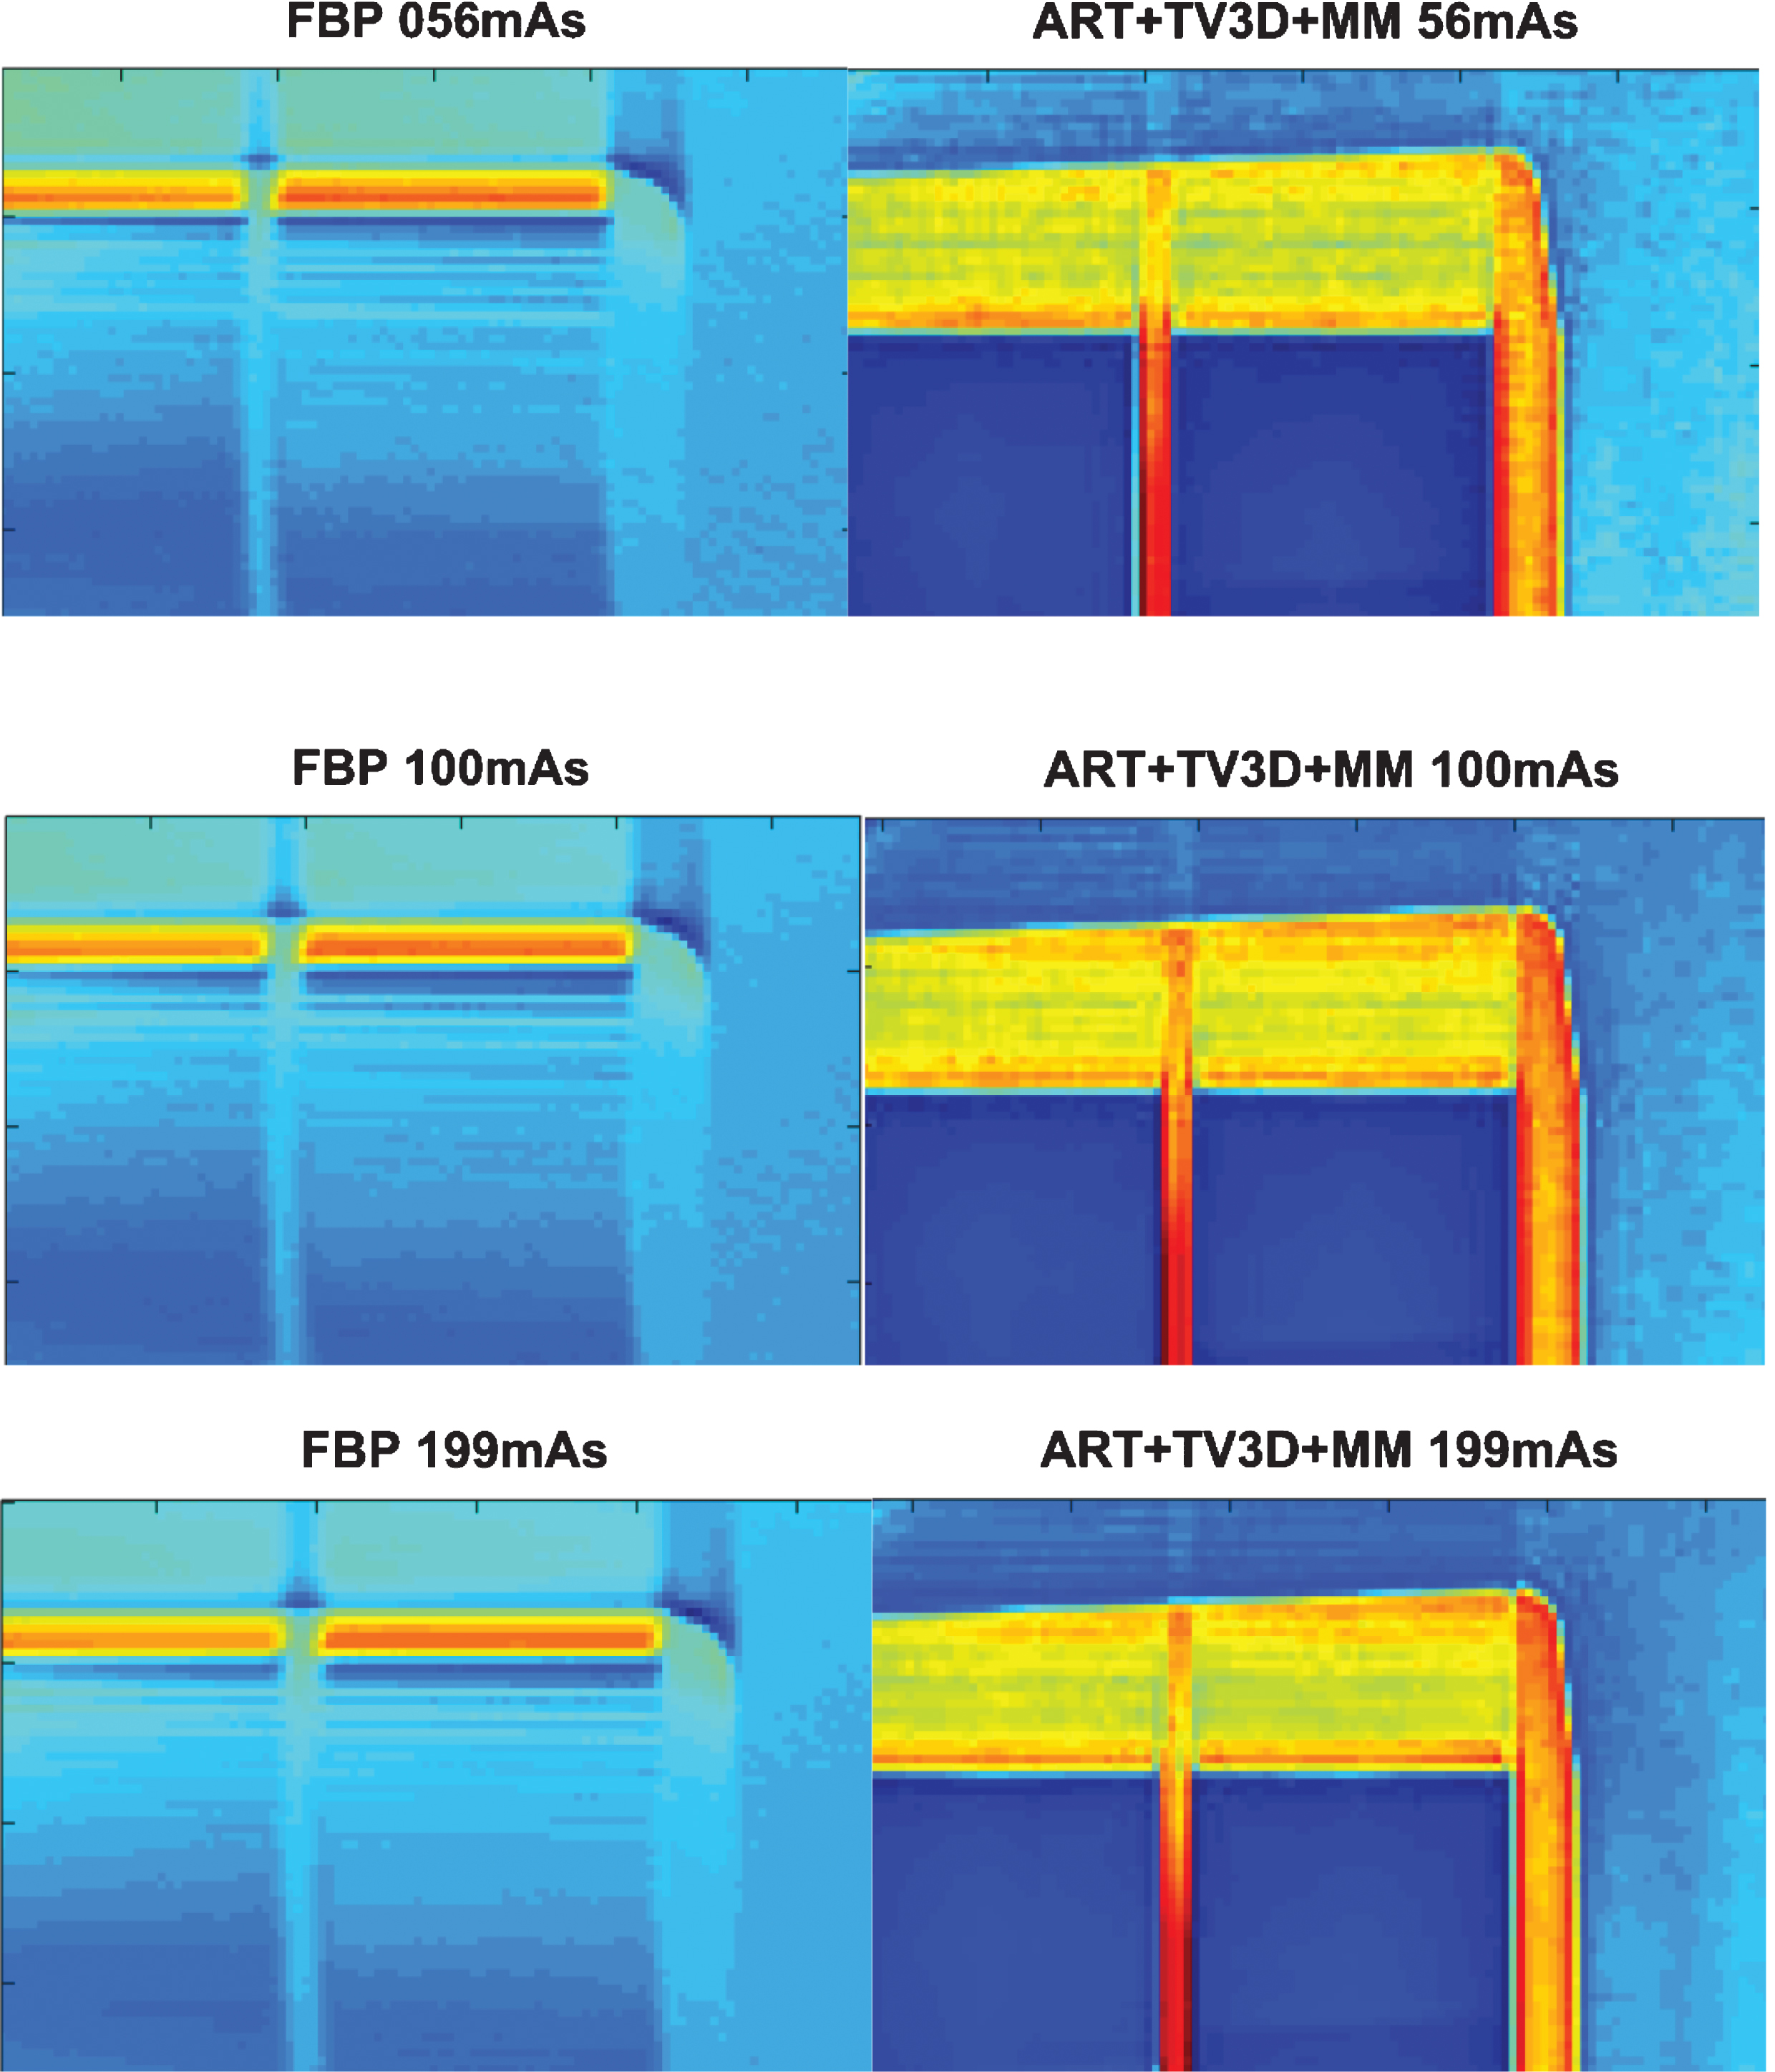
Zoom in OOI-1 at 56 mAs, 100 mAs, and 199 mAs for FBP and ART+TV3D+MM (100×70 pixels).

Zoom in OOI-2 at 56 mAs (left column), 100 mAs (middle column), and 199 mAs (right column) for FBP (1st row) and ART+TV3D+MM (2nd row) (50×50 pixels).
Furthermore, when the dose level increased the background noise decreased, so masses and fine details became evident for both ART+TV3D+MM and FBP methods. The image quality and the detection of shapes, masses and micro-calcifications of the highest dose reconstruction were better compared to the same features of the lowest dose reconstruction for both ART+TV3D+MM and FBP methods (see Fig. 5 and Fig. 6).
To evaluate the performance of ART+TV3D+MM method comparing to FBP apart from qualitative assessment, quantitative metrics such as CNR, FWHM and 1D profile of the LOI were examined as well. For this purpose, CNR values of ROI-1 (in OOI-1) and ROI-2 (in OOI-2), FWHM and 1D profile shown in Fig. 3 were used. ROIs contain fine details which mimic lesions in breast. Specifically, ROI-1, ROI-2 and their background areas in ART+TV3D+MM are shown in Fig. 7. The results of ART+TV3D+MM and FBP were compared by comparing CNRs of ROI-1 and ROI-2 in Fig. 8 and 9 respectively.
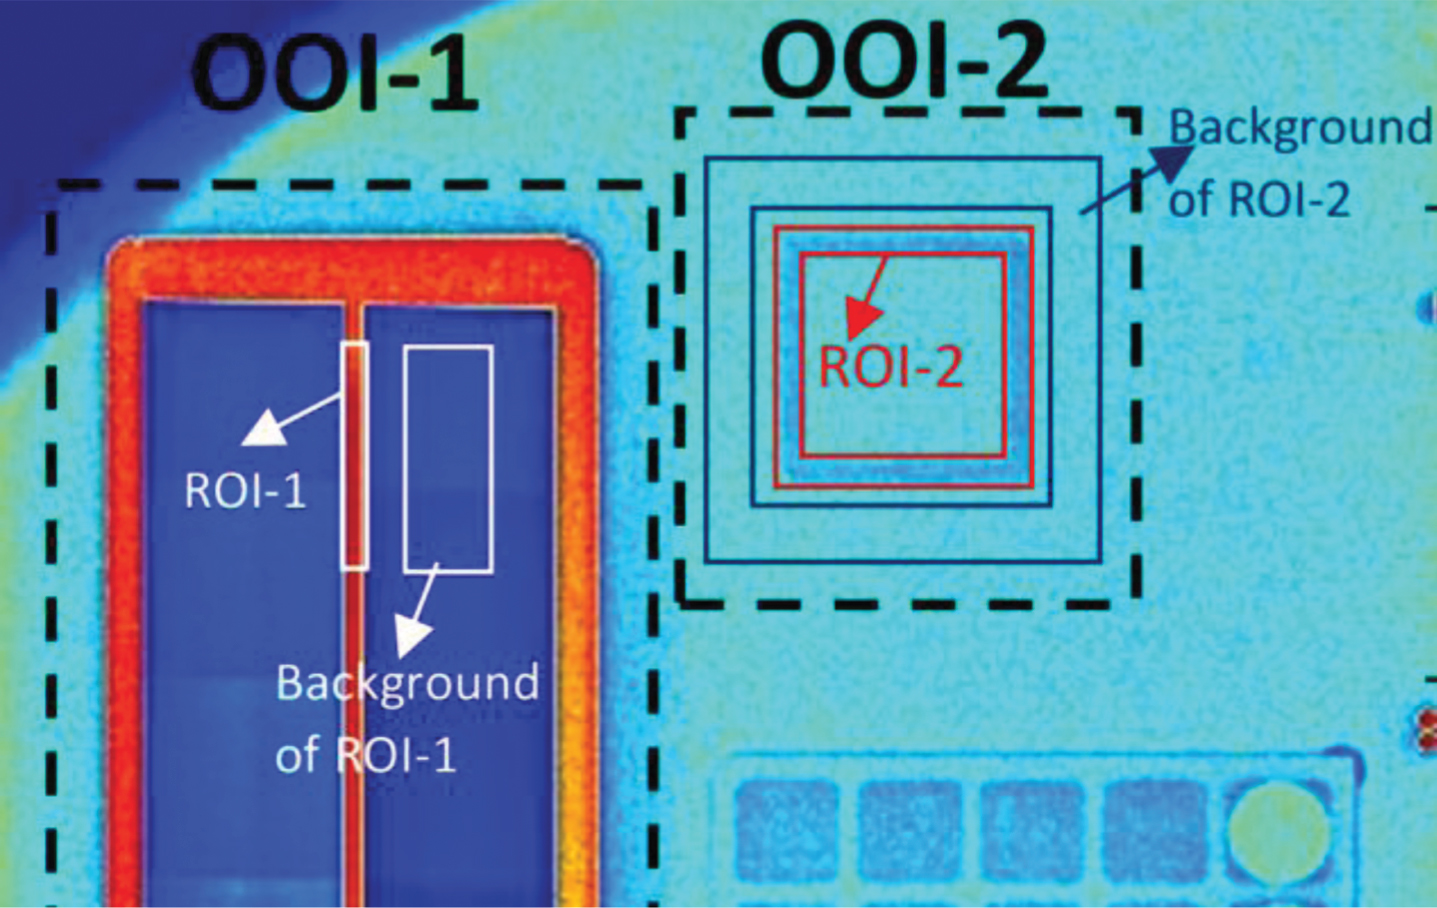
ROI-1, background of ROI-1, ROI-2, and background of ROI-2.

CNR Values of ROI-1 of FBP and ART+TV3D+MM for three dose levels.

CNR Values of ROI-2 of FBP and ART+TV3D+MM for three dose levels.
It was observed that our proposed method ART+TV3D+MM had approximately 45–55 times better results than FBP by evaluating the CNR values of ROI-1 in Fig. 8. As the CNR values of ROI-1 of ART+TV3D+MM supported very strongly, the image quality of our proposed method was much better than FBP when analyzed visually (see Fig. 5). For instance, while the CNR value of ROI-1 of FBP at 100 mAs was 0.955, the CNR value of ROI-1 of ART+TV3D+MM at 100 mAs was 48.163, which means 50.43 times better. CNR values of ROI-1 for FBP and ART+TV3D+MM were 0.830 and 47.037 at 56 mAs, and 1.032 and 51.687 at 199 mAs, respectively (see Fig. 8 and Table 1). CNR values of ROI-2 for FBP and ART+TV3D+MM were 1.418 and 1.628 at 56 mAs, 1.670 and 1.978 at 100 mAs, and 2.370 and 2.336 at 199 mAs, respectively (see Fig. 9 and Table 1).
CNR Values of ROI-1 and ROI-2 and FWHM for FBP and ART+TV3D+MM at 56 mAs 100 mAs, and 199 mAs
Additionally, in Fig. 9 analyzing the CNR values of ROI-2 produce results that are too close together; however, visual inspection suggests that ART+TV3D+MM provides the better reconstructed images in terms of preserving the edges of square-shape compared to FBP (see Fig. 6). The CNR value of ROI-2 of ART+TV3D+MM at 199 mAs was less than the CNR value of the FBP. This could be explained by the effect of down-sampling, applied to the images reconstructed by the FBP, in smoothing the background. Examining CNR values of both ROI-1 and ROI-2 for both methods ART+TV3D+MM and FBP, when dose increased the values of CNR increased as expected. We calculated the values of FWHM and sketched the graphs in Fig. 10. FWHM values for FBP and ART+TV3D+MM were 2.3279 and 1.7648 at 56 mAs, 2.0317 and 1.6606 at 100 mAs, and 2.1110 and 1.7385 at 199 mAs, respectively. CNR values of ROI-1 and ROI-2 and FWHM values for both methods were summarized in Table 1.

FWHM plots of three doses for FBP and ART+TV3D+MM.
How 1D profile illustrated in Fig. 3 changed by increasing radiation dose was analyzed and compared for both ART+TV3D+MM and FBP methods. From the plots of 1D profile shown in Fig. 11, it was clear that the amplitudes of 1D profile at both 100 mAs and 199 mAs for ART+TV3D+MM were higher than the amplitudes of 1D profile at all doses for FBP. One circle- and one square-shapes that we desired to know how 1D profile was effected by different reconstruction methods and by the levels of dose were magnified in Fig. 12. Analyzing Fig. 12, The circle-shape was well separated in both methods at all doses. On the other hand, although vertical edges of the square-shape was not able to be distinguished in FBP, they were well observed in ART+TV3D+MM. However, background noise was higher in the results of our method compared with the ones of FBP. We also observed that if the dose increased the sharpness of the vertical edges of the square-shape and the contrast of the circle-shape increased in our proposed method ART+TV3D+MM.

1D profile of three dose levels for FBP and ART+TV3D+MM.

Enlargement of the right part of 1D profile (one circle and one square) of three doses for FBP and ART+TV3D+MM (42×17 pixels).
In the literature of image reconstruction, iterative techniques such as ART and analytical methods such as FBP are applied to cutting-edge medical techniques such as DBT. TV3D is applied to ART to enhance the quality of the reconstructed images. In this study, we investigated whether a Majorization-Minimization based TV3D algorithm in ART (ART+TV3D+MM) could help lower the dose in DBT imaging using 25 projections of a real phantom (CD Pasmam 1054) by comparing the outputs of Siemens MAMMOMAT. We analyzed and compared the results of ART+TV3D+MM and Siemens MAMMOMAT’s FBP both qualitatively and quantitatively. Visual assessment by focusing on the details in the phantom, 1D profile comparison, FWHM and CNR were used in the comparisons of the methods. ART+TV3D+MM showed better performance than FBP by generating smoother images in the uniform areas, by creating sharper edges between the uniform areas, and by giving higher CNR and lower FWHM values in general. Moreover, the dose level effected the results in the same manner for both reconstruction methods. The proposed method should also be applicable to other DBT systems since the main limitation of all these DBT systems come from the limited view angle imaging causing the problem being highly undersampled. In conclusion, this study demonstrated that ART+TV3D+MM could help decrease the radiation dose level, which is one of the most critical limitations of DBT imaging.
Footnotes
Acknowledgments
This work was supported by TUBITAK, the Scientific and Research Council of Turkey, under the grants 1059B141600590 and 111E086.