
Abstract
The article presents and discusses results of an experimental study regarding the accuracy of measurements performed with X-ray CT scanners. One of the main factors affecting the measurement result is definition of the threshold value between the air and the material. In this study, the results of measurements using two methods to determine the threshold value namely, the newly developed method and a well-known and commonly used method of ISO50%, were compared. A novel method is based on the measurement of an additional reference workpiece. The correction value, based on the measurement, is determined, and then it takes account when determining the threshold value between the air and the material. The study was performed using two types of gauges. These were workpieces of a specified volume of material (consisting of reference balls) and with the defined values of linear dimensions (in the form of cubes and cylinder). Using five different CT scanners, the conducted study yielded increase in the accuracy of measurements by applying the developed method in relation to the ISO50% automated method. In the case of volumetric test workpieces, relative measurement errors were reduced by 3 to 10 times for metrological CT scanners and from 50 to 30% for defectoscopy CT scanners. In the case of linear dimension measurements, average measurement errors were reduced twice.
Introduction
Industrial computed tomography belongs to a group of coordinate measuring techniques. In traditional coordinate measurements, coordinates of the measuring points positions are read, for example, from linear encoders (coordinate measuring machines) or from angular encoders (coordinate measuring arms). In the case of contact measurements in both types of devices, the encoders memorise the coordinates of the centre of the measuring ball when the measuring probe touches the measured surface [1]. By inputting the correction, associated with the radius of the measuring probe, information about the coordinates of the measuring points located on the measured surface is obtained [2]. X-ray tomography is a non-contact and non-destructive measurement and defectoscopy method. In the case of computed tomography, the measurement is based on the determination of the coordinates of points located on the reconstruction surface of the measured object. The key issue in this measurement technique is the proper determination of the threshold between the material and the air, which results in the correct determination of the edges and surfaces of the measured objects [3].
The results of tomographic measurement are volumetric files consisting of voxels. Voxels are three-dimensional pixels, each of which is defined by a value from a grayscale. Qualification which voxel represents the material of the measured object and which represents the surrounding air depends on the set threshold value [4, 5].
Industrial computer tomography uses a whole range of different types of gauges. Most workpieces are constructed in accordance with the VDI/VDE guidelines (Verein Deutscher Ingenieure/Verein Deutscher Elektrotechniker) [6, 7]. These are usually workpieces with specific reference distances, for example between the centres of balls (ball bar) or between planes (workpieces in the form of gauge blocks or cubes). If standard ball bars are used and only the distance between balls is checked, it is not possible to check the effect of the threshold setting. Changing the threshold values only results in a change of the spheres diameter. In the presented research, workpieces were constructed using spheres with reference volume values and workpieces of another construction with reference values of linear dimensions.
Studies on the accuracy and uncertainty of measurement results from computed tomography scanners [8–14] are in most cases analogous to those from conventional coordinate measurement methods [15, 16]. In such studies the results of measurement of linear dimensions gauges are compared with the reference values.
Since the change of the threshold setting affects the change in the measurement result, it was decided to check the effect of the threshold setting on the accuracy of the tomographic measurements using the two described threshold determination methods. Comparison of both methods which let us minimise the influence of the operator, by changing the threshold value manually, may lead to manipulation of the measurement results.
Methods
X-ray computed tomography is a measurement technique based on the analysis of volumetric data. Files are created as a result of volumetric reconstruction of the object from a series of individualX-ray images. The proposed method for determining the threshold value associates errors occurring on individual X-ray images with errors related to the reconstruction of a volumetric file. Error correlation is made by analysing the areas of cross-sections on radiographs with reference values.
The proposed method for determining the threshold value is based on the additional measurements of calibration sphere and recording a series of X-ray images from which the reconstruction is performed. In the case of a ball measurement, regardless its angle setting on each image, it is possible to determine the area of its cross-section in diameter. The advantage of such approach is inclusion, in the calibration process, of factors affecting the accuracy of reconstruction such as: set magnification, eccentricity of the set element, radiation scattering at the edges, noise of the detector, radiation beam instability during measurements, influence of external factors, etc. All of these factors will affect every single X-ray image directly, and in consequence, indirectly also to the reconstructed volume file. Therefore, the reconstruction algorithms take into account the errors recorded in each X-ray image from which the reconstruction is performed. Calculated correction value can be entered to correct the threshold value of the measured element (made of material with similar X-ray absorption coefficients and a similar thickness) [17].
Figure 1 shows a diagram with the principle of operation of the new method. If the reconstructed tomographic measurement file is presented as a graph of the sum of the voxels S i of the given grayscale values χ, we obtain a histogram. When measuring elements made of one material, two peaks are displayed on the histogram. One refers to the air (A) and the second - the material (M). Using the ISO50% method, the threshold value is set at equal distances between the maximum sums of voxels for air and material (s a and s m ). In the case of the proposed method the minimum sum of voxels between the peaks is searched (s min ). In the measurement of the material workpiece (the reference sphere with the known value of P mwz - the surface area of the circle with the diameter of the reference ball) it is possible to determine the value of PS. It is done by comparing the reference value of the surface P mwz with the surface calculated from n number of X-ray images of the P ks gauges (the surface area of the circle calculated as the sum of pixels on the X-ray images). The obtained deviation value PS is multiplied by the value of the sum of the peak corresponding to the material S m . This gives the value of p χ .
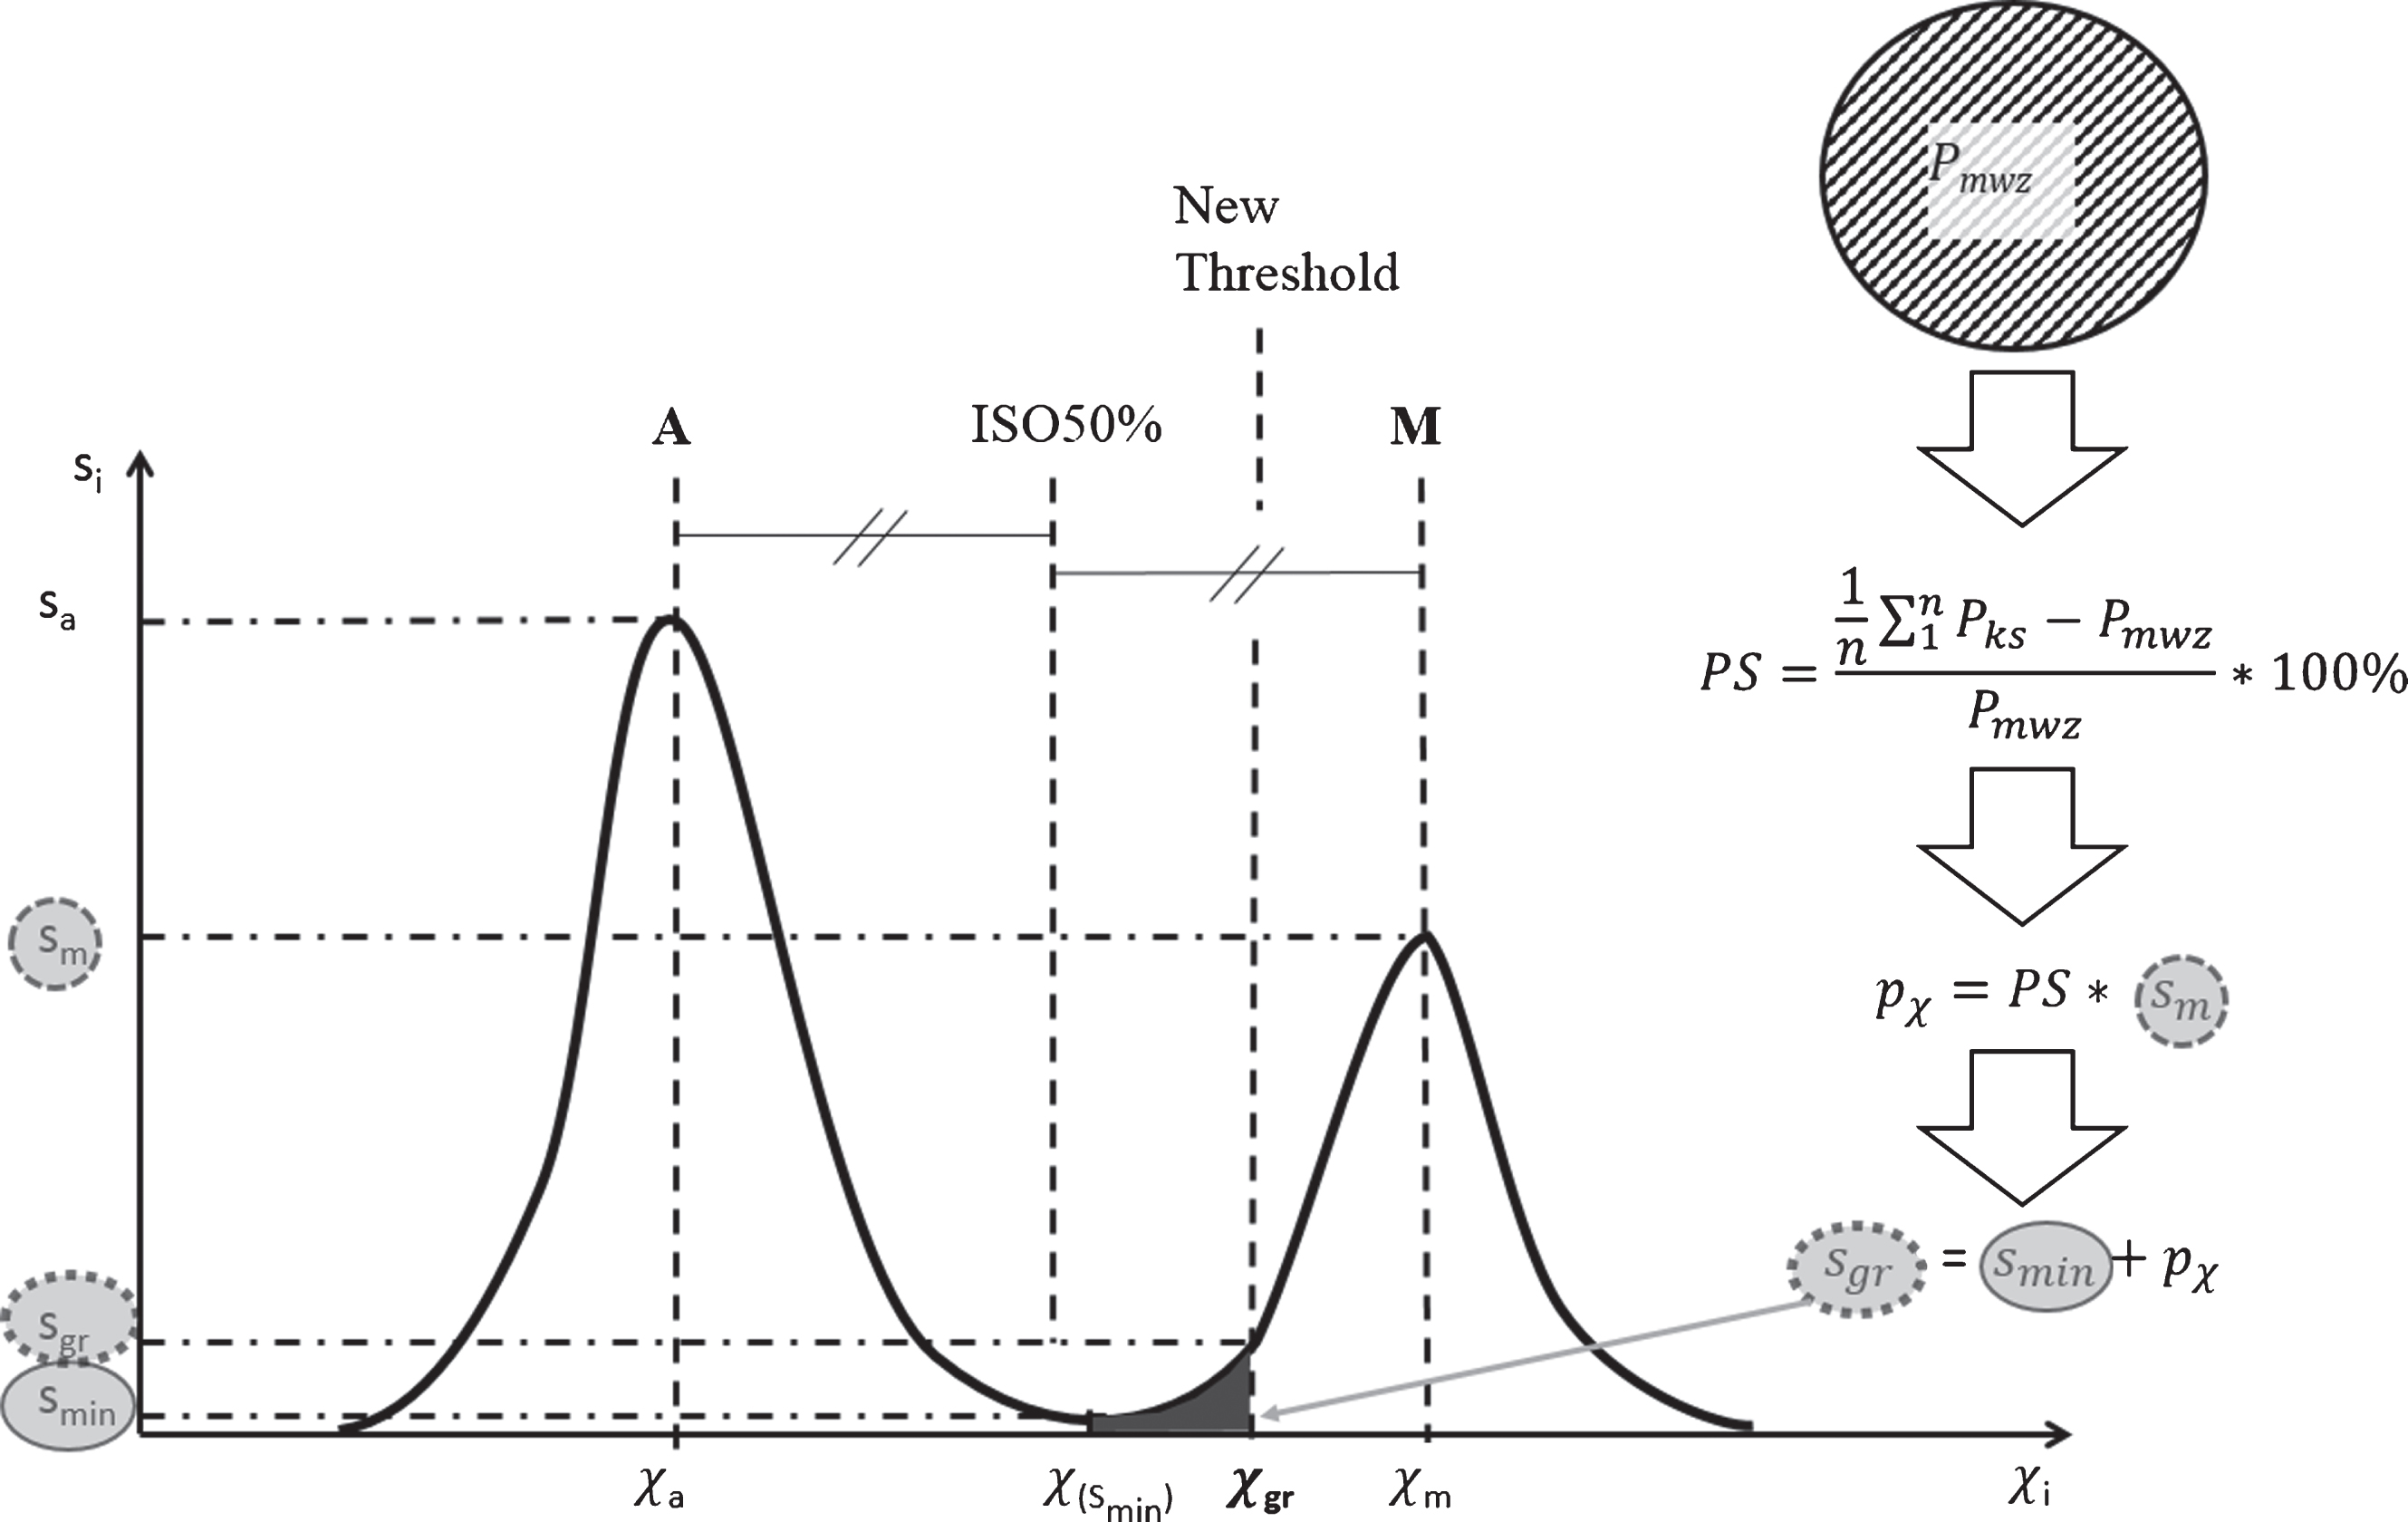
General diagram of the air-material threshold calibration method.
The new threshold value from the χ gr greyscale, which is the value of the threshold between material and air as presented in Fig. 1, is read for a s gr specific limit sum of voxels. The limit sum is achieved by adding s min to p χ correction.
The studies on accuracy of the tomographic measurements were performed using two types of gauges. These were workpieces of a specified volume of material and with defined values of linear dimensions. When volume gauges are used, the percentage errors of measurement of the volumes relative to the reference volume are determined. Volume measurements were made in VGStudio MAX 3.0. using the module named "Porosity/Inclusion Analysis Module”. For calculations, threshold values have been introduced in accordance with the ISO 50% algorithm and the developed method. To make it possible to determine the versatility of the developed method, it was necessary to carry out tests on several measuring devices - additional CT scanners. As in the comparative measurements between laboratories [18, 19] the measurement result of one device may not be reliable. It is also possible to compare measurements from different measuring devices [20]. Summary of the most important parameters of X-ray CT scanners are presented in Table 1. Comparative study of volume measurement of gauges were conducted at the following institutions:
AGH University of Science and Technology, Faculty of Physsics and Applied Computer Science – CT scanner phoenix nanotoms by General Electric equipped with transmission X-ray tube. Wrocław Technology Park – CT scanner XT H 225 ST by Nikon Metrology equipped with rotating X-ray tube. National Centre for Nuclear Research in Otwock – CT scanner XT H 225 ST by Nikon Metrology equipped with transmission X-ray tube. Military University of Technology, Faculty of Advanced Technologies and Chemistry – CT scanner XT H 225 ST by Nikon Metrology equipped with X-ray tube with reflection target. Warsaw University of Technology, Faculty of Mechatronics, Institute of Metrology and Biomedical Engineering – CT scanner METROTOM 800 by Carl Zeiss equipped with transmission X-ray tube.
In the study, volume workpieces consisting of reference balls made of the same material as the calibration sphere, arranged so that the thickness of the material was similar to the thickness of the reference sphere were used. A schematic diagram of the test workpiece and the results of measurement of gauge composed of 31 balls with a diameter of 1 mm are shown in [17]. The additional test workpieces was assembled of 10 and 17 spheres of 2 mm in diameter each (10/2 and 17/2 test workieces), made of silicon nitride ceramic (Si3N4). In the course of the studies, the percentage values of the measurement errors of the test workpiece were determined on the basis of the total volume of the constituent spheres. The results of measurement of volume workpieces are presented in Fig. 2.
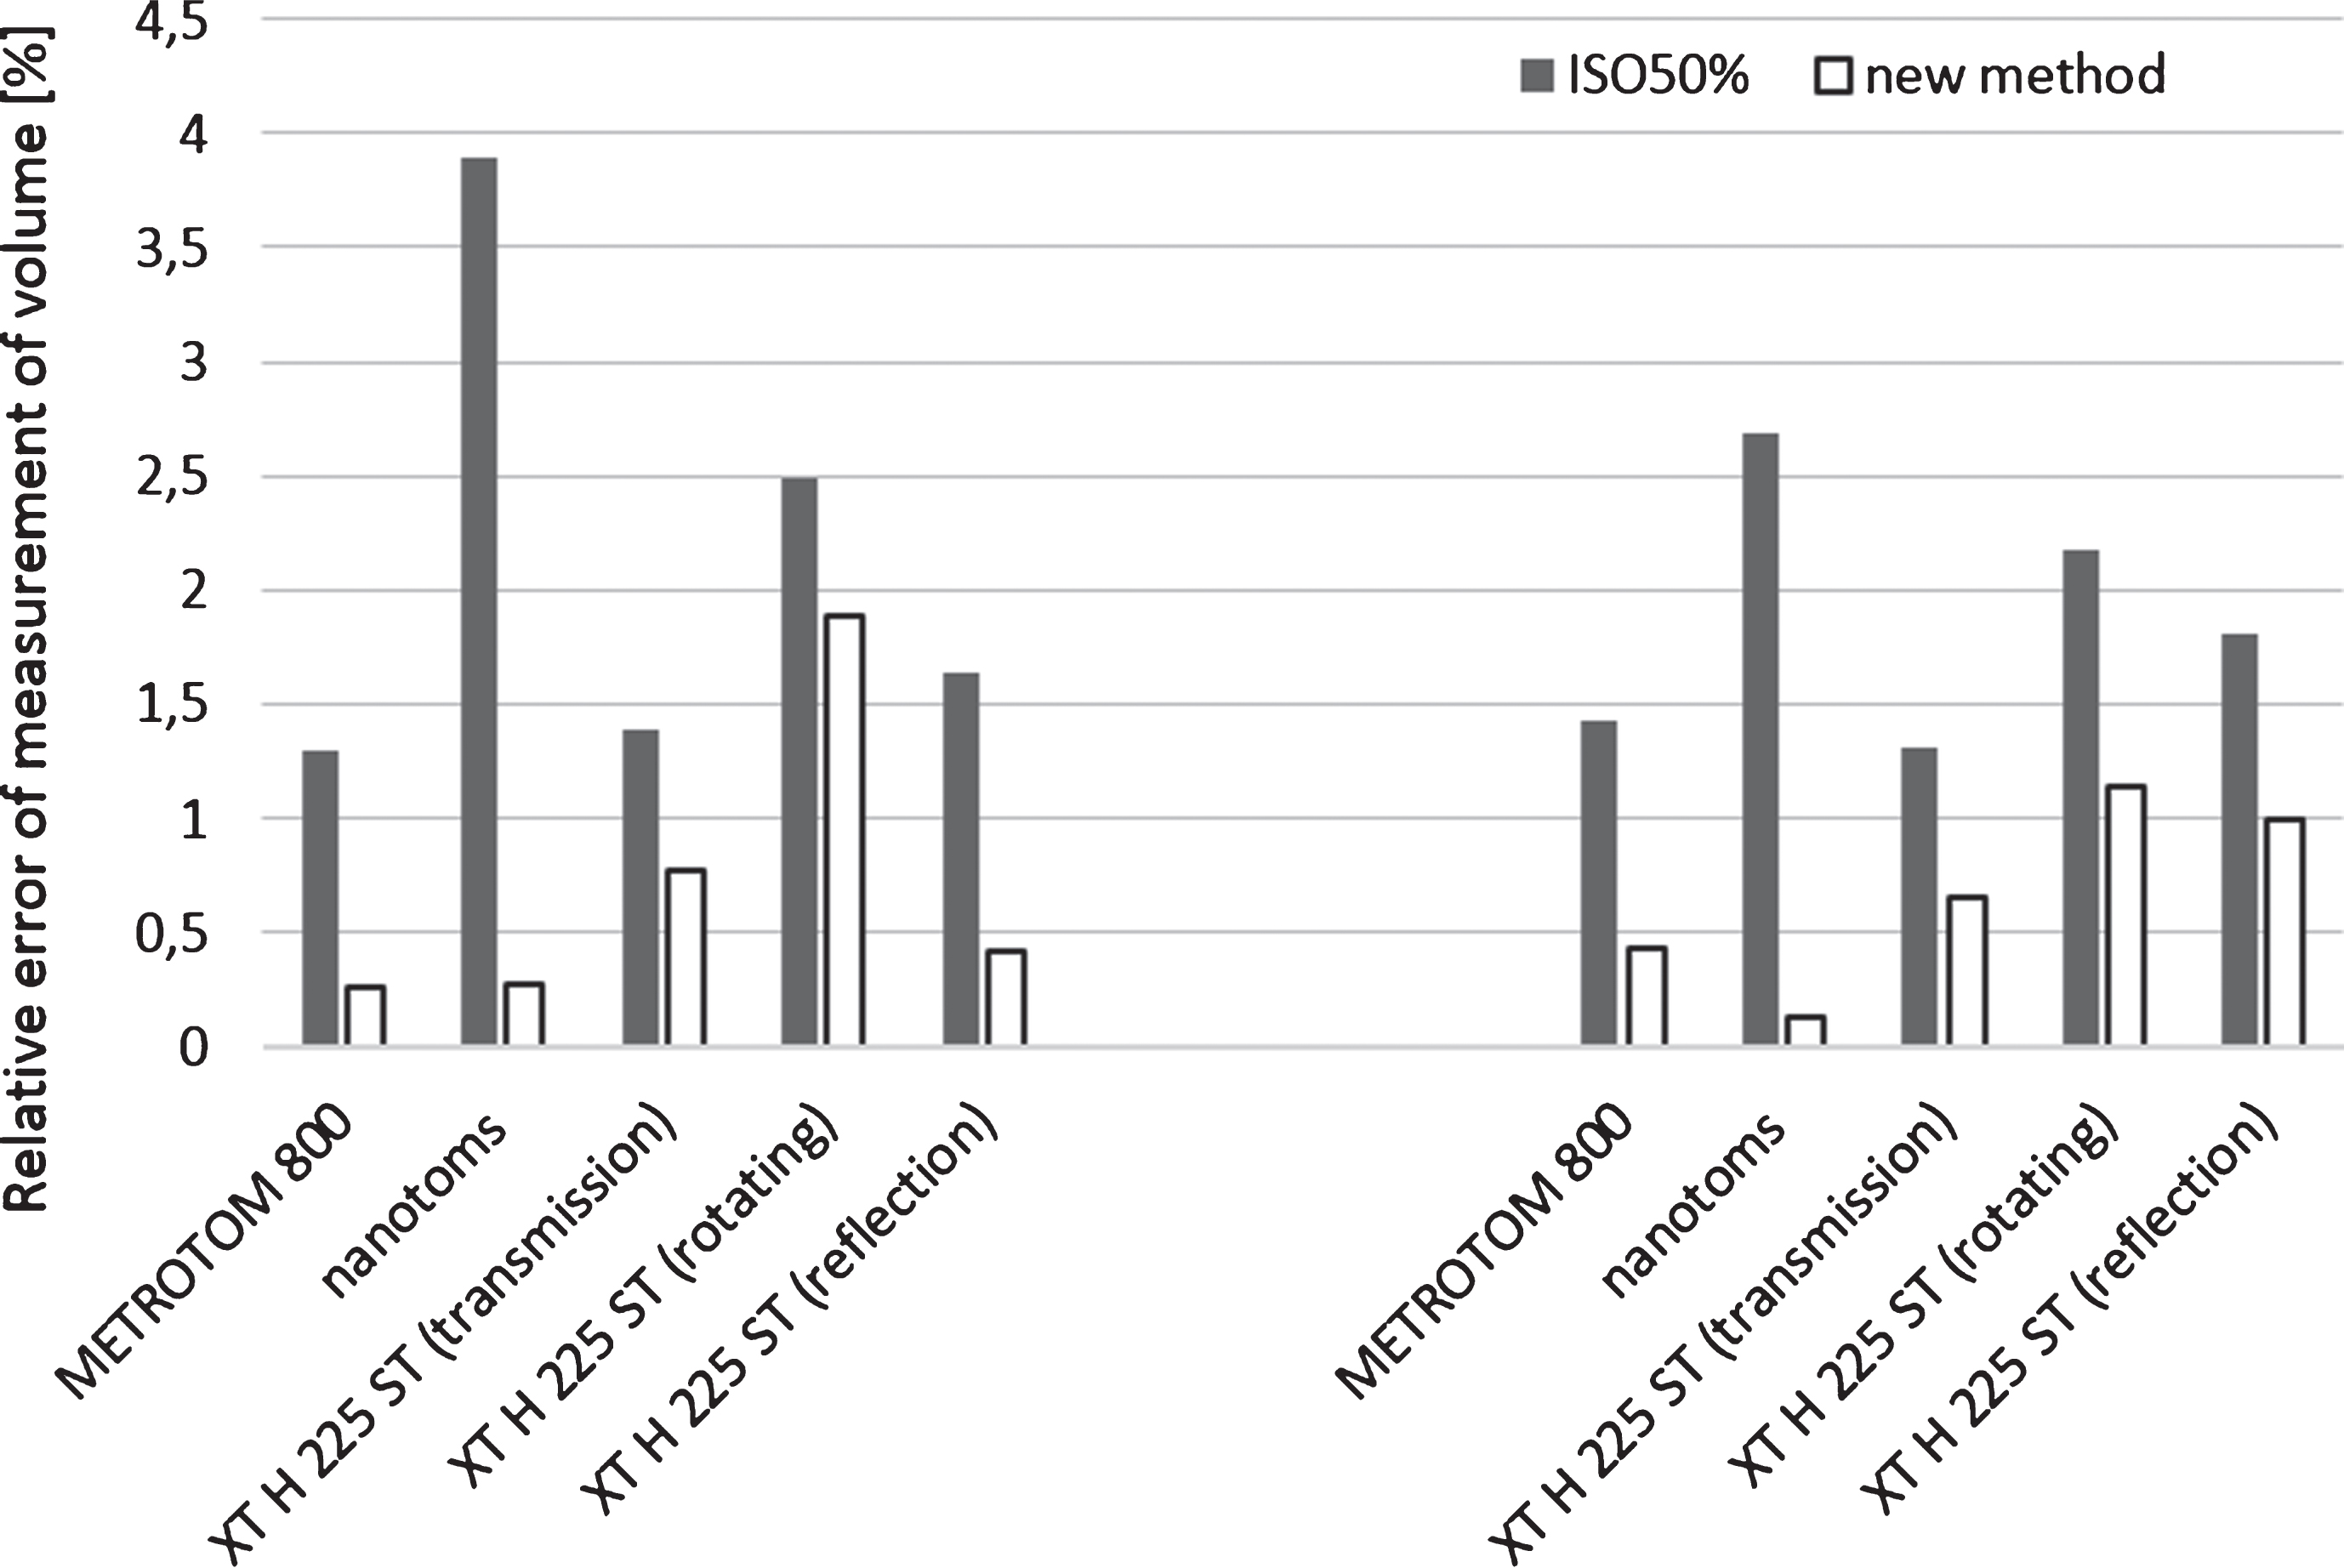
Relative errors of the volume measurement with the use of the new method for separating material and air in relation to the known ISO50% automated algorithm. On the left 10/2 and on the right 17/2 test workpieces.
The greatest improvement in the results was observed in the case of GE and Zeiss metrological CT scanners with transmission X-ray tubes. The percentage error values have decreased at least three times in the case of the METROTOM 800 and 10 times in the case of the nanotomes CT. For METROTOM 800 CT scanner reduction of error from 1,29 to 0,26% for 10/2 test workpiece and from 1,46 to 0,43% for 17/2 test workpiece. In the case of nanotomes error reduction from 3,89 to 0,27 and from 2,68 to 0,13%. These CT scanners are designed not only for defectoscopy but also for geometrical measurements. They have X-ray tubes with lower voltages and are able to detect more details from the reconstructed objects. Gauges, during measurements, were mounted on polystyrene foam. In the case of the Zeiss and GE CT scanners using the ISO50% algorithm, some parts of styrofoam were also detected on the reconstructions, which was included in the volume of the material.
CT scanners of Nikon Metrology (for which the tests are performed) are mainly used for defectoscopy, as they are not as sensitive as metrological CT scanners, hence lower value of the error reduction improvement was observed. In addition, they are less accurate, they generate more random errors during measurement and not all of them can be compensated using the developed method. Nikon CT scanners with transmission and reflection tubes have achieved about 2x reduction in errors, with a rotating target of around 30%.
The study showed increase in the accuracy of the measurement by applying the new method of setting the threshold value with respect to the automatic method ISO50%. Improvement in accuracy have been achieved for both volume measurement (on five CT scanners) and for the measurement of linear dimensions measured on a CT METROTOM 800. The measurements of linear dimensions were performed on test workpieces made of silicon nitride (cubes with a nominal length of side a = 2,5 mm and a measuring cylinder with a diameter of 3 mm and a length of 12 mm) and plastic NYLON analogous to the test workpiece of DELRIN, which measurement results are shown in [17] (cube consisting of 5 degrees H = 5 mm and L = 10 mm, cube width 30 mm). Comparison of the results of the error of measurement of linear dimensions of ceramic (Fig. 3) and NYLON (Fig. 4) test workpieces are presented on graphs.
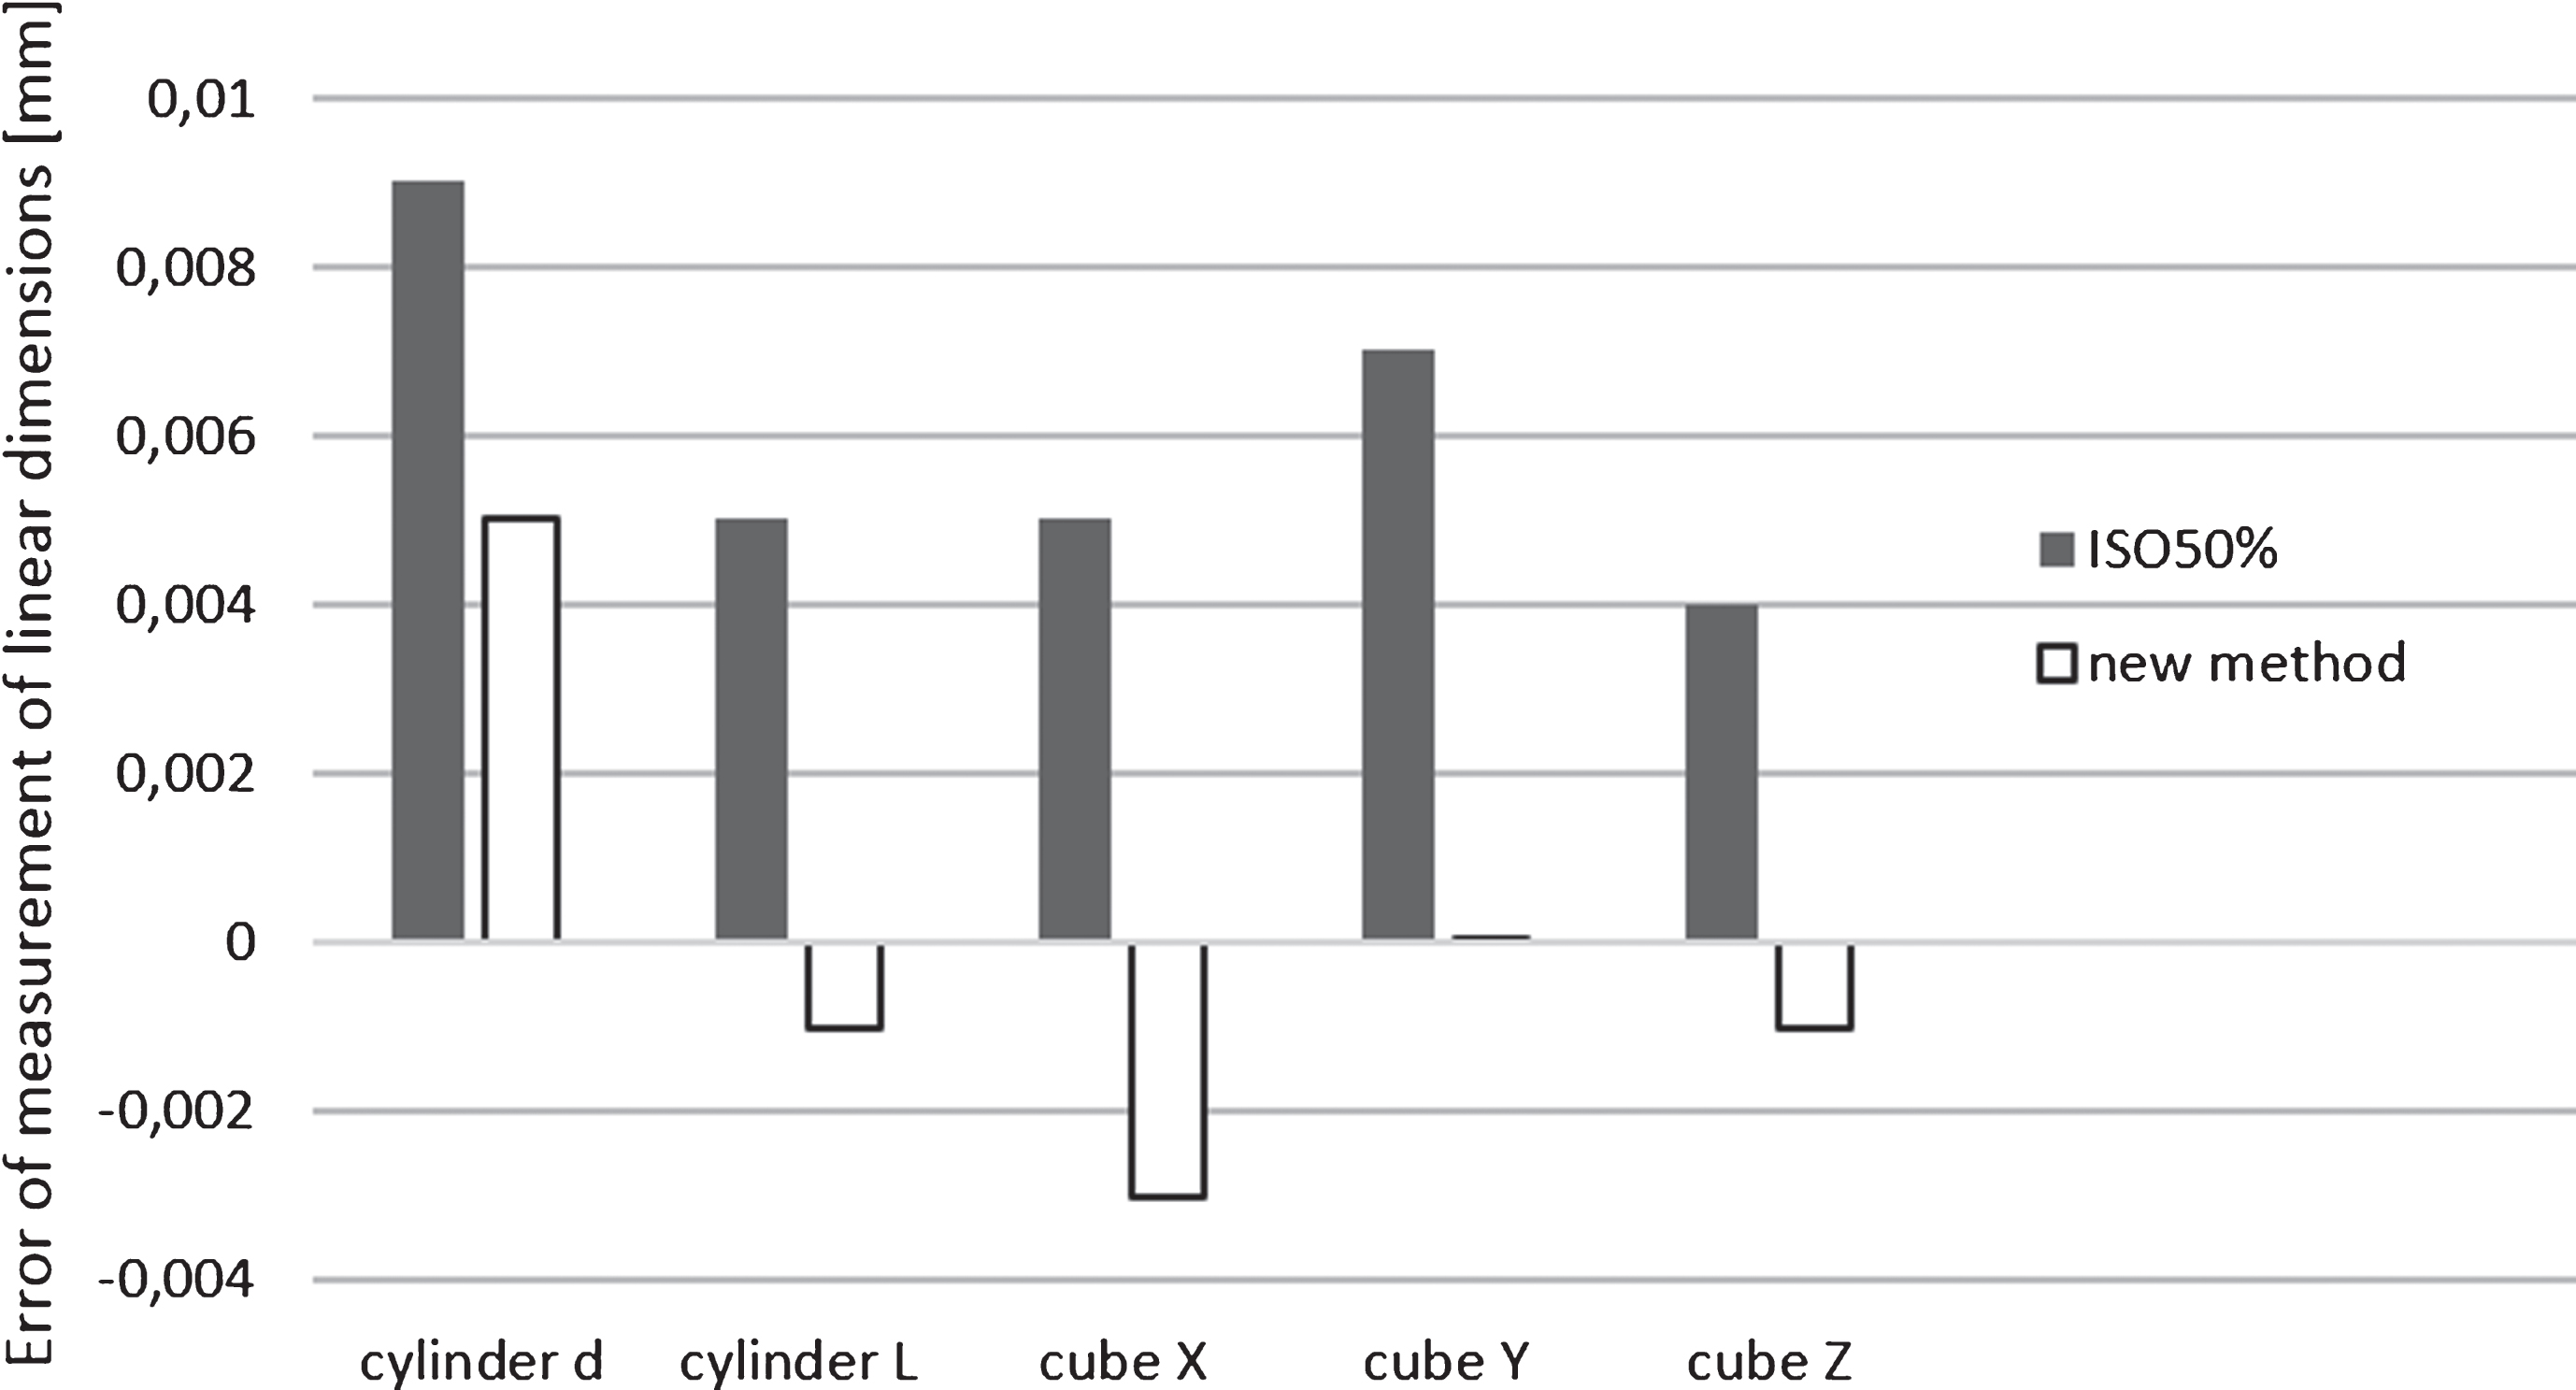
Errors of the linear dimensions with the use of a new method for separating material and air in relation to the known ISO50% automated algorithm for ceramic test workpieces.
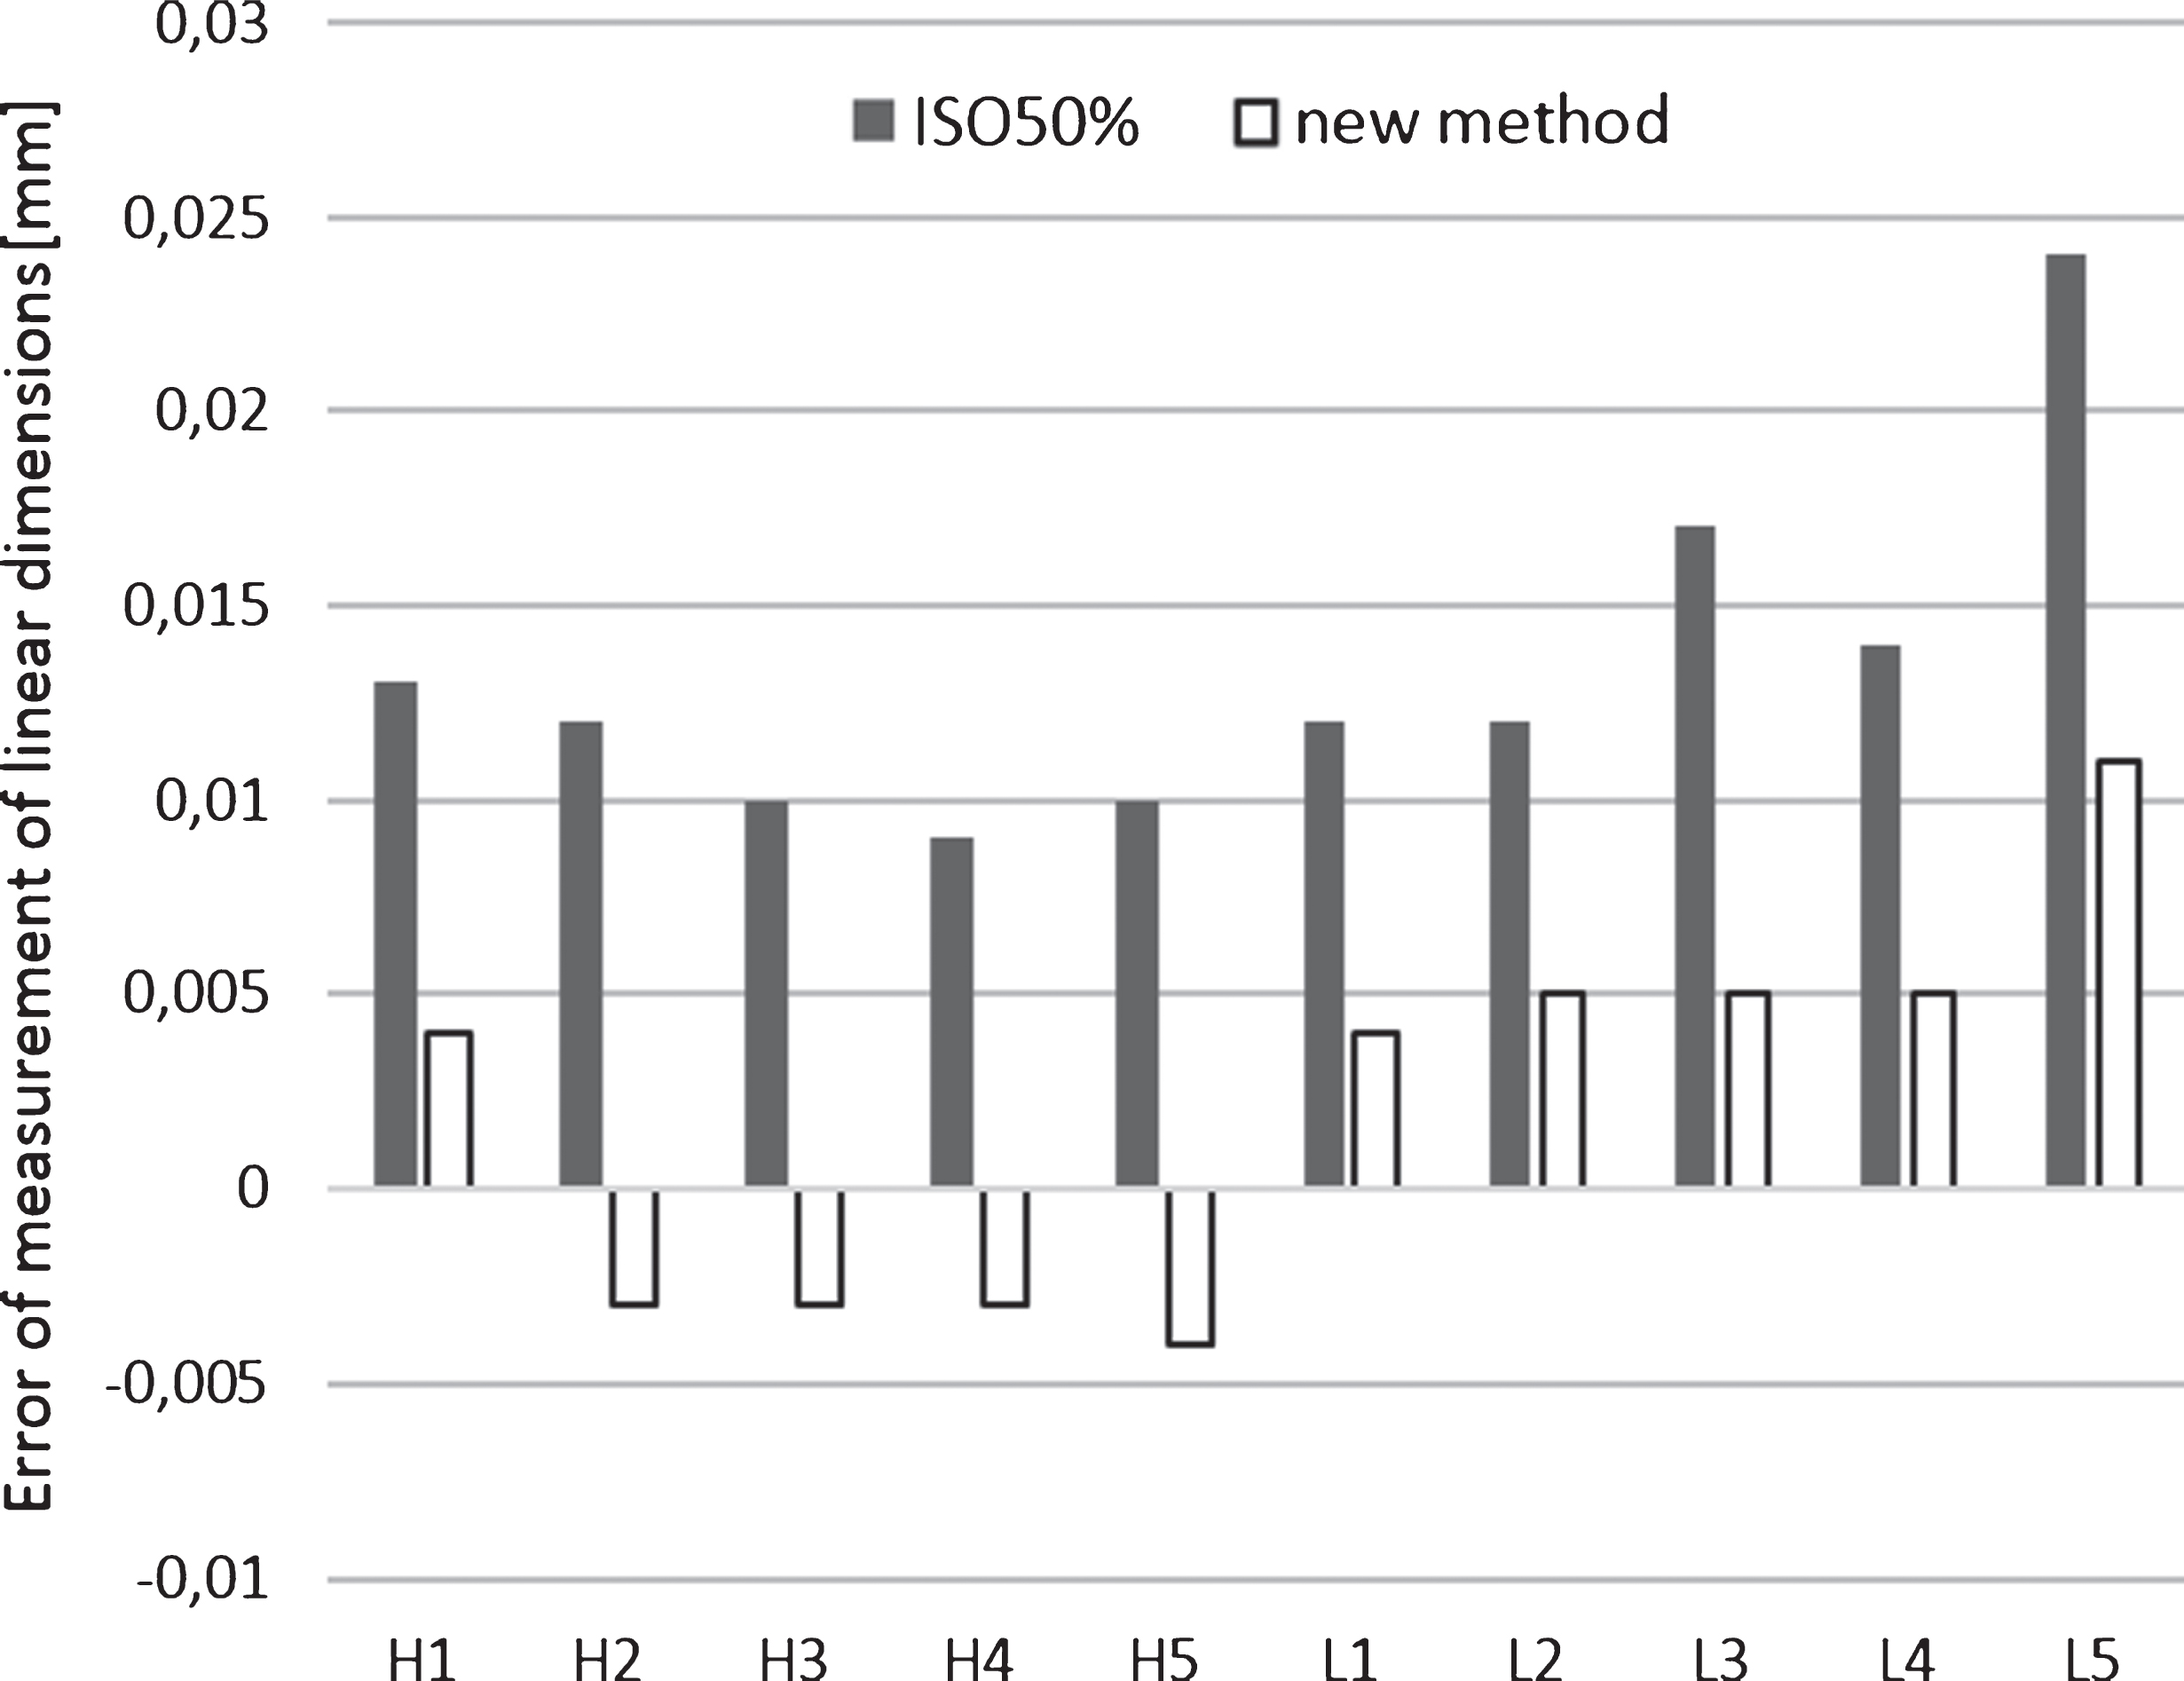
Errors of the linear dimensions with the use of a new method for separating material and air in relation to the known ISO50% automated algorithm for nylon test workpieces.
The results shown in the graphs show that in each analysed case applying the developed method reduces the value of errors of linear measurements. All results of linear dimension measurements in the case of an automatic algorithm ISO50% were higher than the reference values. After applying the new method the results are distributed evenly around the reference values (half deviations on + and half on –). All measured linear dimensions were greater than the reference values in the range of 4 to 24μm. The application of the new method resulted in an average 2-fold decrease of errors.
Summary of the most important parameters of X-ray CT scanners
The results obtained from the quantitative analysis were also verified by performing additional qualitative analysis. The correctness of the method can be verified by analysing a view of reconstruction of the measured object as well as the cross sections generated from the reconstructed object (visual assessment of noise in 3D reconstruction and cross-sections). A 3D reconstruction view of workpiece consisting of 10 balls of Ø 2 mm is shown in Fig. 5.
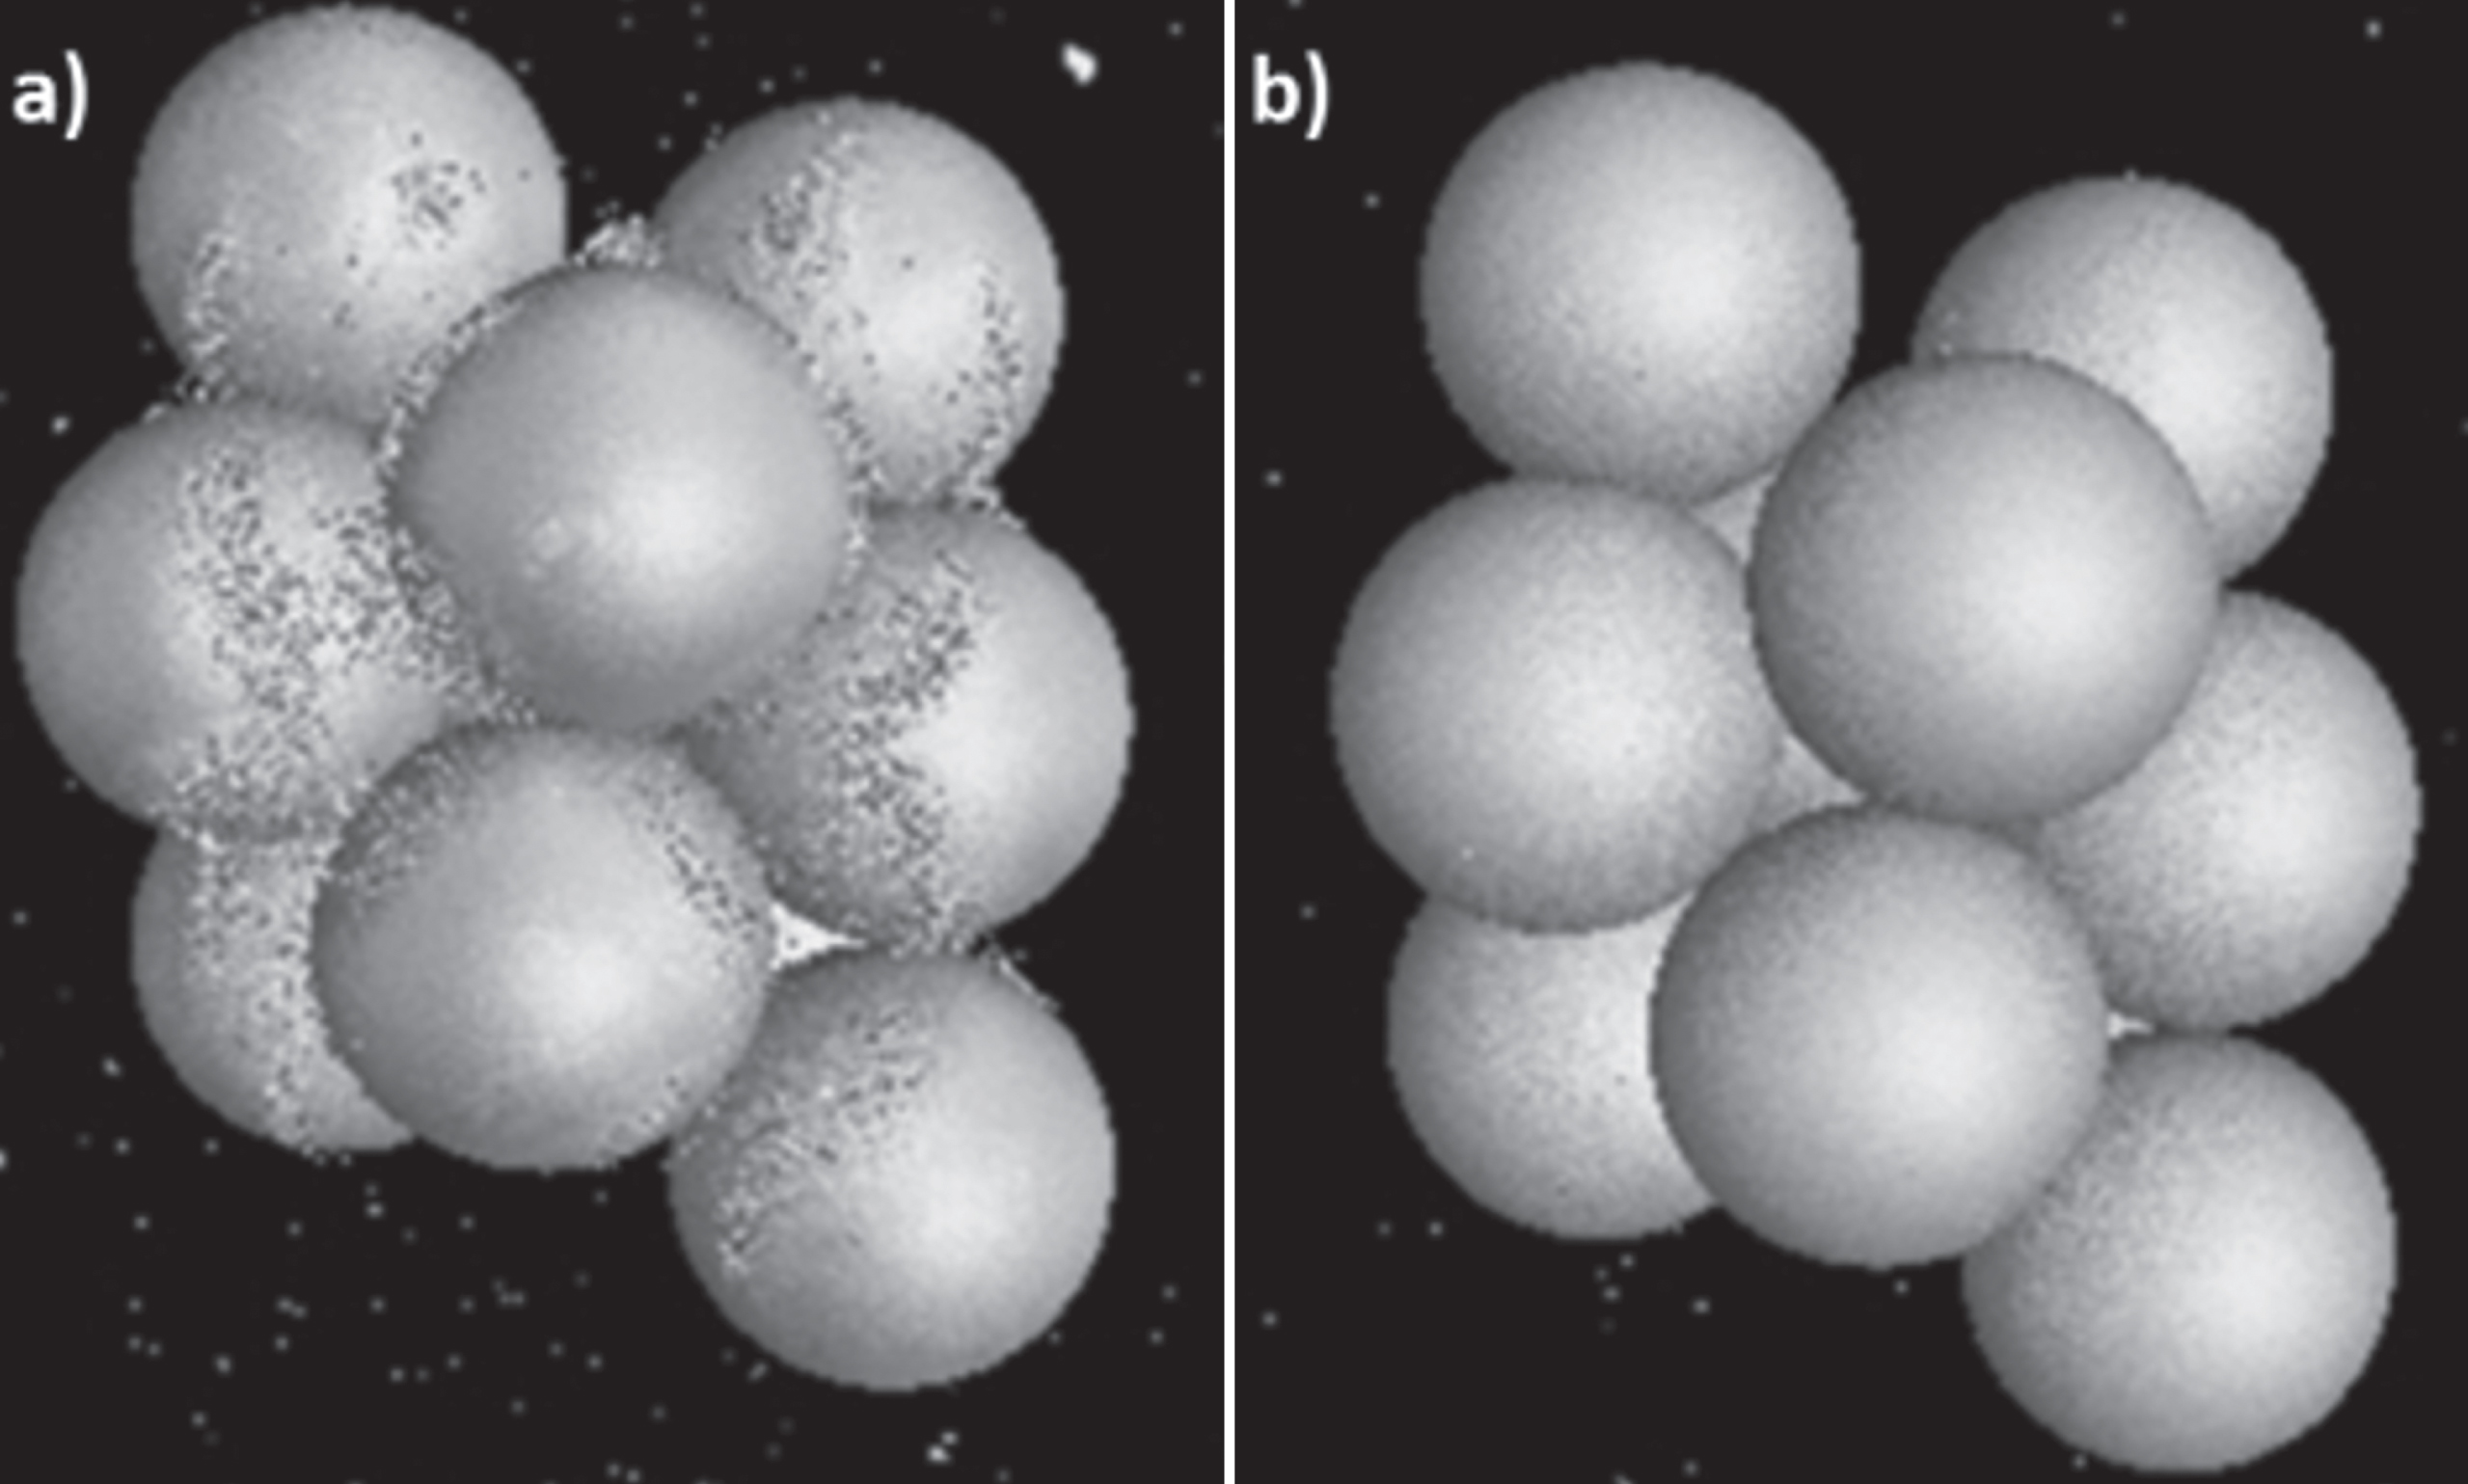
The CT reconstruction of the test workpiece 10/2 obtained with a use of METROTOM 800 CT scanner: a) with a use of ISO50% algorithm, b) with a use of a new method.
In the case of the use of automatic algorithm ISO50% for threshold value detection on the 3D reconstruction of the test workpiece, noise surrounding the object is visible (Fig. 5a). Some of the air surrounding the measuring element was incorrectly classified by the algorithm as a material. The change of threshold value (according to the newly developed method - reconstruction on the right side - Fig. 5b) resulted in removal of the noise surrounding the test workpiece.
When the threshold value is set too close to the peak corresponding to the material on the histogram, the material is partially removed from the 3D reconstruction of the object. For this reason, additional cross-section analysis was made. Figure 6 shows the cross-section views obtained for both algorithms - analysis of a test workpiece consisting of 10 balls with a diameter of 2 mm.

The cross-section view of the test workpiece 10/2 obtained with a use of METROTOM 800 CT scanner: a) with a use of ISO50% algorithm, b) with a use of a new method.
On the cross-section views, analogous results were observed as in the case of 3D reconstruction - noise visible around the object, while using the ISO 50% threshold detection algorithm (Fig. 6a). Analysis of cross-sections showed that changing the threshold value according to the new method does not remove the material inside the object (Fig. 6b). A use of this new method removes noise in the air mistakenly classified by the ISO 50% algorithm as material. The same dependence on 3D reconstructions and cross sections was observed on results obtained from other CT scanners as well as on other test workpieces.
The conducted studies indicated the increase in the accuracy of measurements by applying the developed method in relation to the ISO50% automated method. Improvement in accuracy was achieved for both measurements of volume test workpieces (on five CT scanners) and linear dimensions (on METROTOM 800). In the case of volumetric test workpieces, relative measurement errors were reduced by 3 to 10 times for metrological CT scanners and 50 to 30% for defectoscopy CT scanners. The use of volume gauges allows verification of the correctness of algorithms calculating e. g. porosity. In the case of linear dimension measurements, average measurement errors were reduced twice. The quantitative results were confirmed by quality analyses conducted on 3D visualizations and cross-sections of the analysed test workpieces. The studies confirmed the effectiveness of the developed method of setting the material-air threshold value.
The method of setting the threshold value has a significant impact on the accuracy of measurements in X-ray computed tomography. In the measurement accuracy studies, it is necessary to provide information on how the threshold value has been determined.
It is also reasonable to develop material-air threshold value detection methods further. The correctness of the newly developed methods should be checked both quantitatively and qualitatively using appropriate test workpieces.
Footnotes
Acknowledgments
The research has been co-funded from Ministry of Science and Higher Education in Poland decision no 5339/E-365/SPUB/2017/1.