
Abstract
Influence of x-ray pulse generated from gamma spectrometers should be eliminated in applications, which typically uses pulse shape techniques between gamma and x-ray pulses. In this study, we proposed and tested several algorithms aiming to eliminate this influence. The algorithms are based on curve fitting (CF), artificial neural network (ANN), system identification, peak shape, amplitude search with curve fitting and pulse tracking methods. Gamma pulses and X-ray pulses are detected by NaI(TI) scintillator detector and Silicon lithium Si(Li) detector, respectively. The developed algorithms are tested using 32,000 total instantaneous detector events of acquired gamma pulses and 65,536 total instantaneous detector events of x-ray source. An algorithm using the least square curve fitting method is applied for differentiation between gamma and x-ray pulses. ANN is employed as a classifier for identification of extracted spectrum and Bispectrum features of gamma and x-ray pulses. A comparison between identification results due to extracted spectrum and Bispectrum features is established. System identification algorithm is then built to determine the detection system response of each radiation pulse, which includes various models to attain best fitting. These models are Auto-regressive model with external input (ARX), the linear parametric model (IV) and process models (P1D). The peak shape algorithm is also tried, which depends on the individual classification of pulse width. The amplitude search with curve fitting algorithm is implemented. Moreover, the pulse tracking algorithm is investigated for PSD between gamma and x-ray pulses. The maximum peak of contaminated pulse is tracked using a suggested peak search method. Then, pulse position is estimated using matrix method. Comparison between these algorithms is conducted based on the evaluation of light of residuals, fitting error and processing time. The results confirm that peak shape algorithm is the best one from computational speed point of view, while ANN algorithm using Bispectrum feature extraction method is the most appropriate one that yields 100% accuracy over noisy environment with longer processing time. In addition, the system identification algorithm is the optimal algorithm that achieves zero fitting error under clean environment. These proposed algorithms for PSD between gamma and x-ray pulses lead to design efficient spectrometers with optimal applicability in various environments.
Introduction
The discrimination between various types of radiation events has been raised in a variety of scientific applications [1, 2]. Identification of radiation pulse depends on pulse shape discrimination (PSD) [3]. It is the major method applied for recognition and detection of ionizing radiation in presence of other background radiation. PSD technique guarantees the recognition and discrimination among different types of ionizing radiation within specific scintillator detectors that characterized by scintillation decay [4]. On other hand, certain scintillator detectors provide useful information about pulse shape parameters of high energy radiation that incident on detectors surface. This phenomena is called PSD [5].
This phenomena depends on discrimination between scintillation signals [6, 7] by stimulation of electrons within scintillators [8]. The differentiation between pulse shapes is equivalent to the presence of various decays in the emitted fluorescence [9]. Specific scintillator detectors have little recognition for some ionizing radiation compared to other rays. This principle allows the differentiation between both rays [10]. Moreover, PSD is used for showing the emitted radiation pulse details from gamma, neutron, beta and alpha [11].
PSDs have wide spread applications like spectrometry instrumentations, reactor instrumentation, dosimetry, international safe guards [12], nuclear material control, nuclear nonproliferation, material science and national security [1, 14]. The variation between PSD techniques is classified according to determination of decay time of each pulse, integration process of pulse charge within all time periods and pulse shape analysis [3, 15]. Hence, many PSD processes are available in the literature [14] such as charge integration and zero-crossing technique [14, 17].
Analoge and digital systems are utilized for implementations of PSD methods [16]. Digital systems show much efficient and accurate representations of pulse analysis compared to analoge systems. Also, the digital systems have the advantages of multi-parameters estimation and analysis, better performance, higher throughput, hardware reduction, computer aided operation and higher reliability [18]. PSD process can be done by two different ways using phoswich and one crystal characterized with multi decay times that corresponding to radiation type [6]. Phoswich detector includes different layers with various decay times that connected to photomultipliers (PMTs) [19]. It has the advantage of detecting much lower energy and intensity of x-ray or gamma within background environment [19]. Additionally, it can be used for pulse recognition in medical imaging and astronomy applications for differentiations between x-ray and gamma pulses [19].
The principle of pulse discrimination between x-ray and gamma pulses is presented in the literature in [20]. I. Mazumdar et al. [20] introduced analysis for pulse shape utilizing zero-crossover method for differentiation between x-ray and gamma pulses [20]. Also, S. V. Damle et al. [19] employed the NaI(Tl)/CsI(Na) phoswich detector for elimination of non x-ray pulses [19]. Conventional PMT can be employed for pulse discrimination purposes. It can be used for measurements and discern time decays of pulses. But, PMT have several shortcomings that limit their widespread applications such as large size, lower sensitivity [21] and noises.
PSD can be employed for recognitions of background pulses [22]. But, the differentiation between various radiation types is a challenge due to pulse misclassification at lower energy. While working spectrometry for gamma, the influence of x-ray should be eliminated. Gamma detectors may detect lower energy deposited on its surface such as x-ray photons. This much lower energy may affect on the detection performance of gamma detection applications such as spectrometry, medical and space applications. This stimulates the need for efficient PSD algorithms. The discrimination of γ-ray and x-ray pulses is important due to the way of deposited energy and interaction of each with matter.
Gamma and x-ray pulses are described by much difference in their energies. So, they have diverse shape in their raw data. The amplitude in voltage of gamma pulse is much higher than voltage amplitude of x-ray pulse [23, 24]. Significant applications of gamma and x-ray pulses are needed for counting impinging photons and performing efficient measurements of deposited energy [25]. These applications use robust detection systems. The utilization of PSD methods depend on developments of analoge to digital converters (ADC) and digital processors for achievement of these methods on field programmable gate array (FPGA) technology [16]. Therefore, different algorithms for PSD between gamma and x-ray pulse are implemented in this manuscript. This paper is arranged as: Section 2 introduces the systems components. Section 3 summarizes the proposed algorithms. The results are presented in Section 4. A comparison between implemented algorithms is stated in Section (5). Section 6 is devoted to a conclusion of this work.
System components
Digital implementations for radiation detection and data acquisition systems (DAS) [12, 26] are the aim of significant research. In this work, different systems for gamma and x-ray are used to study the behaviour of each pulse separately. Then, the developed algorithms will be applied for the outcome of these systems for gamma or x-ray. The system components are presented. Detectors for detecting both gamma ray and x-ray using the same electronics combined with different scintillators are essential. On other hand, the data are collected from separate gamma and x-ray detection systems due to lack of phoswich detectors. However, the idea and algorithms are still can be applied. Gamma pulses from 137Cs point source with manufactured activity of 1μCi are detected. NaI(TI) scintillator detector is utilized for pulse detections. This scintillator detector has a length of 20.5 cm, length of sensitive section 6.6 cm and the diameter of the detector is 3.6 cm. This detector is made by nucleus incorporation. This pulse is directed to a preamplifier stage in order to be converted to a voltage pulse. This preamplifier within a NIM module has variable fine gain of 0.5–1.5 and coarse gain of 500–2K. The pulse is digitized by a sampling ADC with sampling rate of 100 ns time interval. This ADC has 12 bit with 5 V range. Each 1 bit corresponds to 0.00122 V/bit. Accordingly, the acquired signal has 32000 samples that stored on a personal computer (PC) to be analyzed.
The ADC is a model supplied by international atomic energy authority (IAEA) to their training fellows in their training on nuclear instrumentations. This DAS for gamma detection pulse is illustrated in Fig. 1(a). On other hand, the experimental x-ray files are provided by CRNB/COMENA. The x-ray pulse from 55Fe is detected by Silicon lithium Si(Li) detector that represents the first stage in DAS. It is cooled using Nitrogen. The next stages include shaper amplifier and ADC. This ADC has a resolution of 12 bits with sampling rate of 5 MHz. The signal is acquired through a PC with Intel core TMi5-3470 CPU and 3.20 GHz. The DAS for x-ray detection pulse is depicted in Fig. 1 (b). The captured gamma and provided x-ray pulses are combined instantaneously to each other. These detected pulses are variation of voltage for each radiation type with time. The obtained contaminated signal represents the mixing between instantaneous values of gamma and x-ray pulses.
Data acquisition system (DAS) of a) Gamma radiation pulses from 137Cs b) X-ray radiation pulses from 55Fe
The developed discrimination algorithms extract main differences between x-ray and gamma pulse shapes like spectrum features and pulse parameters. Robust detection systems are significant for x-ray and gamma ray applications. These systems can be used to count incident photon to achieve efficient measurements of photon energy [25].
Pulse shape discrimination algorithm using LSCF method
Curve fitting (CF) has been widely applied [27] to x-ray and gamma isotope determination by using radiation detectors [28]. For gamma pulse shaping, CF algorithm is presented. It is conducted to simulate the real 137Cs pulse as demonstrated in Fig. 2. A least square fitting method is used with x-ray and gamma data for pulse shape discrimination [29]. Consequently, the least square curve fitting method (LSCF) is applied on the real pulse to estimate its shape.
Pulse shape discrimination algorithm between gamma and x-ray pulses using LSCF method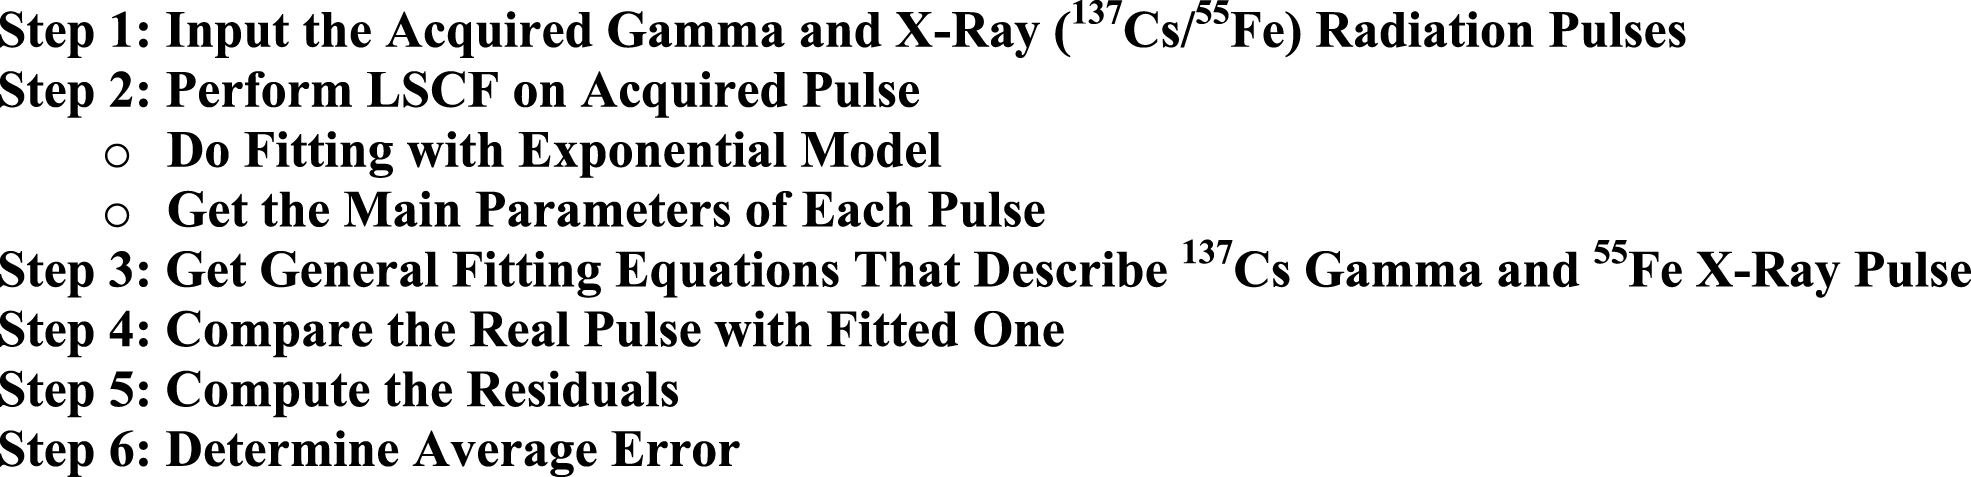
An algorithm for pulse shape discrimination using CF method is illustrated in Fig. 2. The acquired 137Cs pulse is fitted by least square method. Each input pulse is fitted by LSCF method. The pulse is accounted as gamma pulse as well as it resembles exponential behaviour. Otherwise it is assumed to be x-ray pulse. Then, the real and fitted pulses are compared. Moreover, the average percentage error for each radiation pulse is introduced.
Here, the artificial neural network (ANN) is used to discriminate gamma pulses from x-ray pulses. Therefore, a PSD algorithm is shown in Fig. 3. The gamma and x-ray pulses are individually detected by their corresponding DAS. The ANN is used for training of 40 137Cs gamma pulses. The trained data are saved in a database system. Similarly, the ANN is employed for training a collection of 40 55Fe x-ray pulses. The trained pulses are saved in a data base system. Then, ANN as a classifier is used to determine to which group the tested pulse. Thus, the gamma pulses are accumulated to each other. Consequently, both gamma and x-ray pulses are separated from each other. The accuracy of the underlined algorithm depends on the feature extraction from their power spectrum and Bispectrum. The main strength of power spectral and Bispectrum originated from the fact that they are robust against noise. So, they introduce efficient results for PSD between gamma and x-ray pulses.
The proposed PSD algorithm between x-ray and gamma pulses using ANNs.
The ANNs are utilized for automatic pulse identification system. It is a feature matching process between features of input pulse and accumulated features saved in the database [30]. ANNs are continuously employed for feature matching. Additionally, a multilayer perceptron neural network (MLP) [31] consists of input layer, single hidden layer and output layer that depicted in Fig. 4 [30, 32]. Any neuron in ANN is described by its bias and activation function. However, any connection between two neurons is characterized by weight factor. Therefore, the ANN is called a supervised network [30]. Here, the input and output neurons have linear activation functions. But, hidden neurons are characterized by sigmoid activation functions. Hence, the neural network output vector, Φ, can be described by

Estimation of power spectrum is the main fundamental tool applied in digital signal processing [33]. The signal spectrum is the power density spectrum of signal. The infinite energy signals are characterized by their spectrum rather than Fourier transform (FT). However, the signal spectrum is classified into non-parametric, parametric and Eigen analysis methods [34]. The nonparametric includes Blackman with Tukey, Welch and Periodogram methods [35]. The periodogram of the signal is given by [34, 36]
Eigen analysis is divided into two different subspaces using the division of eigenvectors and Eigen values of autocorrelation matrix. These signal subspace contains principle eigenvectors associated with the largest Eigen values. Also, the noise subspace is described by smallest Eigen values. The recovery of noisy signal into signal and noise subspaces represents the basis of the Eigen methods. This method is described in [34]. Therefore, the power spectrum can be estimated by
Pulse shape discrimination algorithm using ANN for extracted spectrum features.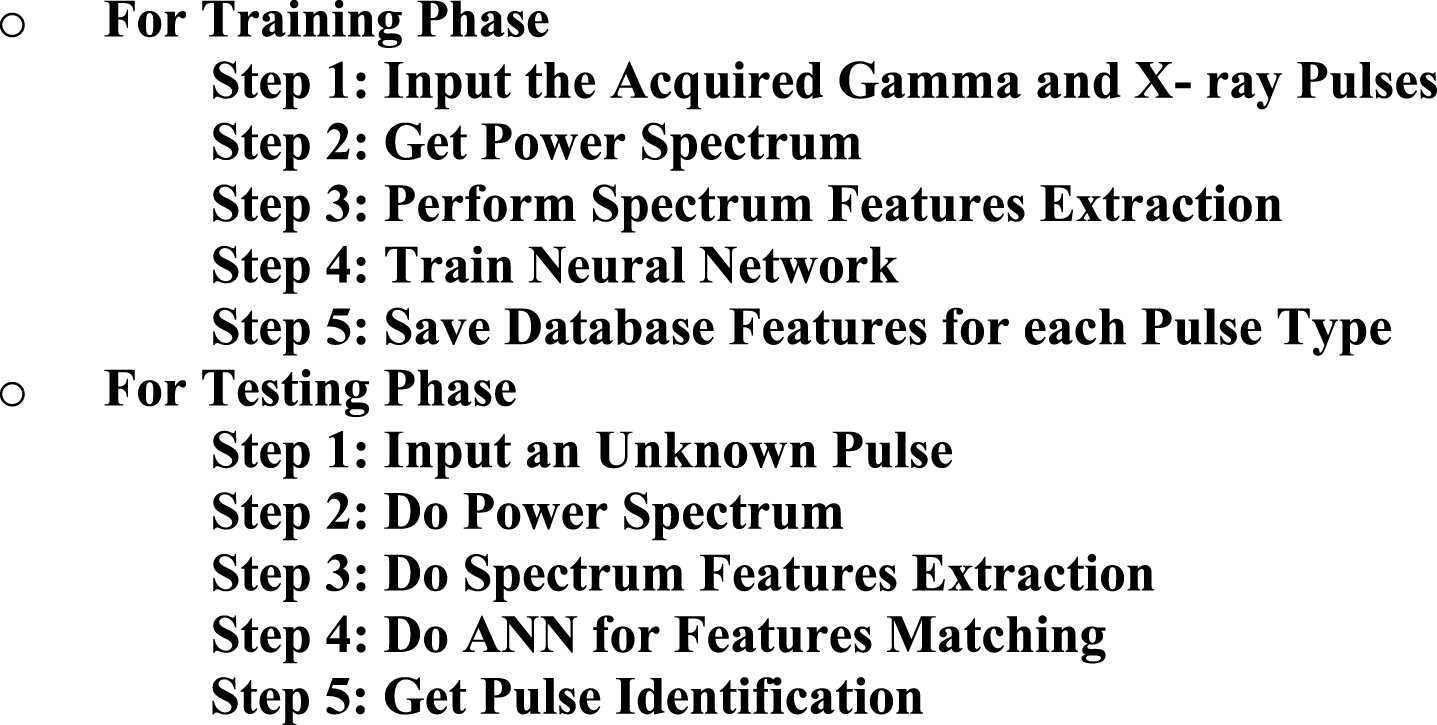
The 137Cs/55Fe pulse is corrupted by the addition of different noises. These noises are white Gaussian noise, Rayleigh Noise, Rician Noise, white Gaussian noise with Rician, Rayleigh with Rician and white Gaussian noise with Rayleigh and Rician noise. Finally, the ANN is employed for feature matching to decide whether these features belong to 137Cs gamma pulse or 55Fe x-ray pulse.
Bispectrum analysis is a well established signal analysis technique with many applications in engineering [37, 38]. Two chief approaches are applied for estimation of Bispectrum. These are conventional and parametric models. These approaches are divided into autoregressive moving average (ARMA), moving average (MA) and autoregressive (AR). The AR is appropriate for representing spectra with narrow peaks.
Bispectrum analysis is significant for detecting deviation from Gaussian process as well as investigating nonlinear interaction between two peaks [39]. It offers promise for analysis of underlined radiation peaks by exploiting two particular characteristics [40]. The Bispectrum is approximated to zero for Gaussian noise and flat for non-Gaussian white noise. The Bispectrum is peaked at frequency pairs. It is an appropriate method for processing complicated signals [40]. The Bispectrum of signal is the FT of the third order correlation [41]. They may be classified into direct and indirect classes. The properties of Bispectrum are described by the symmetry that stated as [41].
This transfer function is assumed to have an inherent all-pass factor. Since, the root of B(z) lies at 1/z0 (z0 denotes the root of A(z)). The cross Bispectrum is given by [41]
Pulse shape discrimination algorithm using ANN for extracted Bispectrum features.
The system identification is carried out according to a sequence of procedures in [42]. One of these sequences is the coefficients of the linear models that identified using different techniques on the basis of generated and measured sequences [42]. Here, the detection system response is analyzed through system identification algorithm. This algorithm is demonstrated in Fig. 7. Various models are used to describe the dynamic models behaviours; Auto-regressive model with external input (ARX), the linear parametric model (IV) and process models (P1D). The nonlinear ARX models describe nonlinear structures using a combination with linear and non-linear blocks. These non-linear and linear models are function of regressors variables. The system identification method product computes regressors by performing transformations of the measured input u(t) and output y(t) pulses based on the model order that specified. The pulses entering the system are defined.
Pulse shape discrimination algorithm using identification black box system for both gamma and x-ray pulses.
Our interest lies in single-input single-output (SISO) systems. These systems can be described by ARX112, ARX113 and IV112 models. The IV models are similar to ARX model. But, the main difference is that the IV model is not sensitive to the colour of the noise term in the model equation. These parametric models are described by
Also, A(q–1) can be characterized as a matrix of the form
These polynomials for ARX112 model are rewritten as
Also, these equations are used to describe IV112 model that stated as
Our concern is to determine the system transfer function that described by [43]
Hence, the transfer function of ARX113, ARX112 and IV112 are respectively deduced as
Moreover, another model is used to identify the detection system of gamma pulse. This model depends on a multiple input single output (MISO). It is called P1D model. The transfer function of this process model is described by
The value of real time constants is noticed to be much large for multiple input models. This value is observed to be 1.0443×10⁹ with a loss function of 3.08149 ’×10–32 and final prediction error (FPE) for estimated model of 6.16298×10⁻³².
An algorithm for pulse width calibration is introduced. This algorithm aims to analysis of complex nonlinear peak signal into its basic parts by signal optimization. This algorithm has the advantage of Gaussian fitting any number of peaks. It achieves least square fitting of a Gaussian peak to radiation signal. Therefore, the pulse area and height can be detected with high accuracy. The estimated pulse width (Ψ) is obtained by [44]
The pulse shape discrimination algorithm using peak shape method.
An algorithm for pulse shape discrimination between gamma and x-ray pulses using amplitude search with curve fitting is presented in Fig. 9. This algorithm is divided into two dependent steps. Firstly, the least square curve fitting method is applied to determine the parameters of each individual pulse (gamma pulse and x-ray pulse). The peak amplitude of analyzed gamma pulse is assigned to A1. Also, the peak amplitude of x-ray pulse is equal to A2. The obtained fitting equation is rewritten as
Pulse shape discrimination algorithm using curve fitting with amplitude search method.
This detected peak is registered as gamma pulse if it is greater than A2 and lower than A1 (A2<Peak<A1). However, it is registered as x-ray pulse if the detected peak is between 0 and below A2 (0 < Peak<A2). This proposed PSD algorithm with curve fitting method and amplitude search is shown in Fig. 9.
Here, an algorithm depends on pulse tracking parameters for PSD is proposed. This algorithm uses fourth dependent steps. Firstly, a calibration for gamma pulses using 137Cs radiation source is made to determine the pulse parameters such as peak amplitude (P1), position and width. Therefore, a lot of radiation pulses are tested. This step helps us to localize the maximum peak of tested radiation pulses. Also, a calibration for the 55Fe x-ray pulses is performed to determine the peak amplitude (P2), peak position and width. The second step depends on the first one. A peak search routine is carried out to track the amplitude of contaminated pulse. The goal of the third step is to determine the position of maximum detected peak. All nonzero elements of the contaminated pulse are determined. Then, the linear indices of those elements are saved in an array.
An empty array is obtained as well as the pulse contains no nonzero elements. Thus, the position of maximum amplitude is presented. Then, the corresponding amplitude of each pulse position is determined. Finally, this detected peak is registered as an x-ray pulse as well as this peak is equal or lower than the maximum peak of calibrated x-ray pulse (P2). However, it is registered as gamma pulse as the detected peak is larger than maximum amplitude of x-ray pulse (P2). Moreover, accuracy of this algorithm is computed. This algorithm for PSD is developed and depicted in Fig. 10.
The pulse shape discrimination algorithm using pulse tracking parameters method.
PSD results using LSCF method
The LSCF method is applied for PSD between gamma and x-ray pulses. Also, it is significant for comparison purposes with other proposed algorithms. The 137Cs pulse is described by the next fitting equation.
The real 137Cs gamma pulse and resultant fitting pulse by LSCF method. The real 55Fe x-ray pulse and resultant fitting pulse by LSCF method. The estimated gamma and x-ray pulses parameters by LSCF method

The best average recognition rate (%) for both 137Cs gamma and 55Fe x-ray pulses under different noise degradations
The best average recognition rate (%) for both 137Cs gamma and 55Fe x-ray pulses under different noise degradations
It is noted that the best extracted spectrum feature method from 137Cs source depends on noise degradation. However, the Bispectrum ARMA synthetics fulfill highest recognition rate of 100% under all types of noise degradation. As a last point of observation, the ARMA synthetics and cumulates of ARMA processes give average recognition rate of 100% under Gaussian noise degradation for 55Fe pulse. However, the ARMA synthetics introduce 100% recognition under Rayleigh noise degradation at all variations of noise variance. So, the extracted features from Bispectrum achieve best identification compared to that extracted from spectrum.
The real 137Cs pulse is compared with the output of the underlined four models as depicted in Fig. 13. The obtained results confirm that output pulse of P1D model is identical to that of real 137Cs pulse with fitting accuracy of 100%. It introduces efficient results compared to other models. Therefore, the real 137Cs pulse can be described by a P1D model. Moreover, a comparison between these models is presented in Table 3. The P1D model introduces the best fit with 100% recognition. The best fit formula is characterized by
Comparison between real 137Cs pulse and obtained fitting pulse by linear parametric and process models. Comparison between parametric and process models for detection system description of 137Cs gamma pulse
Since, η is given by
For x-ray pulse, two models are applied on the acquired 55Fe pulse for estimation of the detection system response. An algorithm is presented in Fig. 7 to identify the PSD. These models are ARX213 and P1D1Z. The transfer function of ARX213 parametric model is introduced as follows
However, the transfer function of P1D1Z model is estimated to be
Comparison between real 55Fe pulse and obtained fitting pulse by linear parametric and process models. Comparison between parametric and process models for detection system description of 55Fe x-ray pulse
The peak shape algorithm is applied on both acquired 137Cs and 55Fe pulses. Thus, the real 137Cs pulse against the fitting pulse by peak shape algorithm is depicted in Fig. 15. However, the real 55Fe pulse and fitted one by peak shape algorithm is presented in Fig. 16. It is noted that the calibrated gamma pulse width is found to be larger than x-ray pulse as described in Table 5.
Comparison between real 137Cs pulse and fitted one by peak shape algorithm. Comparison between real 55Fe pulse and estimated one by peak shape algorithm. Estimated pulse width for both 137Cs gamma and 55Fe X-ray pulses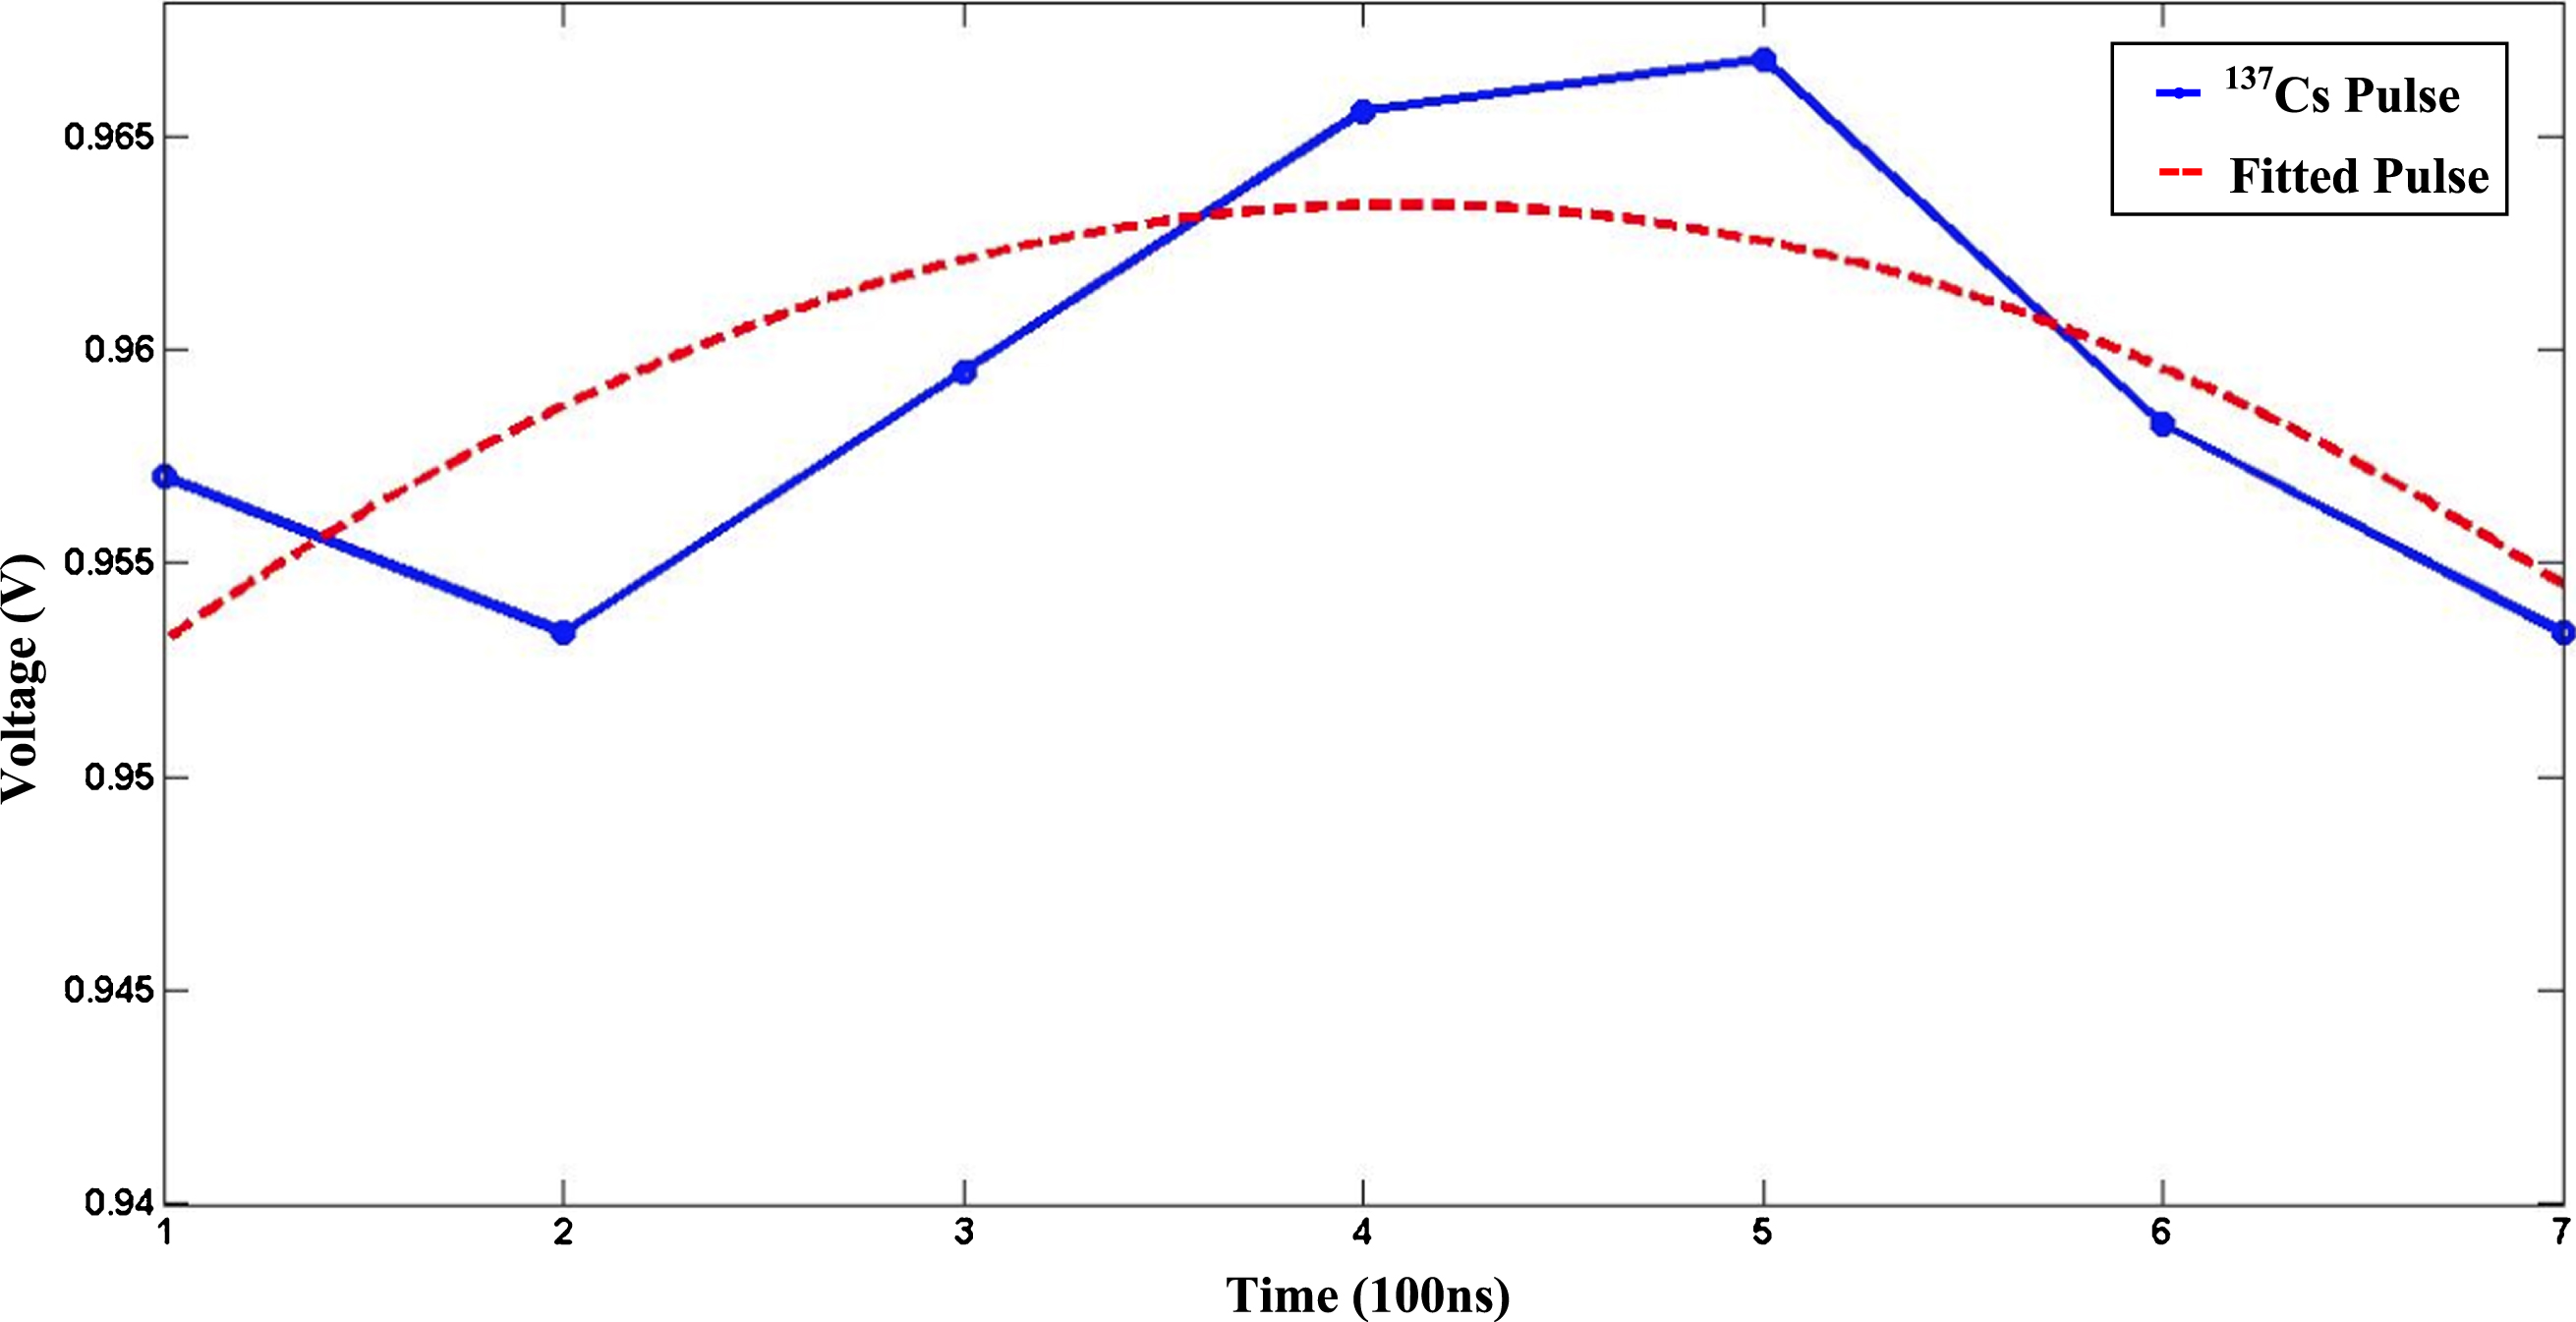

The 137Cs and 55Fe pulses are contaminated. The purpose of the amplitude search with curve fitting method is to discriminate gamma and x-ray pulses. The 137Cs gamma pulse is discriminated from the contaminated pulse by amplitude search algorithm. The contaminated and discriminated 137Cs pulses by amplitude search algorithm using curve fitting method are depicted in Fig. 17.
The contaminated pulse and discriminated 137Cs pulse using amplitude search algorithm based on curve fitting.
Here, both 137Cs and 55Fe pulses are combined. The goal of the pulse tracking method is to differentiate gamma and x-ray pulses. The 137Cs gamma pulse is discriminated from the contaminated one by pulse tracking algorithm. The contaminated and discriminated 137Cs gamma pulses are shown in Fig. 18. Therefore, the 137Cs gamma pulse is separated from the combined gamma and x-ray pulse.
The combined pulse and discriminated 137Cs pulse using pulse tracking algorithm.
The residuals are the difference between both real and fitted 137Cs/55Fe pulses. These residuals are investigated by
a) Comparison between real 137Cs and resultant fitted pulse by LSCF. b) The obtained residuals that is the difference between real pulse and fitted pulse. a) Comparison between real 55Fe and resultant fitted pulse by LSCF. b) The obtained residuals that is the difference between real pulse and fitted one. The 137Cs pulse identification error against noise variance for extracted spectrum features over a) Rician and b) Rayleigh noise degradation. Comparison between gamma and x ray pulse shaping by LSCF method


The 55Fe pulse identification error against noise variance for extracted spectrum features over Rician, Rayleigh with Rician, and Rayleigh noise degradation is depicted in Fig. 22. The Multitaper extracted features present the lowest possible identification error for most noise degradations. Figure 23 illustrates the 137Cs pulse identification error against noise variance for Bispectrum extracted features of ARMA synthesis, bispectrum estimation (indirect method) and cross bispectrum estimation (direct method). The obtained results confirm that ARMA synthesis introduces the minimum identification error at all values of noise variance.
The 55Fe pulse identification error against noise variance for extracted spectrum features over a) Rician and b) Rayleigh with Rician c) Rayleigh noise degradation. The 137Cs pulse identification error against noise variance for extracted features from Bispectrum of a) ARMA synthesis b) Bispectrum estimation (indirect method) c) Cross Bispectrum estimation (Direct Method).

Figure 24 presents the 55Fe pulse identification error against noise variance for Bispectrum extracted features from ARMA synthesis, Bispectrum estimation (indirect method) and true Comulants of ARMA processes. From these figures, it is noted that ARMA synthesis introduces zero identification error. Additionally, the residuals of system identification algorithm are computed and illustrated in Fig. 25 for 137Cs gamma pulse. It is shown that P1D model introduces a very small error that is approximately equal to zero for 137Cs. Also, the obtained result shows that PID1D model introduces an average error of zero for 55Fe. The peak shape algorithm achieves mean fitting error and small error values as illustrated in Table 7. Also, the main advantage of pulse tracking parameters algorithm is the higher achieved accuracy. A comparison between proposed algorithms is presented in Table 8. From computational point of view, the peak shape algorithm achieves the lowest speed time for both considered radiation pulses 137Cs and 55Fe under the same machine with much proper accuracy as depicted in Table 8. It consumes 4 times less than that of system identification algorithm. However, the comparison between the proposed algorithms confirms that system identification achieves the highest accuracy compared to other algorithms. This algorithm achieves zero fitting error. So, it is the optimal algorithm for PSD between gamma and x-ray pulses within clear environment. On other hand, PSD using ANN for Bispectrum features extraction is robust under noisy environment. It introduces 100% accuracy under noisy environment but on the expenses of time as illustrated in Table 9. This stimulates the much need of high processor hardware. On other words, the neural network and curve fitting algorithms show much longer execution time.
The 55Fe pulse identification error against noise variance for extracted features from Bispectrum of a) Bispectrum estimation (indirect method) b) ARMA synthesis c) True comulants of ARMA Processes. The error signal that is the difference between 137Cs real and measured pulse by linear parametric and process models. Estimated fitting error for both 137Cs gamma and 55Fe X-ray using peak shape algorithm Computational speed of implemented pulse discrimination algorithm Selection of optimal algorithm

This manuscript is conducted for pulse shape discrimination between x-ray and gamma pulses under various environmental conditions. Several algorithms are suggested for this purpose. Evaluations of these algorithms are estimated in terms of residual, fitting accuracy and computational time. An algorithm based on LSCF method is applied. The result of this algorithm confirms that 137Cs gamma pulse is approximated to exponential pulse distribution with average pulse error of 0.0328%. However, the 55Fe x-ray pulse is approximated to Gaussian pulse distribution with average pulse error of 0.0052%. The second proposed algorithm depends on ANN as a classifier. The extracted spectrum and Bispectrum features from 137Cs gamma and 55Fe x-ray pulses are trained. The results of this algorithm show that features extraction from ARMA synthetics of Bispectrum demonstrate the highest pulse identification of 100% under various types of noise degradations. It is robust against noise degradation for both gamma and x-ray pulses. System identification algorithm is another implemented algorithm that depends on various control models in order to describe the pulse parameters. The models transfer functions are computed and expressed. It is noticed that P1D gives 100% identification for 137Cs gamma pulse. But, the P1D1Z model attains 100% recognition with 55Fe x-ray pulse. Also, an algorithm for pulse shape discrimination between gamma and x-ray pulses using peak shape method is introduced. The results of this algorithm demonstrated that 137Cs gamma pulse is much wider than 55Fe x-ray pulse. Moreover, an algorithm depends on amplitude search with curve fitting method for PSD is investigated. It achieves a lower accuracy. A final algorithm based on pulse tracking method for PSD is built. This algorithm accomplishes efficient pulse identification of 94.4% for gamma and x-ray pulses. It is noted that peak shape algorithm introduces the highest recognition rate with efficient computational speed relative to other algorithms. The ANN algorithm using ARMA synthesis presents 100% identification for the pulse shape in noisy environment. However, it consumes too much time compared to other algorithms. So, high processors hardware is essential. As a last point of observation, a fitting error of zero is accomplished with system identification algorithm. Consequently, 100% identification for pulse shape is attained under clear environment. Therefore, the proposed system identification algorithm is the optimal one for pulse shape discrimination between gamma and x-ray pulse. These results indicate a remarkable accuracy of the proposed algorithms for differentiation between 37Cs gamma pulses and 55Fe x-ray pulses over different noise environments.
Footnotes
Acknowledgments
Mr. A. Messai of Centre de Recherche Nucléaire de Birine, CRNB — COMENA, Algeria provided files of experimental x-ray signals.