
Abstract
BACKGROUND:
Automatic segmentation of pulmonary vascular tree in the thoracic computed tomography (CT) image is a promising but challenging task with great clinical potential values. It is difficult to segment the whole vascular tree in reasonable time and acceptable accuracy.
OBJECTIVE:
To develop a novel pulmonary vessel segmentation approach by incorporating vessel enhancement filters and the anisotropic diffusion filter with the variational region growing.
METHODS:
First, the airway wall from the lung lobes is eliminated from CT images by using multi-scale morphological operations. Second, a Hessian-based multi-scale vesselness filter and medialness filter are applied to detect and enhance the potential vessel. Third, an anisotropic diffusion filter is used to remove noise and enhance the tube-like structures in CT images. Last, the vascular tree is segmented by applying variational region growing algorithm.
RESULTS:
Applying to the CT images collected from the entire dataset of VESSEL12 challenge, we achieved an average sensitivity of 92.9%, specificity of 91.6% and the area under the ROC curve of AUC = 0.972.
CONCLUSIONS:
This study demonstrated feasibility of segmenting the pulmonary vessel effectively by incorporating vessel enhancement filters and the anisotropic diffusion filter with the variational region growing algorithm. Our method cannot only segment both large and peripheral vessels, but also distinguish the vessels from the adjacent tissues, especially the airway walls.
Introduction
Computer-aided diagnosis (CAD) systems have been widely used in radiology. It has become a part of the routine clinical work for the diagnosis of lung cancer or diseases [1, 2], breast cancer [3–6] and brain tumor [7]. Vascular morphology of tumor plays an important role in tumor progression and metastasis [8]. Likewise, analysis of pulmonary vessel can be essential for both research and clinical diagnostic purposes. On the one hand, quantitative measurement of distance metric helps radiologists identify pulmonary hypertension [9]. Eliminating pulmonary vessel from adjacent tissue can improve the performance of the CAD scheme for lung nodule [10]. On the other hand, separating the vessel from other regions of interest is an important step in the studies of specific and accurate quantifying lung tissues, such as interstitial lung disease, lung perfusion [11] and tumor volume change [12]. Lung vessel segmentation is also a crucial step for automated detection of pulmonary emboli in the arteries [13]. Moreover, the analysis of lobar vasculature is an essential step in pulmonary lobe segmentation [14]. Lobe segmentation can provide information for functional parenchyma and thus support disease assessment and treatment planning [15]. However, as the vascular tree contains too many branches. It is time-consuming and tedious to identify manually. Therefore, an automatic segmentation method can help reduce workloads and contribute to the reliable quantitative analysis.
Therefore, in the past few decades, vessel segmentation has increasingly gained attention. An extensive review can be found in [16], where the existing methods of vascular segmentation are introduced in detail. The pulmonary vascular tree, consisting of pulmonary artery and vein, is one of the most complex vascular structure in human body. However, due to the adjacency of the airway walls and the number of vessel branches, most of the reported techniques could hardly segment a whole vascular tree in reasonable time and with satisfactory accuracy. Besides, the algorithms proposed previously generally failed to detect the small vessels. For these reasons, the lung vascular tree segmentation in the CT scans remains a challenging task.
Some methods have been proposed to address the problem of pulmonary vessel trees segmentation. Some studies focus on the intensity-based methods that use the natural contrast between the vessel and the background. In such ways, the lung vessel is segmented by including the voxels above a threshold and then the structures with the small volume are eliminated [17]. These methods are quick and straightforward, but fail to segment the small vessels. Another disadvantage is their low precision. Due to noises and the partial volume effect, adjacent tissues or noises may be wrongly identified as the lung vessel. Therefore, some researchers have developed approaches by incorporating intensity information with other advanced methods. Kaftan et al. [18, 19] presented a proposal based on a fuzzy segmentation concept, combining the strengths of both the threshold information and the fuzzy connectedness method. The output is possible that each voxel belongs to the vascular tree, but not with an accurate segmentation. Wu et al. [20] applied regulated morphology operations to binarized data to build up a fuzzy spherical representation of vessels. Comparing these final segmentation results, we can find that even though the accuracy is improved, a great deal of the small vessels have been omitted. To solve this problem, several other studies used the level-set method and wave-front propagation algorithm to handle various topologies [21–23]. Despite the high accuracy, these methods fail to extract the narrow, thin and low-contrast vessels.
To detect and extract the small low-contrast vessels accurately, some studies proposed a Hessian matrix based enhancement method by analyzing the eigensystem of the Hessian matrix at different scales. These methods are generally applied in two steps. First, the vessel-likelihood at the pixel level is calculated by vessel filters such as the Frangi vesselness filter [24], Sato vesselness filter [25] and Krissian medialness filter [26]. Next, the output from the vessel filter is used to obtain the final vessel trees. For instance, Shikata et al. [27, 28] adopted Sato vesselness filter to detect the potential vessels. After filtering, thin peripheral segments and the thick vessel are extracted by using traversal approaches with a predefined threshold. Similarly, Dogen et al. [29] integrated the Frangi filter with multi-scale thresholding to generate binary vessel trees at first. Then, starting from the centerline voxels, they segmented the vessel by using local optimal thresholding. Although the Hessian-based methods can produce the encouraging result in pulmonary vessel enhancement, the conventional Hessian-based filters are insufficient to handle the vascular junctions due to their cylinder assumption. Few studies have addressed this problem. Zhou et al. [30] designed a new response function to enhance all vascular structures, but he failed to detect the small vessels. Xiao et al. [31] applied the stress-strain relation to vessel enhancement algorithm by forming a strain energy filter. This new approach was only tested on the 3D simulation image, but the performance on clinical image scans was not evaluated yet.
A recent study, pays more attention to eliminate the effects of adjacent lung tissues such as airway walls, nodule and other abnormalities. In particular, in the pulmonary vascular system, the arteries are located close to the airway walls. This characteristic makes it hard to separate the airway wall from vessels. To solve this problem, Anna et al. [32] and Orkisz et al. [33] extracted the vessel and trachea trees together and then removed the airway wall. The extraction of the airway wall is based on the segmentation of the airway tree. Namely, we may eliminate airway wall effectively if the airway tree contains main bronchus as well as small airways.
After reviewing related literature, we find that the challenges for vessel tree segmentation are: elimination of the airway wall, extraction of both small and large vessels. To meet the needs, we introduce a 3D approach for segmentation of pulmonary vessel trees in this study.
The paper is organized as follows. First, the dataset of this study is introduced in Section 2. The details of the proposed method are described in Section 3. Then, the result of vessel tree segmentation is presented in Section 4. In Section 5, our proposed method is analyzed and discussed. Finally, the conclusion is given in Section 6.
Materials
In this study, the CT scans for testing and evaluating our proposed mothed was collected from the VESSEL12 challenge [34]. This database compares methods for segmentation of blood vessels worldwide.
This database includes a total of 23 CT scans. Among them, 20 CT scans are released as the testing set, and the other three scans are selected as the training set. The scans represent a variety of clinically universal scanners and protocols. About half of them contains abnormalities such as nodules, emphysema or inflammation. These clinical images, including high and low resolution, standard or low-dose CT and CT with contrast agent, closely reflect the diversity of CT scans typically used in clinical practice. The data of each CT scan consists of 355–543 transverse slices. Each slice contains 512*512 voxels with a slice spacing between 0.59 mm and 0.89 mm. To ensure the isotropy of data, we make sure that the thickness is either 0.7 mm or 1 mm. All the chest CT scans are available for download on the VESSEL12 website.
As it is impractical to segment all the lung vessels in CT scans manually, in VESSEL12, only the specific pre-generated points of interest (POIs) were manually annotated by three trained observers. In addition, the points consist of both actual vessel voxel and the specific points such as vessel-like structures, airway walls, and abnormalities. If all the three annotators agree on it, the point is regarded as a reliable reference. Meanwhile, only the annotation of three training data is available.
A participant of VESSEL12 is required to submit an entire segmentation result of all twenty testing data for evaluation. The probabilistic segmentation on the scale of 0 to 255 is encouraged. Although a binary segmentation is acceptable as well, a distance transformation will be applied to generate a probabilistic result, which is not an accurate representation of the submitted result. The submitted results are evaluated by the Receiver operating characteristic (ROC) curve analysis. The area under the ROC curve (AUC), specificity (SPC) and sensitivity (TPR) are used as evaluation criteria. The AUC provides a measure of overall accuracy independent of any threshold, which can be interpreted as the average probability at which a vessel voxel will have positive predictive values compared to a non-vessel voxel. Specificity, also known as true negative rate, represents the capacity of the algorithm to predict the non-vessel voxel under evaluation, while sensitivity measures the percentage of actual vessels that have been correctly identified as a vessel.
When the analysis is complete, the statistic is received from the organizers and the overall performance for each testing data is stored. Moreover, we found that several submissions in VESSEL12 were just vessel-enhancement results. Hence, in Section 4, only the methods that involve a hard decision on whether each voxel considered belongs to a pulmonary vessel are included in the comparison.
Method
To overcome the existing problem in the segmentation method of the pulmonary vascular tree, we first removed the airway wall from the lung parenchyma by using multiscale morphology. Then, we designed and defined a vessel filter (FPF) to detect the vessels by integrating the Frangi’s vesselness filter and Pock’s medialness filter. Next, the anisotropic diffusion filter was adopted to remove the noise and enhance the tube structure in the lung region. After filtering, we used the local maximum of the FPF result as seed points and applied variational region growing (VRG) on diffusion filtered image to segment the vessel tree. Specifically, in VRG formulation, the segmentation is constrained by region descriptor which classifies voxels as vessel or background. The response of both diffusion filtered image and FPF filtered was used to constructed the region descriptor. The VRG process aims to minimize the energy function and only stops when neither of the vessel voxels can be aggregated.
Our method is shown in the flow chart below (Fig. 1). The details are described in the following sections. A brief description of the proposed method is as follows.
To extract lung mask and airway wall to create a segmentation mask.
To apply FPF filter to detect the potential vessel.
To filter the CT images through the hybrid diffusion filter to remove the noise and enhance the tubular structures.
To calculate local maximum of FPF result to obtain the initial seed points of VRG.
To conduct the VRG algorithm on diffusion filtered images to segment pulmonary vessel tree.
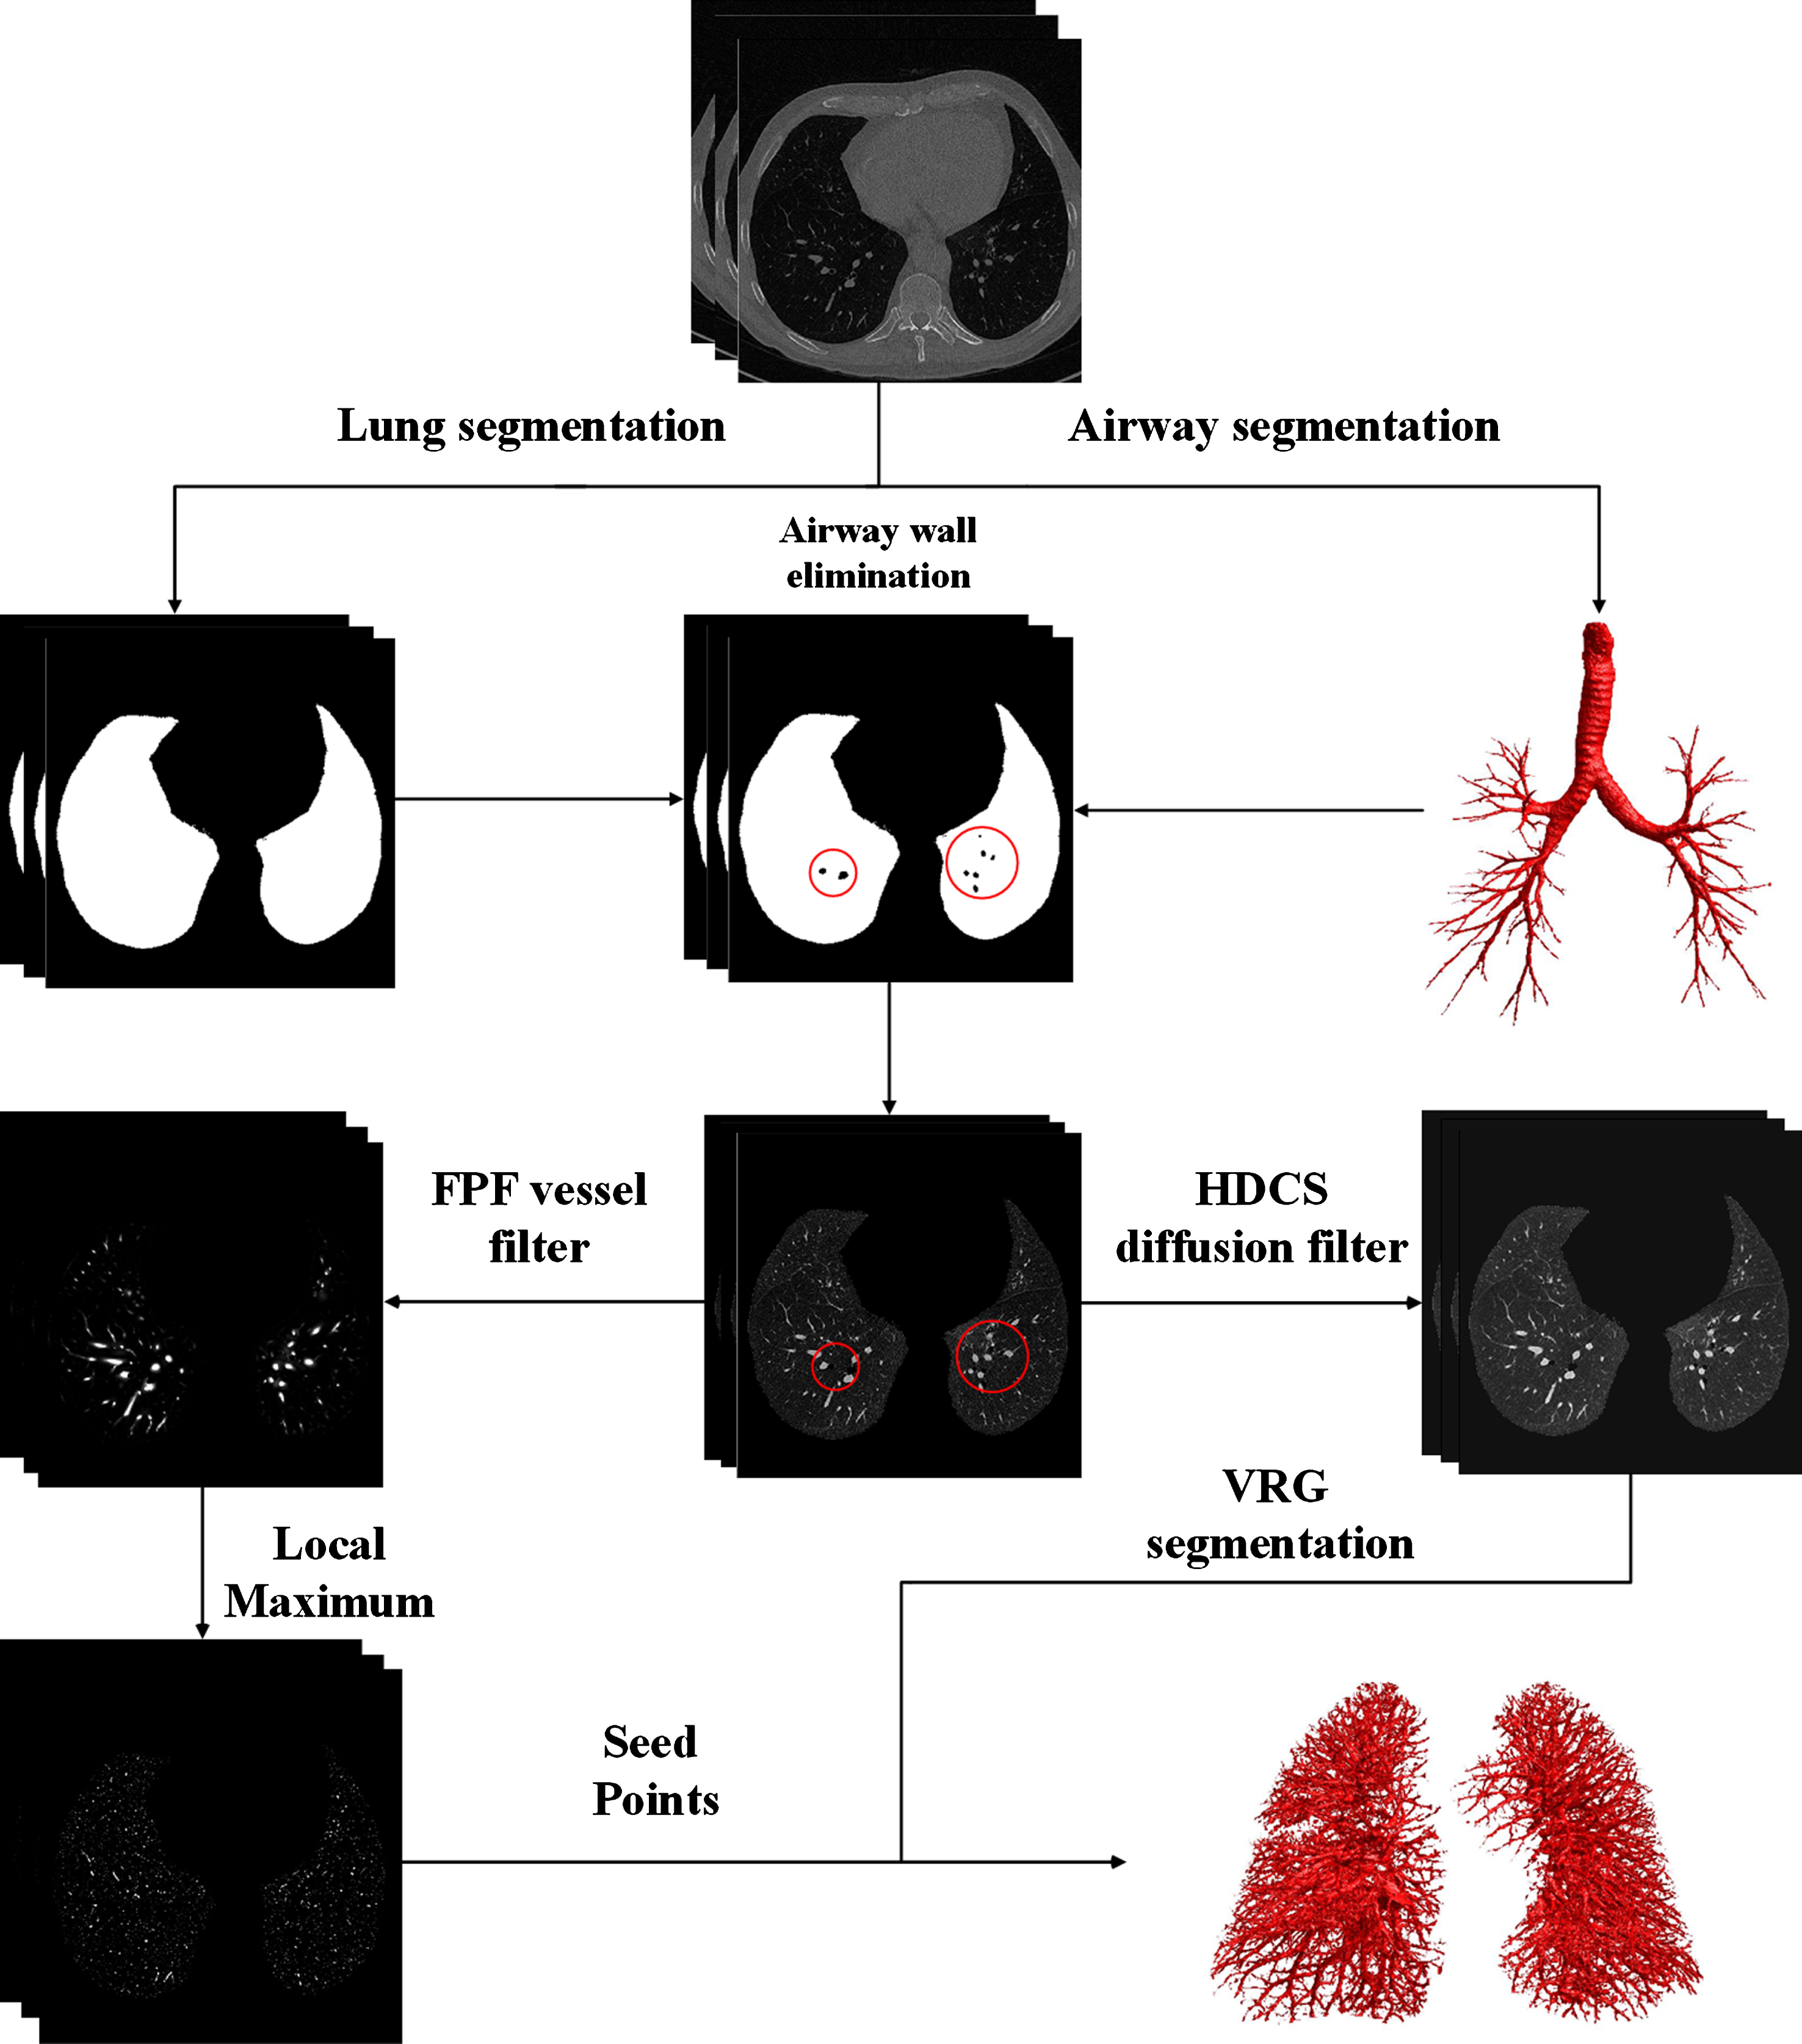
The proposed process of the segmentation of the pulmonary vascular tree.
To reduce the amount of calculation and exclude the airway wall, we first segmented the lung and the airway wall by using region growing and multi-scale morphology. The lung region is extracted from the CT images by the method proposed in [35]. The airway segmentation method was reported in our previous study [36]. The parameters were set the same as in [35] and [36].
After extraction of lung and airway tree, the airway wall is extracted by morphological operation [33]. First, a series of morphological opening operations with a ball-shaped structure element
The detection of the potential vessel, the hybrid diffusion filtering and VRG process are all performed on the segmentation mask. Such a strategy can not only reduce computation time but also eliminate the interference of the airway wall.
Detection of potential vessel
Assume that the eigenvalues of the Hessian matrix are λ3, λ2 and λ1 (|λ3| ≤ |λ2| ≤ |λ1|), and the corresponding eigenvectors are v3, v2 and v1, then eigenvalue analysis can be used to characterize the local sharp of a given voxel.
Generally, a vesselness function utilizes the combination of the Hessian eigenvalues to determine the vessel likelihood of voxels. Frangi et al. [24] introduced a vessel response function based on the ellipsoid model. A voxel is considered as belonging to vessel in the 3D space if λ1, λ2 and λ3 satisfy λ3 ≈ λ2 ⪡ λ1 ≈ 0. To distinguish among plate-like, blob-like and line-like structure, two geometric ratios are taken into account. The first ratio R
A
= |λ2/λ3| addresses the deviation from a blob-like structure. The second ratio
The α, β and c are threshold to control the sensitivity of the filter to measure R A , R B and S. Here, the parameter values were set as recommended: α= β= 0.5 and c = 500.
In spite of its smooth response and high specificity, Frangi’s method is insufficient to adaptively extract the vessel with low contrast.
In comparison, a medialness filter measures the degree of a voxel belonging to the medial axis of the object. The medialness function can be classified as central medialness and offset medialness function. Among them, the offset medialness function measures the boundary information at a given radius according to the actual scale. An adaptive offset medialness filter was proposed by Krissian et al. in [26]. The medialness function is shown in Equation (2).
Where I is the original CT image and
with the number of samples N =⌊ 2πσ + 1 ⌋ and the discrete angles
The medialness weighted by symmetry confidence is given by
The weighting function w and the initial medialness b
i
are defined as
Here, the
For comparison, we summarize the characteristics of Frangi’s filter and Pock’ filter: Frangi’s filter tends to improve the visibility of all voxels belonging to the vessel. However, it fails to enhance the small vessel with low contrast. The medialness function proposed by Pock is sensitive to the vessel in low contrast, but it only extracts the medial axis of the vessel.
Consequently, we integrate the Frangi’s function and Pock’s function according to the actual scale. The integration function can be defined as:
where the σmax is set as the selected maximum scale and σmin is the minimum scale. As shown in Equation (8), the proposed filter executes Pock’s medialness function when detects the small vessels, while the Frangi’s filter focuses only on the enhancement of medium and large vessels. Given the fact that the vesselness, determined with a combination of the eigenvalues, is usually constrained by a brightness contrast. This mechanism offers a solution with noise immunity but omits vessels with low contrast. In contrast, Pock’s function rejects noise and outliers by considering the difference between the medialness, the center boundariness, and the margin δ. Therefore, the integration shown in Equation (8) ensures the detection of vessels of various sizes as well as the vessel in low contrast.
All the functions mentioned above are identified at a single scale σ. Due to the varying size of lung vessels, it is necessary to perform a multi-scale analysis on the CT image. Conventionally, the multi-scale space is constructed by convoluting the initial image with Gaussian operators of various standard deviation. However, the Gaussian filter may smooth across the object boundaries, which results in the merging of the surrounding structure. Accordingly, in the traditional multi-scale framework, the Frangi’s filter might be unable to separate the adjacent vessels, and the Pock’s filter may wrongly detect the adjacent vessels. To avoid these problems, we replace the traditional Gaussian kernel with a Bi-Gaussian kernel [38], which allows independent selection of foreground and background scales. The form of the Bi-Gaussian function is
where the σ is defined as the original kernel used within the structure and σ
b
is the background scale. The k and c0 are deduced as
To obtain the multi-scale response, we first select the maximum response of Pock’s filter and Frangi’s filter respectively.
The term σ γ is the space normalization parameter [39], which can be set to prefer a particular scale. If γ equals to 1, no special scale is preferred.
Next, we normalize the maximum response of two filters by rescaling them to [0,1] with a global threshold being the normalized parameter:
where the term max(R
p
(γ)) represents the maximum response of R
p
(γ) and min(R
p
(γ)) means the non-zero minimum value of R
p
(γ). Because a part of the noise would have a high response, we use the difference between maximum and minimum, and a proportionality factor to decrease the influence of noise. The terms T
pock
and T
frangi
adjust the sensitivity to select vessels, and should range between (0,1]. More voxels will be identified with a higher probability as a vessel if T
pock
and T
frangi
are set to a smaller positive value. Thus, we have:
where the normalized responses greater than 1 are set to 1.
Finally, to integrate this two normalized response, we calculate the maximum of voxel-by-voxel with Equation (17).
The FPF is similar to a traditional function, which measures the likelihood that a voxel belongs to a vessel. What differs is that FPF contains both the vesselness and medialness response. Figure 2 illustrates the results of applying these filters to testing case 4.

The results obtained from (A) Pock’s medialness filter, (B) Frangi’s vesselness filter (both using Gaussian kernel), (C) FPF filter (using Bi-Gaussian kernel) and (D) original CT image.
The noises in the original CT image are likely to be wrongly classified as small vessels, which would easily affect the segmentation accuracy. Therefore, a hybrid diffusion filter with a continuous switch (HDCS) [40] is adopted to remove the noise and enhance the tubular structures in the image. HDCS filter exploits the properties of three-dimensional edge-enhancing diffusion (EED) and coherence-enhancing diffusion (CED). The diffusion tensor of HDCS takes the forms as follows:
where the eigenvalues of the hybrid diffusion tensor (λ
h
i
) are defined as a linear combination of the eigenvalues of the EED (λ
e
i
) and CED (λ
c
i
) diffusion tensors. Furthermore, the fraction ɛ is used to switch between using the λ
e
i
and λ
c
i
. The ɛ is defined as
with μ
i
(|μ3| ≥ |μ2| ≥ |μ1|) being the different eigenvalues of the structure tensor and the hybrid contrast parameter λ
h
= 0.05. The parameter ξ distinguishes the different geometries by using the ratio between μ1, μ2 and μ3.
where α = 0.001. Finally, the discretization schemes proposed by Kroon et al. [41] is used to obtain the enhancement result. HDCS is introduced to remove the noise in similar areas and enhance vessels in the image. In this way, the vessels are preserved, and noise is filtered out, as shown in Fig. 3.

The comparison of (A) original lung region excluding airway wall and (B) the image after HDCS diffusion filtering.
The lung vessels extracted by the proposed filter contains both the actual vessel location and the non-vessel area. Given this, the VRG [42] is implemented to identify the precise region of vessels.
In the VRG definition, the image domain Ω is divided into the segmented region Ω in and the background Ω out . To represent the state of a voxel x in the region Ω, a discrete binary function φ can be defined as:
with Ω out = Ω ∖ Ω in . Additionally, we defined the vessels belonging to region Ω in and background belonging to the region Ω out .
The main feature of the VRG algorithm is to iteratively merge or exclude voxels by achieving a minimum of the energy function J. The energy function is given by
where k (x) is the region descriptor that describes the state of the voxel x. J (φ
n
) represents the sum of the energy at the current iteration n. It can be assumed that J (φn +1) at iteration n + 1 is the sum of J (φ
n
) and the variation of energy ΔJ (φn+1) due to inclusion or exclusion of a voxel. The actual expression of energy variation is
Moreover, it has been demonstrated [42] that the equivalent expression ΔJ (φn+1) can be deduced as
According to the derivation, the signs of φ n (x) and k (x) decide the variation of energy. Keep in mind that the object of VRG is to achieve the minimization of energy. Thus, a voxel should be aggregate into the region Ω in if the energy decreases or is excluded otherwise. More specifically, if ΔJ (φn+1 (x)) < 0, then voxel x is added to (φ n (x) = 0) or rejected from (φ n (x) = 1) the vessel region. It also shows that the region descriptor k (x) should take negative value if the voxel x belongs to vessels region. For this reason, we defined the k (x) as
where FPF (x) is the response of the proposed filter and the T (x) is the enhancement response of HDCS filter. The terms M FPF and M T are respectively the maximum value of FPF and T. The a FPF in represents the average FPF response of voxels classified as vessels, while the a FPF out represents the average response of background. By analogy, a T in denotes the average HDCS response of voxels belonging to vessels and a T out denotes the response of background voxels. The proposed region descriptor is a refined version of Orkisz [33], in which only the grayscale information and response of Fringi’s filter are used to construct the region descriptor. As mentioned above, under the traditional framework, the Frangi’s filter is insufficient to extract the vessels of various sizes and contrast. So we propose that we should use the FPF filter to replace the traditional Frangi’s filter. Besides, noise in the original CT images may affect the judgment on the voxel state. Therefore, instead of using the grayscale information, we adopt the result of HDCS filtering to formulate the second part of region descriptor.
The segmentation starts at the maximum local region of the FPF result, which is defined as
with v2 and v3 being the eigenvectors of principal curvatures. The VRG iteration stops when no more voxel can be aggregated into the vessel region. Then the binary result is weighted by the FPF result to obtain a probabilistic segmentation. In this study, all the above steps were implemented in Matlab and C++ programs by using a computer with Intel i5 CPU 3.2 GHz and 24 GB RAM.
Before experimenting, the parameters used in the FPF filter and HDCS filtering were initialized based on previous works. In the FPF detection of potential vessels, the multiple scales σ were selected from 1 pixel to 6 pixels with the step size of 1 pixel. The parameter α, β and c concerned in Frangi’s filter were set to 0.5, 0.5 and 500 respectively. The σ w and δ used in Pock’s filter took a value of 0.2. The contrast parameter λ e and the threshold parameter C of EED were taken to be 0.02 and 3.31488. Similarly, the contrast parameters a and λ c of CED were set as 0.001 and 0.02. Finally, the contrast parameter λ h in HDCS was set to 0.05. The number of iterations times and time step size equaled to 5 and 1, respectively. The remaining parameters T frangi and T pock are introduced to adjust the sensitivity to detect the vessels.
To verify the effectiveness of the proposed algorithm, we submitted three sets of segmented results using different values of T frangi and T pock . In the first experiment, we set T frangi = 0.3 and T pock = 0.1. Only the probabilistic segmentation was submitted according to a recommendation by the VESSEL12. The results achieved an overall AUC of 0.972 with a sensitivity of 0.929 and a specificity of 0.919. In the second experiment, we set T frangi = 0.2 and T pock = 0.2. Both binary and probabilistic results resulting from the proposed method were submitted. The binary results achieved an overall AUC of 0.888 with 0.874 sensitivity and 0.948 specificities. The probabilistic results were 0.939 for the AUC, 0.941 for the specificity and 0.898 for the sensitivity. The detail statistics of the best score results are shown in Table 1, which contains the range of scores achieved by all the segmentation methods in the VESSEL12 website.
The statistics of our best scoring results and the range of scores for all submission
The statistics of our best scoring results and the range of scores for all submission
From the Table 1, it can be seen that our method is competitive. Comparing the score ranges, we should note that the very high score of specificity almost always corresponds to very low sensitivity. Although we had a poor specificity in dense lesions, nodules, and mucus-filled bronchi, it is worth noting that even the overall best-ranked methods had the poor specificity in these three terms. Moreover, our method handled airway walls better, with a sensitivity of 0.929 and a specificity of 0.887.
Table 2 summarizes and compares the overall performance of the top ten segmentation methods, in which our method ranks third. The overall scores of the top three methods is are 0.986, 0.981 and 0.972 respectively. In spite of the small gap in the overall scores when compared to the best performing methods using dictionary learning, the computational cost of our method is much less than the top-ranked method (e.g., 20 min vs. 75 min). Moreover, our method produces both the possibility result and the binary result. Figure 4 illustrates two examples of segmentation results of our method. We can see that both the big vessels and small vessels are segmented in case 4. The vascular network is also clearly visible. However, due to the diffuse abnormalities in case 17, the pulmonary vessels are surrounded by high-contrast abnormal tissues. It is hard to separate the vessel from nearby tissues. As a result, both vessels and abnormal tissues are segmented and further make the vascular network seems unstructured and unclear.
Top 10 scores of submissions in VESSEL12

The binary results of testing case 4 and 17.
There are three filters used in the proposed method, i.e. Frangi’s and Pock’s vessel filters and HDCS diffusion filter. The parameters of these filters were set as recommended in the previous papers. Accordingly, the proposed method has three parameters that need to be discussed. Among them, the parameter ɛ performing the switch between the Pock’s filter and Frangi’s filter was empirically set as 1/3. Generally, a lower switch parameter may lead to a bigger loss of low contrast vessel. On the contrary, a higher switch parameter would be insufficient to detect the medium size vessel. If the parameter was set as 1, the computation time would be increased. As a compromise, switch parameter was set as 1/3 in our experiments.
The remaining parameters T frangi and T pock are introduced to adjust the sensitivity to detect the vessels. By the comparison of two submissions, we found the change of T frangi and T pock leads to a different result. For this reason, we experimented to demonstrate the influence of these parameters on the segmentation result. In the experiment, three annotated training data available on VESSEL12 website was used. Three training data include 277, 290 and 315 annotations respectively, in which only the vessel and non-vessel label are given. For each training data, we first used our method with varied T frangi and T pock to segment the pulmonary vessel tree. In detail, the value of T frangi and T pock varies from 0.1 to 1, and we set the step as 0.1. Therefore, we can get 100 possible combinations of T frangi and T pock . In each trial, a pair of value is assigned to T frangi and T pock to obtain a vessel tree. Then we draw the ROC curve and calculate the AUC area by analyzing the vessel tree and its related annotations points. Thus, total 100 ROC curves and AUC values can be obtained for every training data. In general, the optimal parameters are obtained when the sum of AUC achieves its maximum. Since the voxels were classified as vessel or non-vessel in the annotations, only the AUC for the vessel/non-vessel was calculated. The optimum value of T frangi and T pock was selected when the corresponding AUC achieves maximum. The color filling contour graphs of all AUC response and its ROC corves to the varying the T frangi and T pock are presented in Fig. 5.

ROC curve and AUC response of three training data represented in (A), (B), and (C), respectively.
The maximum response was obtained at T pock = 0.1 and T frangi ≥0.5. In the second and third training data, there is a slight drop in the AUC when T frangi ≥0.8. This result can be interpreted as a result of the characteristics of the Frangi’s and Pock’s filter. Given that Frangi’s filter does not provide information about the exact borders, a lower T frangi tends to include a more non-vessel area at the boundary. In contrast, Pock’s filter only tries to extract the medial axis of the vessel, but not all the vessel area. Hence, a lower T pock could include more vascular area.
In this paper, we propose a segmentation method of the pulmonary vessel based on a tubular structure detection method and VRG segmentation. The novelties of the proposed method lie in several aspects: We design and define a novel function based on a combination of Frangi’s vesselness function and Pock’s medialness function. The large and medium vessel is enhanced by Frangi’s filter, while the axis of the small vessel is extracted by Pock medialness filter. To avoid merging of the adjacent vessels, the traditional Gaussian kernel is replaced by the Bi-Gaussian kernel during the multi-scale analysis. The results of HDCS diffusion filter and FPF filter are integrated and utilized to construct the region descriptor. As a result, the performance of VRG segmentation is greatly improved.
For pulmonary vessel tree segmentation, Orkisz et al. [33] combined the Frangi’s vesselness filter with VRG algorithm. Furthermore, they used the filter results and the gray information of the original image to guide VRG computation. However, limitations still exist. On the one hand, the Frangi’s filter is not sensitive to images with low contrast, so that the peripheral vessels could be omitted in some cases. On the other hand, in the original images, the noises and pathological tissues make the gray information of vessels unreliable. Hence, we first combine the Frangi’s and Pock’s filters to detect vessels in varying conditions and sizes. Second, we utilize the HDCS diffusion filter to make the gray information less affected by the noises. Moreover, considering the limitations resulted from the traditional multi-scale spatial analysis, we introduce the Bi-Gaussian kernel to protect the vessel edge from smooth filtering options. This mechanism ensures a preferable vessel detection rate and a low false positive rate. As for the best scoring group using dictionary learning, a huge amount of computation is needed to construct the classification model. Also, the method works on a 2D-slice and does not consider the anatomical structure between vessels and nearby tissues. By comparison, our method contains no training data, which results in higher efficiency. Additionally, we take the structural relationship into account. We segment the airway tree, and thus airway walls are eliminated from the segmentation of vessels. This framework minimizes the impact of adjacency between vessels and airway walls and ensures the accuracy of segmentation.
For details, referring to Table 1, the proposed method presents good sensitivity and specificity. The AUC scores of Vessels/Airway walls rank first among all the method (AUC = 0.954, SPC = 0.887, and TPR = 0.929). Our method does a better job distinguishing vessel from high-density lesion areas. The segmentation results of training data demonstrat that the average AUC reached 0.985 when the T frangi and T pock are set as optimum values. After the optimization of parameters, the overall AUC score is very close to the score of the best scoring method using dictionary learning. Furthermore, the binary result submitted to VESSEL12 ranks the fourth among all the binary result. Hence, our method can generate both the accurate vessel segmentation and probabilistic results.
Nevertheless, our method achieves insufficient specificity in the region of dense lesions (SPC = 0.422), mucus-filled bronchi (SPC = 0.561) and nodules (SPC = 0.276). Because of similarities in contrast and shape, it is difficult to distinguish vessels from these tissues. For the same reason, even the best scoring method may have poor performance on these three metrics, with specificity equaling 0.291, 0.133 and 0.072, respectively.
Conclusion
First of all, the results from both experiments demonstrate that the combination of the vesselness function and the medialness function is feasible. The responses resulted from different filters can be integrated. A switch between filters can be used to obtain a better result. This study provides a new idea for the detecting of the tubular structure and vessel segmentation. Second, in our experiment, the Bi-Gaussian kernel performs better than the traditional one when it applies to situations using multi-filters. Thirdly, HDCS diffusing filter is beneficial to reduce the influence of noise and to enhance the tubular structures in the original image. Hence, the region descriptor constructed by FPF and HDCS is more robust and more accurate.
As it turned out, the results we obtain from the organizers of VESSLE12 is promising. Our method ranks third among the submissions of VESSEL12, which proves its accuracy and validity for pulmonary vessel segmentation. The proposed method can be further improved by using adaptive switch between Frangi’s and Pock’s function. In our experiment, the parameter ɛ is set in accordance to empirical values. Although we have got promising results, it would be better to have the switch based on the vessel size and contrast rather than using a fixed value to limit the scales at which the switch between these two functions occurs. Therefore, in order to realize automatic selection of filters, our further research will aim to find a suitable switch mechanism. Moreover, research of distinguishing the pulmonary arteries from the veins will be conducted. Meanwhile, we will also focus on the clinical application of our method in the further study.
Footnotes
Acknowledgments
This work is supported by the National Natural Science Foundation of China under Grant No. 81830052; the Shanghai Natural Science Foundation under Grant No. 14ZR1427900.