
Abstract
OBJECTIVE:
To compare image quality, radiation dose, and iodine intake of head-neck CT angiography (CTA) acquired by wide-detector with the gemstone spectral imaging (GSI) combination with low iodine intake or routine scan protocol.
METHODS:
Three hundred patients who had head-neck CTA were enrolled and divided into three groups according to their BMI values: group A (18.5 kg/m2 ≦ BMI <24.9 kg/m2), group B (24.9 kg/m2 ≦ BMI <29.9 kg/m2) and group C (29.9 kg/m2 ≦ BMI ≦ 34.9 kg/m2) with 100 patients in each group. Patients in each group were randomly divided into two subgroups (n = 50) namely, A1, A2, B1, B2, C1 and C2. The patients in subgroups A1, B1 and C1 underwent GSI with low iodine intake (270 mgI/ml, 50 ml) and combined with the ASiR-V algorithm. Other patients underwent three dimensional (3D) smart mA modulation with routine iodine intake (350 mgI/ml, 60 ml). Signal-to-noise ratio (SNR) and contrast-to-noise ratio (CNR) of all images were calculated after angiography. Images were then subjectively assessed using a 5-point scale. CT dose index of volume and dose-length product (DLP) was converted to the effective dose (ED) and then compared.
RESULTS:
The mean CT values, SNR, CNR and subjective image quality in subgroups A2, B2 and C2 are significantly lower than in subgroups A1, B1, and C1 (P < 0.01), respectively. The ED values in subgroup A1, B1, and C1 are 55.18%, 61.89%, and 69.64% lower than those in A2, B2, and C2, respectively (P < 0.01). The total iodine intakes in subgroups A1, B1, and C1 are 35.72% lower than those in subgroups A2, B2, and C2.
CONCLUSIONS:
The gemstone spectral imaging with monochromatic images at 53–57 keV combined with ASiR-V algorithm allows significant reduction in iodine load and radiation dose in head-neck CT angiography than those yielded in routine scan protocol. It also enhances signal intensity of head-neck CTA and maintains image quality.
Keywords
Introduction
With the advent of multi-row detector computed tomographic (CT) scanners, head-neck CT angiography (CTA) provides a reliable and noninvasive method for studying the neck and intracranial arteries, with its clinical applications in the identification and characterization of cerebral aneurysms, stenotic and occlusive diseases of blood vessels, arteriovenous malformations, vessel dissections, sino-venous thrombosis, idiopathic hemorrhage, and other vascular pathology [1]. However, increasing concerns are about the amount of radiation exposed to the patients with head-neck CTA, especially for those who have chronic diseases and undergo frequent examinations during treatment and monitoring [2–7]. Moreover, high iodine intake in head-neck CTA can increase side effects of the iodine contrast agent [8], and with increasing concerns on the elevated incidence of contrast induced nephropathy (CIN) [9], how to reduce the contrast medium intake has become a focus topic in clinical radiology [10]. Therefore, the risk of adverse effects from the radiation dose and iodine intake should be carefully balanced when selecting CT scan modes, scan protocols and clinical applications [11–13].
Both 3D smart mA modulation and Gemstone Spectral Imaging (GSI) scan mode are used in clinical practice. Decreasing the patient’s radiation dose and iodine intake from a head-neck CTA examination and optimizing the CT scan mode and protocol while maintaining image quality have become a focus of clinical radiology practice. The GSI scan can generate 101 images from 40 to 140 keV single-source energy CT scanners with fast tube voltage switching, which can feasibly display target vessel system from the best contrast-to-noise ratio (CNR) curve [14]. This method takes advantage of the principle of x-ray attenuation properties at both energies to differentiate materials and improves beam-hardening artifacts that are due to bone, metal, and other high contrast materials, such as iodine, by up to 50%. Our previous studies indicated improved image quality with GSI in displaying vessels [15, 16]. Equipped with a “retina gemstone detector” and adaptive statistical iterative reconstruction (ASiR-V) algorithm, the wide-detector GSI scanner has a very powerful function for displaying vessels. On the other hand, with the update of CT equipment and scan technique, the current multi-slice CT scanner also possesses a fast tube rotation. Combined with a wide detector, it can greatly shorten the scan time. Reduction of the scanning time also means decrease of the radiation dose under the same scanning parameters.
For patients with CTA, it is very important to reduce the radiation dose, which can be realized by reducing the tube current, tube voltage or variation in pitch [17–20]. Unfortunately, decreasing the tube current can increase the image noise of the acquired images, which might adversely affect the diagnostic confidence. Higher image noise can be reduced using different advanced reconstruction algorithms while maintaining low radiation doses. The updated version of the ASiR algorithm, the ASiR-V algorithm, is widely used and can effectively reduce the image noise, improve the spatial resolution and produce images more naturally [21, 22]. To our knowledge, no previous studies have compared the image quality and radiation dose of a wide detector combined with a low concentration medium using the GSI and 3D smart mA modulation with the ASiR-V algorithm in head-neck CTA. In this study, we compared the image quality and radiation dose between GSI with a low concentration medium and 3D smart mA modulation with the ASiR-V algorithm for head-neck CTA.
Materials and methods
Patient population
From May 2017 to January 2019, 300 patients (158 men, 57.7±22.1 years; 142 women, 55.8±21.7 years) with suspected internal carotid artery, vertebral artery, and intracranial arteries diseases had head-neck CTA examination, and the BMI of the patients was from 18.5 to 34.9 kg/m2. The patients were divided into three groups according to their BMI values: group A (18.5 kg/m2 ≦BMI <24.9 kg/m2), group B (24.9 kg/m2 ≦BMI <29.9 kg/m2) and group C (29.9 kg/m2 ≦BMI ≦34.9 kg/m2), with 100 patients in each group. These three groups were randomly subdivided into two subgroups: A1, A2, B1, B2, C1 and C2, with 50 patients in each subgroup (Table 1). The demographic data presented in Table 1 shows that there are no significant differences in patients’ age, sex distribution, weight, and height among the six subgroups (P > 0.05).
Patient Characteristics
Patient Characteristics
*Data are expressed as mean standard deviation (SD). p < 0.05 was considered statistically significant.
All 300 patients underwent head-neck CTA with the gemstone detector to derive 512 slices per rotation on a high-definition revolution (GE Healthcare, Wisconsin, USA). The GSI CT scan protocol was used on the patients in subgroup A1, B1 and C1. The scan parameters were as follows: helical, rapid dual kVp (80 kVp and 140 kVp) switching in 0.25 ms produced by a single source tube, 0.5 s tube rotation time, 80 mm detector coverage, pitch factor 0.992:1, 32 cm DFOV, 158.75 mm/s table speed, matrix of 512×512, and 200 mA. The patients in all the other subgroups underwent routine scan protocol (3D smart mA modulation technique). The scan parameters were as follows: helical, 0.5 s tube rotation time, 40 mm detector coverage, pitch factor of 0.984:1, 32 cm DFOV, 158.75 mm/s table speed, matrix of 512×512, and 120 kVp tube voltage. The technique is intended to achieve the desired image quality as specified by the user in the form of a NI with a user-selected minimum and maximum mA range of 50 mA–500 mA with the NI value of 6. For the 3D smart mA technique, the tube current was modulated to achieve an image noise of 6HU in images of uniform object at image slice thickness of 5 mm. The mean scan length was 338 mm. All images were restructured with 70% ASiR-V; The 70% ASiR setting implies 30% filtered back projection blending with 70% ASiR in the reconstructed images [23, 24]. The scan range was from aortic arch to cranial vault. For all patients, CT dose index of volume (CTDIvol), and dose-length product (DLP) were recorded from the scanner. We converted the DLP to the effective dose (ED) in millisieverts (mSv). The ED was calculated by using the formula: ED = DLP×0.0031, where 0.0031 denotes the conversion factor [25, 26].
The patients in subgroups A1, B1 and C1 were injected a contrast medium with low iodine intake protocol (iodine concentration of 270 mgI ml–1 with Iodixanol 270: Visipaque 270 mgI/ml, GE Healthcare, Cork, Ireland), and a total of 50 ml contrast medium was injected via the median cubital vein access at a flow rate of 4.5 ml s–1 with a double cylinder power injector in the patients. The patients in all the other subgroups were injected with routine iodine intake protocol (iodine concentration of 350 mgI ml–1 with Iohexol: Omnipaque 350 mgI/ml, GE healthcare, USA), and a total of 60 ml contrast medium was injected via the median cubital vein access at a flow rate of 4.5 ml s–1 with a double cylinder power injector in the patients. Contrast injection was followed by a 50 ml saline chaser at the same rate. The CT acquisition was triggered using an automated start protocol of the examination with a start trigger of 145 HU within the aortic arch and a start delay of 4 s. Iodine intake was calculated as the contrast medium concentration multiplied by the total volume of contrast medium.
Data processing and analysis
All the images of the patients were reconstructed by using a dedicated work-station. The thickness of the reconstructed images was 0.625 mm at an interval of 0.6 mm. A 3 mm2±0.2 mm2 ROI (region of interest) was placed at different spots to measure the mean CT values and image noise, as shown in Fig. 1. These areas included the bilateral internal carotid arteries at the eye lens slice, brain parenchyma, and the air in the same slice (Fig. 1A). The bilateral common carotid arteries were sampled at the thyroid gland slice, the sternocleidomastoid muscle, and the air in the same slice (Fig. 1B). Measurements were performed three times and the average value were calculated. CT numbers of the left and right sides were averaged for each patient and analyzed. Areas of focal changes devoid of vascular walls, mural calcification, thrombi, medical devices, or any artifacts were carefully avoided. For all measurements, the size, shape, and position of the ROI were kept constant among the image sets by using a copy-and-paste function in the workstation.
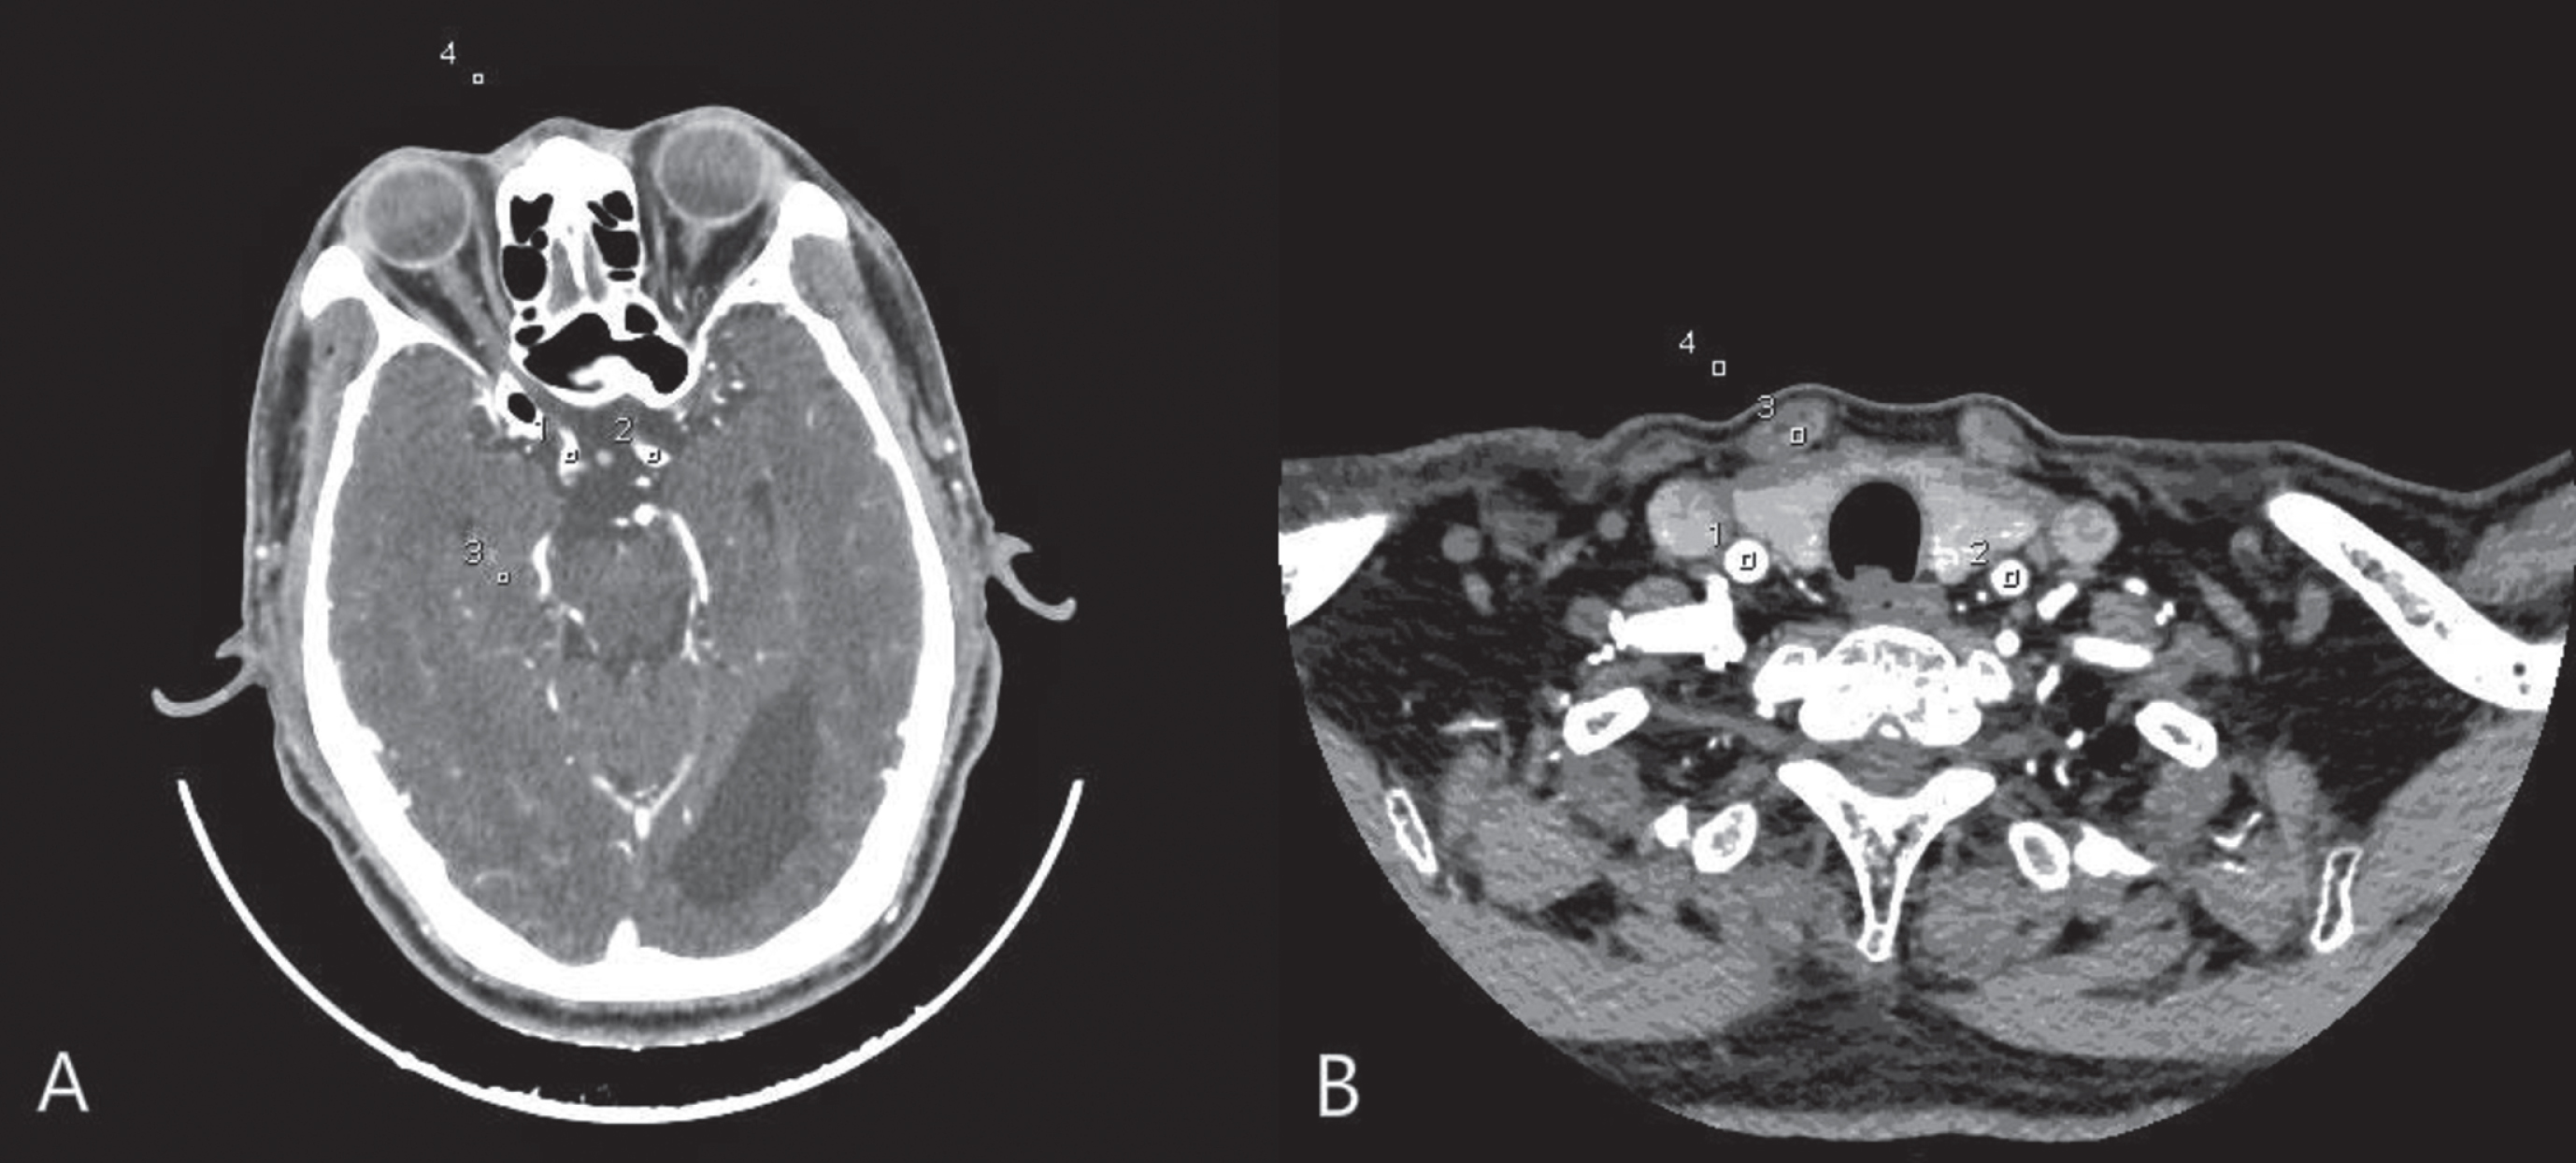
Example of identical ROI measurements simultaneously placed in axial CT images. The ROI measurements were placed in the left and right internal carotid arteries at eye lens slice, brain parenchyma, and the air in the same slice (A); The left and right common carotid arteries at thyroid gland slice, the sternocleidomastoid muscle, and the air in the same slice (B). The region of interest (ROI) with an area of 4 mm2±0.2 mm2.
The CNR of all images was calculated according to the formula [24, 27]: CNR = (CTmeantargetvessel–CTsternocleidomastoidmuscleandbrainparenchyma)/SDair, where CTmeantargetvessel denotes the mean CT value of bilateral common carotid arteries and bilateral internal carotid arteries, CTsternocleidomastoidmuscleandbrainparenchyma denotes the mean CT value of sternocleidomastoid muscle and brain parenchyma, and SDair denotes the mean air noise at the thyroid gland and eye lens. The signal-to-noise ratio (SNR) was calculated according to the formula [24, 28]: SNR = CTmeantargetvessel/SDmeantargetvessel, where SDmeantargetvessel denotes the mean noise generated by bilateral common carotid arteries and bilateral internal carotid arteries. CNR and SNR measurements were obtained from the images for objective evaluation of image quality.
All head-neck CTA images were evaluated independently by 2 radiologists with at least 15 years’ experience in CTA imaging. Over a period of 2 weeks, they assessed the image quality of randomized data sets from which all patient-identifying information had been removed using established 5-point rating scales and a diagnostic PACS workstation with the same brightness and resolution on the same viewing monitor. The 5-point rating scales for the images of head-neck CTA are shown in Table 2 [24, 27–29]. All the images were randomly assigned for evaluation, and the readers were blinded to the CT scan protocols. The two radiologists pre-assessed the image quality of five cases according to the 5-point rating scales prior to our study; the five cases were randomly selected from a series of head-neck CTA scans. The purpose was to train radiologists to be familiar with the evaluation process and criteria. Thus, it may help reduce inter-observer variability. In case of discrepancy, an agreement was reached through open discussions. Subsequently, the case was re-assessed to reduce inter-observer variability [30].
Five-point scale for subjective evaluation of head-neck CTA
Five-point scale for subjective evaluation of head-neck CTA
All statistical calculations were performed with the software package SPSS 21.0 (IBM, Chicago, IL, USA) with a P value <0.05 indicating a statistically significant difference. The characteristics of the six patient subgroups (age, sex distribution, height and weight), image quality scores (subjective image quality), CTDIvol, DLP, ED, and iodine intake were compared using one-way analysis of variance (ANOVA). The SNR and CNR of the images of head-neck CTA were compared using repeated measures ANOVA. If data were homogeneous between the three groups A, B and C, the least significance difference (LSD) test was performed. If data were heterogeneous, Dunnett’s T3 test was performed. Inter-observer variability was assessed with κ value of concordance to measure the degree of agreement between the two radiologists for various parameters. Agreement was determined according to the value of κ: <0, no agreement; 0–0.2, slight agreement; 0.21–0.40, fair agreement; 0.41–0.60, moderate agreement; 0.61–0.80, substantial agreement; and 0.81–1.0, almost perfect agreement.
Results
Quantitative analysis of images
In the quantitative analysis of images, the mean signal intensity (HU) of the target veins in subgroups A1, B1 and C1 was higher than in subgroups A2, B2 and C2, respectively (mean HU values of the common carotid arteries and middle cerebral arteries: 635.3±253.4 HU, 631.5±262.6 HU, and 639.6±251.1 HU for subgroups A1, B1 and C1 with GSI, respectively; 381.6±113.2 HU, 375.8±112.3 HU and 332.9±118.9 HU for group A, B and C with 3D smart mA, respectively) (P < 0.01, Table 3 and Fig. 2).

Comparison of image quality. Comparison of image qualities. A to D provide examples of images obtained using 80 mm GSI z-collimation combination of low iodine load with a BMI of 33.63 kg/m2 at thyroid gland (A), and with a BMI of 28.36 kg/m2 at eye lens (B); 3D Smart mA combination of routine iodine load with a BMI of 26.62 kg/m2 at thyroid gland (C), and with a BMI of 22.51 kg/m2 at eye lens (D).The section thickness is 0.625 mmfor images A, B, C, and D. Signal intensity was measured with a ROI tool as CT value of the left and right common carotid arteries and the internal carotid arteries, image noise as standard deviation of the left and right common carotid artery and the internal carotid arteries. Typical mean signal intensity values are noted with 667.34 HU (a) and 560.50 HU (c) for the 80 mm GSI z-collimation combination of low iodine load at the thyroid gland and the eye lens, respectively. 384.30 HU (b) and 370.91 HU (d) for the 3D Smart mA combination of routine iodine load at the thyroid gland and the eye lens, respectively. There was a significant difference in signal intensity values between the two CT scan protocols (p < 0.01).
Objective image quality with different scan mode in different BMIs
The CNR and SNR of head-neck CTA images in subgroups A2, B2 and C2 were lower than in subgroups A1, B1 and C1, respectively (SNR: 31.6±3.3, 31.1±3.5, and 29.7±3.4 with the GSI in subgroups A1, B1 and C1, respectively; 21.4±2.2, 21.2±2.6 and 18.3±2.5 with the 3D smart mA in subgroups A2, B2 and C2, respectively; CNR: 32.9±3.8, 31.7±3.3, and 31.9±3.7 with the GSI in subgroups A1, B1 and C1, respectively; 21.2±2.5, 20.8±2.3 and 20.3±2.6 with the 3D smart mA in subgroups A2, B2 and C2, respectively;) (P < 0.05 for all values). The details are presented in Table 3, Figs. 4 and 5.

Head-neck CTA performed using the evaluated 3D Smart mA combination of routine iodine load with a BMI of 25.51 kg/m2 (a), and 23.86 kg/m2 (b); 80 mm GSI z-collimation combination of low iodine load with a BMI of 33.66 kg/m2 (c), 31.88 kg/m2 (d), and 27.89 kg/m2(e). The study performed with the GSI with low iodine load demonstrated cerebral arteriovenous malformation (AVM) (white arrow) (e). The right internal carotid arteries, and right vertebral arteries of c and d were clearer than a and b, and there was a difference for subjective image quality between the 3D Smart mA combination of routine iodine load and 80 mm GSI z-collimation combination of low iodine load at different BMI. The mean number of head-neck CTA with over all image quality score of 80 mm GSI z-collimation combination of low iodine load was 4.93±0.68, and the that mean number of 3D Smart mA combination of routine iodine load was 3.88±0.46.
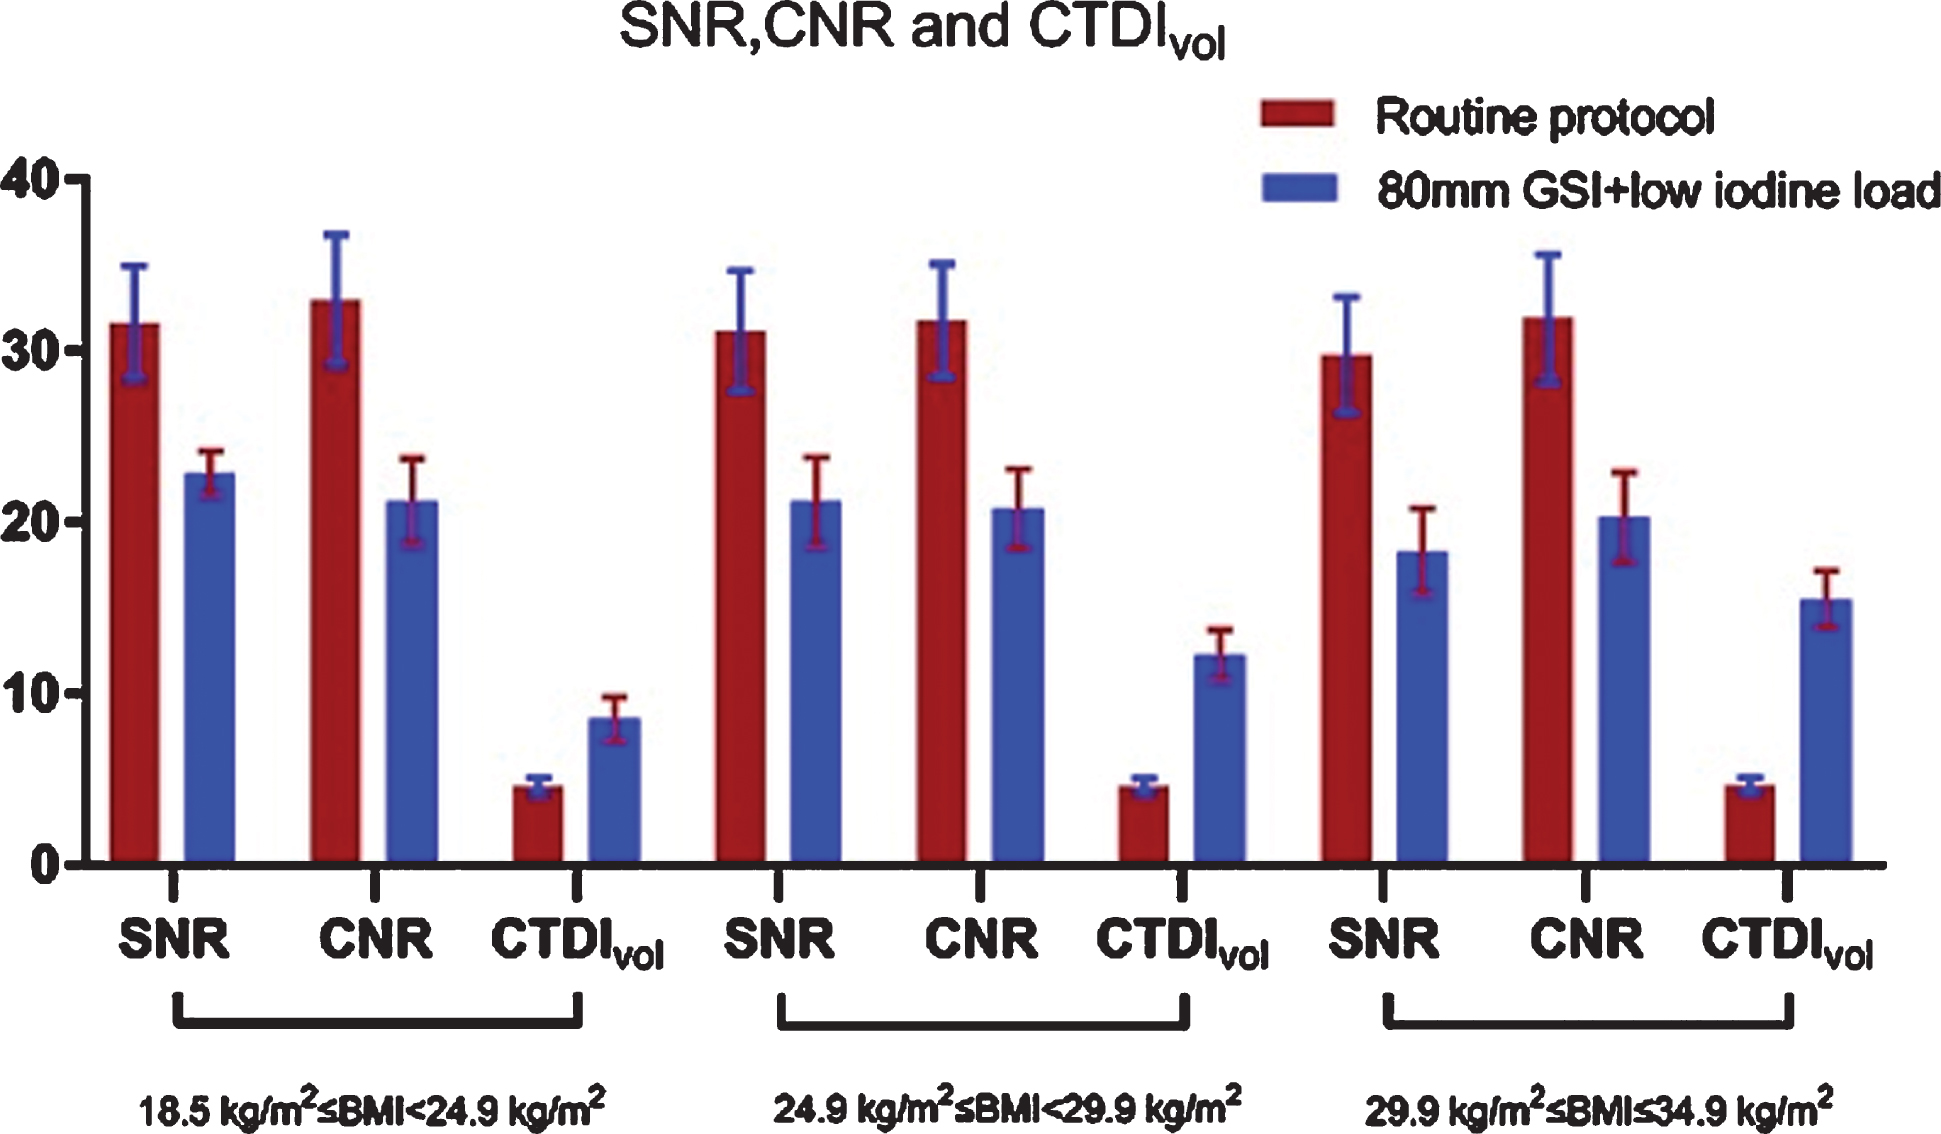
Graph showing the comparisons of signal-to-noise ratio (SNR), contrast-to-noise ratio (CNR), and CT dose index of volume (CTDIvol) between 80 mm GSI z-collimation combination of low iodine load and routine CT scan protocol in different body mass index (BMI) values for head-neck CTA. No statistical differences in SNR and CNR between the two protocols in 18.5 kg/m2 ≤BMI ≦34.9 kg/m2 (p > 0.05), but there was a significant difference noted in the CTDIvol value between the 80 mm GSI z-collimation combination of low iodine load and routine CT scan protocol. In groups A, B, and C, there was a significant difference in CTDIvol in subgroups A1, B1, and C1 and was decreased by 45.57%, 61.92%, and 69.67% compared to subgroups A2, B2, and C2 (p > 0.05).
There was a good agreement between the two radiologists for head-neck CTA image quality evaluation (κ= 0.86). Overall image quality, noise, artifacts and visibility scores of images scanned at different scan protocols are summarized in Table 4. The overall image quality score was significantly (P < 0.001) lower in subgroups A2, B2 and C2 than in subgroups A1, B1 and C1. The mean number of head-neck CTA with an overall image quality score was 4.93±0.68 with GSI. The mean overall image quality score in the head-neck CTA studies with routine protocol (3D smart mA modulation technique) was 3.88±0.46 (as shown in Fig. 3 and Table 4).
Subjective Image Quality with different scan mode at different BMIs for R2
Subjective Image Quality with different scan mode at different BMIs for R2
Radiation dose descriptors for the six subgroups are shown in Table 5, Figs. 4 and 5. In group A, there were significant differences in the CTDIvol, DLP and ED between the two subgroups (P < 0.05), with the mean ED of 5.37±0.53 mSv for GSI and 11.98±1.68 mSv for routine protocol (3D smart mA modulation technique), showing a reduction of 55.18% (P < 0.01). In group B, a significant difference in CTDIvol, DLP and ED was observed between the two subgroups (P < 0.01). The mean ED value was 5.43±0.58 mSv for GSI and 17.89±3.63 mSv for the routine protocol, showing a reduction of 61.89% (P < 0.01). In group C, there were significant differences in the CTDIvol, DLP and ED between the two subgroups (P < 0.01). The mean ED value was 5.43±0.58 mSv for GSI and 17.89±3.63 mSv for the routine protocol, showing a reduction of 69.64% (P < 0.01).
Radiation dose and iodine intake with GSI and 3D smart mA in different BMIs
Radiation dose and iodine intake with GSI and 3D smart mA in different BMIs
Subgroups A2, B2 and C2 had a significantly higher iodine load than in subgroups A1, B1 and C1, respectively (1050±389 g vs 675±216 g, P < 0.005), and the total iodine load of subgroups A1, B1 and C1 were all reduced by 35.72%, respectively, compared with those of subgroups A2, B2 and C2.
Discussion
Head-neck CTA has a high sensitivity and specificity for the diagnosis of vertebrobasilar artery insufficiency, carotid stenosis or occlusion, and intracranial aneurysms in clinic. However, it has long scan range, and the scanning range contains organs sensitive to x-ray (radiation) such as the thyroid gland and eye lens. Higher radiation doses will cause potential radiation damage to these organs sensitive to radiation. In addition, with the increased use of CT angiography in clinic, the incidence of CIN has significantly increased. With the focus on radiological protection and iodine intake, how to reduce the radiation dose and total iodine intake has become the focus of the imaging industry and the imaging professionals [31–33]. In this study, we evaluated and compared the radiation dose and image quality between wide-detector combination of GSI with low iodine load and 3D smart mA modulation technique at different BMIs, as well as GSI combining ASiR-V in head-neck CTA. The results of our study indicate that better image quality, a lower radiation dose and lower iodine intake were achieved using wide-detector combination of GSI with low iodine load than using 3D smart mA modulation combined with routine iodine load for a head-neck CTA. The CT values in the subgroups A1, B1 and C1 (wide-detector combination of GSI with low iodine load) were significantly higher than in subgroups A2, B2 and C2 (3D smart mA modulation combination of routine iodine load), and the noises in subgroups A1, B1 and C1 were significantly lower than in subgroups A2, B2 and C2. Moreover, the SNR and CNR in subgroups A1, B1 and C1 were significantly higher than in subgroups A2, B2 and C2. Our results also showed that the radiation dose and total iodine intake in subgroups A1, B1 and C1 were significantly lower than in subgroups A1, B1 and C1.
Our results showed that better image quality was achieved using GSI combined with a wide-detector and low iodine intake than using the routine CT protocol for a head-neck CTA. This was mainly attributed to the GSI Xtream, which is the volume spectral CT technology designed to improve small lesion detection, tissue characterization and metal artifact reduction, across different anatomies and clinical use cases. This technology utilizes ultrafast kVp switching x-ray source (0.25 msec switching between two different energy levels of x-rays from view to view during a single rotation) and ultra-fast response gemstone clarity detector to acquire almost perfectly registered volumetric dual energy CT data. The GSI Xtream combined with a high frequency generator and Performix HDw tube with up to 80 mm GSI z-collimation has the capability to alternate between 80 kVp and 140 kVp in 0.25 msec, and the “retina gemstone detector” has a 0.23 mm spatial resolution and high efficiency transformation.
Our results showed that a low radiation dose was achieved using 80 mm GSI z-collimation combined with ASiR-V and low iodine load (iodine concentration of 270 mgI, 50 ml) than using routine CT protocol (3D smart mA modulation combined with iodine concentration of 350 mgI, 60 ml) for a head-neck CTA. This was mainly attributed to differences in the average mA of 80 mm GSI z-collimation (190 mA) which was lower than that in the routine CT protocol (100 to 500 mA, the mean mA was 358 mA), and the mean ED was 5.40±0.55 mSv for GSI and 14.68±2.76 mSv for routine CT protocol, showing a reduction of 63.22% in 18.5 kg/m2 ≤BMI <34.9 kg/m2 (P < 0.01). Unfortunately, a lower average mA value means high image noise and reduced image quality in the images of head-neck CTA. However, use of ASiR-V can reduce the image noise induced by the lower tube current. The ASiR-V algorithm focuses primarily on the modeling of the system noise statistics, objects and physics and de-emphasizes the modeling of the system optics. It is an advanced model based on the iterative reconstruction technology, which is designed to deliver reduced noise levels and improve low contrast detection ability and may enable up to 82% reduction in dose for all clinical applications. The ASiR technique is a reconstruction approach that improves the image quality and can also reduce the x-ray quantum noise induced by the lower radiation dose. In our study, we found that the ASiR-V technique can reduce the x-ray quantum noise and help improve the image quality in head-neck CTA performance using 80 mm GSI z-collimation combined with a low concentration contrast medium. Prior studies have shown that a maximum 57% decrease can be achieved in the GSI scan mode compared with the 3D smart mA modulation for head-neck CTA [34]. However, the results of this study showed that a wide detector combined with the ASiR-V technique reduced the radiation dose by an average of 82% compared to the 3D smart mA modulation for head-neck CTA in patients with different BMIs (18.5 kg/m2 ≦BMI ≦34.9 kg/m2). The head-neck CTA can be performed within 3.5 s with a wide-detector CT scanner in our study, much shorter than the routine CT scanning time of 6.8 s, and shorter scanning time can greatly reduce the radiation dose as demonstrated in our study.
CIN is one of the main risk factors for iatrogenic renal failure [35, 36]. To reduce incidence of CIN, reducing the iodine intake is also very important in patients with CTA examinations [37]. Our results showed that the use of 80 mm GSI z-collimation could achieve a lower iodine intake (270 mgI/ml, 50 ml) than routine CT protocol (3D smart mA modulation combined with an iodine concentration of 350 mgI/ml, 60 ml) for head-neck CTA, and the total iodine load in subgroups A1, B1 and C1 was all 675±216 g for GSI but 1050±389 g for routine CT protocol, showing a reduction of 35.72%, respectively. The use of 80 mm GSI z-collimation combined with a low iodine load (270 mgI/ml, 50 ml) can achieve not only a lower iodine intake but also better image quality than the routine CT protocol with the routine iodine load (350 mgI/ml, 60 ml), which was mainly attributed to using the volume GSI scan mode. GSI applied a single x-ray tube to alternate between 80 kVp and 140 kVp in 0.25 msec within a scan to generate 101 sets of virtual monochromatic images (MC) in the energy range from 40 keV to 140 keV. The MC of GSI at the optimal monochromatic energy level provides the possibility of improving the image quality of the head-neck CTA with low concentration medium. The optimal monochromatic energy ranges of the head-neck CTA were found to be from 53 to 57 keV in our study, and the optimal monochromatic energy allows a maximal photo-absorption effect of iodine, because the optimal keV is closer to the k-edge energy of iodine (33 keV) and can increase the target vein enhancement and the contrast between the image signal intensity of the target vein and that of the surrounding tissue. GSI improves image quality over conventional imaging techniques due to higher CNRs and reduces beam hardening artifacts due to different patient sizes and varied anatomical locations from chest to neck. Monochromatic images can also enhance material separation and quantify material information compared with the polychromatic (120 kVp) images. Lower noises and better image quality were achieved in our study using the 80 mm-GSI combined with a low iodine load than using the routine CT protocol for a head-neck CTA. The mean CNR and SNR in the 80 mm-GSI groups (32.2 and 30.8, respectively) were significantly higher than in the routine CT protocol groups (20.3 and 20.8, respectively).
Our study has several limitations. Firstly, the sample size of our study was not large enough and most patients had no digital subtraction angiography for comparison. Secondly, we did not evaluate the differences in image quality and radiation dose between 80 mm GSI z-collimation and 80 mm 3D smart mA modulation technique. Thirdly, ASiR-V is a third-generation reconstruction algorithm, and the most recent Veo is an advanced algorithm that can reduce radiation dose more efficiently. However, our CT scanner was not equipped with the Veo algorithm.
In conclusion, the radiation dose and total iodine intake are significantly decreased for the 80 mm GSI z-collimation combined with a low iodine load (270 mgI/ml, 50 ml) compared with the routine protocol (3D smart mA modulation, 350 mgI/ml, 50 ml) in head-neck CTA. The recommended scan protocol is 80 mm GSI z-collimation combined with a low iodine load (270 mgI/ml, 50 ml) and ASiR-V for head-neck CTA examination with a BMIs range of 18.5 kg/m2 ≦BMI ≦34.9 kg/m2.