
Abstract
The aim of this study is to present a fully automated registration algorithm that allows for alignment and errors analysis of the 3D surface model obtained from industrial computed tomography (CT) images with the computer-aided design (CAD) model. First, two pre-processing steps are executed by the algorithm namely, CAD model subdivision and representing models. Next, two improved registration procedures are applied including covariance descriptors-based coarse registration with a novel and automatic calibration, followed by a fine registration technique that utilizes an improved iterative closest points (ICP) algorithm, which is what we proposed with a novel estimation method for registration error. Finally, using a novel strategy that we proposed for error display, the quantitative data analysis results can simultaneously estimate both positive and negative deviation of the surface registration errors more precisely and fully expressed. Comparing to the original ICP algorithm, the quantitative data of experimental results demonstrate that the average registration errors of carburetors and valves are reduced by 0.80 millimeter at least. Therefore, this study demonstrates that the proposed new algorithm is not only capable of fully automating the registration of 3D surface model to a CAD model but also beneficial for quantitatively determining the surface manufacturing error more precisely.
Keywords
Introduction
Recently, with the rapid development of industry, the requirements for the performance and appearance of industrial products are constantly improving. How to evaluate and analyze the manufacturing quality of products has become an important issue. However, there is inevitably an error between the workpiece and its computer-aided design (CAD) model [1, 2], which might accentuate the problem of inefficient use of products. The industrial registration technology is a technique for analyzing the difference between the CAD model and the product manufactured according to the CAD model, and it is used to judge whether the surface shape and size of the product meet the design requirements or not. Meanwhile, computed tomography (CT) has also been increasing used in different industrial applications for non-destructive testing and flaw detection of industrial products [3, 4]. The registration approaches based on industrial CT can perform comparative analysis and errors measurement on the structure and shape of the product without damaging product itself. In the comparison analysis of the two models, the registration of 3D CT images obtained by the industrial CT to CAD models is essential and most of the registration methods are based on point clouds which are a set of data points in a three-dimensional coordinate system and these points are often intended to represent the external surface of an object.
In practical applications, the registration of actual 3D CT data to a CAD model has been approached in different ways. The most shared method is to manually select the corresponding feature points, such as the edges or corners of the model that must be clearly identifiable in data sets. However, the accuracy of registration of these methods is influenced by human interference. Furthermore, particularly the operator may have to zoom in, zoom out, through the data sets to find the corresponding feature points, which could further degrade the accuracy of the experimental results. Hu et al. [3] compared the 3D printed wax pattern of the maxillary complete denture with its CAD model and analyzed the surface deviation of denture. In 1992, a semi-automated approach [6] was proposed to improve the robustness of registration results produced via the manual method; the registration was performed by manually selecting three pairs of corresponding points at least and then refining the result by applying an iterative closest point (ICP) algorithm. Since these method [5–7] involves manually selecting feature points, it does not always lead to prospective results, which makes it arduous or impossible for this approach to be applied in determination of surface manufacturing error between 3D CT data and CAD model. For the purpose of reducing the considerable human interventions involved in the alignment process, Pinter et al. [8] compared the two models according to the shape distribution of the solid model, and the approach is applicable to any file format models comparison. However, the procedure of obtaining shape of the distribution is complicated generally. Therefore, we might fail to acquire registration deviation without objective error analysis.
More recently, Rae [9] constructed a system framework based on tangent plane for non-rigid registration. In 2010, Bernardini [10] conducted initial registration by using surface curvature and SURF. Kim [11] proposed automated registration of 3D scanned data to a CAD building model. Although these approaches in the papers [7–11] can achieve automatic registration, there is still overwhelmingly little scientific understanding of visual effects revealing registration results and objective evaluation of registration accuracy. In2008, the L-BFGS [12] algorithm was an improved algorithm of BFGS [13], which was utilized to achieve high-precision registration. However, the nonlinear equations involved in the method are more complicated to be solved and deducted. Ran applied the genetic algorithm to the Powell algorithm [14], which makes the registration parameters close to the global optimum with a certain precision, but the steps of the genetic algorithm increase the complexity of the optimization algorithm. However, the feasibility of the algorithm remains to be studied. Tong L and Ying X [15] proposed a registration method based on point cloud 2D texture features and 3D curvature features. This method can obtain high-precision registration results. However, its drawback is that the texture information of the 3D model needs to be acquired in advance, otherwise it may cause undesired effects. These research avenues [12–15] enable automatic registration with pleasurable registration accuracy guarantees, but they are either too complex or low in feasibility.
In 2007, Akca [16] finished co-registration of surfaces by 3D least squares matching, and the experiment had a favorable result. However, the method has not been widely utilized for some software debugging cases. In 2014, Theiler [17] and his partners proposed a method to automatically register two-point clouds acquired with a terrestrial laser scanner without placing any markers in the scene, but robustness to repetitive and symmetric structures must be improved continuously. In 2015, Yang [18] had proposed an optimization method by hybridizing the L-BFGS-B method for medical image registration, their future work will be focused on the robustness of the method. In 2016, Chen H [19] and his workmates had presented a 3D registration based on perception, a coplanar 4 points set registration algorithm was utilized to align the point cloud and CAD models point cloud, they pointed that the result could be improved by a much more accurate method (using a high-resolution scanner in the future). The strategies in these papers [16–19] enable automatic registration, but they are low in robustness. Therefore, from registration pre-processing to registration errors analysis, we strongly expect that the entire process is fully automated, concise and robust. Additionally, the registration results and its errors could be displayed more accurately with favorable visual effect. Table 1 summarizes above reviewed registration methods and their basic characteristics.
Summary of the reviewed registration methods published in literature
Summary of the reviewed registration methods published in literature
The aim of this work was to propose a Fully Automated Registration of 3D CAD model to Surface model (FARCS) obtained from CT images for analyzing surface manufacturing errors of industrial products more accurately so that we can overcome tedious manual intervention and underdeveloped visual effects of displaying registration result and its errors. An overview of the technical route of comparison is provided in Section 2, and detailed explanation is introduced in Section 3. In Section 4, experimental results and discussions by the proposed procedure are presented. Finally, conclusions are given in Section 5.
In this section, we present the modified technical route of fully automated registration between 3D surface model restructured from CT images and a CAD model for analysis of surface manufacturing errors in industrial products.
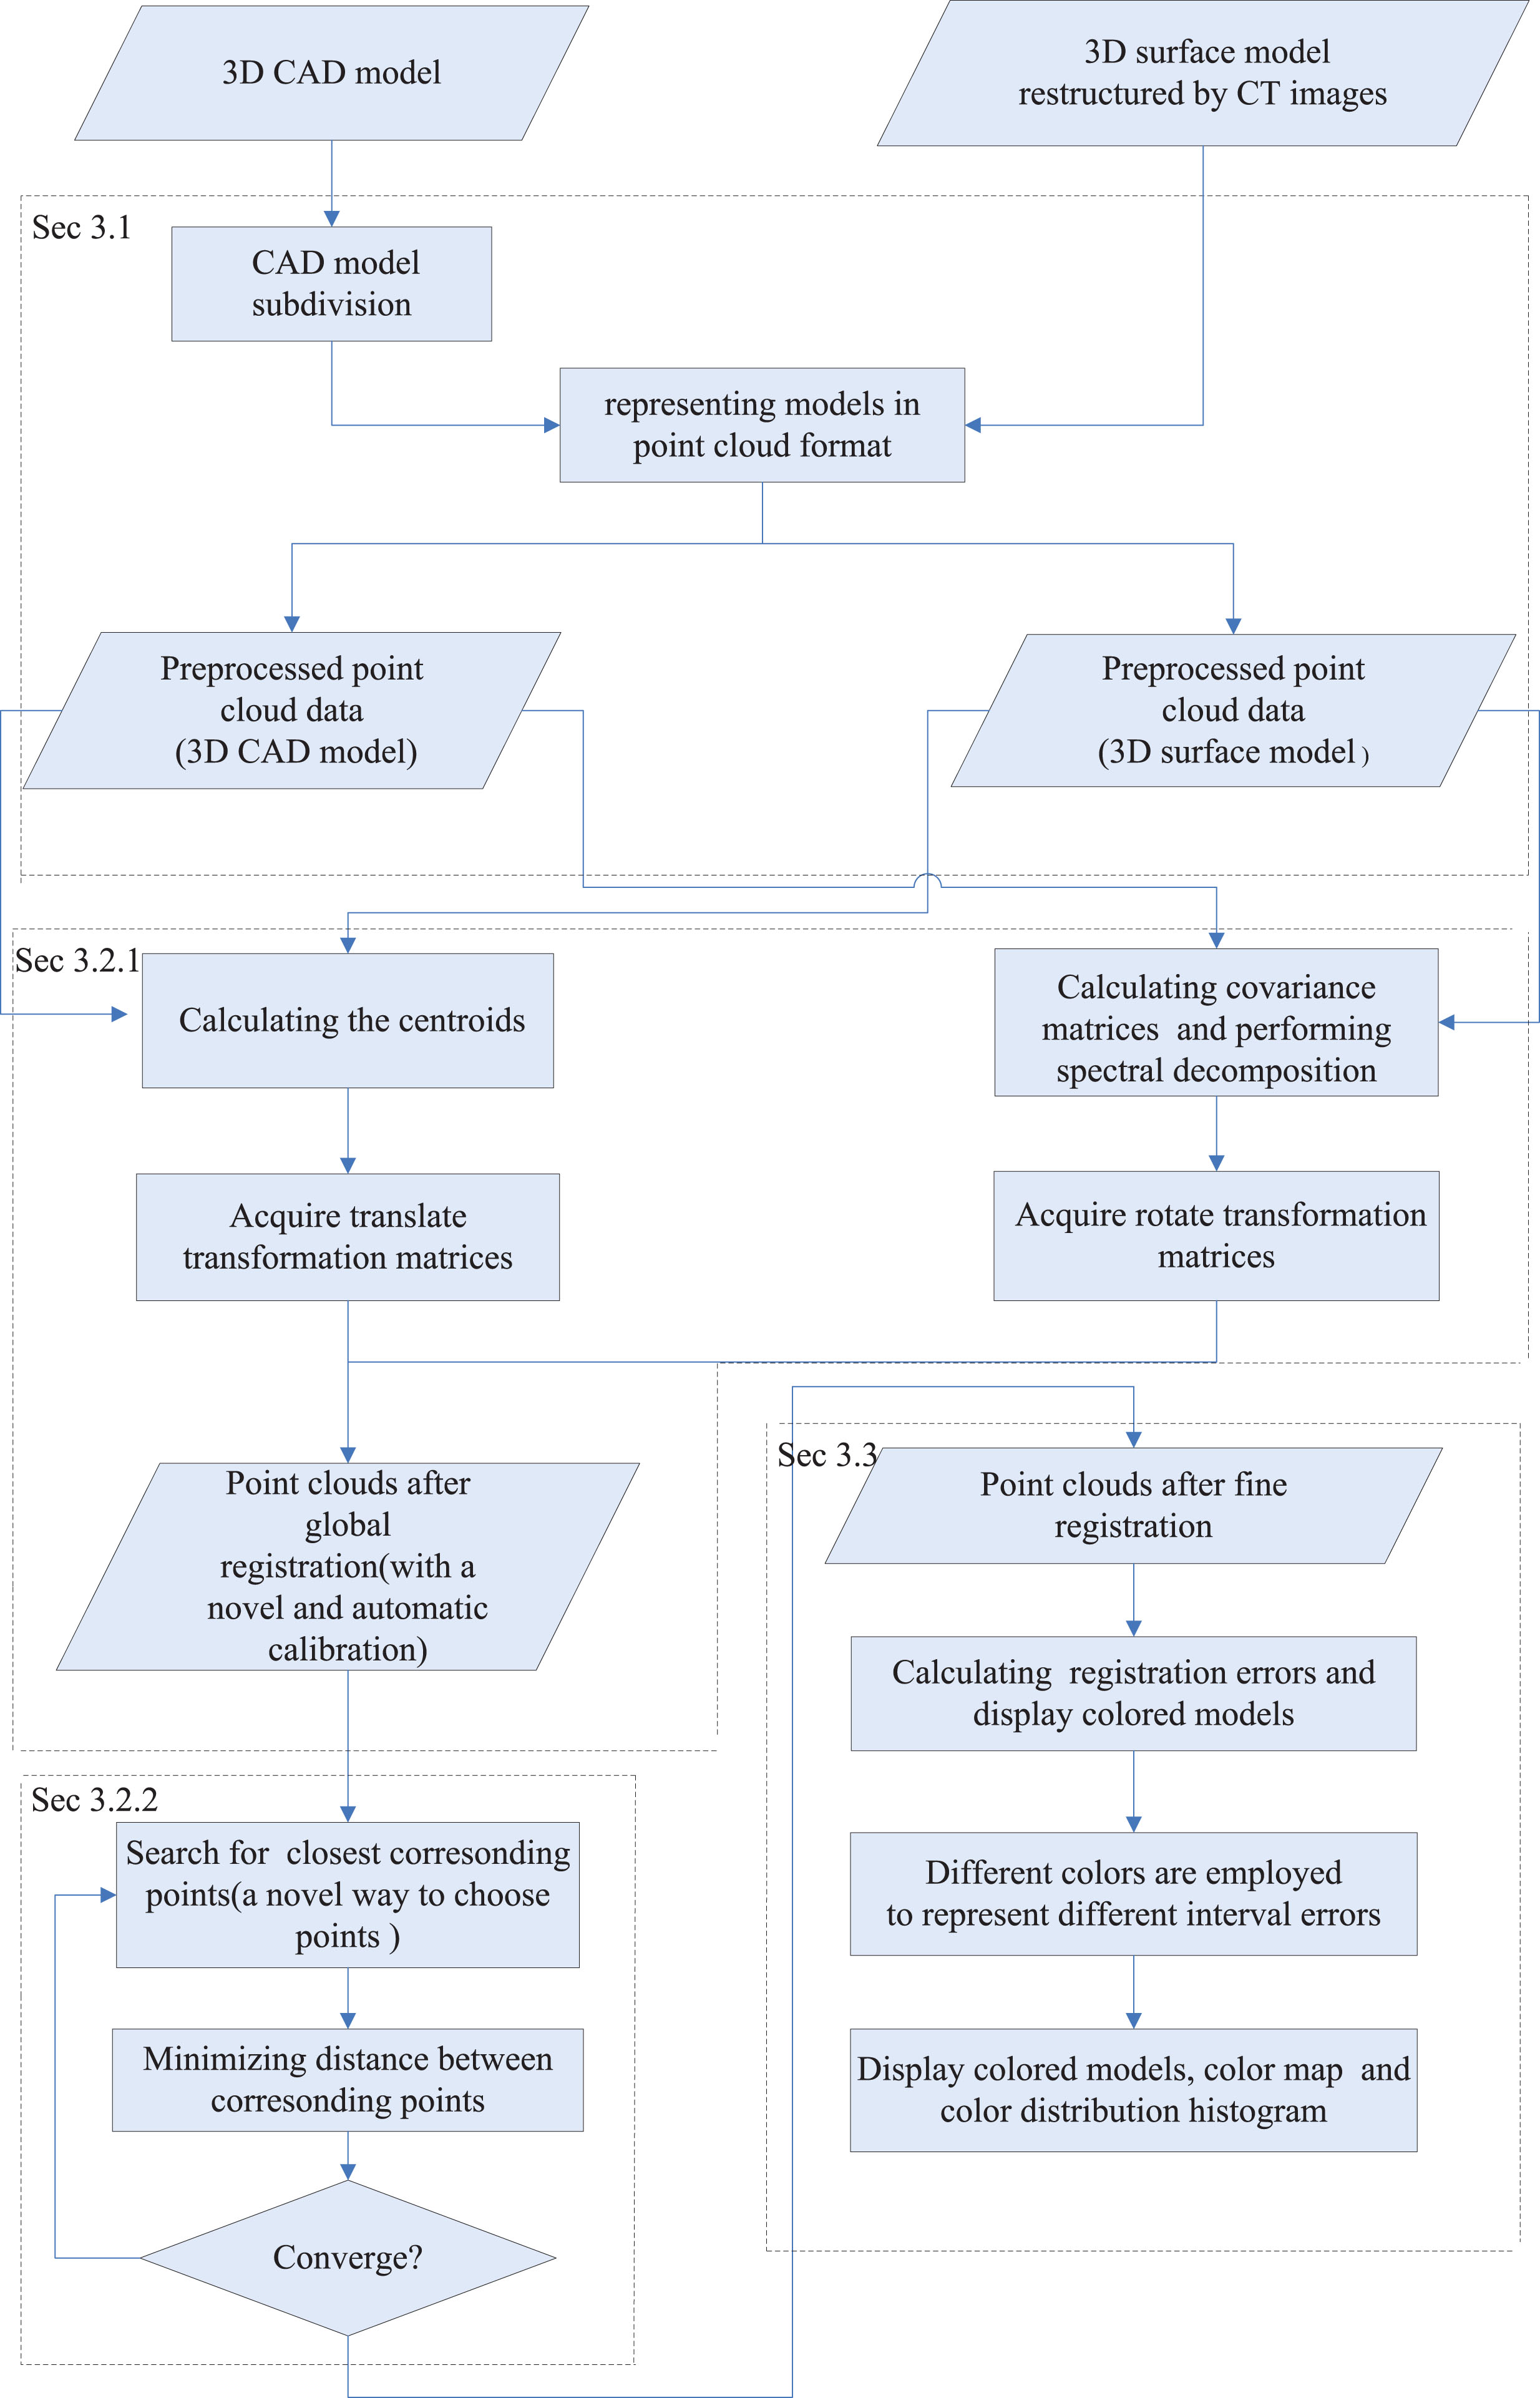
As is illustrated in Fig. 1, the first stage consists of two steps of pre-processing of the CAD model and 3D surface model: CAD model subdivision, representing models in point cloud format. What’s more, it must be mentioned that if we convert the CAD model into a point cloud directly, the points obtained will be too sparse to express the characteristics of the model, and thus will not satisfy the conditions of application of the subsequent methods, eventually leading to the failure of registration. Therefore, before turning a CAD model into a point cloud, we first use the triangle mesh subdivision algorithm to refine the model until the number of triangular facets obtained is comparable to that of the 3D surface model. 3D surface model and CAD model are represented in the point cloud format where the number of two formal points is roughly equivalent. The pre-processing is explained in detail in Section 3.1.

Diagrammatic sketch of Loop Subdivision algorithm (a) The original triangle facets (b) Subdivided triangle facets.
Once finishing the pre-processing, the registration of pre-processed 3D data to the pre-processed 3D model is conducted in two distinct steps: coarse registration and fine registration. In coarse registration, a translation transformation matrix is obtained by calculating the centroids of two-point clouds, and covariance descriptors are utilized to make an estimate of initial posture of two-point clouds by means of calculating covariance matrices, followed by acquiring rotate transformation matrices via performing spectral decomposition on the covariance matrices. For the purpose of completing coarse registration, we translate the source point cloud (from the restructured model) onto the target point cloud (from CAD model) with the translation matrix, and then apply rotate transformation in the source point cloud with the rotation matrices. Aiming at the abnormal coordinate axis differ by 180°, we count that the undesired phenomenon can be revised by the approach we proposed. However, the coarse registration may not lead to optimal registration of the data. Hence, fine registration is indispensable for further registration. Fine registration is carried out in a way that can achieves the optimal registration by advanced Iterative Closest Points (ICP) algorithm with a novel and comparatively precise estimation of registration errors. The coarse-to-fine registration procedure is introduced in Section 3.2 comprehensively.
After addressing registration, we made an objective evaluation of the accuracy of registration by providing a novel way to display registration errors. (See Section 3.3) Adopting this approach, we could acquire registration deviation more precisely that made the surface registration error fully expressed. Different colors are employed to represent different interval errors of models, which can reflect the manufacturing error of the product more authentically than that of the traditional expression by point cloud. (See Section 3.4)
Pre-processing
Subdivision of CAD model surfaces
The basic idea of subdivision surface is that each subdivision is a new vertex inserted on the edge of each triangle. Loop Subdivision algorithm is applied in the first step of pre-processing. The Loop Subdivision algorithm [20] is a subdivision strategy based on triangle facets. The subdivision process comprises two steps: generating edge points, taking the resulting edge point as a new vertex. As is vividly demonstrated in the Fig. 2, the edge A1A2 can generate edge midpoint B1, A1A3 can generate edge midpoint B2, A2A3 can generate edge midpoint B3, in the process of generating edge midpoints, one triangle (see Fig. 2.: Δ A1 A2 A3 or Δ A4 A1 A3) is divided into four triangles.
Overall flow chart of the registration of 3D CT data to CAD model.
Similarly, for each triangular facet of 3D CAD model, subsequently, replaced the original vertices with a new edge point to create new facets. If needed, iteration is performed until the number of triangular facets meets the requirements. In order to facilitate the calculation, we hope that the number of triangular facets obtained is roughly equivalent to that of the 3D surface model restructured from CT images.
In this section, all we have done was to transform the models into point clouds; whether they were 3D surface models obtained from CT images or subdivided CAD models. In general, 3D surface model restructured from CT images is in STL (stereo lithography) format [21]. A STL file is a file format utilized to represent a triangle mesh in a computer graphics application. Each surface is composed of triangular facets, each of which is composed of three points. The coordinate information of the points can generate a series of spaced 3D points which were rendered in point cloud format [22]. Similarly, for 3D CAD model. During the experiment, 3D surface models were converted into the source point cloud, and CAD models were transformed into the target point cloud.
Registration
Covariance descriptors-based (CDB) coarse registration with a novel and automatic calibration of coordinate axis differ by 180°
Once the preprocessing was completed, the process of coarse registration is carried out. Prior to commencing the coarse registration, the centroids of the two-point clouds were separately calculated. The centroids were set as
CDB registration [23, 24] made it possible to estimate the position and orientation of the industrial product relative to the CAD model through the two data sets. Specific steps are as follows.
Given data sets in point cloud format, the covariance matrix Cov
k
is defined as follows:
Equation (1) was used to calculate the covariance matrices of the two-point clouds, respectively. After undertaking the calculation of covariance matrices, spectral decomposition (Equation (2)) was applied in covariance matrices to acquire the eigenvalue and eigenvector:
The rotation matrix is described in Equation (3):
Finally, the source point cloud was transformed by the rotation matrix R and the translation matrix T to obtain the result of coarse registration.
Typically, the eigenvectors calculated by the mathematical method did not enjoy a specified direction, consequently, even if the eigenvectors were arranged according to the size of the corresponding eigenvalues. Since the two directions of the coordinate axis might differ by 180°, we determined whether the two-point clouds were almost coincident or not by establishing the minimum bounding box. If the difference between the maximum values of the two bounding boxes was greater than a certain threshold, then we assume that the two-points of the cloud were not coincident. In order to solve the problem that the directions of eigenvectors are 180°apart, innovatively and simply, the source point cloud was respectively carried out by mirror transformation about the three planes that are front, top and left reference planes (See the gray area in Fig. 3) by three times so that the posture of the two-point clouds roughly overlap.

Mirror transformation’s reference planes (front, top and left) (a) Before mirror transformation (b) After mirroring.
Instead of regarding point-to-point distance as the registration error, we innovatively calculated the registration error by measuring the distance from the points on the surface model restructured from the CT images to the local surfaces of 3D CAD model. Directional distance d is calculated as follows:
The point-to-plane distance formula has been illustrated in Equation (5), let P = (x0, y0, z0) be a point on the source point cloud, for a plane Ax + By + Cz + D = 0 fitted by points on the target point cloud, taking any vertex Q
i
in the plane as is described in Fig. 4, where Q1 = (x, y, z) is selected, P is connected with Q1, while

Schematic diagram of distance of point to plane or vertex.
The above analytic process proves that the distance from a point P on the source point cloud to the plane is shorter than the distance from P to the vertex on the plane. It is further proved that the proposed approach could calculate registration error with higher precision than the previous method which takes the point-to-point distance as the registration error.
On the basis of the above explanation, we proposed an improved ICP-based strategy of registration with novel registration errors estimation. For each point P i in the source point cloud (from restructured model), match the closest and every point q i of vertical distance (according to the Equation (5)) in the target point cloud (from CAD model). First, use a rigid transformation that minimized the distance (see Equation (5)). Subsequently, at the optimum, this technique made each source point aligned with the found matching point, optimizing the ICP parameters and transformation matrix simultaneously, followed by the optimization, the source point cloud was transformed by the resulting rigid transform matrix. Finally, iterate through the process until f (see Equation (6)) was less than a given threshold or the number of iterations was greater than the preset maximum number of iterations.
The values of calculated errors were classified by multiple intervals, and different colors were represented to different intervals. Each point was dyed into a corresponding color, since each triangular facet was composed of three points, and the triangular facets were dyed into a corresponding color. Therefore, colored models with error information were displayed, for the convenience of calculation; we chose CAD models as rendering objects. In addition, the number of points in each interval were counted and displayed in the form of graphs and tables. Finally, the correlation between the number of iterations and the registration error was displayed in the form of a scatter plot with a flat line.
Pseudo code
The pseudo codes of the registration and error analysis algorithm is as follows:
Results and discussion
This section introduces experiments we have conducted, consisting of three actual experiments for a bearing housing, a carburetor and a valve. Operations of this study was implemented in C++ with the help of the Point Cloud Library 1.8.1 and OpenGL on a PC with Windows 7, Intel (R) Core (TM) i5-3230M 2.60 GHz CPU and 8.0 GB RAM.
Experiment for bearing housing model
Pre-processing result
When turning to the first actual experiment, we chose the bearing housing as the experimental object. The number of triangular facets of the CAD bearing housing model is 1330, as is revealed in Fig. 5 (In red), and 3D surface model restructured by industrial CT images is demonstrated in Fig. 7 (In green), the number of its facets is 141348.

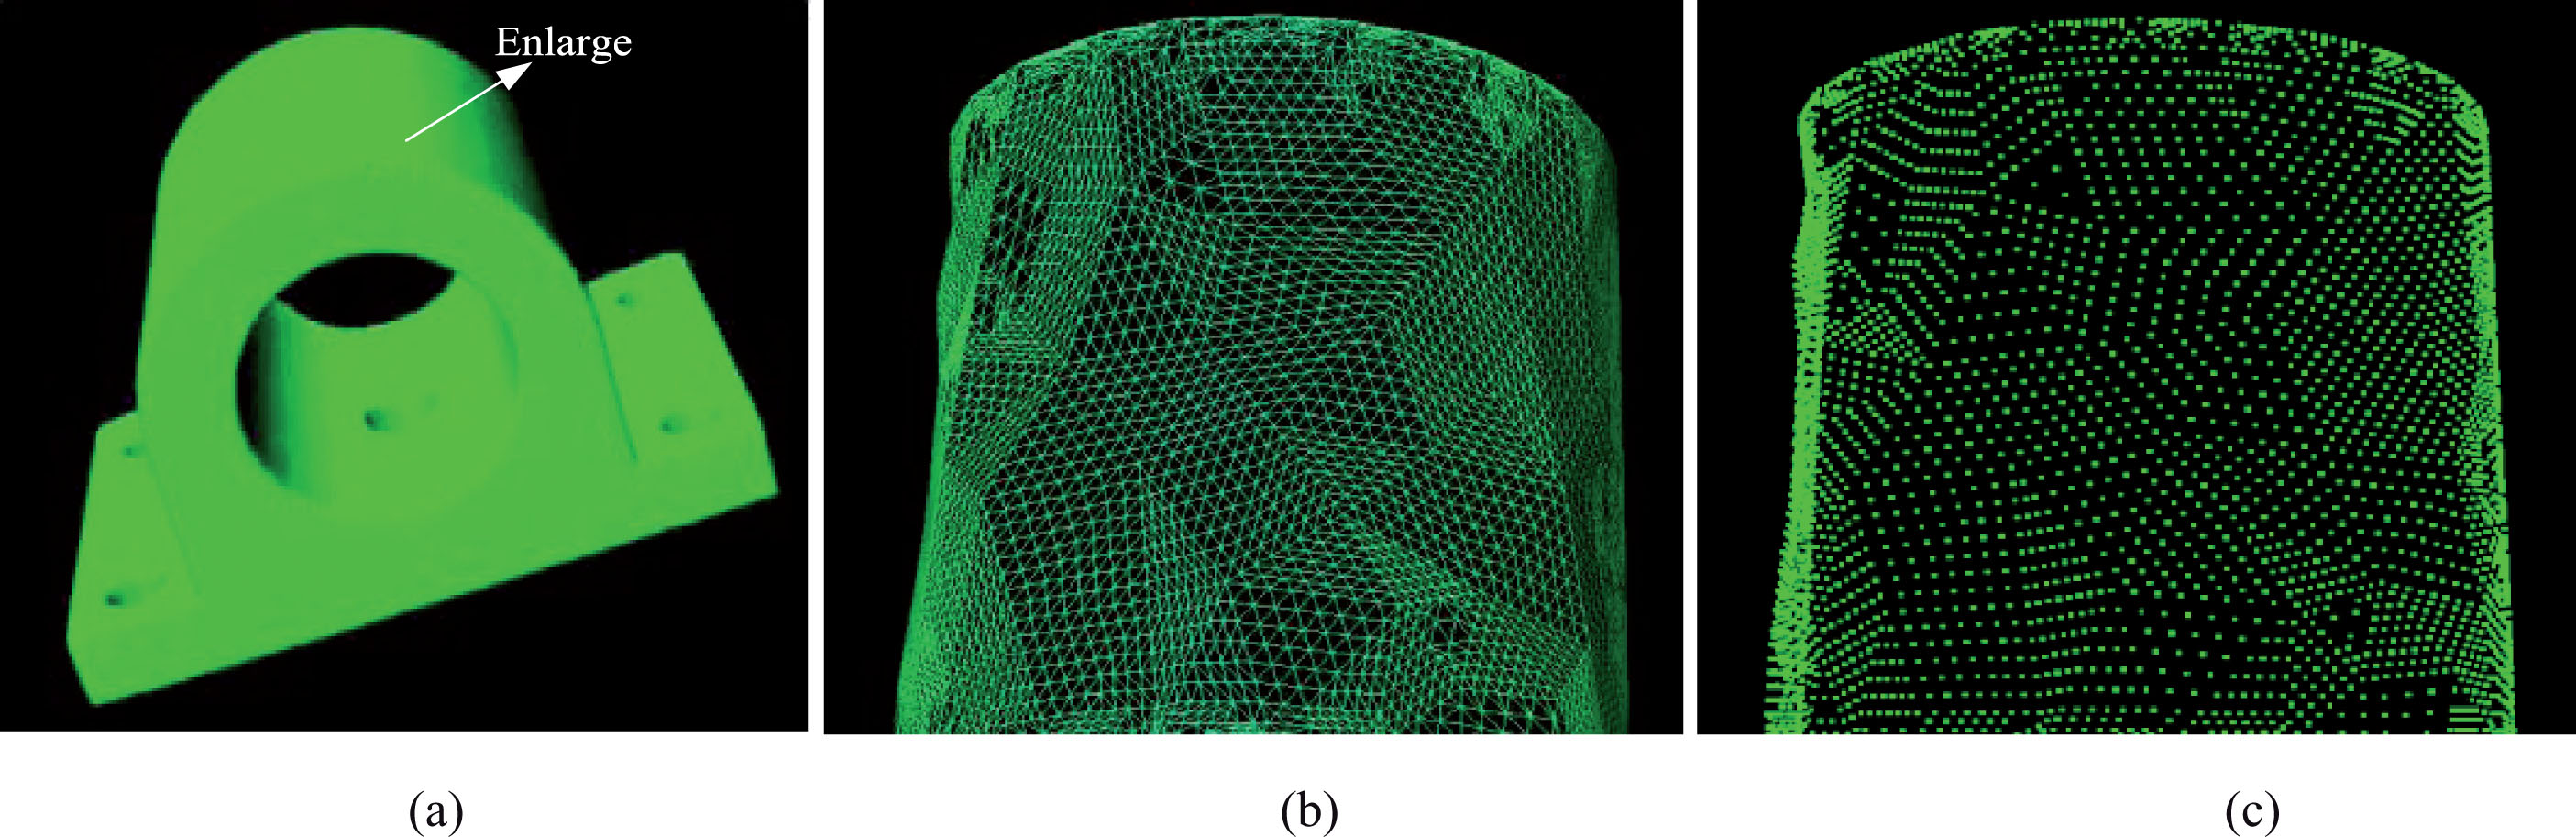
The CAD model (bearing housing) (a) Original CAD model in a surface-based representation (b) Partial enlargement of original CAD model in a wireframe-based representation (c) Partial enlargement of original CAD model in a point-based representation (d) Subdivided CAD in a surface-based representation (e) Partial enlargement of subdivided CAD model in a wireframe-based representation (f) Partial enlargement of subdivided CAD model in a point-based representation.
The CT slice of the bearing support is shown in Fig. 6. The MC(Marching Cubes) algorithm is used to render the slices into 3D images. Marching cube is a voxel-based surface rendering algorithm. The basic idea is to process each voxel in the data field according to the isosurface. Actually, the surface of an object is a closed gray contour. The surface of the object is reconstructed by isosurface extraction.

CT slices of bearing housing.
Since the CAD model contains few (1330) triangular facets (see Fig. 5(a)), the number of points (1126 points) obtained by the discretization is too small to embody the feature of the bearing housing model. As is indicated in Fig. 5(b) (c), the sparse points or wireframes of upper surface enlargement in the graph cannot reflect the real model itself.
The number of triangular facets of the refined CAD model was about 140087 (see Fig. 5(d)), which was approximately equivalent to that of surface models (see Fig. 7(a) (b) (c)). There was an obvious difference between the two conditions: subdivided CAD model in point cloud or wireframe format (see Fig. 5(e) (f)) can represent the feature of the model more realistically. Since the source and target models were rendered in a point cloud format, our preprocessing has been completed. The 3D surface model of bearing housing was converted to a source point cloud, and the CAD model is converted to a target point cloud. Thanks to the sufficiently triangular facets of the two models, more points can be obtained when a refined model was represented in a point cloud format (contains 70816 point).
The 3D surface model restructured by industrial CT images (bearing housing) (a) The 3D surface model in a surface-based representation (b) Partial enlargement of 3D surface model in a wireframe-based representation (c) Partial enlargement of 3D surface model in a point-based representation.
The strategy we proposed is CDB coarse registration with automatic calibration of axis. There were enough points to be expected to satisfy the condition of using CDB registration. Simply carrying out the approach can trigger that the source point cloud roughly overlapped with the target point cloud and its result for the bearing housing is demonstrated as Fig. 7(a) (b), on these results, there is no doubt that the alignment carried out by CDB registration method failed to optimize registration, which might lead to difficulties when determining manufacturing error. Thus, fine registration (see Fig. 7(c) (d)) was indispensable for the purpose of improving on the coarse alignment.
During the coarse registration, we have obtained the initial value of the rigid transformation required for fine registration, which avoided the situation that the ICP-based registration falls into the local optimal solution. It can be seen from Fig. 8(c) (d) that the fine registration based on the improved ICP algorithm we proposed has promising results, and the two-point clouds are closely aligned. This state was the optimal solution for two-point cloud registrations after iterating for about 20 times, laying a solid foundation for subsequent error analysis.

Registration results for bearing housing in point cloud format (a) Coarse registration (in a wireframe-based representation) (b) Coarse registration (in a point-based representation) (c) Fine registration (in a wireframe-based representation) (d) Fine registration (in a point-based representation).
Instead of just displaying models in point cloud format, the novel approach of improved ICP fine registration has the ability to present the positive and negative deviations by calculating the point-to-plane distance, which can reflect whether the actual model is convex or concave relative to the CAD model, so that the models could be displayed more intuitively and realistically, which plays a significant role to determine whether the industrial products meet manufacturing requirements or not. As we can see in Fig. 9, there are results and error gradation map of registration of the 3D surface model to the CAD model (for bearing housing). Statistics for the points in each interval of the surface deviation calculated by the proposed method are shown in Table 2. The distribution of the error (surface deviation at a certain point between registered 3D CT data and CAD model and it was a certain value) and the count (the number of points where the deviation was a certain value) are illustrated in Fig. 10. What’s more, the correlation between iteration number and average registration errors is reflected in Fig. 11, where the average error converges to 0.02 mm after about 20 iteration.
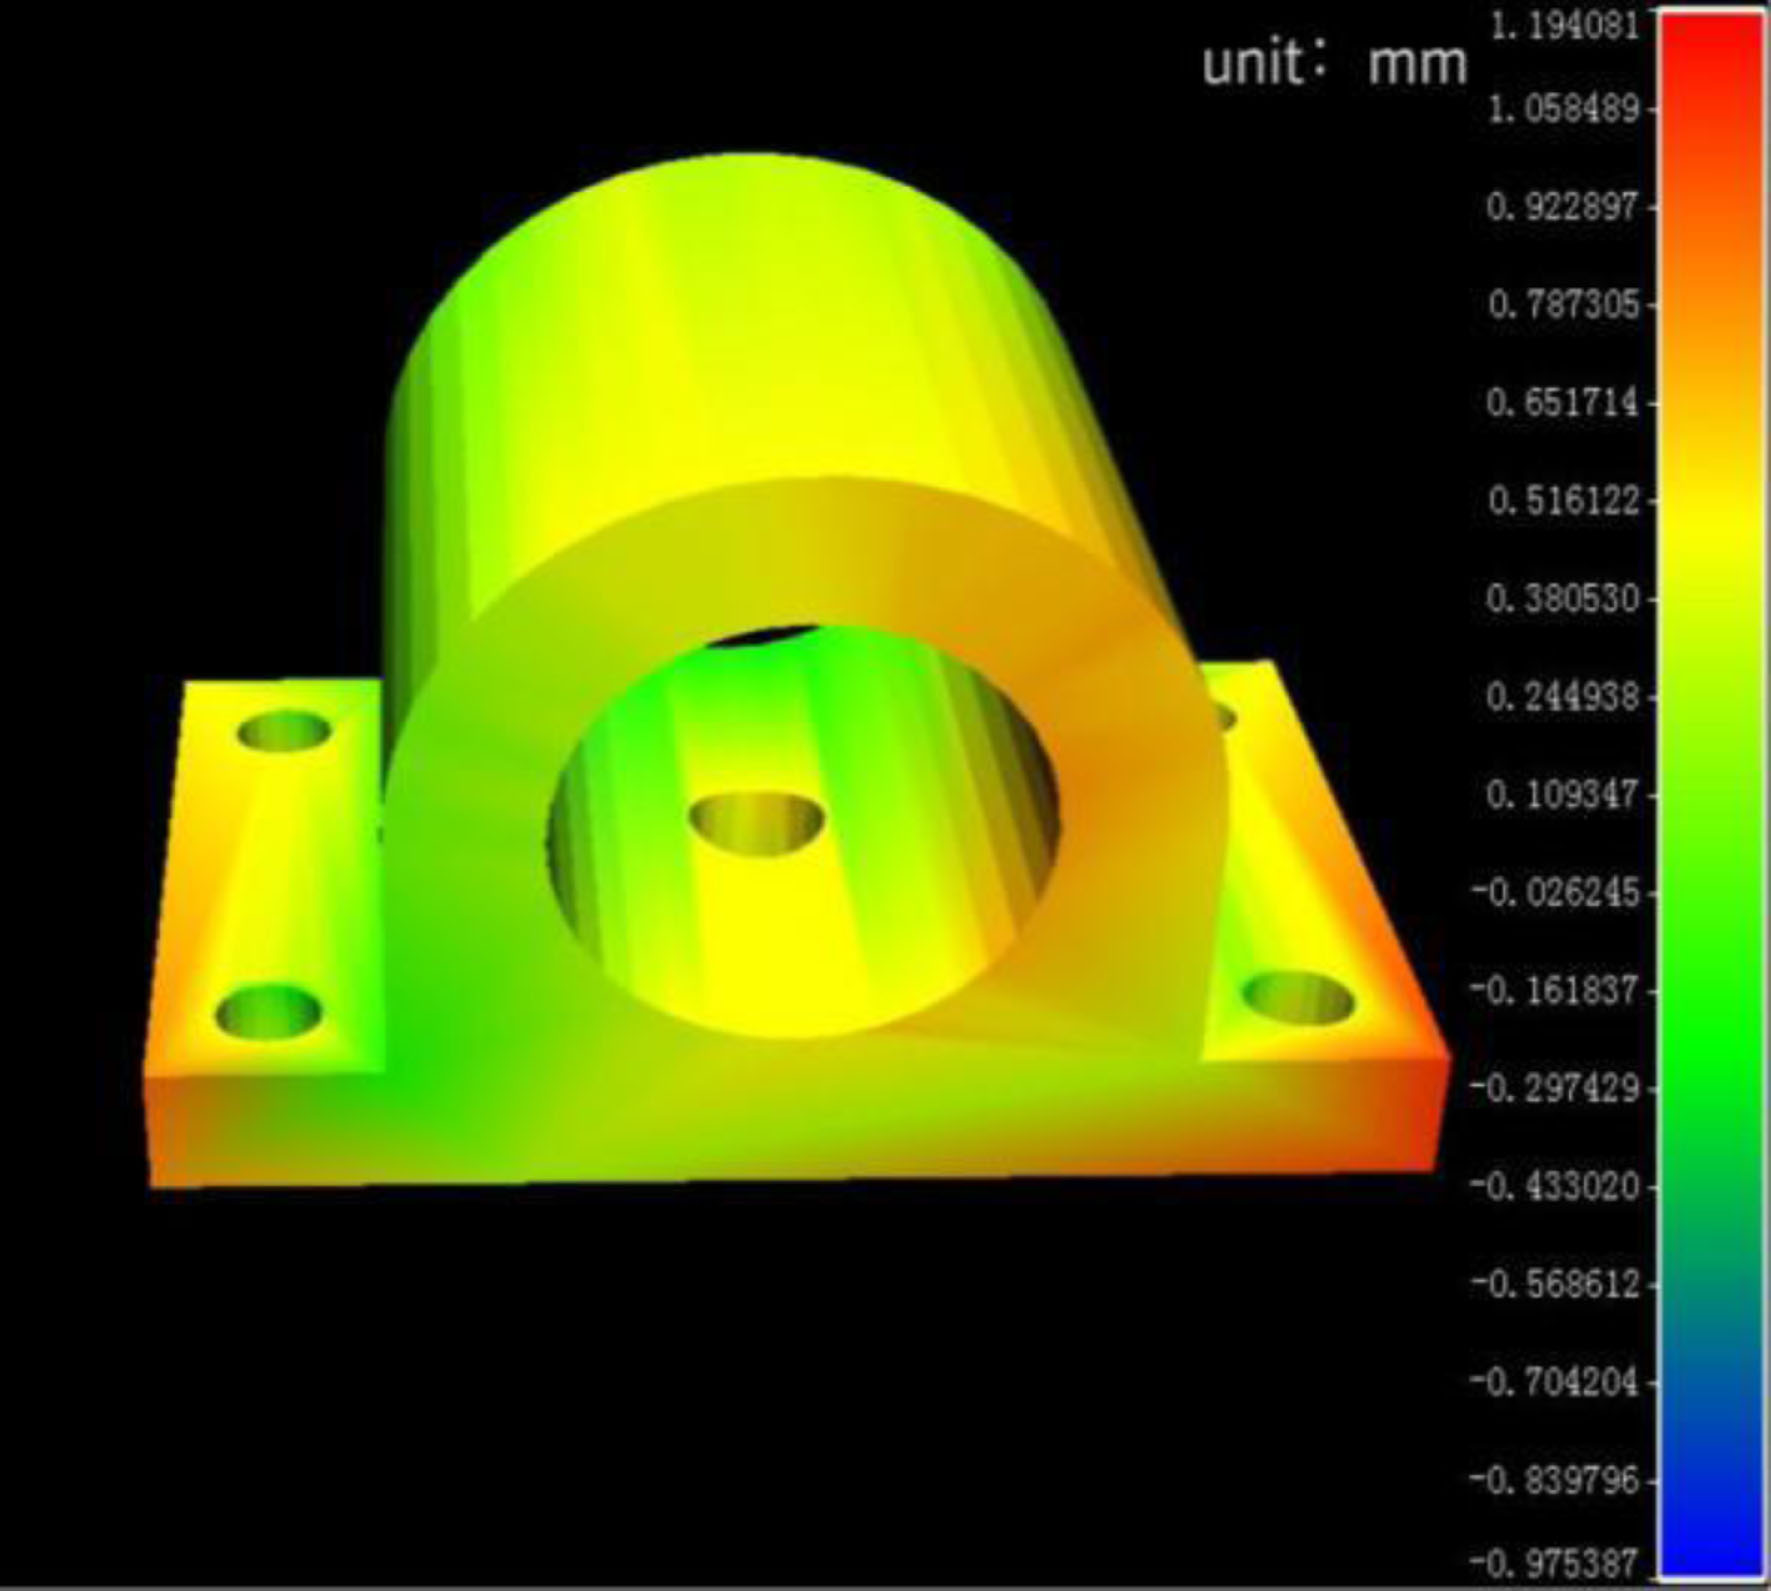
Registration results of bearing housings and color map of surface manufacturing error.

Histogram of bearing housings of registration errors.
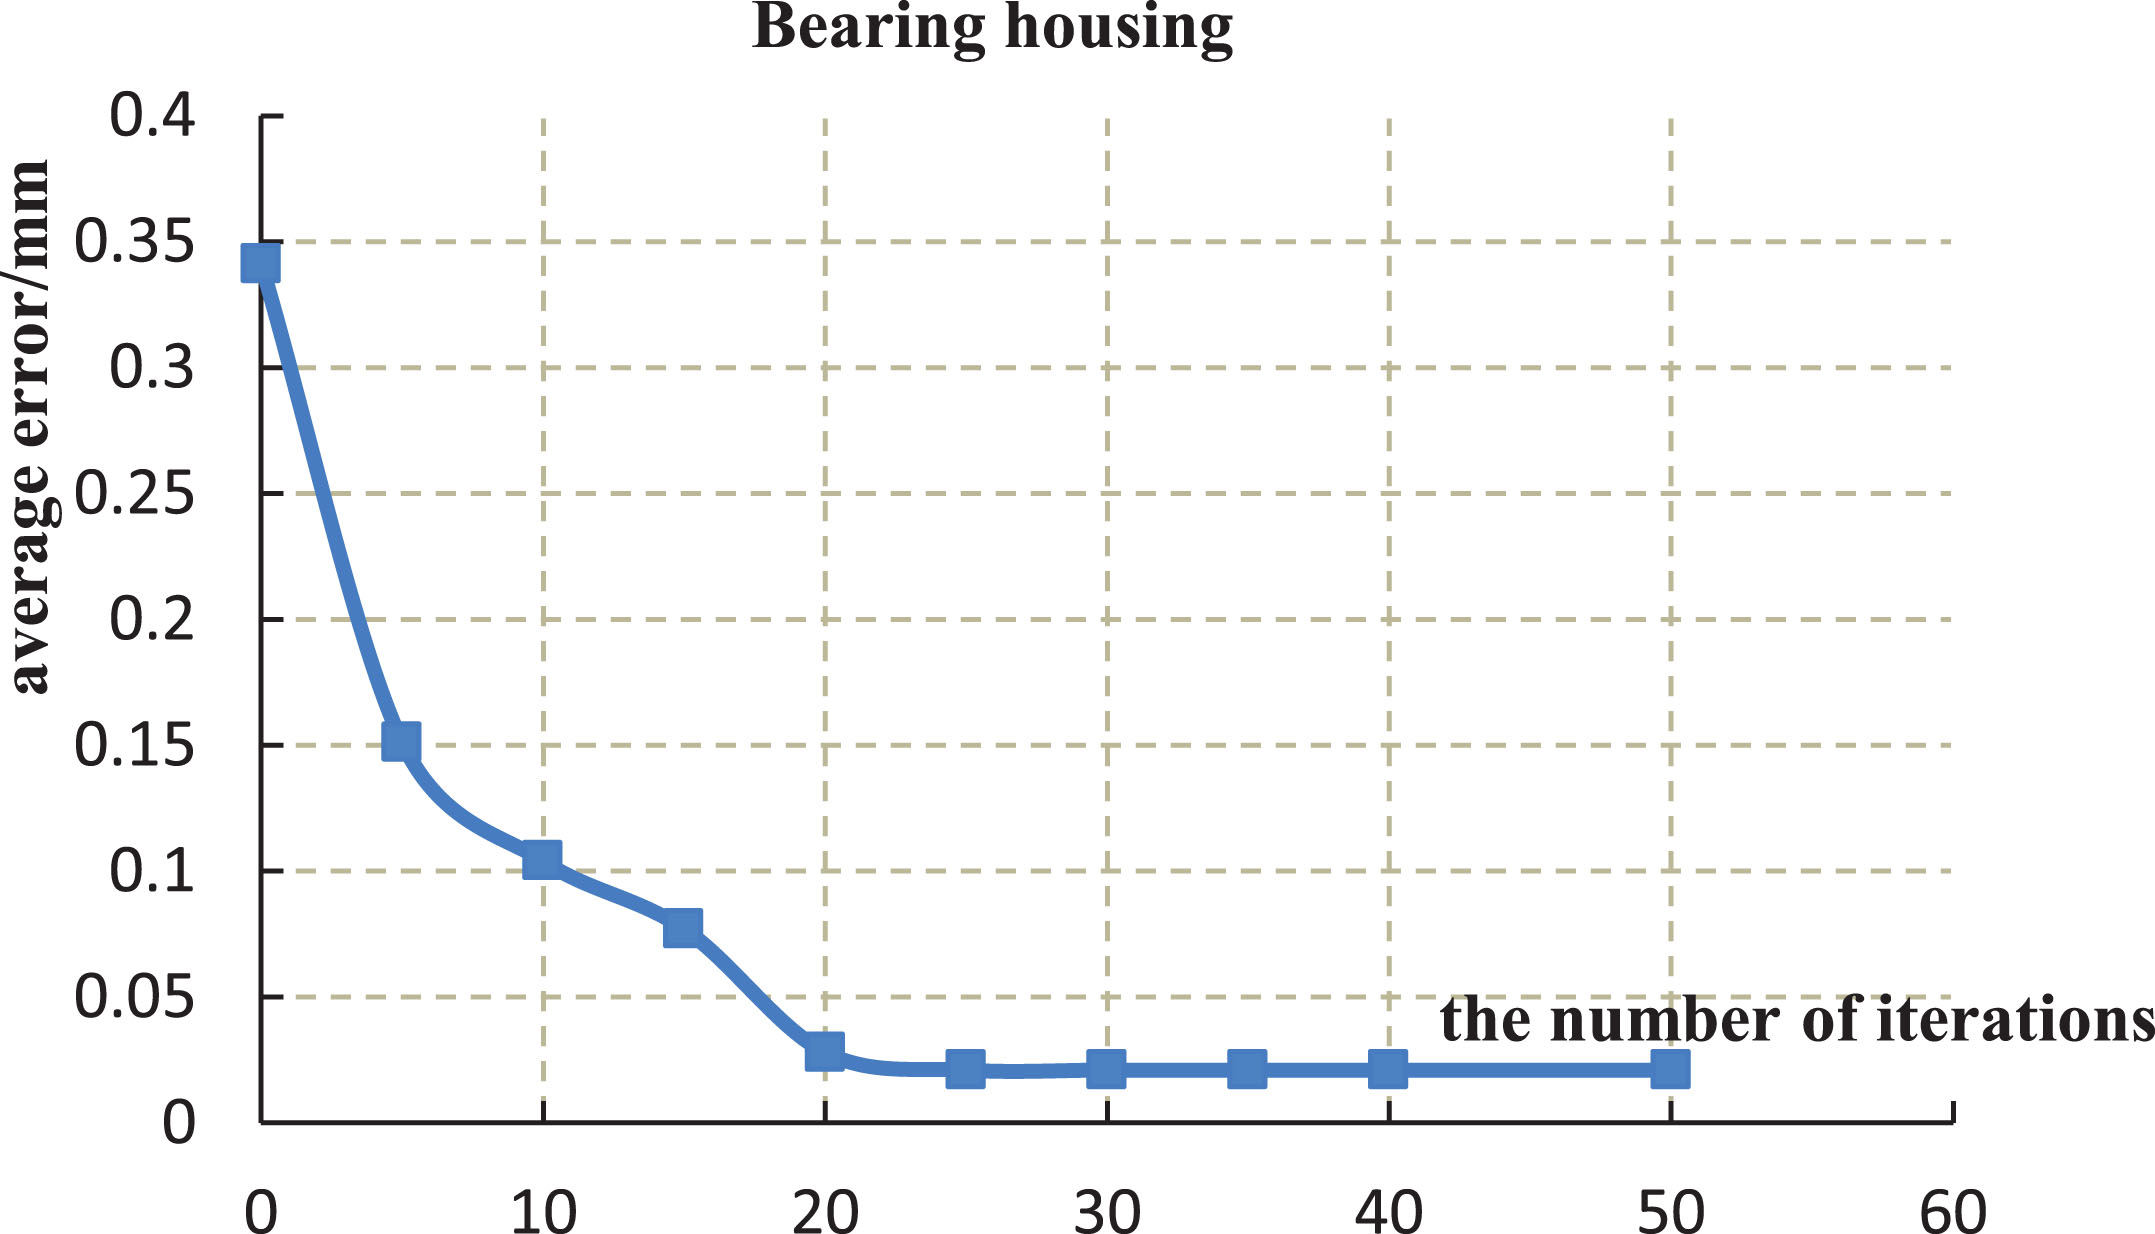
Correlation between number of iterations and average error for the bearing housing.
In order to make the novel strategies we proposed for registration as fully explained as possible, the juxtaposed experiment for the registration of more complex artifacts, such as carburetors and valves, was conducted. The carburetor and valve are key components in the engine, and their slight changes can affect the performance of the vehicle. In order to determine whether the valve and the carburetor are abnormal, we respectively utilized our improved strategies and the original CDB + ICP registration algorithm to align the subdivided CAD model with the reconstructed model obtained by CT scanning the actual industrial product, and further elaborated the upgrade of improved methods. The CAD models of the carburetor and the valve were designed with software component (Solidworks). The parameters of the industrial products are illustrated in Table 3.
Count statistics for each interval (bearing housing)
Count statistics for each interval (bearing housing)
Parameters of the industrial products
There reveal the registration results by the original method of the valve and the carburetor in form of wireframe in Fig. 12 (a) and (c) respectively. Further analysis alluded to the notion that since the point-to-plane distance was utilized as the registration error by the improved ICP algorithm, the registration error displayed by the gradation diagram with a wider range of colors had both sides of values instead of only positive value. When the proposed method is executed, the errors calculated out contain both positive and negative values that map to a colormap which shows errors from blue to green to red (see Fig. 12 (b) and (d)). These issues emerging from this finding relate specifically to the limitations of the original method: it can neither reflect the real model nor reflect the positive and negative registration errors simultaneously. In the current study, comparing the conventional method with the proposed method manifested that our strategy is superior to original method in terms of accuracy and visual effects as shown in Fig. 12.

Comparison results of original CDB + ICP method and proposed method (a) the original CDB + ICP method (for the carburetor) (b) the proposed method (for the carburetor) (c) the original CDB + ICP method (for the valve) (d) the proposed method (for the valve).
It is worth noting that areas where significant differences have been observed include the original approach and the proposed one. As is demonstrated in Fig. 12(a) and (b) or Fig. 12(c) and (d), the result of using our method as shown in the marked area shows that the negative error is shown in blue in the Fig. 12(b)(d). Conversely, with the original method, the negative error is still displayed as orange-red in Fig. 12(a)(c). That means products with small sizes might be mistaken for too large, that will adversely affect the utilization of the industrial products.
Many preceding evidences suggest that the proposed registration strategy is obviously more superior than the original one not only in visualization, but in precision. Since the improved method we proposed has a certain improvement over the original method. Consequently, Fig. 13 and 14 show the deviations distribution with the detailed statistics of the points presented in Tables 4 to 7. In addition, Fig. 15 and 16 further summarizes the superiority of our method in registration accuracy by setting different iterations and calculating the average error for each registration. Adopting our method, we could find out that the average errors of carburetors and valves converge to 0.51 mm and 0.12 mm respectively. While using the original algorithm, we could see the average errors converge to 1.32 mm and 0.92 mm respectively. Moreover, thanks to the overall size of the objects in Table 2, we can safely give a conclusion that the surface manufacturing error can be more accurately estimated by the proposed method.

Distribution chart of registration error for carburetors.
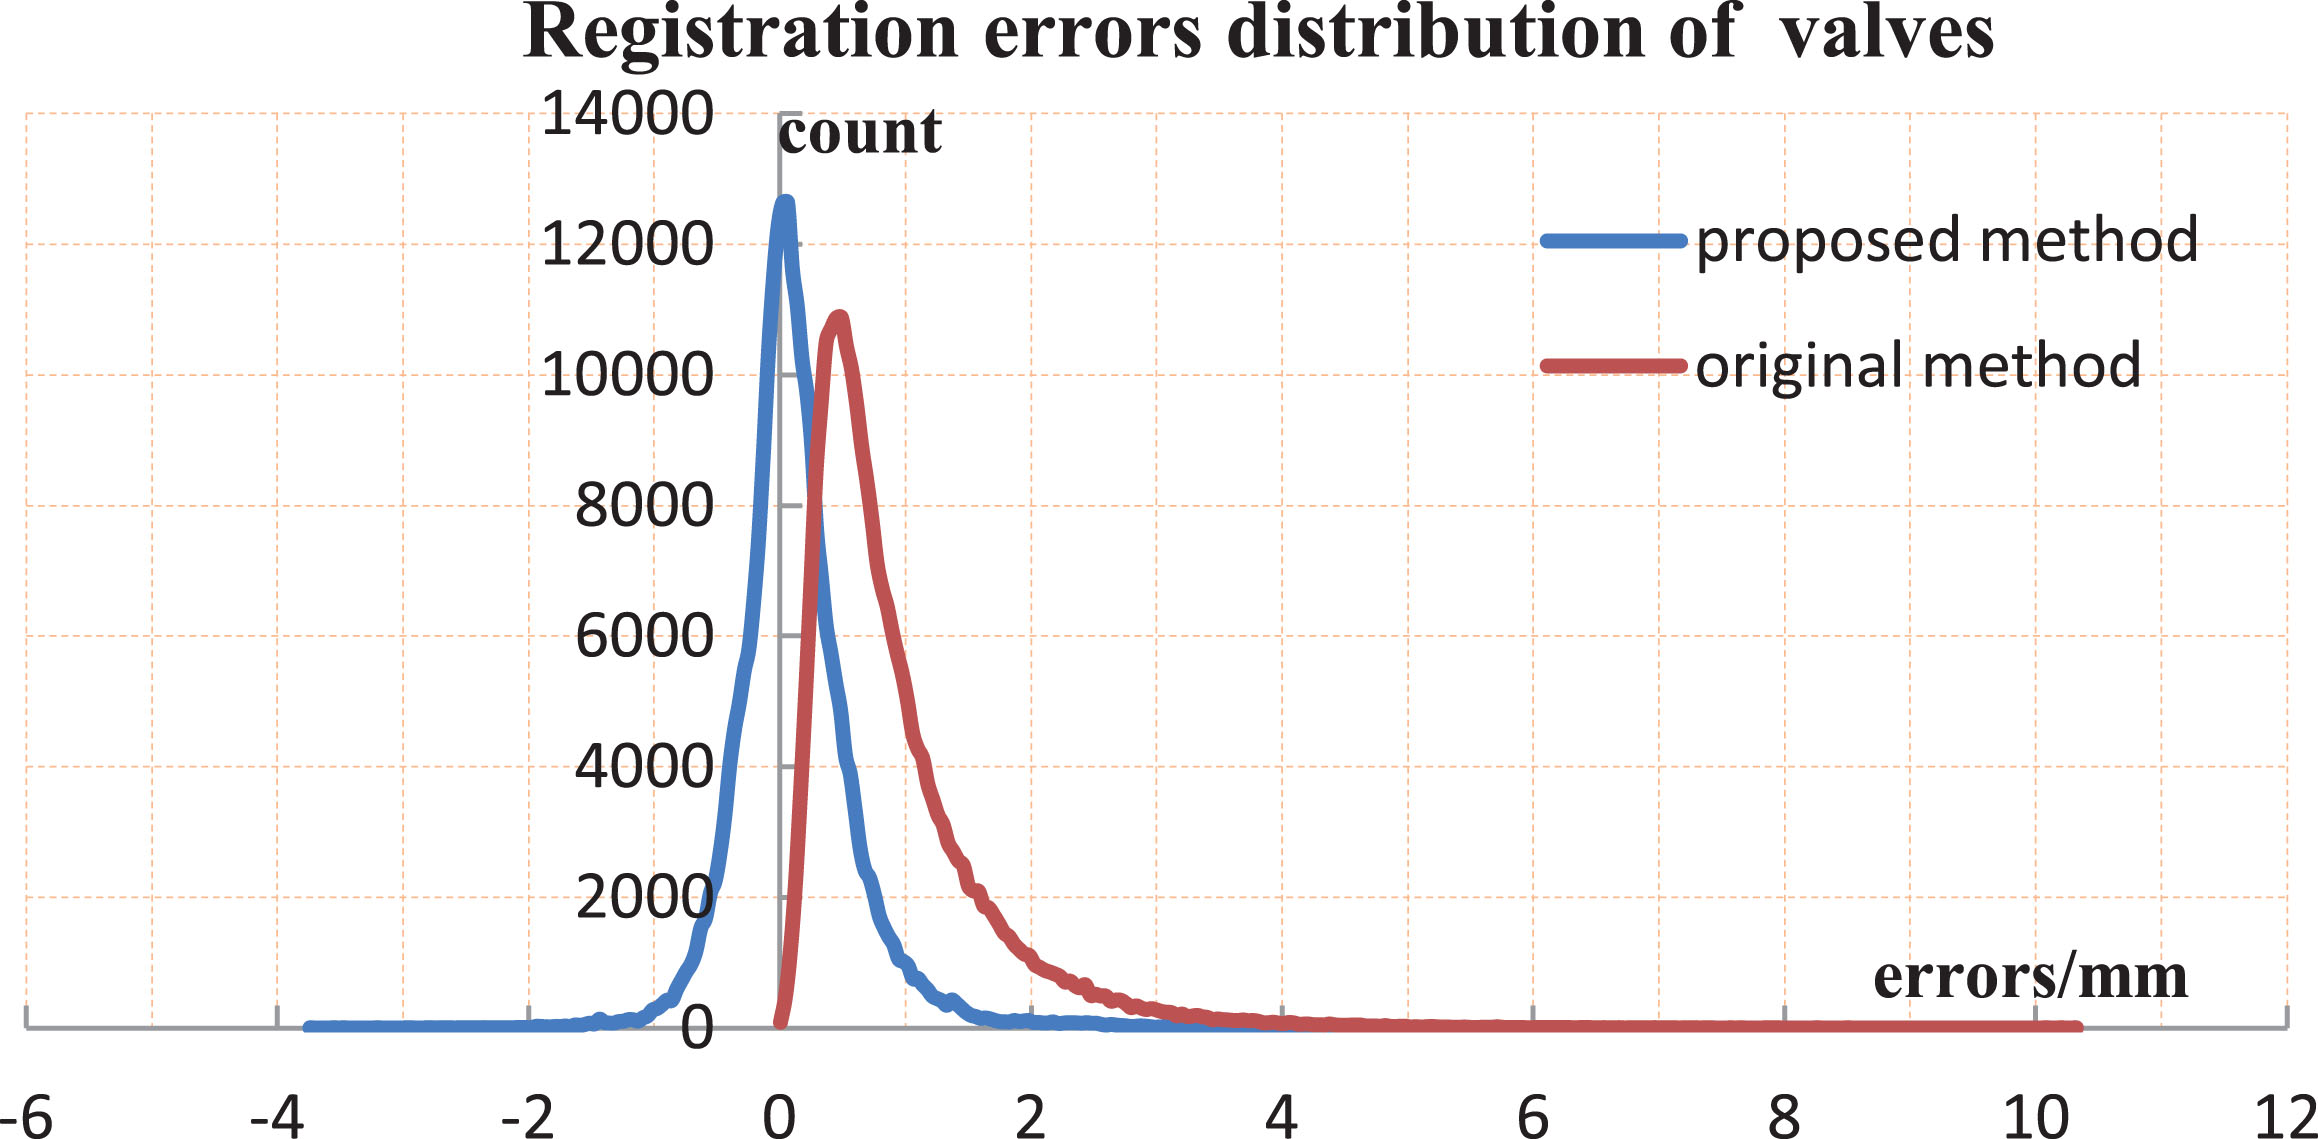
Distribution chart of registration error for valves.
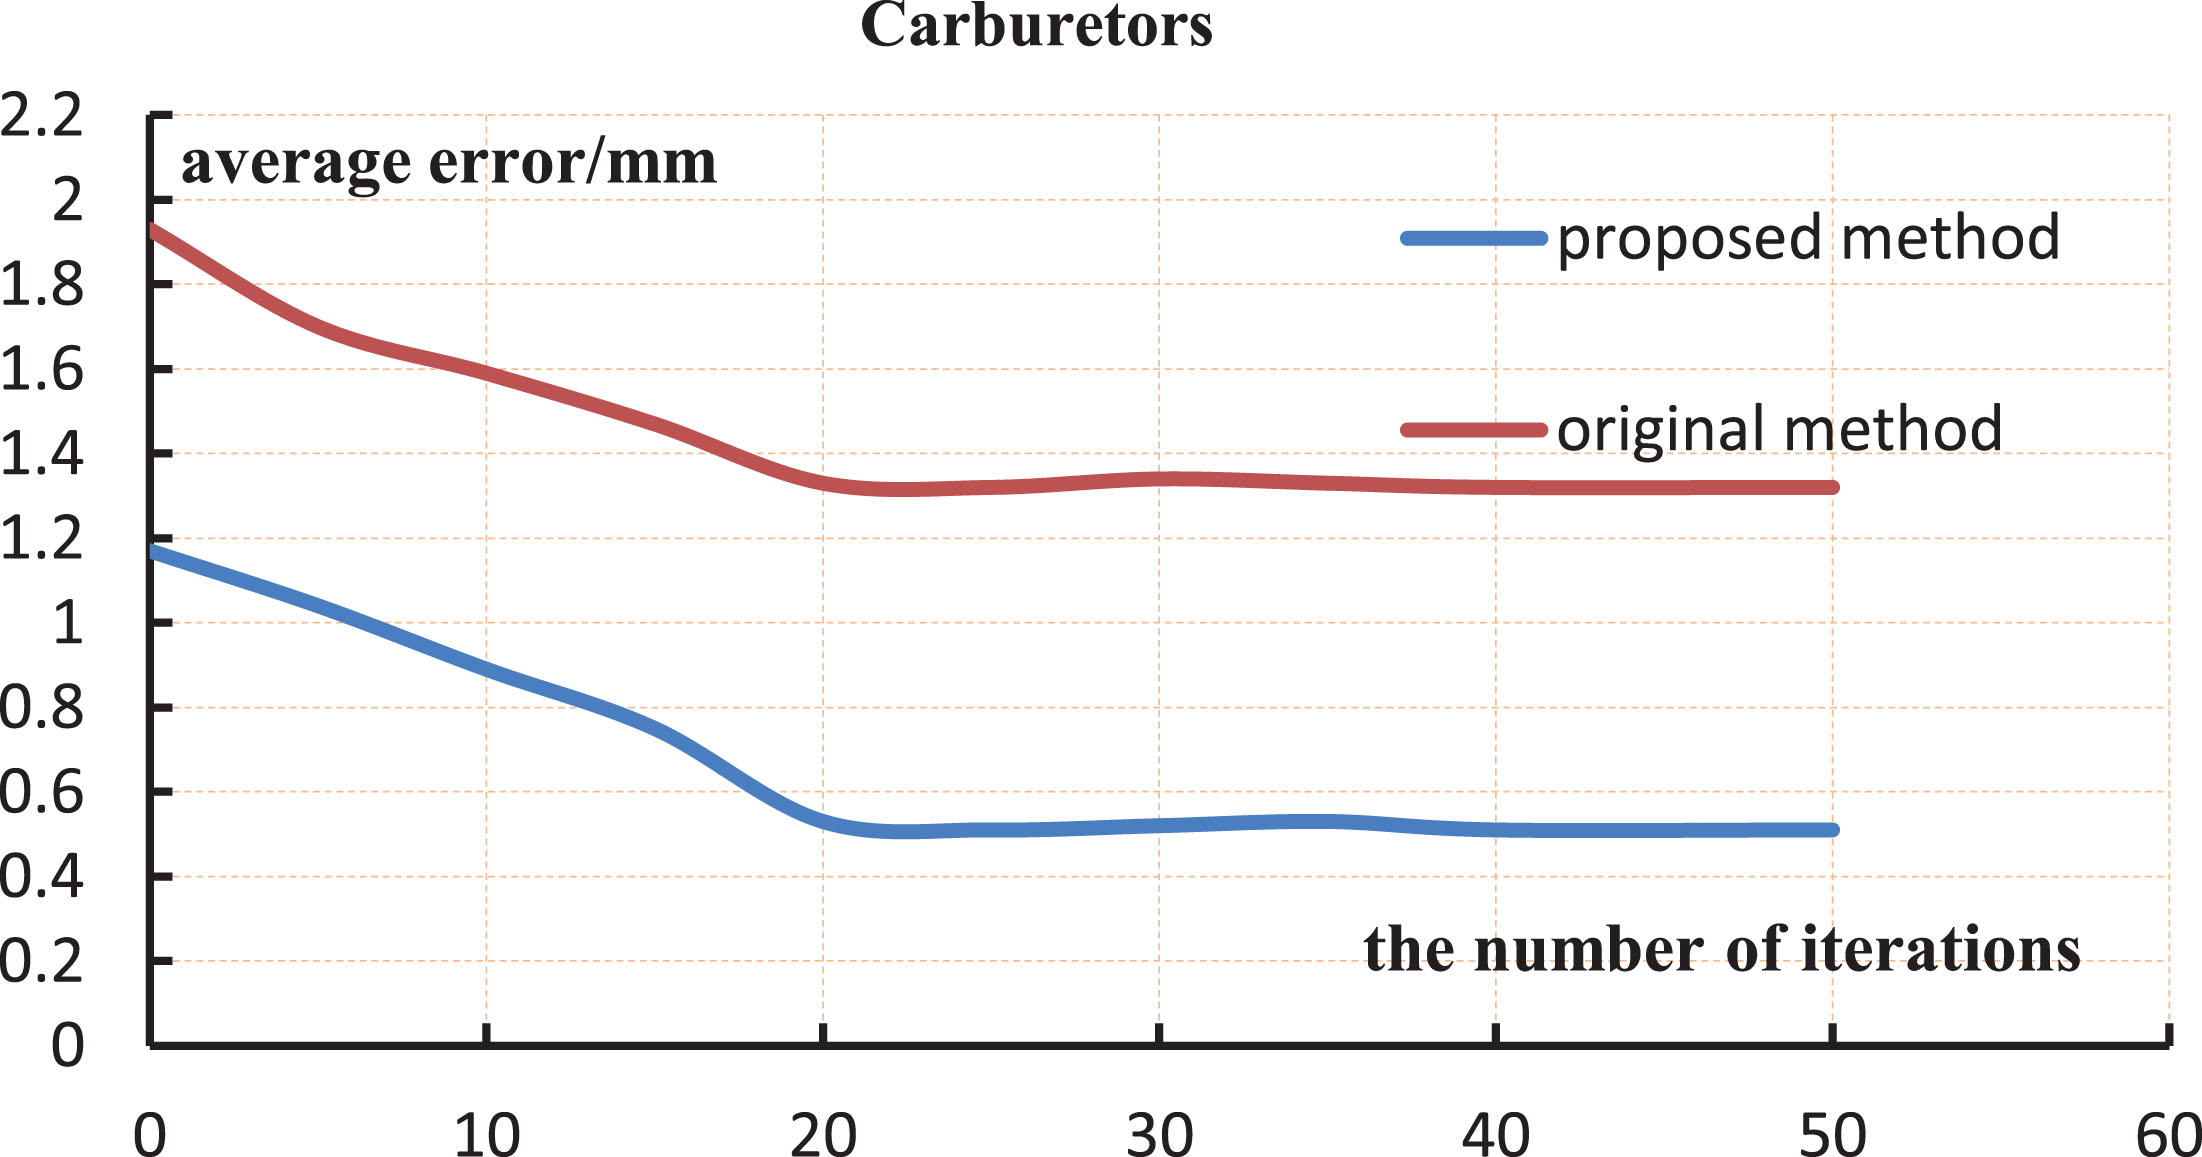
Correlation between number of iterations and average error (for carburetors).

Correlation between number of iterations and average error (for valves).
Count statistics for each interval (proposed method for carburetors)
Count statistics for each interval (original method for carburetors)
Count statistics for each interval (proposed method for valves)
Count statistics for each interval (original method for valves)
This study investigated a new FARCS system framework of registration of 3D CT data to CAD model for analyzing surface errors of the products made in the industry and to display the registration results and/or errors more precisely with better visualization. Comparing with the original CDB+ICP approach, this study demonstrates the feasibility of establish a quantitative, concise and relatively precise pattern for registration. First, our experiments confirmed that proposed approach can achieve full-automatic registration without manual interference, especially the global registration. We have identified an easier and novel solution for the abnormal axis differ by 180°. Second, due to the improved ICP fine registration with a novel estimation of registration errors, the registration results can be displayed with the registration errors being more accurately calculated. Comparing with other methods described in the Introduction section of this paper, our new method is more robust, feasible, and objective. Thus, in this study we provided a practically useful and easier strategy that is especially beneficial for deviation measurement between the 3D CT image and CAD model. The study may have significant implications for helping to understand the difference between the surface of the industrial product and the surface of CAD prototype. Further research could also be conducted to determine runtime and decrease time consumption of FARCS process. In summary, the findings of this study have several important practical implications for future industrial production.
Footnotes
Acknowledgments
This work was supported by the National Instrumentation Program of China(2013YQ030629). The authors would like to thank Liming Duan for his help with the CT data acquisition and Akasia for critical reading of the manuscript.