
Abstract
OBJECTIVE:
To investigate the measurement reproducibility of the maximum diameter on MRI routine sequence (T1WI, T2WI, DWI) and CT in peripheral and central lung cancer, and to provide reference standard for evaluating treatment responses for lung cancer.
METHODS:
53 patients with lung cancer underwent CT and 3.0T MR scanning. The maximum diameter was measured according to the RECIST1.1 standard on images of CT (lung and enhanced mediastinal window), MRI T2-BLADE, axial T1-VIBE and DWIb0, DWIb300, DWIb800, respectively. The reproducibility of the diameters was analyzed with intraclass correlation coefficient (ICC), and the distribution of measurement points with the Bland-Altman method. The difference analysis was assessed by paired samples t-test and nonparametric rank sum test, P < 0.05 is considered statistically significant.
RESULTS:
Reproducibility of diameters derived from routine MRI and CT was good (ICC > 0.75). For peripheral lung cancer, there was no significant difference in diameters between CT and MRI. While for central lung cancer, there was significant difference in diameters measured between using CT and each MRI sequence. However, the diameters derived from T1-VIBE and T2-BLADE were not significantly different from all DWI sequences.
CONCLUSIONS:
For peripheral lung cancer, the measurement on CT and routine MRI sequences can potentially replace each other after comprehensive consideration of examination purposes, but for central lung cancer, alternative use of CT and MRI in evaluating treatment responses for lung cancer should needs extra attention. The diameter measurement of lung cancer on DWI is consistent with that on T1WI and T2WI, suggesting that DWI can provide functional and morphological information.
Introduction
Currently, the primary method to assess the curative effect of lung cancer is response evaluation criteria in solid tumors (RECIST 1.1) [1], which compares the maximum diameter of the tumor pre- and post-treatment using CT or MRI. The former is the most widely used one but with radiations whereas the latter has no such shortcomings but takes long time to complete the scan and is deficient in detecting nodules less than 0.5 cm [2]. Hence, interchanging between them would be the optimal option in clinical practice if conclusions can be reached for the measurement agreement between CT and MRI. Reproducibility of CT in lung cancer has been well studied and applied in currently clinical practice, However, the reproducibility of MRI is still a hot subject. There has been reports on the reproducibility between CT and MRI [2, 3], but further research into the cancer location were not seen. This study aims to investigate the agreement in the measurements between MRI routine sequences (T1WI, T2WI, DWI) and CT when scanning peripheral and central lung cancer, providing references for evaluating treatment responses of lung cancer.
Materials and methods
General materials
The study was approved by the Medical Ethics Committees at the First People’s Hospital of Nantong and obtained written informed consents from all patients. Case inclusion criteria were (1) the maximum diameter of tumor measured on CT larger than 1.5 cm, (2) all patients having neither contraindications (such as medical implants and claustrophobic) to MRI, nor hypersensitivity to iodinated contrast agents, (3) the interval between CT and MRI scans less than or equal to one week without treatments (such as surgery, radiotherapy and chemotherapy), (4) pathologically confirmed lung cancer with complete clinical information. Exclusion criteria were (1) poor MR images with unanalyzable magnetic susceptibility artifacts or motion artifacts and (2) no definable lesions found on MRI. From October 2012 to February 2015, 56 cases in total with lung cancers were performed with MR and CT scanning, but 3 cases (5.36%) in total were ultimately excluded due to strong artifact induced by breathing motion on MR images. As a result, 53 patients (42 males and 11 females, mean age 65.55 years and age range 38–81 years) were thusly included in this study. Among these cases 37 were adenocarcinoma, 11 were squamous cell carcinoma and 5 were small cell lung cancer. 26 cases were confirmed by fiberoptic bronchoscopy biopsy, 17 by percutaneous lung biopsy and 10 by surgery. In total, 33 patients belonged to peripheral lung cancer and 20 to central lung cancer.
Equipment and methods
CT
Scans were performed on 16-slice MSCT (SOMATOM Emotion) and 64-slice MSCT (SOMATOM Sensation) scanners with parameters of 120 kVp tube voltage, automated tube current (highest 200 mAs), two convolution filters, namely B30f (soft window) and B70f (pulmonary window) and a tilt angle of frame at 0° during the acquisition. Patients were holding breath in supine position for the process and images were acquired from apex to diaphragm. The raw data was reconstructed in axis direction with 5 mm slice thickness and 5 mm interval. Enhanced scans were with administration of 90 mL nonionic contrast agent using a power injector via the elbow vein at a flow rate of 2.5∼3 mL/s. Images were acquired in artery phase and vein phase, 30 s and 60 s respectively after injection, with the same parameters used in non-contrast CT scan.
MRI
The MR images were acquired with an 8-channel phased-array receiver coil on Siemens 3.0T Verio scanner using routine lung cancer MRI protocol, and straps were used to reduce respiratory artifacts. The MR sequences included a coronary T2-weighted HASTE (TR/TE 1200 ms/83 ms, slice thickness 6 mm), an axial T2-weighted BLADE with fat suppression (TR/TE 6410 ms/112 ms, slice thickness 5 mm) and an axial T1-weighted VIBE (TR = 4.56 m, TE = 2.03 ms, slice thickness 3 mm). DWI was performed in a spin-echo (SE) echo-plannar imaging (EPI) sequence in the axial plane with free breathing. Images of DWI (DWIb0, DWIb300, DWIb800) were obtained at b = 0/300/800 s/mm2 using the following parameters: TE = 7221 ms, TR = 71 ms, slice thickness = 5 mm, field of view = 38×31 cm2, matrix = 128×104 and number of scanning layer around 28. The above DWI sequences were based on generalized autocalibrating partially parallel acquisition (GRAPPA, Siemens) and the parallel acquisition acceleration factor was 2, which was based on K space algorithm. The fat suppression technique used was spectrally selective attenuated inversion recovery (SPAIR).
Imaging analysis
The cross-sectional images of tumors on CT and MRI were measured referring to RECIST1.1. The maximum length of lung cancer on CT was obtained on unenhanced lung window and enhanced mediastinal window (artery phase) (unenhanced lung window cannot differentiate the central lung cancer from atelectasis, so the measurement was taken place on enhanced mediastinal window). On lung window, the window width and level were 1200 HU and –600 HU while on mediastinal window they were 350 HU and 40 HU. The maximum diameter in MRI was measured on axial T1-VIBE, T2-BLADE, DWIb0, DWIb300, and DWIb800 (Figs. 1 and 2). Measurements were conducted twice for the average values by one radiologist with 8-year experience in thoracic CT and MRI imaging. The interval between CT and MRI measurements was more than 2 weeks.
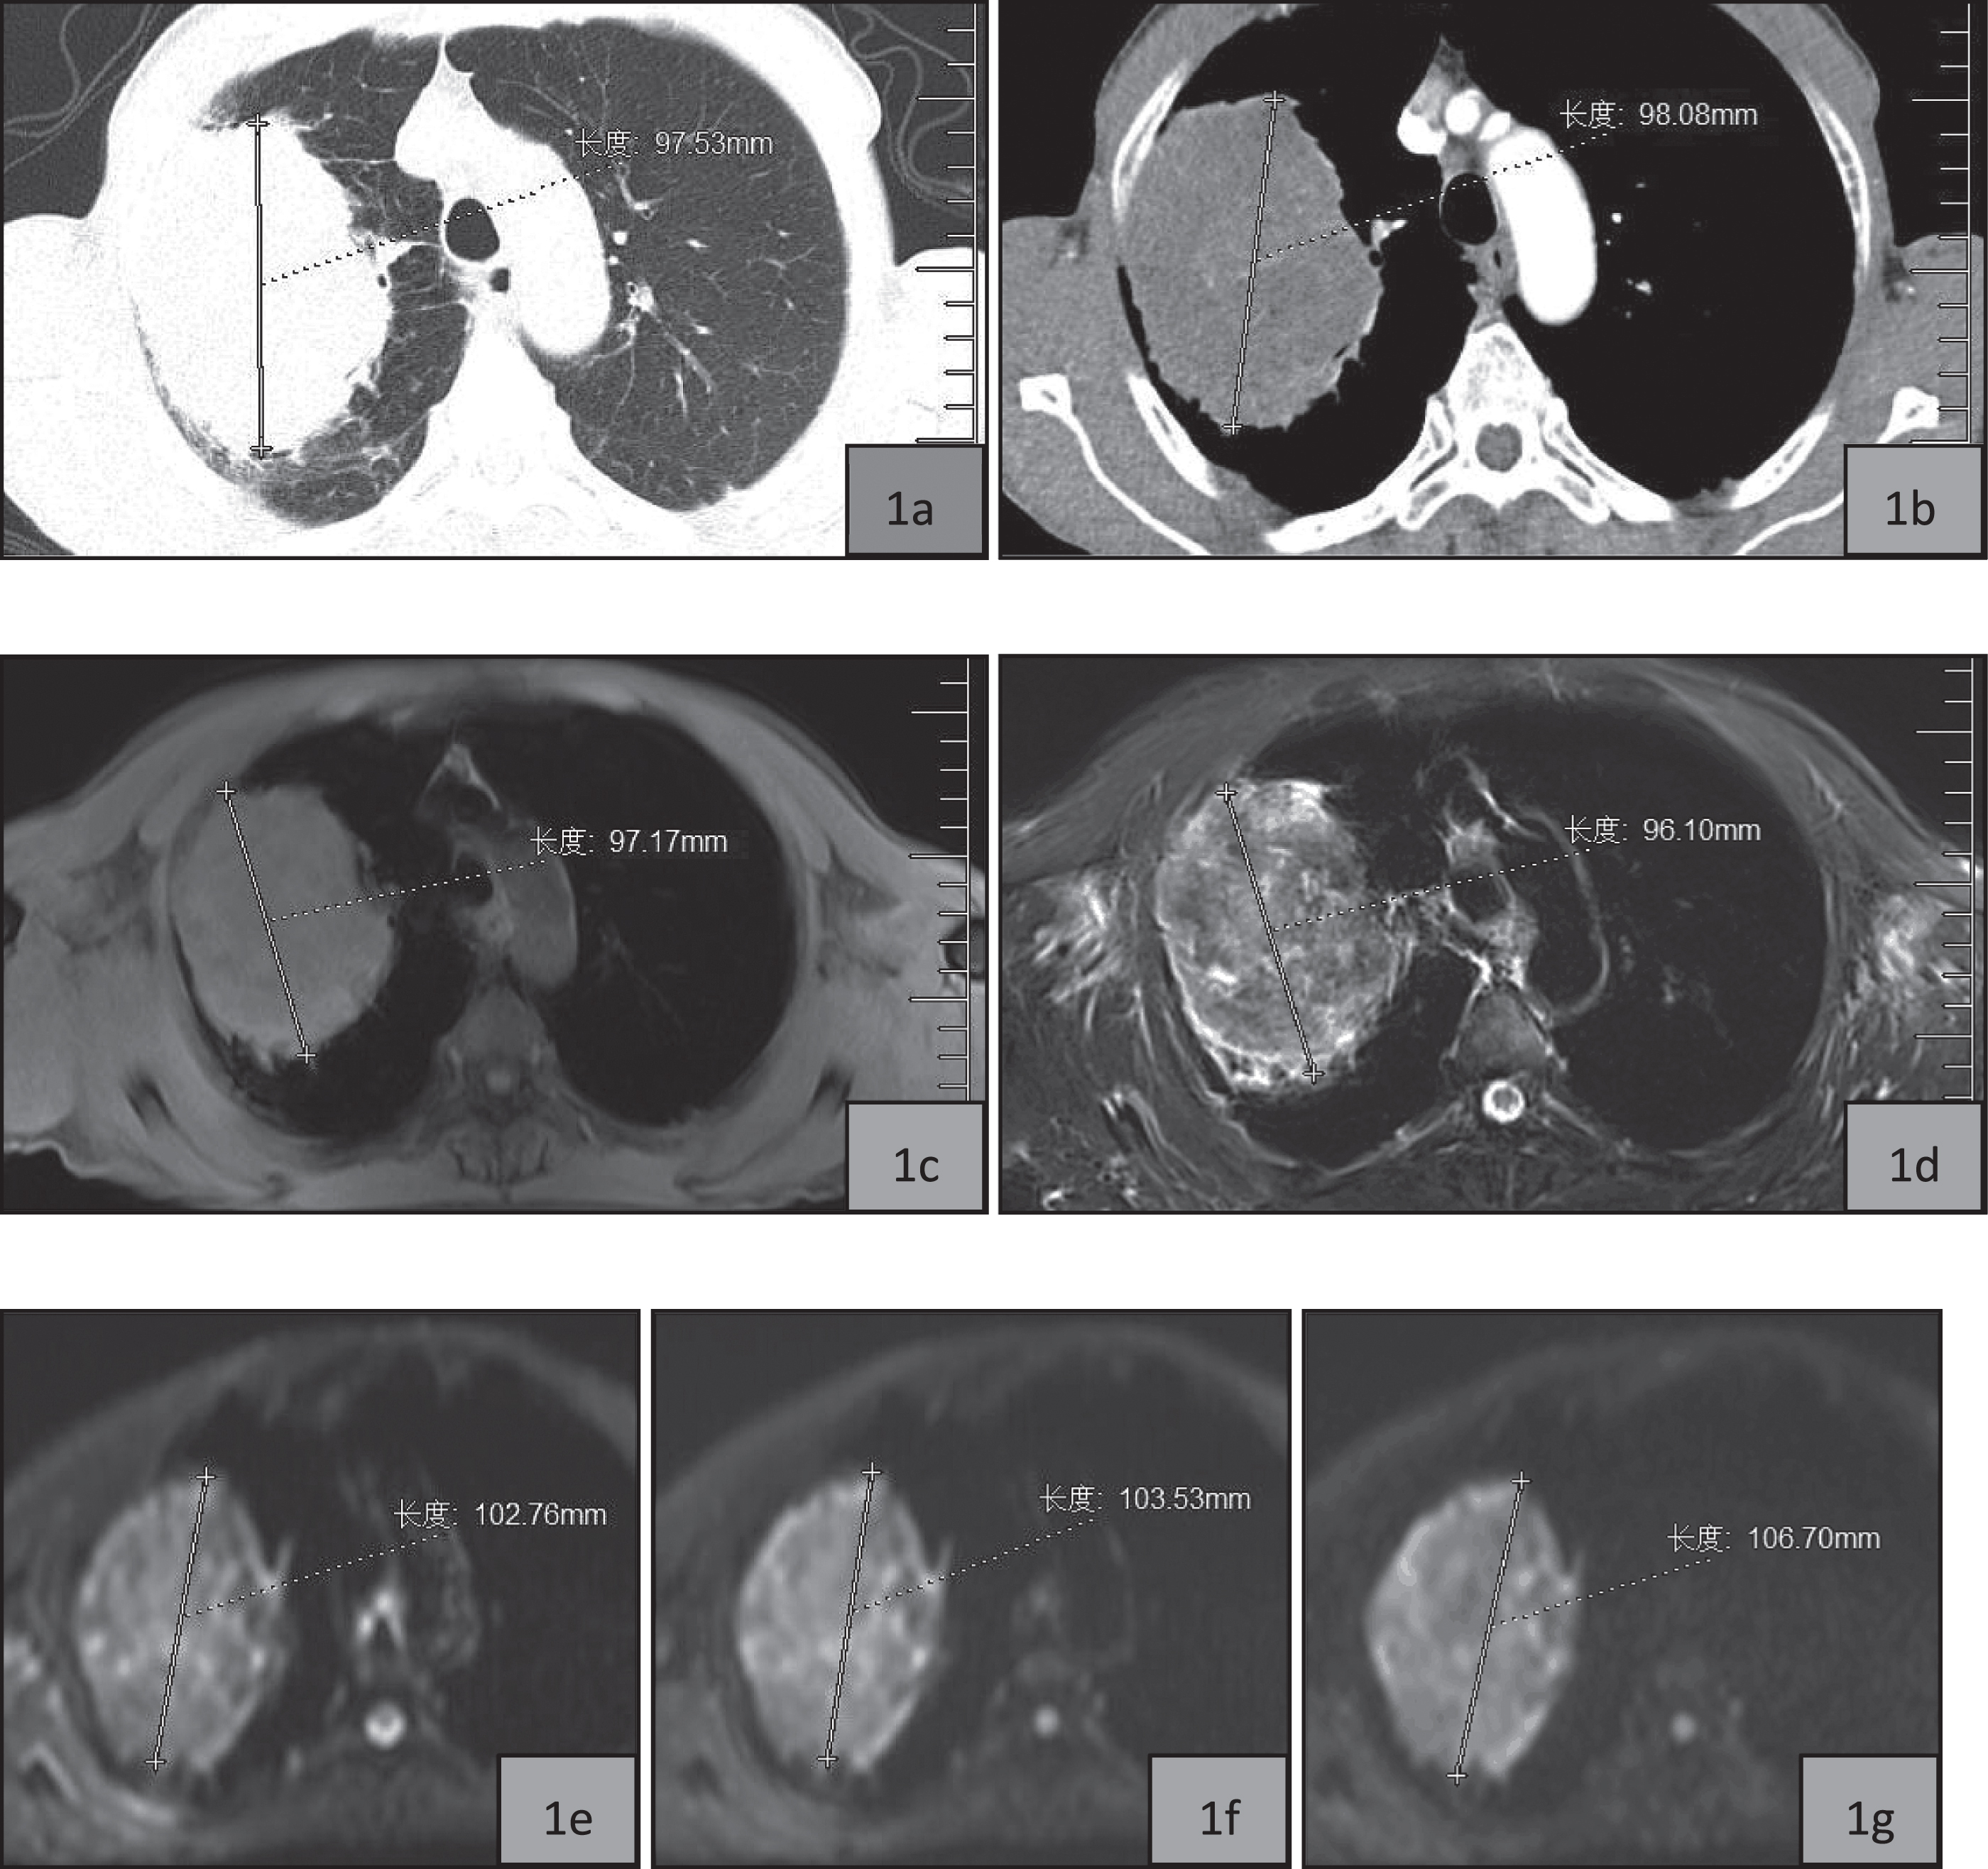
77 Years old male, peripheral lung cancer in the right lung (biopsy showing adenocarcinoma). 1a (unenhanced lung window) the maximum length is 97.53 mm; 1b (artery phase of enhanced mediastinal window) the maximum length is 98.08 mm; 1c (T1-VIBE) the maximum length is 97.17 mm; 1d (T2-BLADE) the maximum length is 96.10 mm; 1e∼g (b = 0, b = 300 s/mm2, 800 s/mm2), the maximum length is 102.76 mm, 103.53 mm, 106.70 mm respectively.
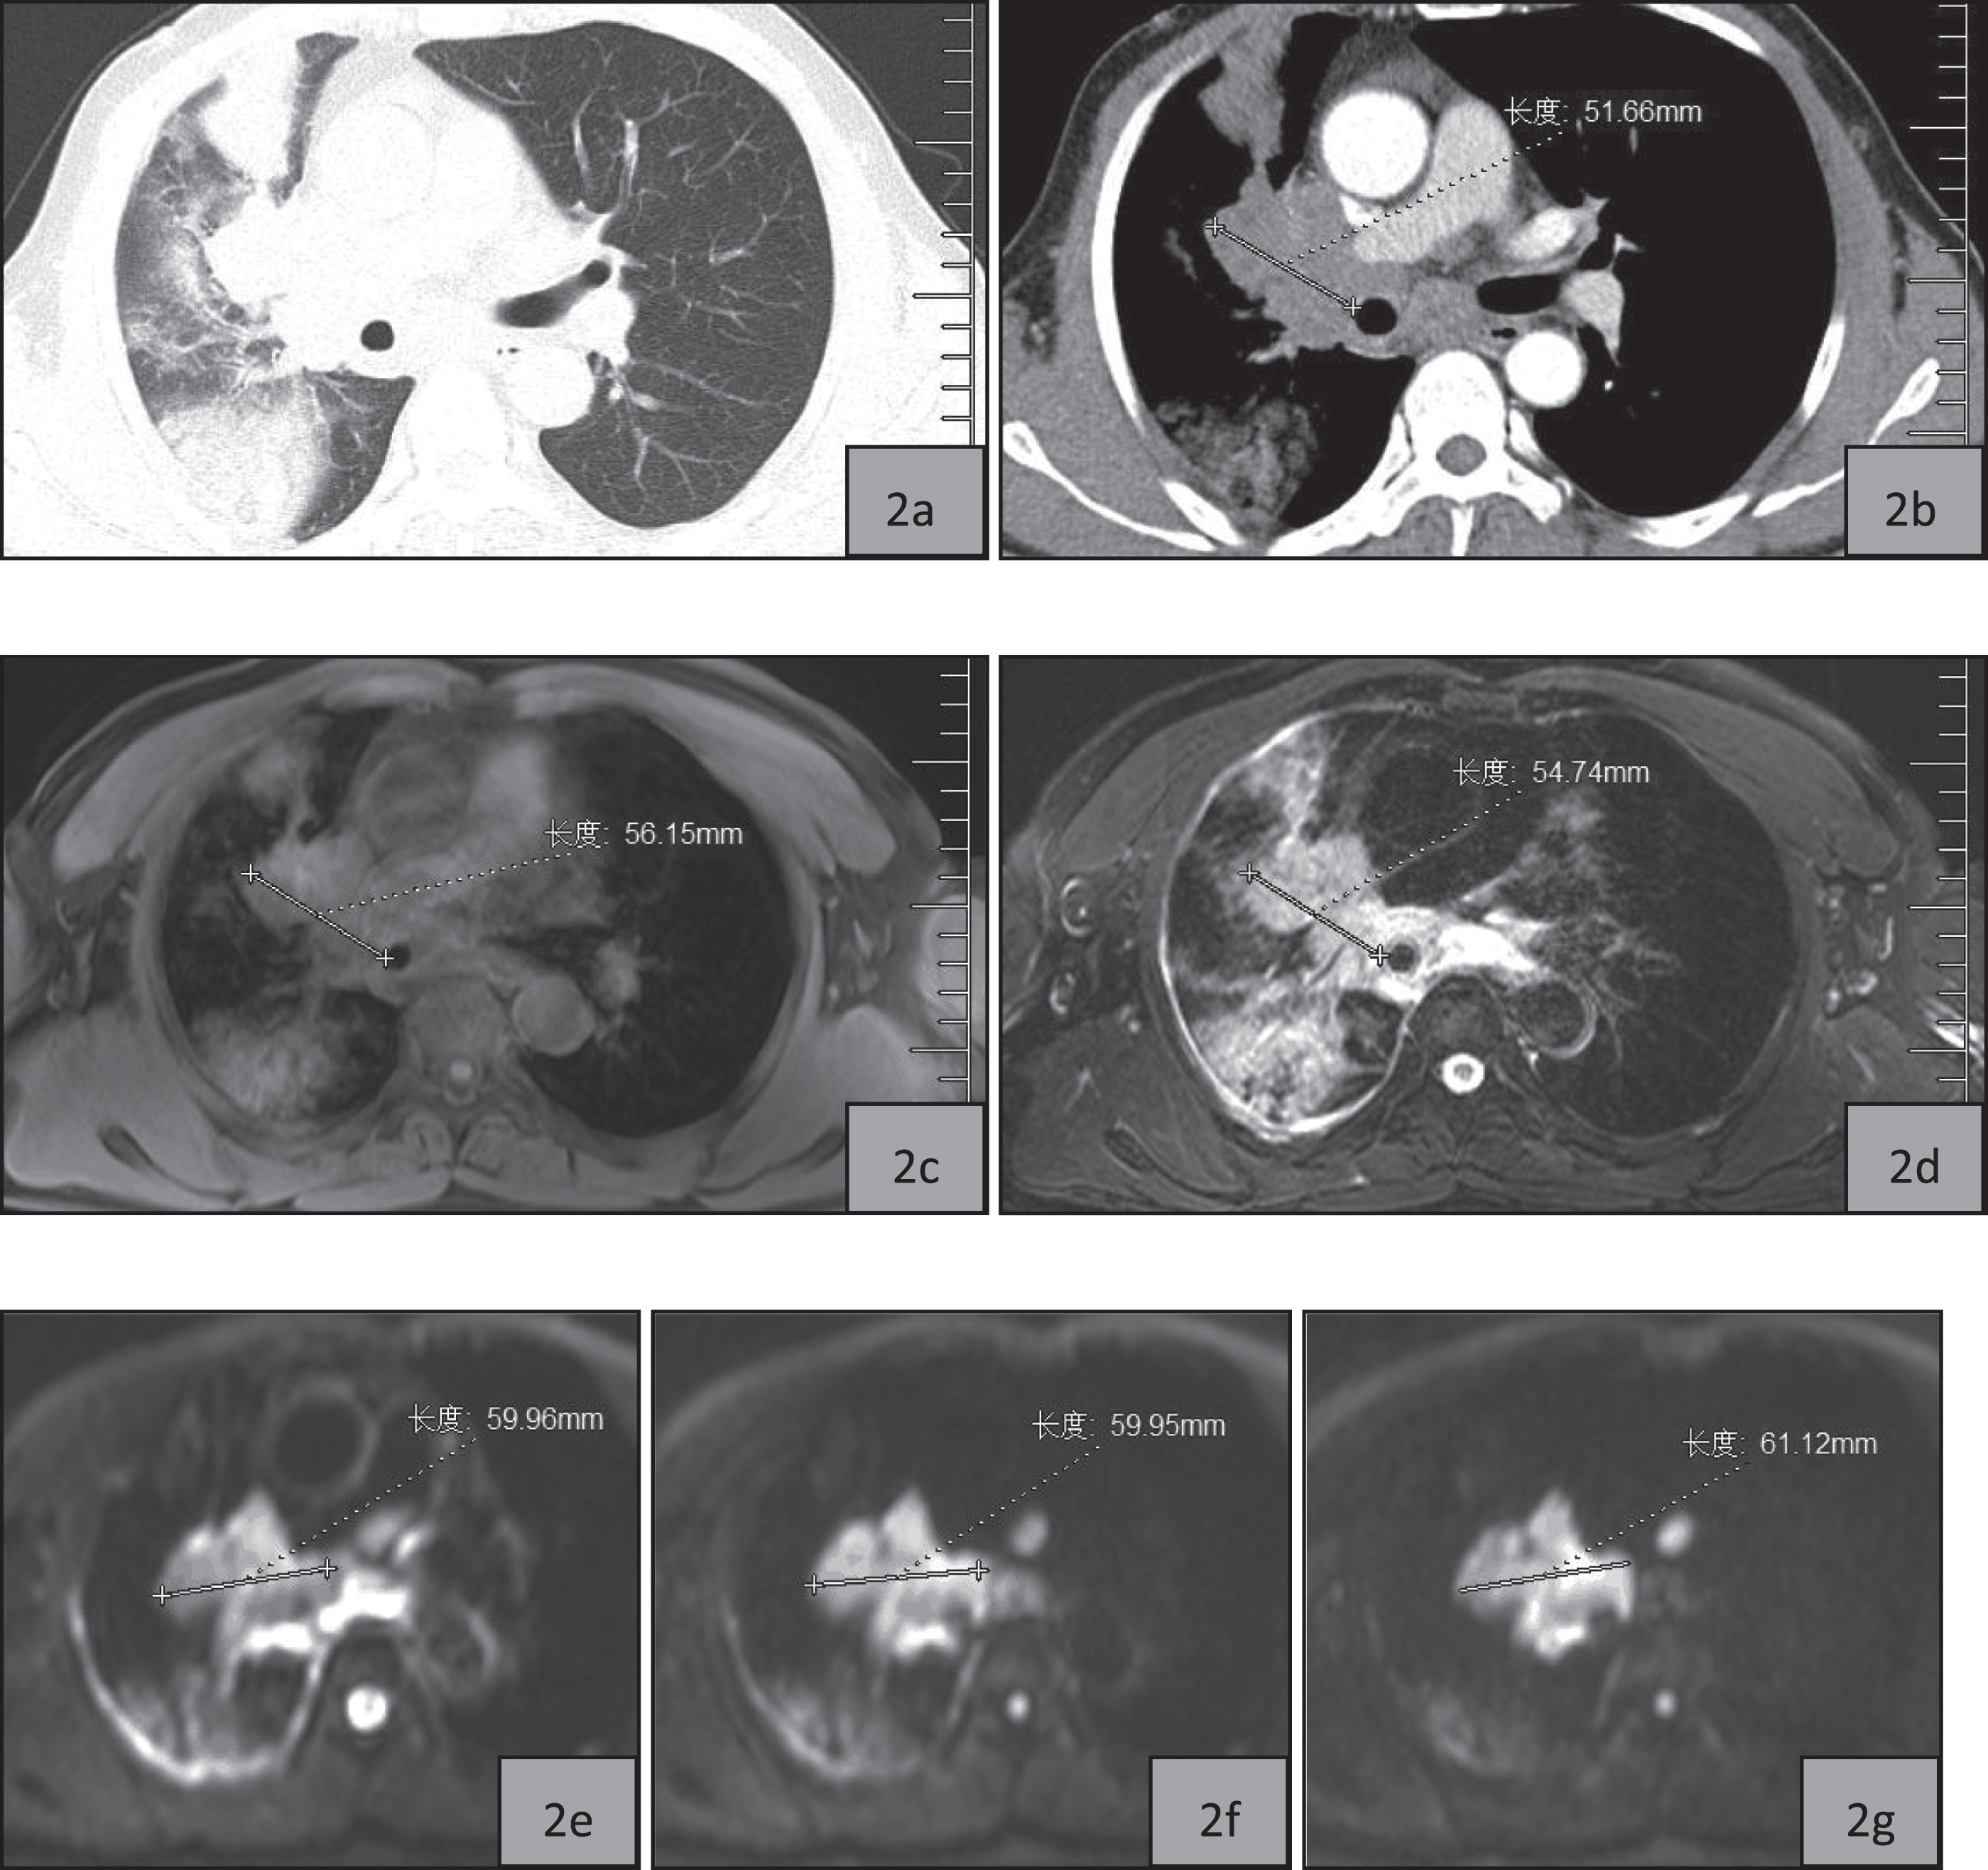
50 Years old male, central lung cancer in the right lung (bronchoscopic pathology showing squamous cell carcinoma). 2a (unenhanced lung window) no clear boundary between the tumor and the mediastinum, with obstructive pneumonia; 2b (artery phase of enhanced mediastinal window) the maximum length is 51.66 mm; 2c (T1-VIBE) the maximum length is 56.15 mm; 2d (T2 -BLADE) the maximum length is 54.74 mm; 2e∼g (b = 0, b = 300 s/mm2, 800 s/mm2) the maximum length is 59.96 mm, 59.95 mm, 61.12 mm respectively.
Intraclass correlation coefficients (ICC) was used to analyze the reproducibility of the maximum diameter obtained by CT (mediastinal window, lung window) and MR routine sequences (T1-VIBE, T2-BLADE, DWIb0, DWIb300, DWIb800), and values greater than 0.75 were considered good agreement. The distribution of measurement point was evaluated by Bland-Altman map. All the analysis above was performed by MedCalc 12.3.0 software packages. SPSS22.0 software was used to compare the differences of tumor lengths between CT and MRI. The paired samples t test was conducted if both samples had passed the normal distribution test (Shapiro-Wilk) and the nonparametric rank sum test (Wilcoxon) was applied otherwise. For all statistical tests, a p value less than 0.05 was considered statistically significant.
Results
Reproducibility of the maximum diameters obtained from CT and MRI
The maximum diameters of 33 peripheral lung cancer derived by CT, no matter unenhanced lung window nor enhanced mediastinal window, had a good agreement (ICC > 0.75) with that by MR sequences (T1-VIBE, T2-BLADE, DWIb0, DWIb300, DWIb800) (as shown in Table 1 and Fig. 3).
ICC of the maximum diameter obtained from CT and MRI for peripheral lung cancer (n = 33)
ICC of the maximum diameter obtained from CT and MRI for peripheral lung cancer (n = 33)
Note: ICC > 0.75 suggesting good reproducibility.
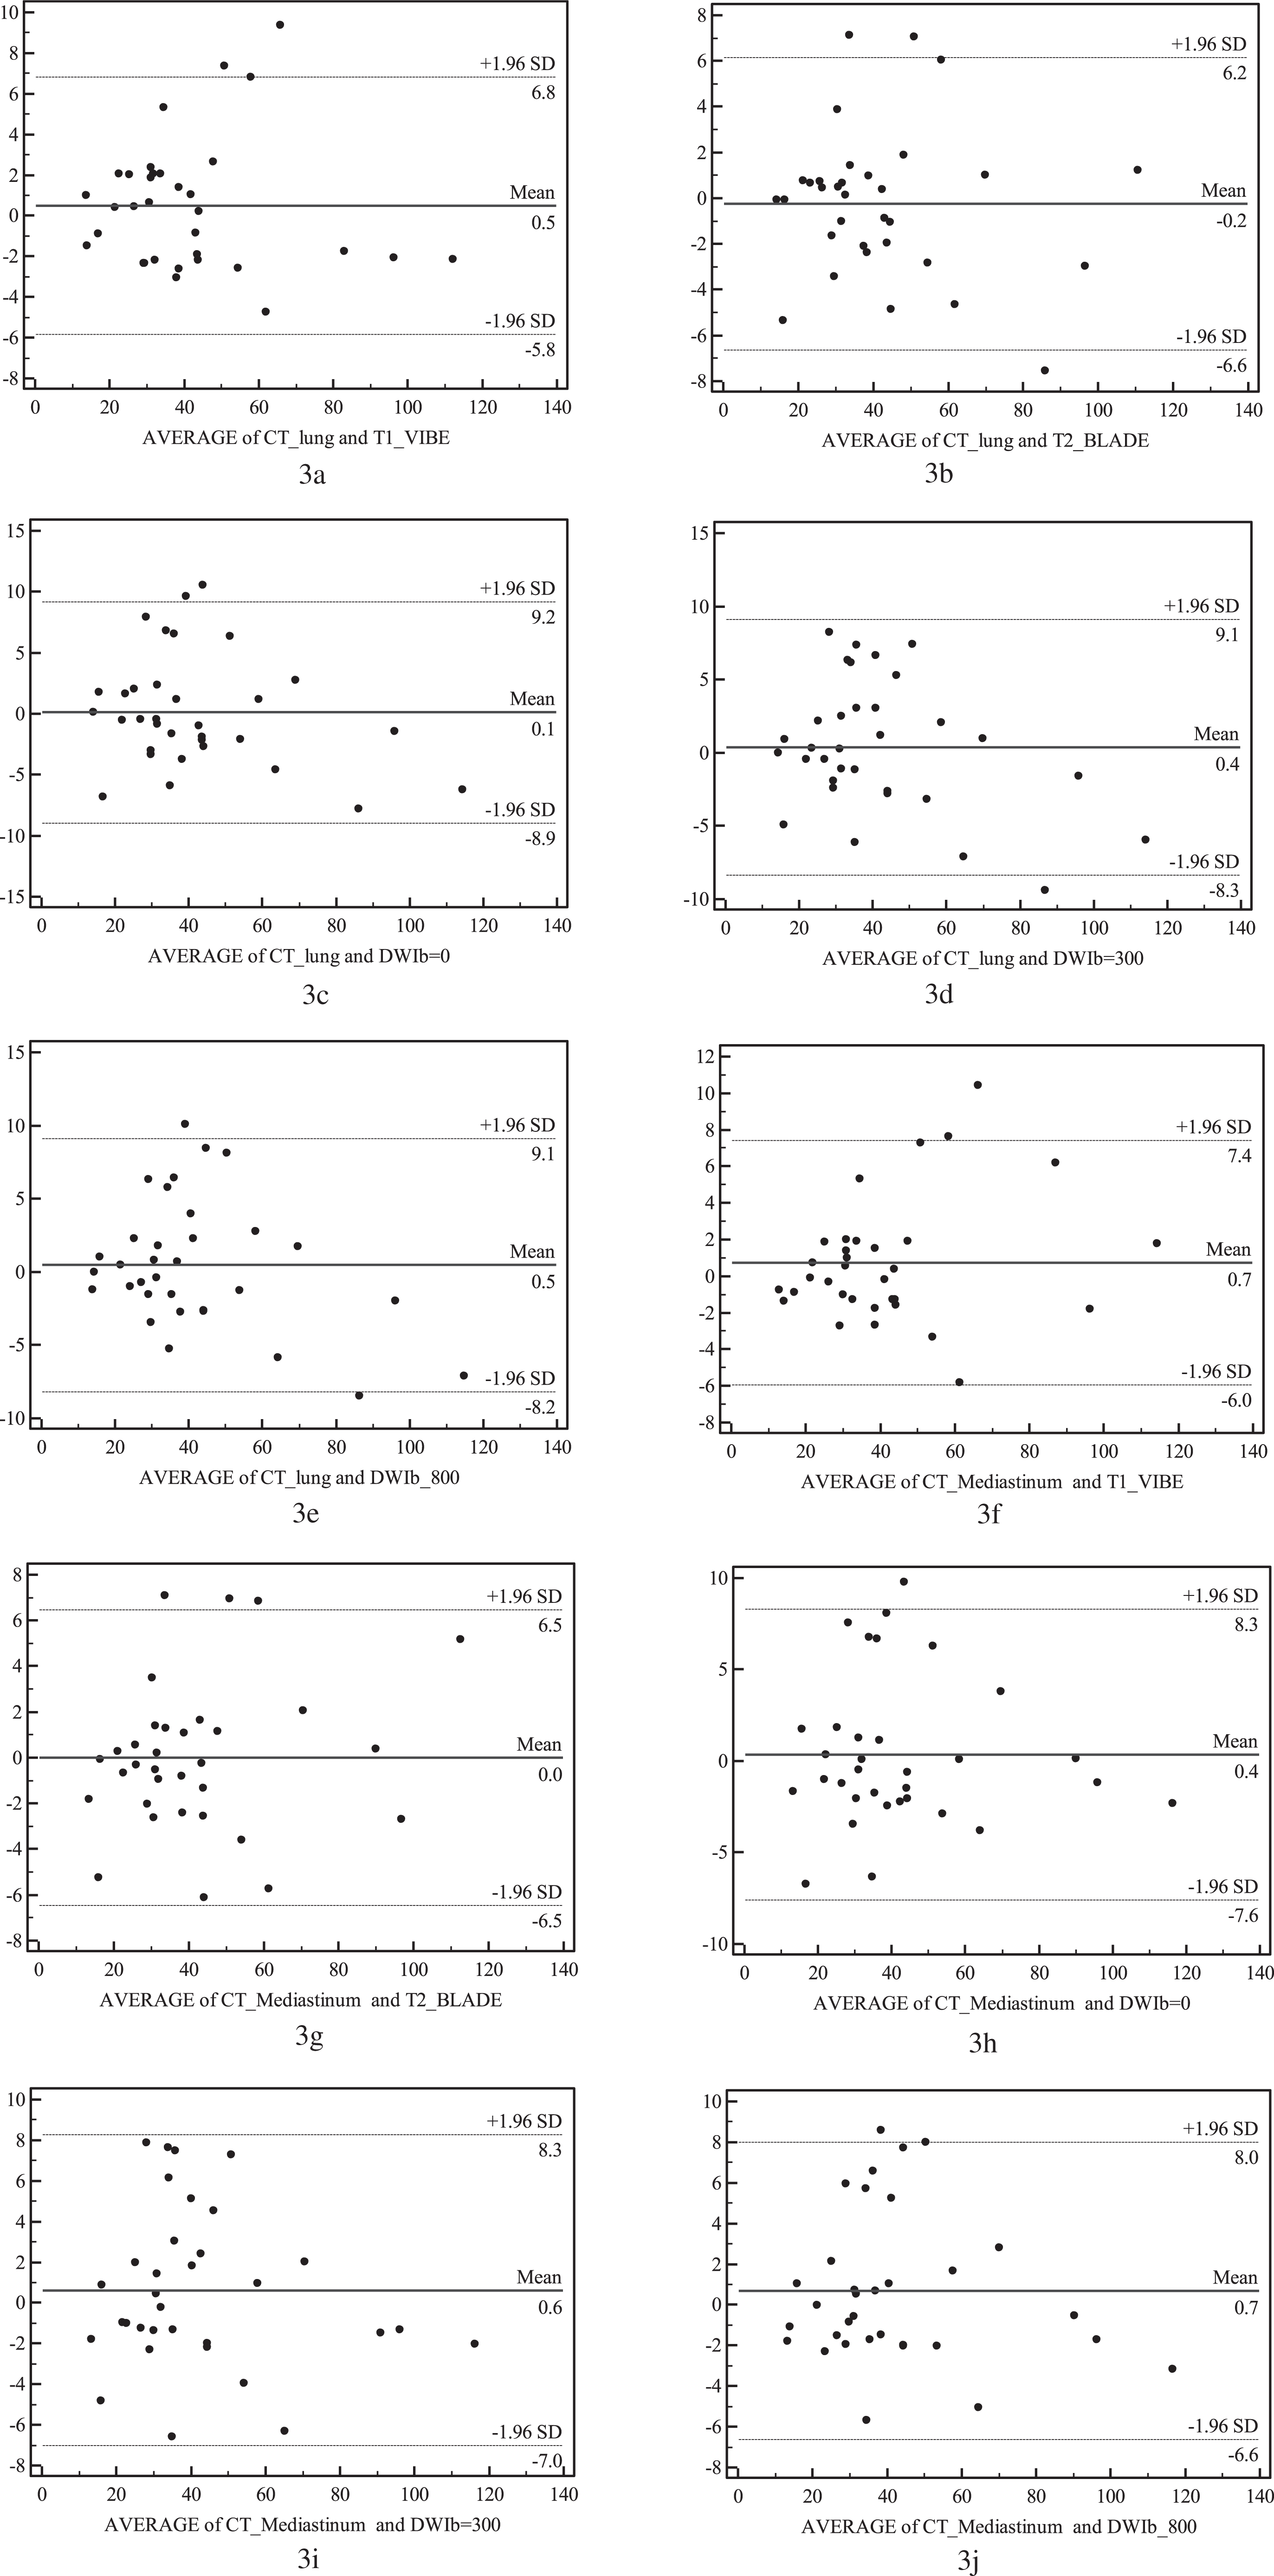
a∼e. The Bland-Altman map of the maximum length of peripheral lung cancer in unenhanced lung window and MRI sequences (T1-VIBE, T2-BLADE, DWIb0, DWIb300, DWIb800) f∼j: the Bland-Altman map of the maximum length of peripheral lung cancer in enhanced mediastinal window and MRI sequences (T1-VIBE, T2-BLADE, DWIb0, DWIb300, DWIb800).
The maximum diameters of 20 central lung cancer derived by CT enhanced mediastinal window had a good agreement (ICC > 0.75) with that by MR sequences (T1-VIBE, T2-BLADE, DWIb0, DWIb300, DWIb800) (as shown in Table 2 and Fig. 4).
ICC of the maximum diameter obtained from CT and MRI for central lung cancer (n = 20)
Note: ICC > 0.75 suggesting good reproducibility.

The Bland-Altman map of the maximum length of central lung cancer in enhanced mediastinal window and MRI sequences (T1-VIBE, T2-BLADE, DWIb0, DWIb300, DWIb800).
The normal distribution (Shapiro-Wilk) test prompted that the maximum diameter of peripheral lung cancer obtained from CT and MRI were both in skewed distribution. For central lung cancer, the maximum diameter obtained from CT enhanced mediastinal window, T1-VIBE and DWIb800 were in normal distribution while others were in skewed distribution. There was no significant difference in the length between CT (unenhanced lung window or enhanced mediastinal window) and MRI (T1-VIBE, T2-BLADE, DWIb0, DWIb300, DWIb800) in the peripheral lung cancer. As for central lung cancer, the length derived from CT enhanced mediastinal window was different from every MRI sequence (T1-VIBE, T2-BLADE, DWIb0, DWIb300, DWIb800) (Fig. 3), but the length derived from T1-VIBE and T2-BLADE was not significantly different from DWI sequences (b = 0, 300 s/mm2, 800 s/mm2) (Fig. 4).
Discussion
Significance of measuring the maximum diameter of lung caner
Lung cancer is a malignant tumor with high morbidity and mortality in clinical [4]. Surgery resection is its primary treatment and is the only cure for lung cancer, but it is prone to be affected by tumor size. In 2015, the eighth edition of the TNM classification for lung cancer revised the details for T staging in tumor, which is closely related to tumor size, taking full account of the relationship between the tumor size and the prognosis [5]. Therefore, precise measurement of tumor is helpful for the classification and provides evidence to the accurate clinical treatment.
Although surgery resection is the primary treatment for lung cancer, most cases would have developed into the final stage when diagnosed and missed the best opportunity for the surgery, and thusly turn to chemotherapy [6] and/or radiotherapy [7]. It is essential to timely evaluate therapy response and by monitoring the size of the tumor before and after treatment, the progress of the lesion can be understood accurately, guiding clinical physicians to optimize treatment schemes and avoid financial and psychological loose caused by inappropriate treatment. At present, the primary way to measure the size of lung cancer is to measure its maximum diameter as suggested by RECIST1.1 [1].
Difference in length of lung cancer between CT and MRI
Difference in length of lung cancer between CT and MRI
Note: Data with * was in normal distribution and expressed as mean±standard deviation; the rest was in skewed distribution and described by median±quartile. & represented the difference in the maximum diameter between CT unenhanced lung window and MRI sequences. P < 0.05 was considered statistically significant. # represented the difference in the maximum diameter between CT enhanced mediastinal window and MRI sequences. P < 0.05 was considered statistically significant.
Difference in length of central lung cancer between MRI sequences (n = 20)
Note: The data was represented as (t/Z, P), showing the difference in maximum diameter between MRI sequences. P < 0.05 was considered statistically significant.
CT is widely used in chest imaging for its quick scanning and high density resolution, making it the preferred method for lung cancer preoperative diagnosis and evaluation for staging, therapeutic effectiveness and prognosis. However, it should be noted that because of severe radiation CT is harmful to patients who need repeated examination to assess treatment in the short term. Such shortcomings are absent in MRI but it has been pointed out by researchers [2] that MRI is ineffective in detecting nodules less than 0.5 cm, while CT has advantages in small nodules detection. Therefore, the combination of the two is potentially the best option in clinical practice and previously, few studies has studied the agreement in the measurement between the two.
Our study indicated that either in unenhanced lung window or enhanced mediastinal window, the maximum diameter of peripheral lung cancer measured on CT had no significant difference (P > 0.05) comparing to MRI, which might be the result of the fact that peripheral lung cancer is usually not associated with obstructive pneumonia or obstructive atelectasis. On the other hand, for central lung cancer, the complication of obstructive pneumonia or obstructive atelectasis made it difficult to distinguish the actual tumor from obstructive pneumonia or obstructive atelectasis as they all show patchy shadows in the CT unenhanced lung window, and therefore, the maximum diameter was not measured in this setting.
The results also showed that the maximum diameter of central lung cancer measured in CT enhanced mediastinal window was larger than that in MR sequences (T1-VIBE, T2-BLADE, DWI) (P < 0.05). It may be associated with the difficulty in differentiating between actual tumor and obstructive atelectasis on enhanced CT. Lung cancer shows higher malignancy with abundant newborn capillary supplied by bronchial artery, which causes obvious strengthening on the early-stage enhancement for a short period of time. When the central lung cancer complicates with atelectasis, also known as the lung tissue collapse, pulmonary arteries tend to crowd each other, resulting in an increased blood flow in the atelectasis of the area and making the enhancement start earlier with higher intensity. A previous research [8] had shown that the difference between central lung tumor and lobar collapse was most marked from 40 seconds to 2 minutes after scanning begins. In this study, however, artery phase (30 s after injection) was used for measurement, so it could be difficult to define the boundary and have a larger tumor size in the mediastinum window.
The maximum diameter of central lung cancer obtained from routine sequences (T1-VIBE, T2-BLADE) and DWI (b = 0, 300 s/mm2, 800 s/mm2) underwent analysis for differences. T1-VIBE and T2-BLADE belong to the routine sequence, measurements of which are often affected by the shape of the lesions observed by naked eyes, so it is difficult to distinguish lung cancer from atelectasis. DWI (b = 0, 300 s/mm2, 800 s/mm2) is a functional MR imaging technique, images generated by which are related to the Brown motion of the water molecules inside the tissues. Cells in malignant tumors are arranged tightly due to rapid proliferation while cells in atelectasis or pneumonia associated to central lung cancers are loosely packed, making the movement of extracellular water molecules limited in the former but less so in the latter. As a result, distinguishing between them in the DWI is possible in theory, which has been proven by studies by Yang RM[10] and Wang LL [11]. In our study, although the maximum diameter measured in routine sequences was larger than that in the DWI, there were no significant differences between them, which might be related to b values. The value of b is a controllable coefficient and is closely related with image quality and signal intensity. The smaller it is, the higher the signal-to-noise ratio (SNR) and contrast to noise ratio (CNR) of DWI images will be, resulting in both clearer images and more influences from perfusion and T2 shine-through on signal intensity. With b value increasing, the effects of perfusion and T2 shine-through reduce, but the SNR and CNR also decline, leading to the deformation of lesions which is not conducive to identification [9]. It is difficult to choose the appropriate b value, and there is no optimal value for reference at present. Li WD [12] found that a b value of 500 s/mm2 could achieve the best images of lung lesions, Tamura T [13] held that b = 1400∼1500 s/mm2 allowed the DWI to best detect breast cancer, and Fukukura Y [14] believed that pancreatic cancer had better display when b = 1500 s/mm2. Our study chose three narrowly gapped b values (0, 300 s/mm2 and 800 s/mm2). Because of the perfusion and T2 shine-through caused by obstructive pneumonia and atelectasis(b = 0) or deformation of lesions (b = 800 s/mm2), the maximum diameter derived from DWI (b = 0, 300 s/mm2, 800 s/mm2) might be larger than true length. In addition, central lung cancer is close to the hilum and usually accompanied by mediastinal lymph node metastasis. As those metastatic lymph nodes also show high signal on DWI with unclear boundaries, they could be mistaken for the lung cancer, leading to larger values of measurement and no finding of significant differences in the maximum diameter between DWI and MRI routine sequences.
The feasibility of applying DWI in morphology assessment of lung cancer
The water molecules in normal living tissues are moving irregularly and colliding randomly to change the direction and position of motion in microscopic state, this is called Brown motion, also known as diffusion motion of water molecules. Once pathology changes, the motion will change as well. DWI is the only known magnetic resonance imaging to detect the water molecules diffusion in human tissues without contrast medium injection, which can reflect the changes of microstructure indirectly and provide qualitative diagnosis. DWI has widely used in clinic nowadays, including the differentiation of lung nodules [15], the therapeutic effect in lung cancer [16], the N staging of lung cancer [17] and so on.
Differentiating central lung cancer and obstructive atelectasis is another clinical application of DWI. Although enhanced CT is more widely used clinically, it needs contrast agent and brings more radiation. Furthermore, according to this study, there remains doubts in the effectiveness of it to differentiate them. Therefore, the advantages of DWI are obvious, for it does not has radiation or need injection of contrast agent and it is easier to identify the border between central lung cancer and obstructive atelectasis than morphological imaging. A previous study has shown that the accuracy of DWI in outlining the boundary of central lung cancer is higher than CT and nearly equals to PET-CT [10]. Although pathology was not used as the gold standard for final verification in this study, still, differences were found in the maximum diameter between DWI and enhanced CT.
Our study showed that, in peripheral lung cancer, using DWI to measure the maximum diameter had no significant difference from CT. Therefore, DWI can in some way replace CT and routine MRI (T1-VIBE, T2-BLADE), especially for patients who cannot endure the long-time MR scanning, for DWI can provide both morphologic and functional parameters. For central lung cancer patients, routine MRI sequences (T1-VIBE, T2-BLADE) can be replaced by DWI formorphological assessment and differentiation of cancer and atelectasis, which has vital significance in evaluating the real size of tumors and curative effects after radio-chemotherapy.
Limitations and prospects
Limitations in our study: Firstly, the lesions were large and the smallest length was 1.5 cm, no smaller one found (length < 0.5 cm), hence the selection bias. For small lesions, there remain doubts in the reproducibility of maximum diameter measured in CT and MRI. Secondly, the measurement in CT was compared with that in MRI rather than the gold standard, thus the accuracy of CT and MRI is still further to be surveyed. Thirdly, only three different b values were used, and further researches with multiple b values are needed to verify the differences of b value in the morphological measurement of lesions.
In conclusion, for peripheral lung cancer, CT and MRI routine sequences (T1-VIBE, T2-BLADE, DWI) can potentially replace each other after comprehensive consideration of examination purposes as the morphological measurement with good agreement in results, while for central lung cancer, there are differences in measurement between enhanced CT and MRI routine sequences (T1-VIBE, T2-BLADE, DWI), which should be taken into account when alternatively using them to evaluate the efficacy of lung cancer treatment. Measurements on DWI and MRI routine sequences (T1-VIBE, T2-BLADE) have great agreement, indicating that DWI can provide not only functional information but also reliable morphological information.
Footnotes
Acknowledgments
The authors have no conflicts of interest to disclose.
This work was supported by Six-one Project of Top Talents in Jiangsu Province (LGY2017037, LGY2017015), Nantong Science and Technology Bureau (2017), National Key R&D Program of China (2017YFC0114300), 333 High-level Talents Training Project of Jiangsu (2016III-0603), Youth Talents Program of S&E Rejuvenating healthy in Jiangsu (QNRC 2016181), and Sci.&Tech.
Achievements and Suitable Technology Extension Project in Wuxi (No.T201722).