



Abstract
BACKGROUND:
Automatic segmentation of pulmonary airway tree is a challenging task in many clinical applications, including developing computer-aided detection and diagnosis schemes of lung diseases.
OBJECTIVE:
To segment the pulmonary airway tree from the computed tomography (CT) chest images using a novel automatic method proposed in this study.
METHODS:
This method combines a two-pass region growing algorithm with gray-scale morphological reconstruction and leakage elimination. The first-pass region growing is implemented to obtain a rough airway tree. The second-pass region growing and gray-scale morphological reconstruction are used to detect the distal airways. Finally, leakage detection is performed to remove leakage and refine the airway tree.
RESULTS:
Our methods were compared with the gold standards. Forty-five clinical CT lung image scan cases were used in the experiments. Statistics on tree division order, branch number, and airway length were adopted for evaluation. The proposed method detected up to 12 generations of bronchi. On average, 148.85 branches were extracted with a false positive rate of 0.75%.
CONCLUSIONS:
The results show that our method is accurate for pulmonary airway tree segmentation. The strategy of separating the leakage detection from the segmenting process is feasible and promising for ensuring a high branch detected rate with a low leakage volume.
Introduction
Computed tomography (CT) chest scanning has the unique ability to provide anatomical information on the lung with high temporal and spatial resolution. CT-based pulmonary airway measurement has been previously shown to be reliable and is widely used in clinical lung disease diagnosis and pathological evaluation, especially pulmonary airway diseases including bronchial stenosis, pulmonary emphysema, and chronic obstruction [1]. The pulmonary airway starts from the trachea then extends to the distal bronchioles, forming a tree-like structure with branches of consecutive generations. Airway measurement refers to the segmentation of the airway lumen, airway wall, and especially the analysis of high generation branches.
The segmentation methods for the airway tree mainly include region growing based methods [2–4], the morphological method [5], fuzzy connectedness method [6], and the hybrid mode method [7, 8]. Lai et al. [9] implemented a lower-bound threshold-based region growing algorithm for airway tree segmentation. The process was orderly, starting from the main bronchus and constrained by the airway radius. The region growth stopped if the radius of a sub-branch was bigger than that of the parent-branch or no branch was found. This approach limited the leakage through a priori knowledge of the airway radius, but could not detect the distal airway effectively. Gray-scale morphological reconstruction has been proved previously to be effective in detecting small bronchi on the 2-D cross slice. Irving et al. [10] applied multi-scale structure elements (SE) to detect airways of varying sizes. The airway tree was then reconstructed through closed space expansion. Fabijańska et al. [11] adopted a two-pass region growing, which was constrained by a morphological gradient map in pulmonary airway segmentation. This study failed to detect all the branches and did not work well on low-dose CT images. Lo et al. [12] proposed a novel approach, in which the orientations of the vessels and pulmonary airway guided the segmentation progress. The vessels were first segmented using multi-scale Hessian eigenanalysis, and their centerlines were calculated using the 3D thinning algorithm. The orientation of the airways was estimated using the same method, and the orientation of the nearest vessel was used to guide airway segmentation. Although the method precisely detected the airway tree, it was time-consuming and required heavy computation. Similarly, Graham et al. [13] also added the local feature of the images to the analysis of the airway tree structure. The method could detect a considerable distal airway, but it was easily influenced by the noise and artifacts in the CT images. Moreover, too many parameters needed to be manually set.
In a novel approach, a filter, combined with multi-scale vesselness enhancement and gray-scale morphological reconstruction, was introduced [14] for airway segmentation. The results of the filter were applied to constrain and guide fuzzy connectedness (FC) computation of the airway lumen. Although the average false positive rate (FPR) for the detected airway was low, the branch count remained to be improved.
Recently, Charbonnier et al. [15] utilized the convolutional neural networks (CNN) to construct a classification module of leakage detection. Two different strategies were applied to reduce leakage and improve the segmentation result. The scores of detected tree length and false positive rate are outstanding. Yun et al. [16] proposed a 2.5D convolutional neural net (2.5D CNN) trained in a supervised manner for airway segmentation. In this net, three adjacent slices in each of the orthogonal directions were used to form the training data. Juarez et al. [17] presented a simple and robust approach based on 3D U-net to perform segmentation of airways. The results reached an average dice coefficient of 0.8 between the ground truths and their segmentations. Although the recently popular CNN method achieved a high detection rate, the form of the patches consisting the training data set, and the segment strategy should be further modified so that the average false-positive rate could be reduced.
Previous studies mostly utilized the characteristics of the airways in the CT scans, where the dark airway lumen is surrounded by a bright airway wall. Due to the low SNR and CNR of the image, it is difficult to accurately segment the airway at a reasonable cost, in a reasonable time and with high detection scores.
In this study, a new method is introduced for airway segmentation. As an extension of our earlier work [18, 19] and the method in [11], we propose a leakage-cleaning approach and apply it to reduce the false-positive rate after airway segmentation. Additionally, we conducted two experiments to evaluate our method’s performance. The CT scans for testing and evaluating were collected from both clinics and competition. In detail, the paper is organized as follows. We first present the experimental results of 45 CT scans. Then, a comparison with other works is given, and the findings are discussed. The conclusion section summarizes the issues addressed and the problem that should be addressed further. Finally, the segmentation framework and the detailed steps of the proposed method are introduced systematically. This section mainly includes the method of modified two-pass region growing, multi-planar gray-scale morphological reconstruction and the leakage elimination.
Methods
Data
Comparison of different segmentation methods of the airway tree is challenging and difficult, especially when covering a large and diverse dataset under various conditions. The public segmentation competition and lung image database make it possible to compare different methods with each other. Particularly, the Extraction of Airways from the CT 2009 (EXACT09) airway extraction challenge [20] provides a platform to compare the algorithms by applying the same image sets and a unified reference standard. Consequently, in this work, 45 CT scans, including 15 scans from the Lung Image Database Consortium (LIDC), 10 scans from the Department of Radiology, Shanghai Pulmonary Hospital public database, and 20 scans from the EXACT09 testing set are processed by the proposed method. In detail, voxel gray levels are measured in Hounsfield units (HU). The images are stored in the 16-bit form with a resolution of 512 pixels×512 pixels. The slice thickness of the CT image ranges from 0.6 mm to 2 mm. In the next section, we describe the proposed method in detail.
Framework
To achieve high sensitivity and specificity, a novel growth rule and a leakage detector are designed. Figure 1 illustrates the flowchart of the proposed method. The first-pass region growing is implemented to extract the main bronchus. Then, gray-scale morphological reconstruction and second-pass region growing are successively applied to the slices in the axial, coronal, and sagittal planes to obtain three refined airway trees. Finally, we merge the refined airway trees and pass the result to the leakage filter to get the final airway tree.
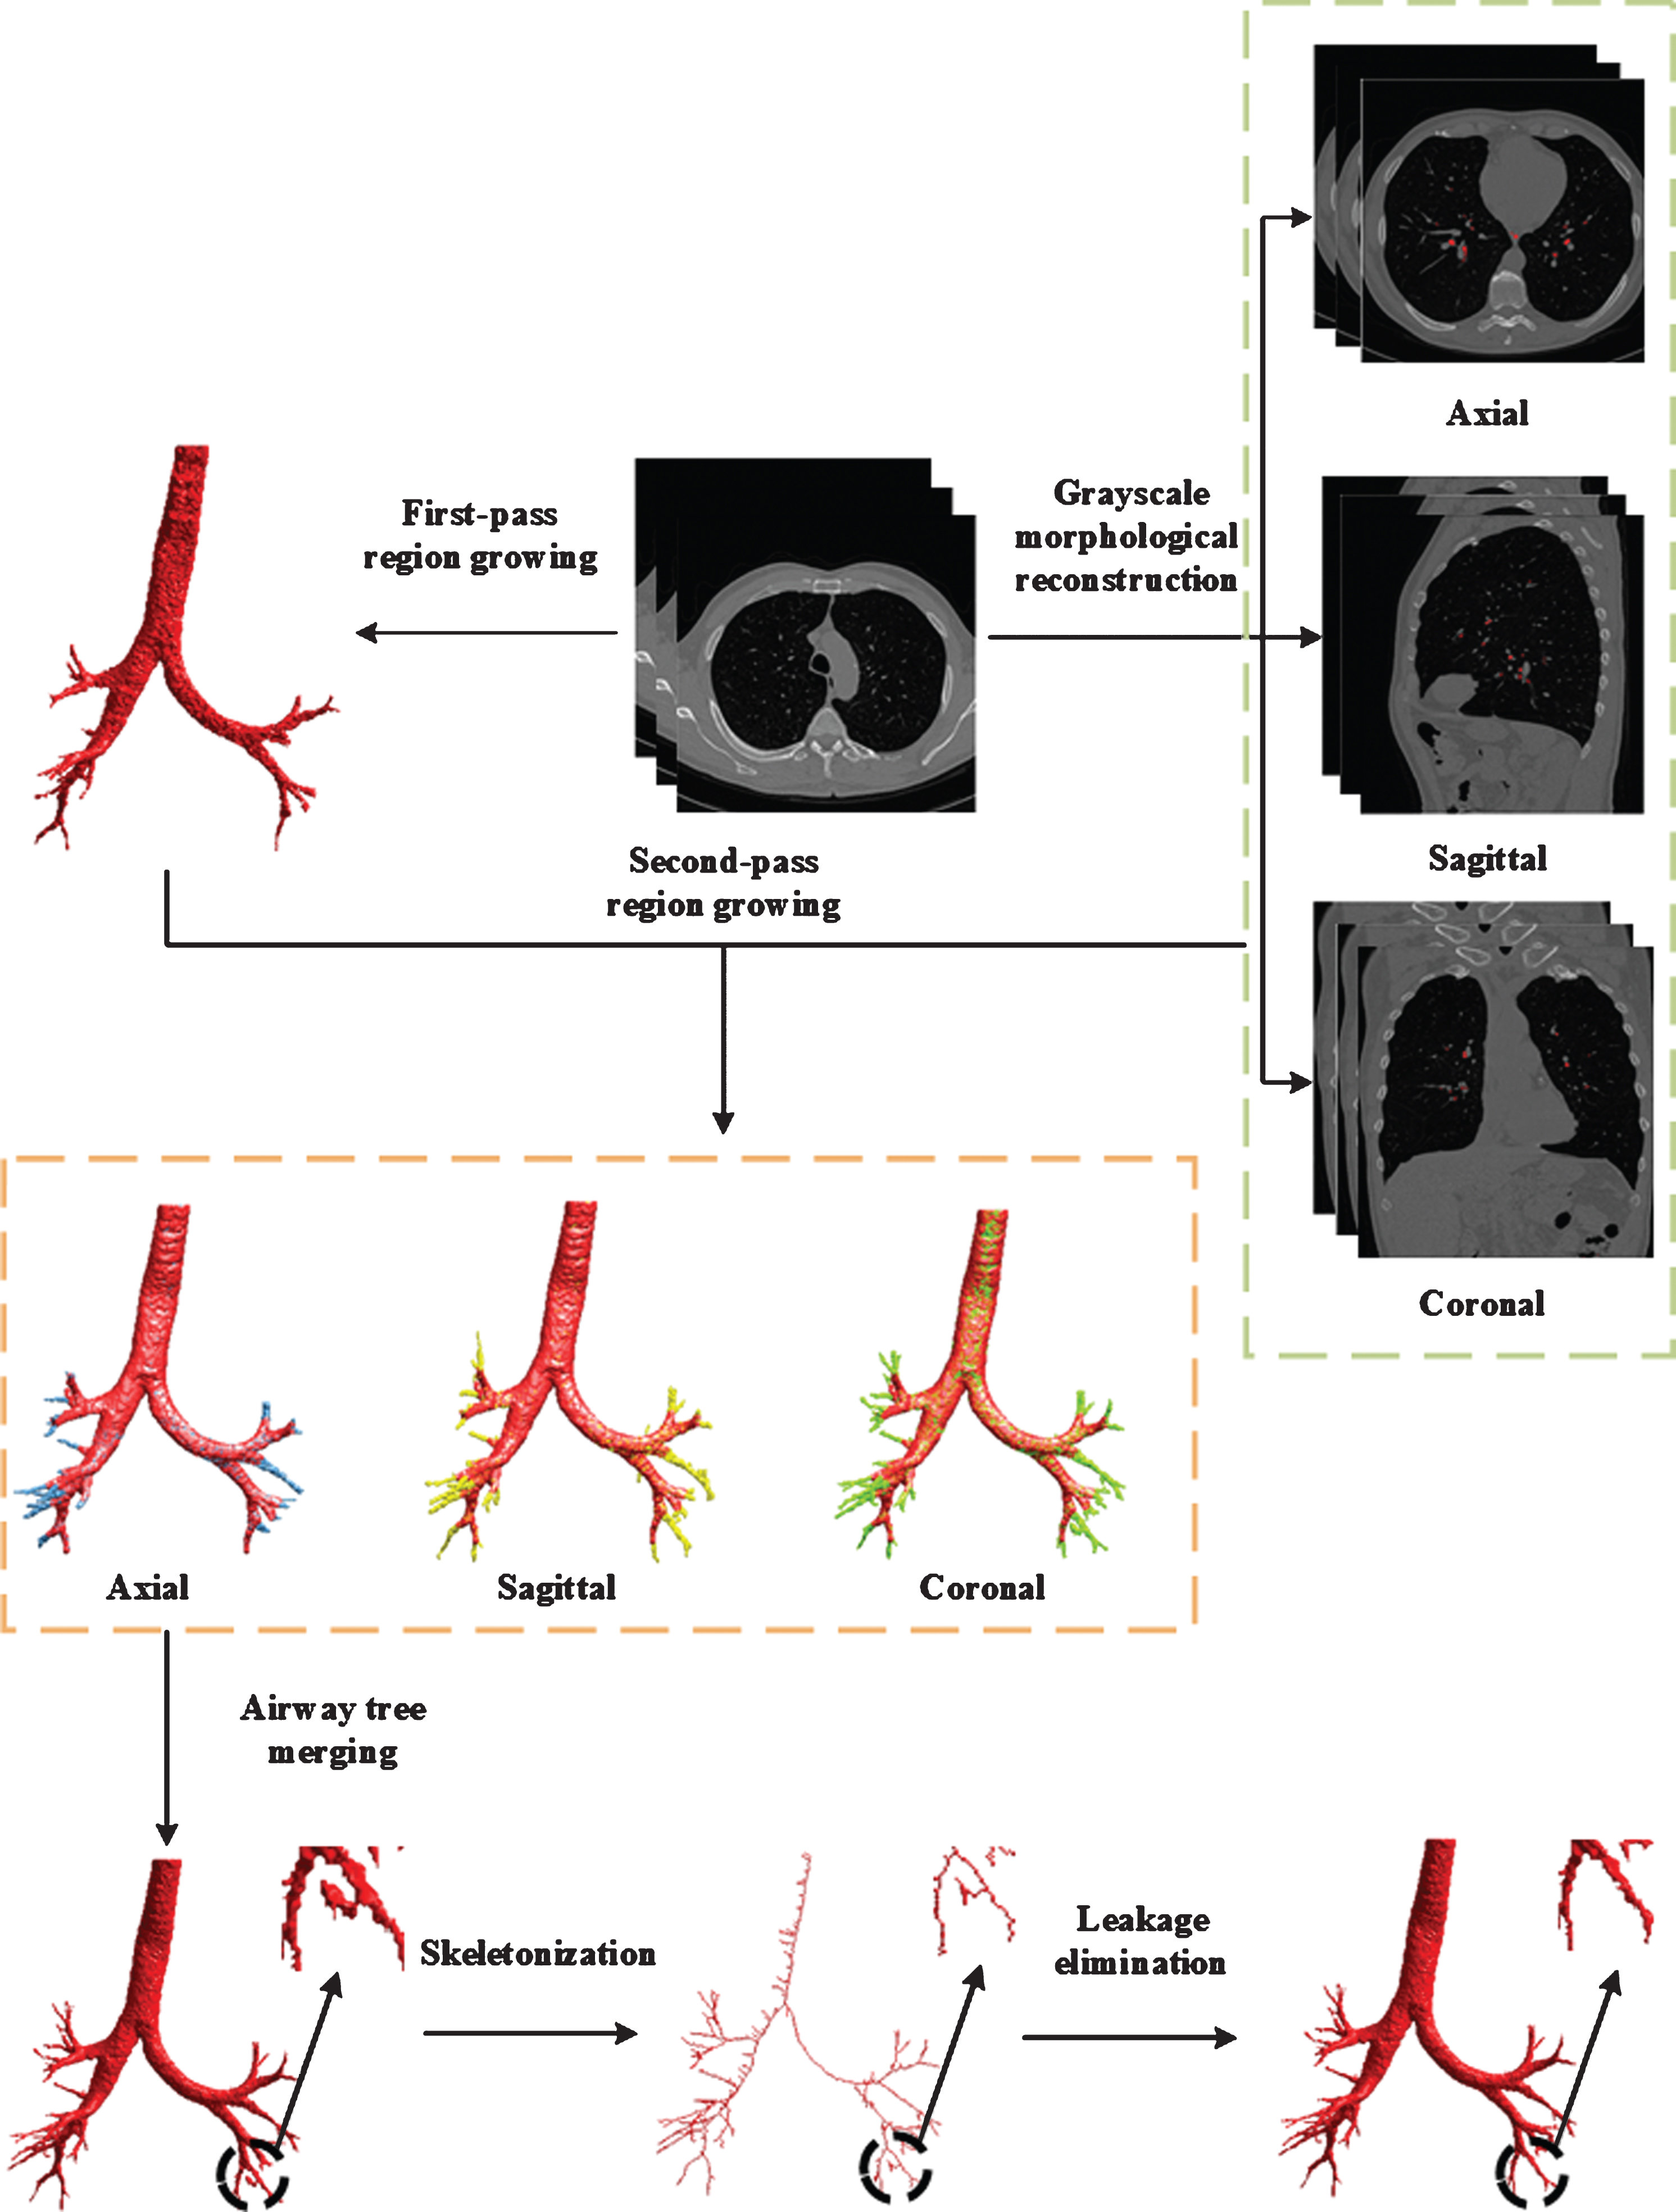
Flowchart of proposed method.
A 3D seeded region growing algorithm is a widely used method for airway segmentation. The method examines whether the voxel, namely the current voxel, should be added to the interest region through a pre-defined region membership. Once the voxel is added, its neighbors will become the new voxel to be examined. The process is iterated until the examination queue is empty. However, traditional region growing has the following shortcomings: Leakage: Due to the single threshold rule, leakage may occur through a blurred or broken airway wall, thus forming “mushroom cloud” like results [21]. Under-segmentation: The threshold value for region growing is often obtained by a priori information or set as the empirical value through repeated tests, which may result in under-segmentation.
Thus, performance of the traditional region growing is usually affected by the quality of the CT image. Therefore, the first-pass region growing was designed to extract the main bronchi as completely as possible and limit the leakage. In the previous methods, the Gaussian filter or Gaussian-Laplace filter was implemented to reduce the influence of noise or to enhance the edge. Considering that the experimental data contains a high level of noise, we first smooth the original image by using a Gaussian filter at a scale of 0.5 millimeters. Next, seed detection is performed in a 2D image slice. Due to the noise in the first few slices, the gray level differences between two adjacent voxels in the airway lumen might be huge, which easily causes the problem of under-segmentation. Therefore, to avoid this problem, the slice number of the 2D image is defined as slice_num = round (total_slice × 0.1), where the total_slice is the total number of slices in a CT scan, round () represents rounding function. Afterward, according to the gray value distribution of airway lumen, a threshold value (-800 HU) is set to get the binary image. In the end, the center of mass of a connected domain with a radius ranging from 1.0 cm to 2.3 cm is identified as the seed point.
In order to limit the leakage, strict criteria are adopted to constrain the first-pass region growing. Starting from the seed point, the current voxel is classified as a voxel belonging to the airway lumen if both of the following conditions are true:
1) Current voxel
The current voxel, denoted by (x c , y c , z c ), is a candidate voxel located in the 26-neighborhood of an already-segmented-lumen point, denoted by (x a , y a , z a ). The gray-level difference ΔV is not more than the threshold H. The ΔV is shown in Equation (1).
The proposed region growing method starts at the center mass of the main bronchi. In general, at the beginning of growing, the 26 connected ‘current voxel’ is more likely to be a voxel belonging to airway lumen. Moreover, in the CT images that contain a high noise level, the growth would stop prematurely. Thus, the 26-adjacency growing criterion is more robust to noise than the 6-adjacency one. On the contrary, in the lower order bronchi or near the boundary between airway lumen and wall, the broken and thick airway walls occur frequently. If we use the 26-adjacent to definite the ‘neighbors’, the region may contain pulmonary parenchyma and thus lead to a high average gray level. As a result, one voxel of airway wall discontinuousness can cause the region growing algorithm to leak into the lungs. Consequently, to keep a balance between under-segmentation and leakage, we chose 26-adjacency for a current voxel and 6-adjacency for the neighbors.
2) Neighbors
The difference between the gray levels of the 6 neighbors of the current voxel and the average gray level of the voxels defined as the airway lumen is not more than H. Meanwhile, to prevent the under-segmentation caused by the noise or tracheal stenosis, an iterative optimization method (respectively, with initial value H = 0.05 and step size ΔH = 0.01) is adopted to determine the optimal value of H. In each iteration, the value of H is increased according to the step size. The iteration continues if all the following conditions are true: Average gray level: The average gray level of voxels defined as the airway lumen is not more than mx
a
vr
g
. Maximal value: The maximal value of H is not more than mx
h
. Number of voxels: The number of voxels (N
c
) of the current iteration differs from the number of voxels (N
f
) of the last iteration by not more than mx
v
, that is:
The conditions mean that no leakage occurs and the main bronchus have not been extracted completely. Otherwise, the current value of H is decreased by 0.01. The corresponding segmentation result is regarded as the optimum.
In the first-pass region growing, we intend to segment the main bronchus and extract enough branches to ensure the second-pass region growing performs as desired. The prerequisite is that the result of the first-pass region growing should be leak-free. However, the gray value of airway lumen in the CT scans is around -1000HU to -700HU. On the one hand, one should keep in mind that a higher gray value (e.g. -700HU) corresponds to a lower possibility of a voxel belonging to airway lumen. In other words, a high threshold on gray levels may cause leakage of segmentation into the lung parenchyma. On the other hand, due to the noises or diseases, the gray level differences between two adjacent voxels in the airway lumen can reach -150HU. The segmentation may stop prematurely if the value of ΔN is low. Therefore, the mx a vr g , mx h , and mx v were comprehensively used to constrain the first-pass region growing. The leakage is limited by the constraints of the average gray level and the volume ratio of the airway trees. The under-segmentation is avoided by setting the optimum value of H.
After the first-pass region growing, the rough airway tree and the optimum value of H (H0) are subsequently passed to the second-pass 3D region growing. Figure 2 illustrates the segmented results of the main bronchus.
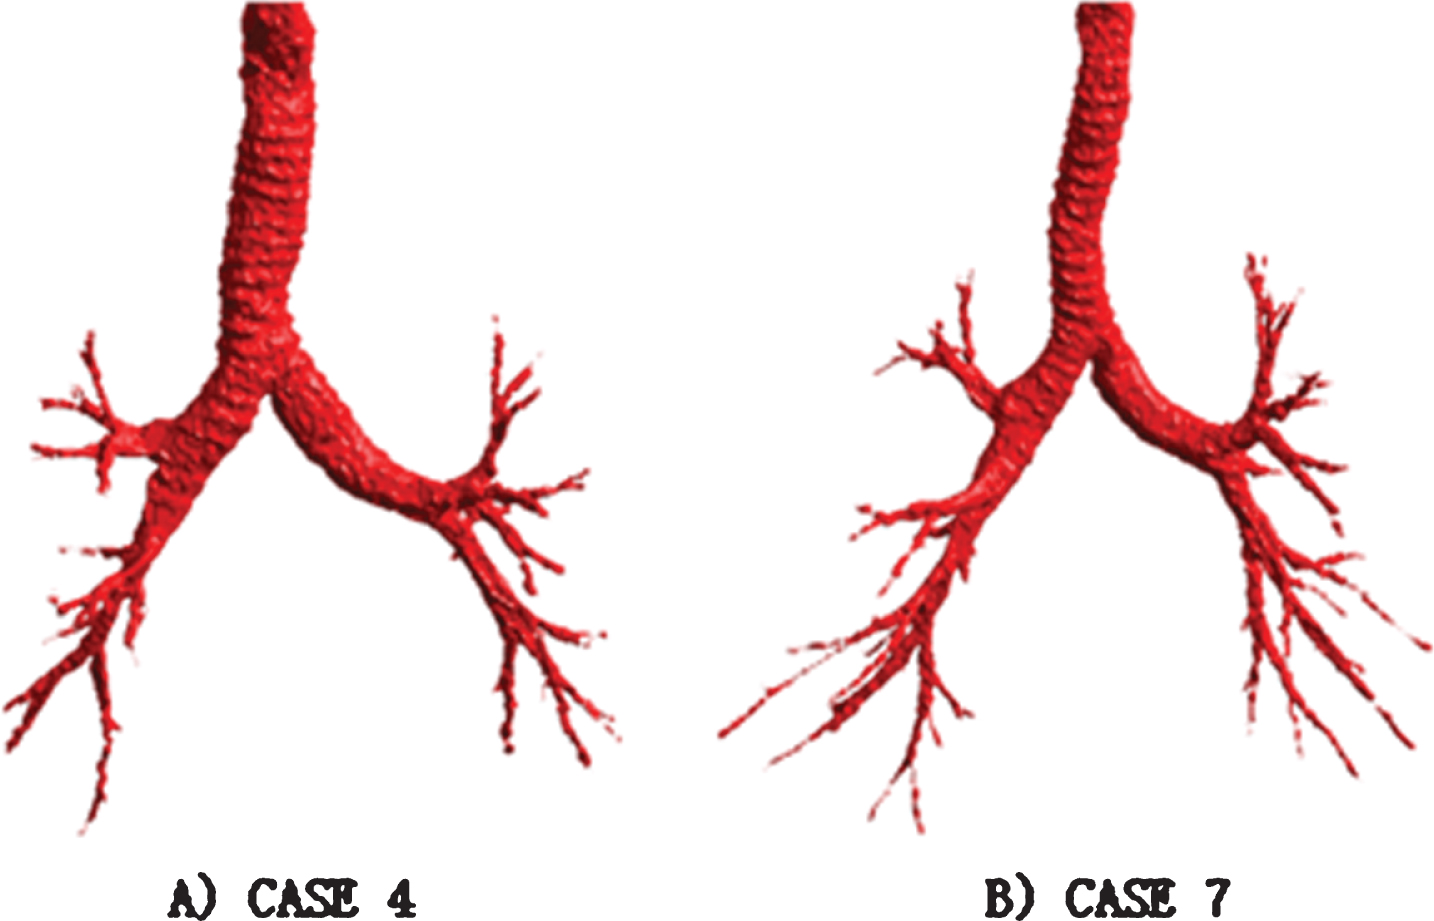
The results obtained from first-pass region growing. A) The segmentation result of CASE 4. B) The segmentation result of CASE 7.
In the CT image, the dark airway lumen is surrounded by the bright airway wall. There is thus a contrast between the airway lumen and wall. Therefore, the possible locations of the distal airway can be considered as a local minimum and marked by morphological reconstruction.
In order to handle airways of different sizes, a range of morphological structure elements (SE) is defined by successive dilation. The equation is shown in (3), where D is a 4-neighborhood binary structure element and ⊕ is the dilation operator. D is dilated ntimes by itself to get D
n
.
The morphological closing operation, as shown in (4), is then implemented on the smoothed image slice B to construct a marker image.
Then, a difference image
Aykac et al. [5] have proved that this technique is effective for accurately identifying the potential airways on 2-D cross slices. However, Aykac’s method is not sensitive to the branches that perpendicular to other planes, e.g. sagittal or coronal plane. As a result, those branches would be omitted. Although a 3D morphological reconstruction would be the ideal method to overcome this shortage, it is difficult to find a structure element that adapts to the huge differences in direction and length between airway branches. Moreover, an attempt was made to compare the Hessian-matrix based method with the morphological approach we used on the same datasets. As for Hessian-matrix based method, it turns out that the Gaussian smooth and noise would blur the feature used to detect the distal airway and thus results in lower robustness, sensitivity, and specificity than our method. Hence, as an alternative approach, we applied the gray-scale reconstruction on the axial, coronal and sagittal slices simultaneously. The numbers of dilation n used to create the structure element D
n
are set to 8, 6 and 6 respectively. Then maps of the possible location of airways M
x
, M
y
and M
z
are obtained through the method mentioned above. All of them are further passed to the second-pass region growing. In this step, we aim to detect the small airway lumen which is omitted in the first-pass region growing. So, on the one hand, we set a small number for n; and on the other hand, the number n for axial slices is set as 8 to avoid the disconnection between main bronchus and the detected small airway lumen. Additionally, threshold fraction T
i
is used to control the sensitivity for detection of the potential small airway. If the value of T
i
is too small (e.g. 0.1), then noises contained in the difference image

The result obtained by gray-scale and thresholding. A) The small airway detected in axial slice. B) The original CT scan.
The second-pass of region growing is implemented on the axial, coronal, and sagittal planes to detect the distal airway. Starting from the seed point of the rough airway tree, the process is constrained and guided by three 3D binary maps of possible airway locations. The current voxel is classified as a voxel belonging to the airway lumen if both of the following conditions are true: The current voxel is one of 26 neighbors of the voxel belonging to the airway lumen, and the current voxel is in one of the maps M (M
x
,M
y
orM
z
) of the rough airway tree. The difference between the gray level of the current voxel and the average gray level of voxels classified as airway lumen is not more than twice H
o
(H
s
).
The maps M (M x , M y and M z ) are introduced to constrain the segmentation of the distal airway, near which the gray level of the airway lumen is closer to the level of the pulmonary parenchyma. Therefore, a moderate increase of H o is necessary for detecting the distal airway. According to the results, it is more appropriate to determine the H s based on the value of H o compared with the method that uses the constant value. At the same time, the leakage caused by too large values of H s can be avoided as well.
Airway tree merging
Refined airway trees of the axial, coronal and sagittal planes are obtained through the second-pass region growing and further combined into one tree, which means that the merged tree is the union of three refined trees.
The axial, coronal, and sagittal anatomical body planes are commonly used in clinical practice. As shown in Fig. 4, the second-pass region growing results of the three planes are presented, in which the blue, green and yellow parts are the branches extracted in axial, coronal, and sagittal planes respectively. Furthermore, the combination of these results is also presented to show the contribution of each plane to the final result. After the second-pass region growing, the refined airway trees are stored in axial, coronal and sagittal coordinates respectively. In order to obtain the union tree, the corresponding state of voxels in the three refined trees is checked at the same time. The current voxel is merged into the union tree if it is marked as an airway lumen in any or all of the three refined airway trees. The process is completed when no more voxels can be merged. Then the union airway tree is obtained.
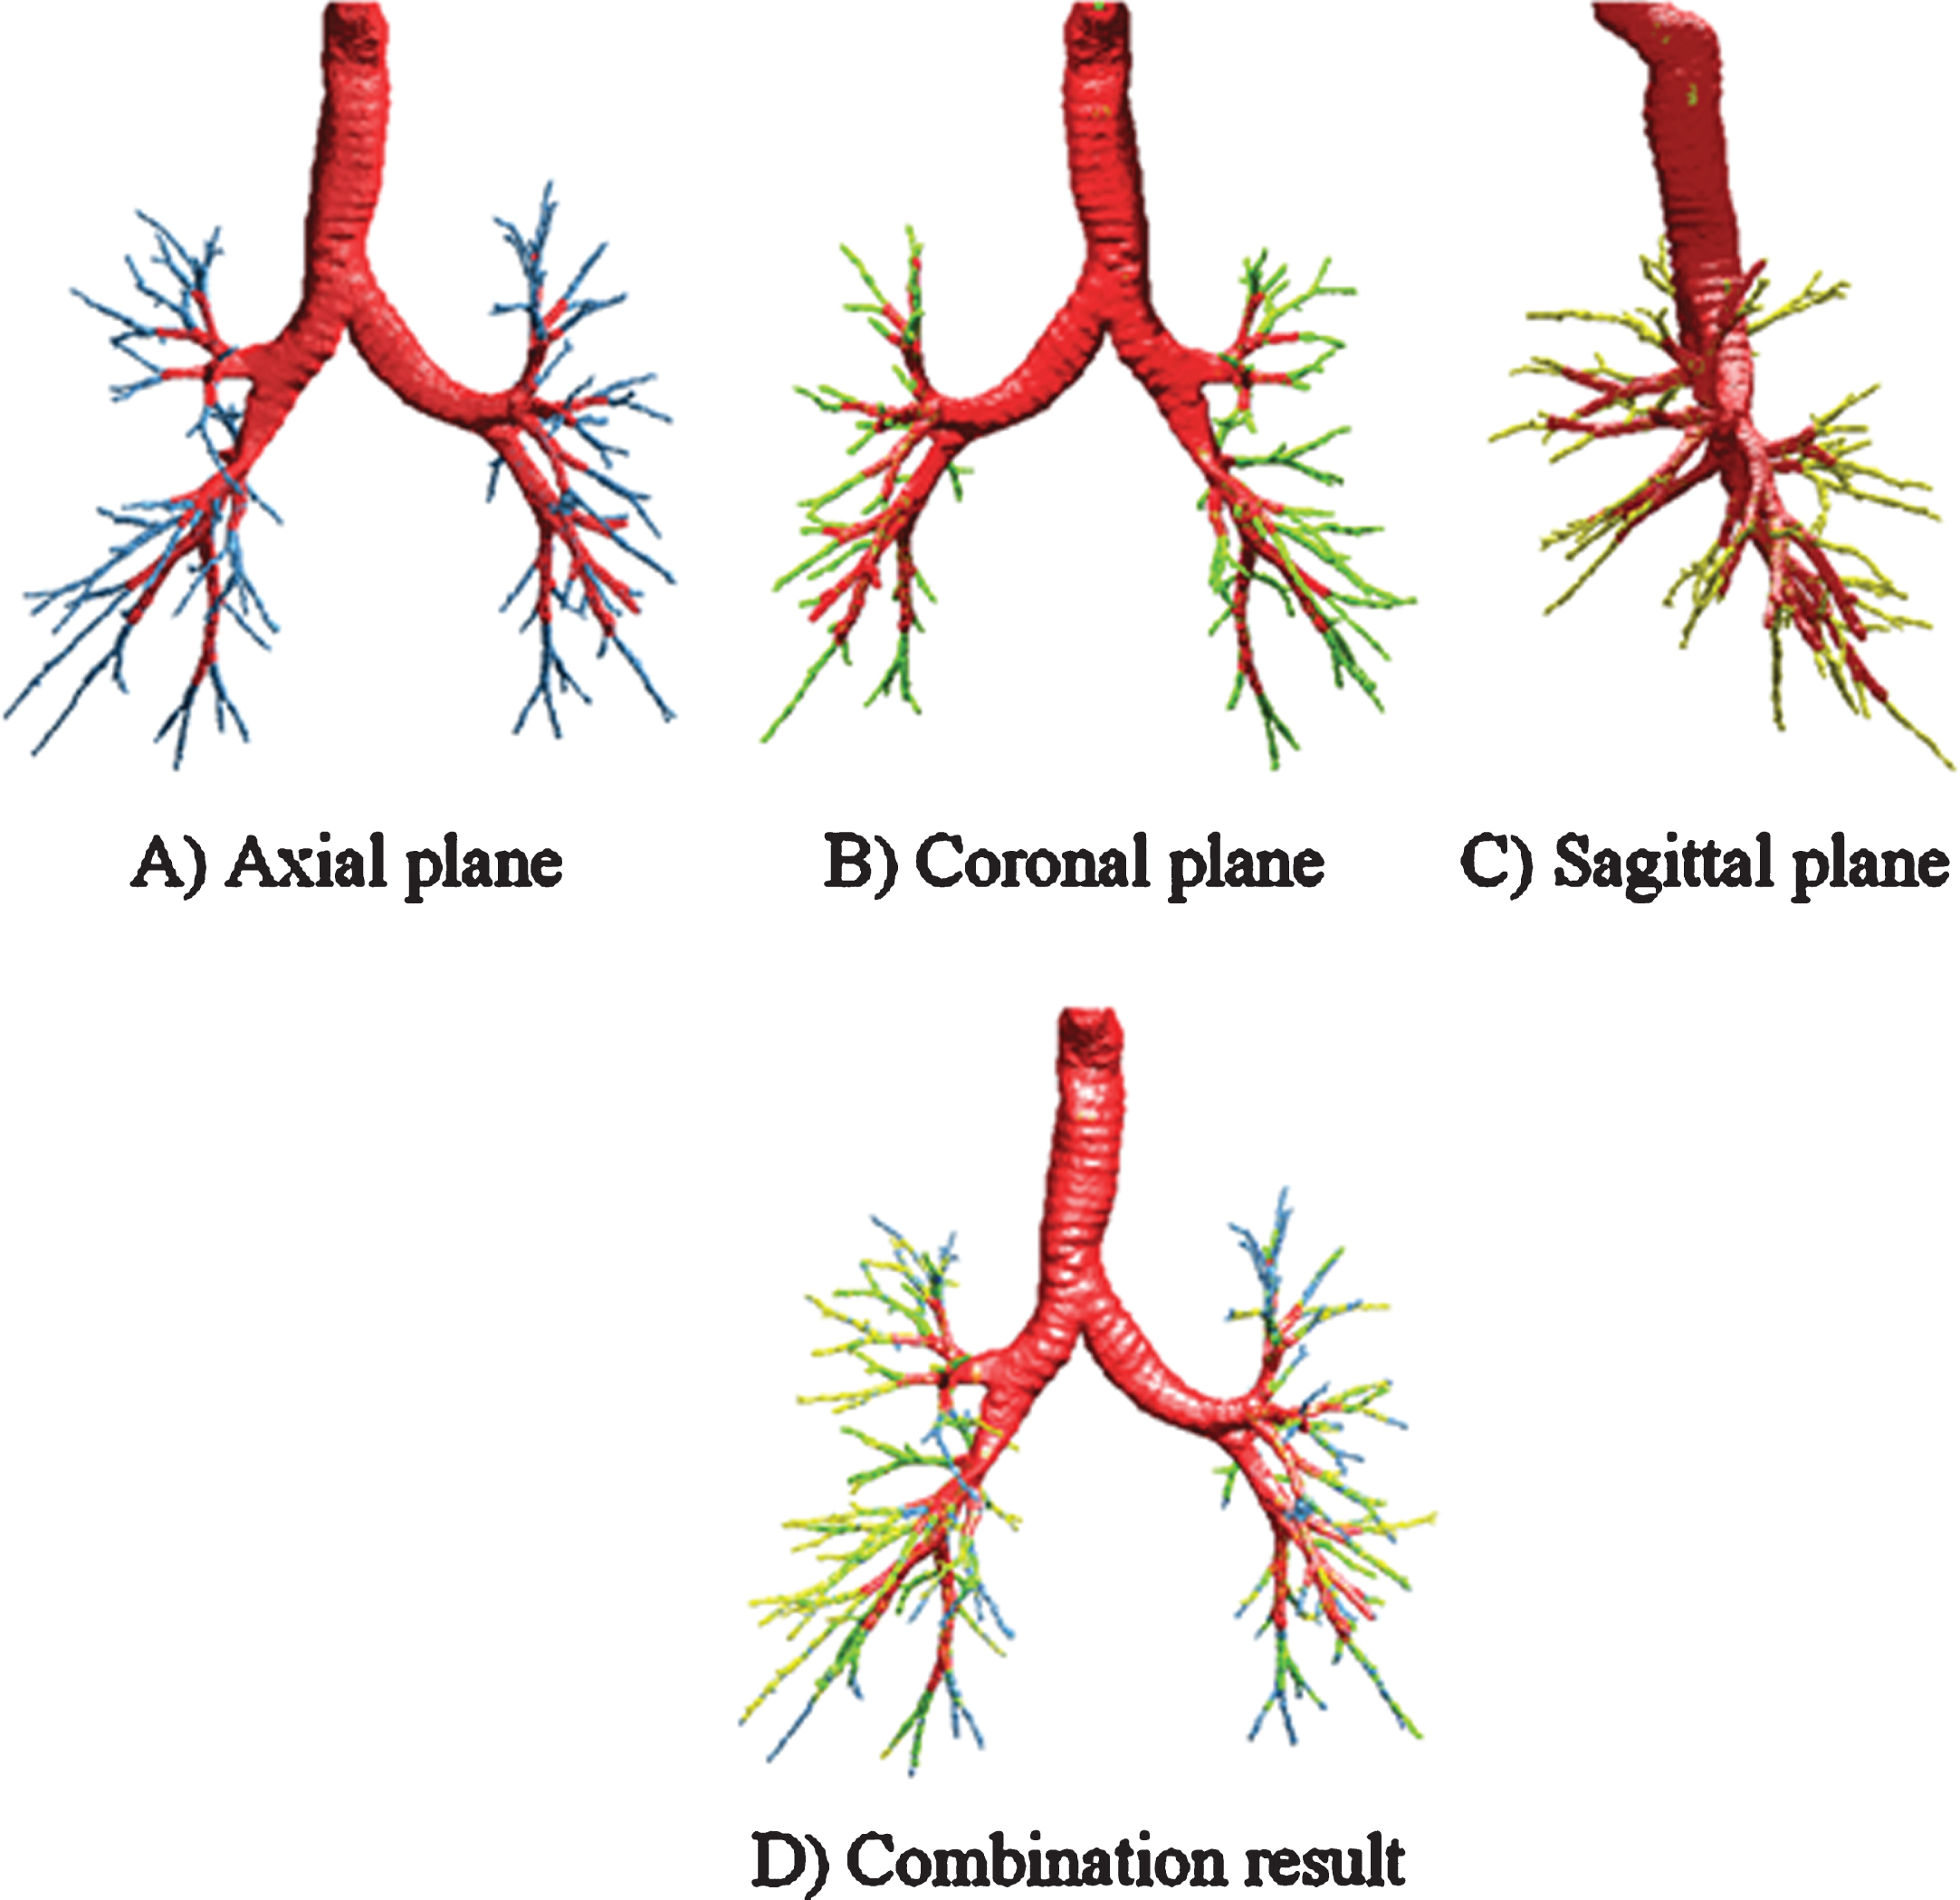
The region growing results in three planes and its combination result, in which the red part indicates the result obtained in the first-pass region growing. (A) Result in axial plane, in which the branches extracted in axial plane are marked in blue. (B) Result in coronal plane, in which the branches extracted in coronal plane are marked in green. (C) Result in sagittal plane, in which the branches extracted in sagittal plane are marked in yellow. (D) Combination result.
In the case of low-dose CT images or images with high noise, although strict criteria have been adopted to constrain and guide the segmentation process, leakage inevitably occurs in the merged tree. Therefore, we proposed a leakage detector to eliminate the leakage. The flowchart is shown as follows.
As shown in Fig. 5, the leakage no longer exhibits a tree-like shape. On the contrary, a segmentation result with no obvious leakage rarely shows this non-tubular structure. Therefore, the proposed leakage detector utilizes the structural characteristics of the leakage region.
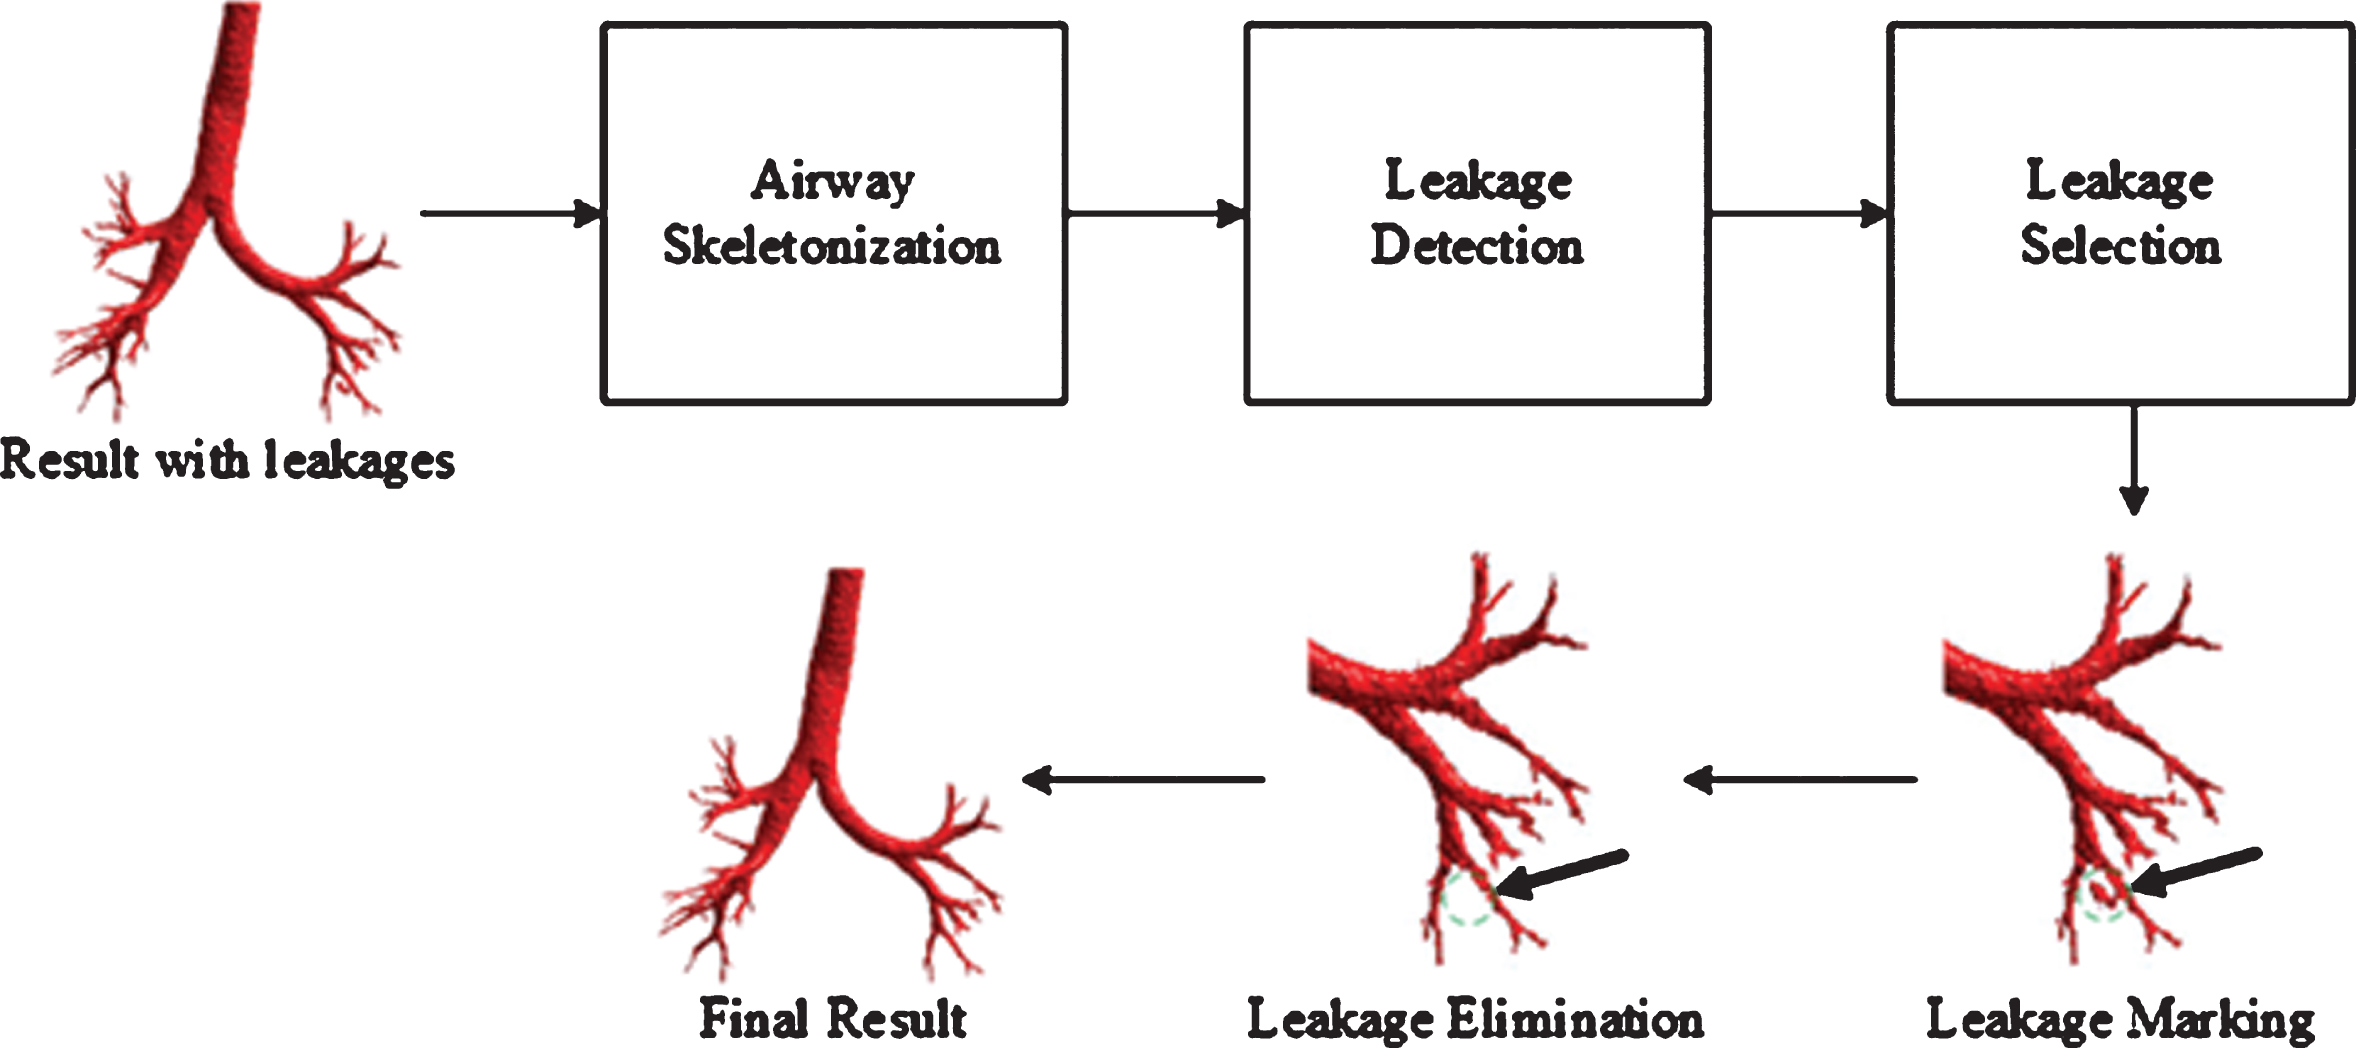
The flowchart of leakage detection and elimination.
The sequential thinning algorithm [22, 23] is performed on the merged tree to get the rough skeleton. In an airway skeleton, four types of points can be identified, namely endpoints, line points, branch points, and root points. As shown in Fig. 6, the line point has two 26- neighbors, while the endpoint has only one 26-neighbors. The branch point which forms the junctions has more than two 26-neighbors. The root point is detected in the first non-zero 2D slice in cross-section. In the cases that the junction is formed by more than one branch point, the branch point closest to the root point is the reference point of the junction. After skeletonization, a topological kernel remains after the process and the size of the kernel is used as a leak detector. If the size of the topological kernel is 1, that indicates no leak, otherwise, a leak occurs. In other words, the leakage in the skeleton corresponds to the shape of a ring or mesh. Naturally, the ring or mesh must consist of more than one voxel, which is taken as an indication of a leak.

Four types of points in the airway skeleton.
Generally, after the skeletonization process, the leakage region would form a closed ring-like or mesh structure. The skeleton will no longer be a binary tree-like structure. Therefore, if the leak occurs, the skeleton is transformed into a graph structure [24, 25], where the branch points correspond to the graph node, and the endpoints correspond to the leaves of the tree. An edge exists between two nodes if the corresponding line points are 26-adjacent. Then, all the graph nodes are checked. The nodes and their corresponding edges are marked as the skeleton of the leakage region if all the following conditions are met: The adjacent branch points (nodes) and their corresponding edges can form a loop or mesh structure. The number of the branch points (nodes) that form the loop or mesh structure is not more than 4.
After this process, the skeleton of the leakage region is extracted.
Leakage elimination
After the processes above, we first calculated the centroid of the detected skeleton, as well as the minimum radius and orientation of the ellipsoid that have the same normalized second central moments as the marked skeleton. A morphological dilation is then applied to the detected skeleton with a ball structuring element (ellipsoid). Lastly, the leakage region is marked and further eliminated from the airway tree. The remaining region which is not connected to the airway tree is considered as leakage and removed as well. Consequently, the final airway tree is obtained.
In general, a large mesh structure usually consists of several small loops, in which the skeleton of the airway branch may be contained. However, the morphological dilation process is started at the centroid of the leakage skeleton. The ball structuring element (ellipsoid) will cover most of the central parts of the leakage. The airway branches in the center might be eliminated if the size of loop or mesh structure is too large. Conversely, if we set a cut-off value to limit the number of the nodes that form a loop or a mesh structure, a marked skeleton of the leakage as in Fig. 7 (B) can be obtained. Although part of the skeleton of the airway branch is contained, it is less affected by the elimination process since the skeleton is located in the peripheral zone of the marked region. By testing the different maximum number of the nodes, setting the cut-off value to 4 is relatively ideal. Under this condition, we can obtain an appropriately marked region of the leakage. This detection and elimination operation overcome the defects of the method based on morphology. The accuracy of the final segmentation result is improved, as well.
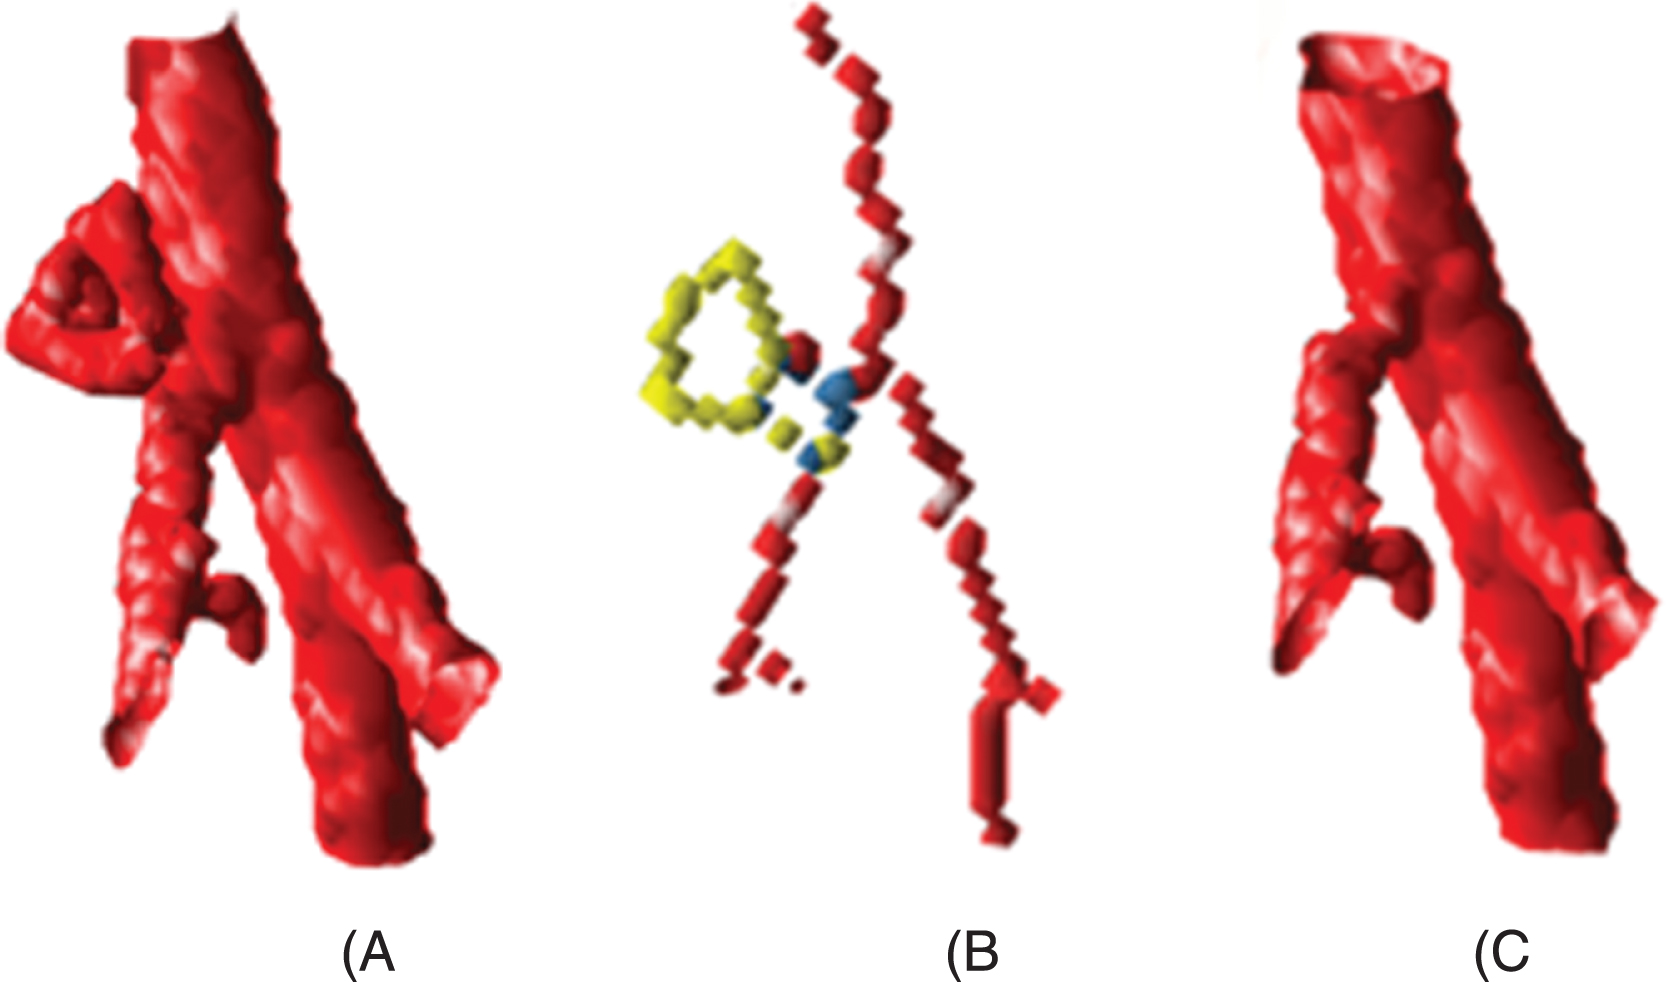
An example of the leakage, its corresponding skeleton and the result after elimination process. For the easy observation, the junction and the edge forming the loops are marked in blue and yellow respectively. A) The airway branches with leakage. B) The corresponding skeleton. C) The airway branches after elimination process.
Experiments set-up
Before experimenting, the parameters used in the segmentation and leakage elimination process should be initialized. In the first-pass region growing, the initial value of the threshold H was set as 0.05 with a step size 0.01. The maximum value (mx h ) of H was 0.11. The maximum average gray level of already-segmented lumen voxels mx a vr g took a value of –848.5 HU. The mx v was set as 0.2. In the second-pass region growing, the numbers of dilation n were set to 8, 6, and 6, respectively. The threshold T i used to obtain the binary map equals to 0.2. In leakage elimination step, the maximum number of the nodes that form a loop of mesh structure was set to 4. The values of mx a vr g , mx h and mx v were determined by performing empirical search on 10 CT scans randomly collected from clinic and training data set of EXACT09. These 10 CT scans are not contained in the data set described in the section 2.1. For each case, the segmentation results obtained in the first-pass region growing were checked by visual inspection. The values were recorded before any of these three parameters would cause leakage in the next iteration. After analyzing the results of the 10 CT scans, the parameters were set as above. In the following sections, we first presented the segmentation results obtained by using the current parameters set. Then the effects of the different parameters sets on the reported performance were discussed.
Results of two experiments
To evaluate the performance of the proposed method comprehensively, we performed the experiment with 25 scans randomly collected from LIDC and Shanghai Pulmonary Hospital (10 from Shanghai Pulmonary Hospital and 15 from the public lung image database) and 20 testing scans collected from EXACT09. The proposed method is an extension of our previous work [18], which is a modified version of the TWORG approach outlined in A. Fabijanska et al. [11]. Considering the relationship between the proposed method, our previous method [18], and the method in [11], on the one hand, we want to verify that the proposed method performs better than the TWORG method. On the other hand, the effectiveness of the leakage elimination method should also be evaluated. Therefore, in the first experiment, we used the 25 datasets from LIDC and Shanghai Pulmonary Hospital as those that were employed in our previous study. Furthermore, we compared the proposed method with the TWORG method [11] and our previous method [18]. The surface rendering was used to display the segmented airway tree. According to the results of both methods, the total branch number and the highest order of tree division were summarized respectively, in which false branches in the reconstruction results were excluded by the radiologists.
To display the results clearly, the reconstruction trees were drawn in different colors, and we illustrated the segmentation results of image CASE 2 and CASE 18. As shown in Fig. 8 (A) and (B), the overlapping parts segmented by the proposed method, and the method in [11] were marked in green. The extra branches obtained by the proposed method were marked in red. Parts (C) and (D) depict the results obtained by our previous method [18] and the method in [11]. Similarly, the overlapping parts were displayed in green, and the branches extracted by our previous method were displayed in red. As can be seen from Fig. 8, both our previous method [18] and the method proposed in this paper extracted more peripheral branches than the method in [11] did. In detail, Table 1 presents the statistics, and the first-order division corresponds with the trachea. The quantitative results indicate that the largest total number of branches obtained by the proposed method is 293, and the lowest is 83. The average number of branches across all 25 cases is 155.9. Compared to TWORG, these three indexes are 108, 34 and 64. As indicated by the arrows in Fig. 8 (C) and (D), our previous method [18] failed to eliminate the leakage that occurs in the small airway. The leakage region is removed by our proposed method and the neighbor branch remains.
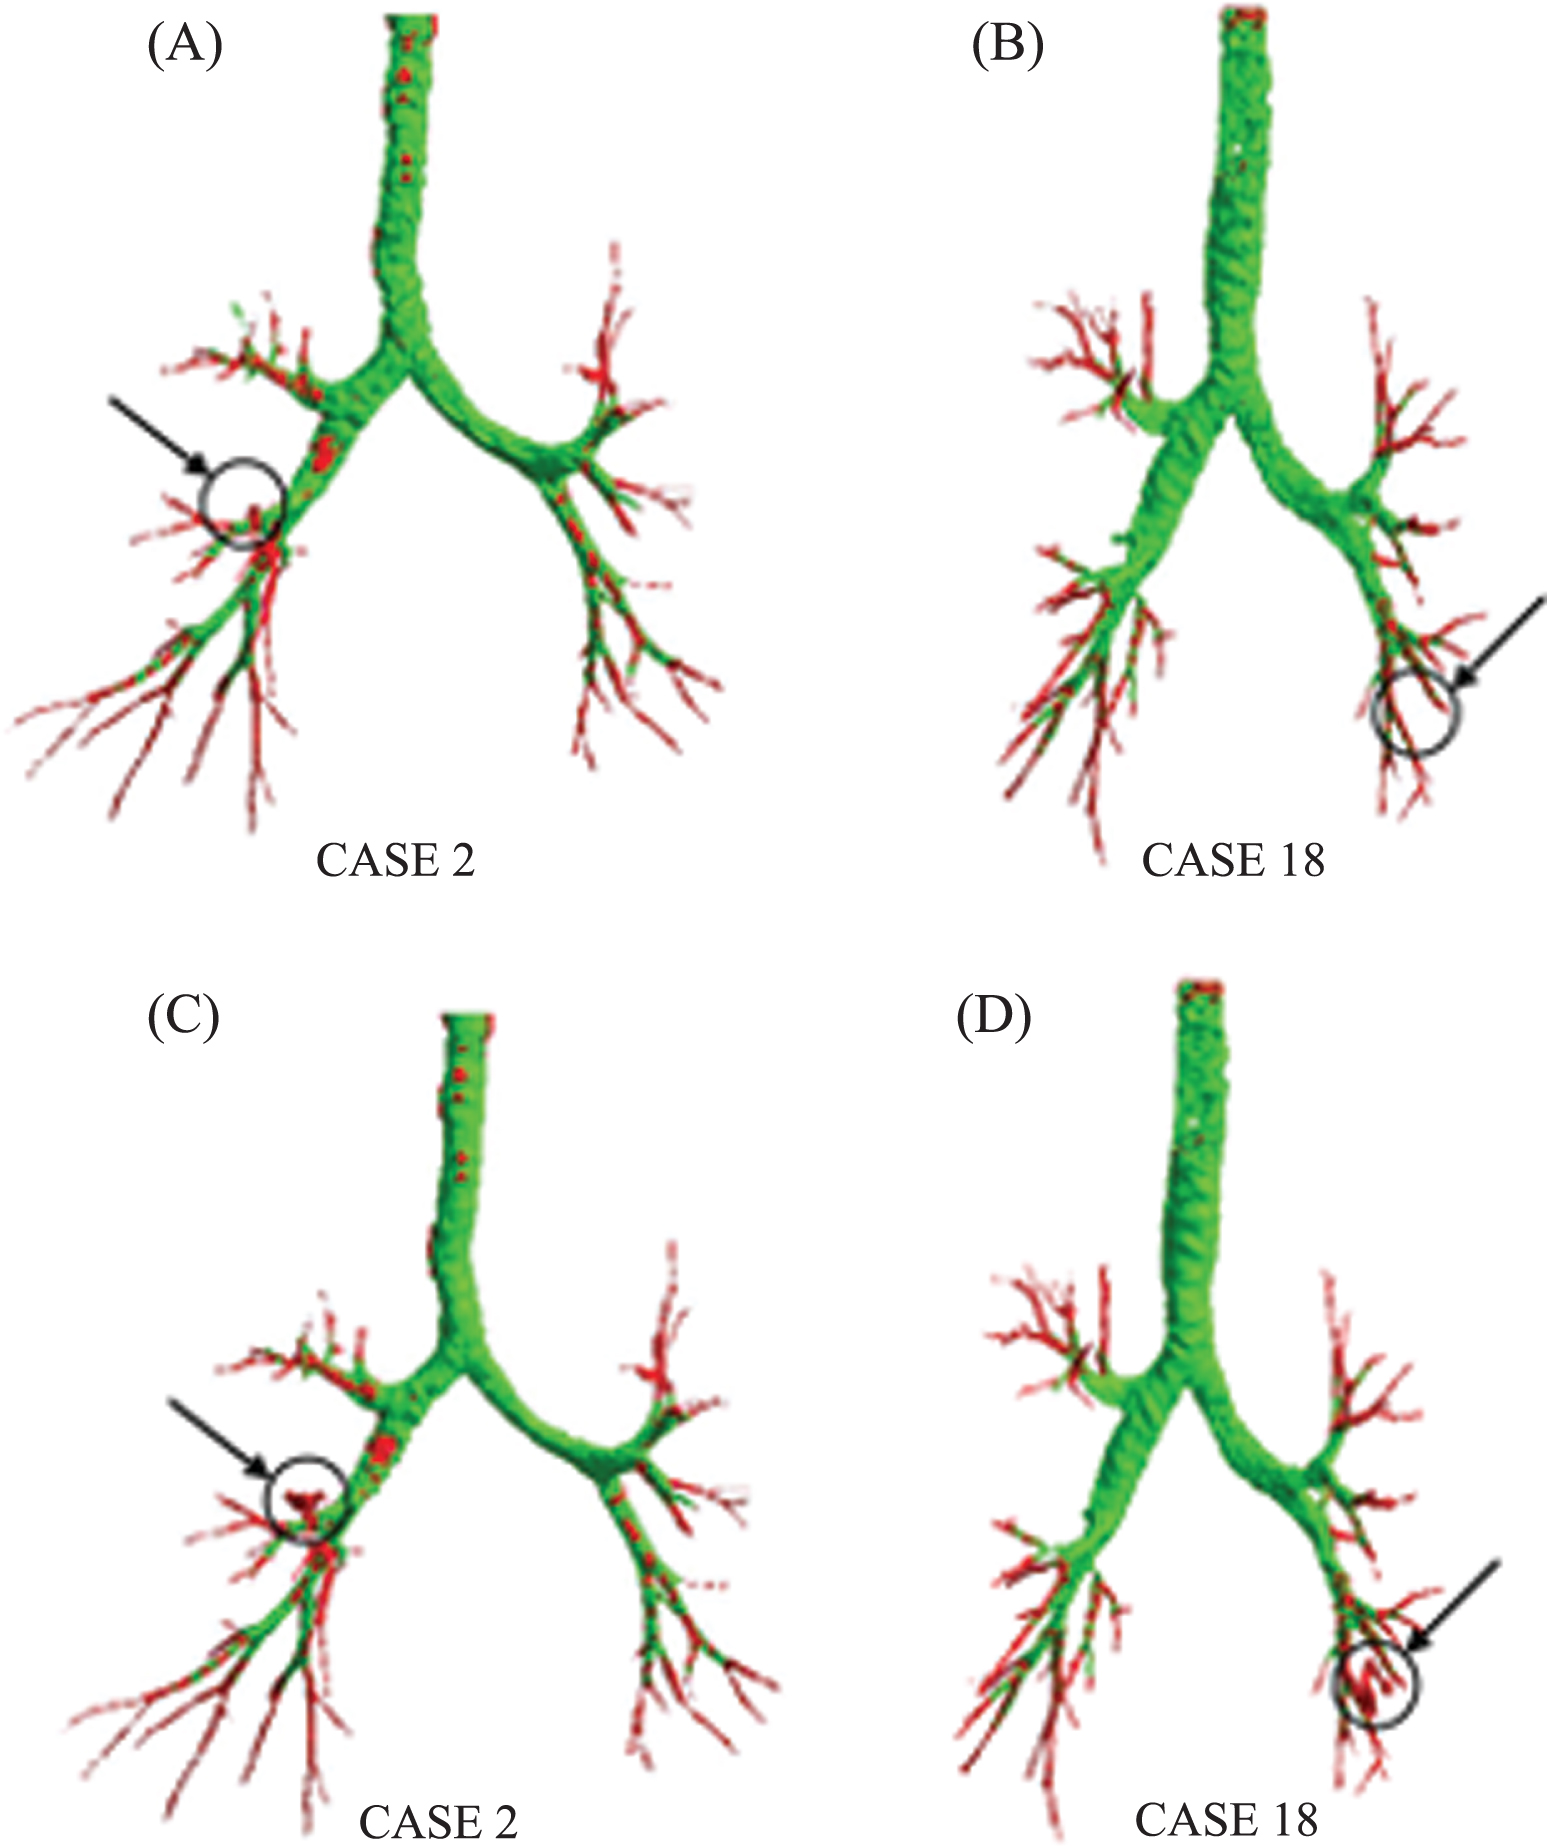
3D segmentation result of image CASE 2 and CASE 18. (A), (B) Results using the proposed method and method in [11], in which the overlapping parts are marked in green and the extra branches obtained by proposed method are marked in red. (C), (D) Results obtained by method in [11] and [18], in which the overlapping parts are marked in green and the extra branches obtained by our previous method [18] are marked in red.
Highest order of detected tree divisions and the count of the number of branches
In the first experiment, we only counted the total number and the highest order of the branch. The quantitative analysis of the leakage elimination method was not presented. Besides, the TWORG method does not give an insight to the power of our proposed method. So, we conducted the second experiment using the EXACT09 data and standard to evaluate our method in a comprehensive and quantitative way. The EXACT09 challenge data consists of 40 scans: a training set and a testing set of 20 scans each, in which the scans were acquired with several different CT scanner brands and models. The conditions of the scanned subjects range from healthy volunteers to patients showing different abnormalities in the airways or lung parenchyma. The data includes low-dose CT scans and scans with a high noise level. The participant can obtain detailed quantitative evaluations by submitting the segmentation results. Hence, for an in-depth evaluation, we applied the proposed method to the testing data set from EXACT 09 in the second experiment. After the experiment, to receive the detailed quantitative measurements, the binary results were submitted to the EXACT09 organizers.
Table 2 lists the statistics of each case received from the EXACT’09 organizers, in which a more in-depth analysis is presented. The reconstruction results of the segmented airway trees are shown in Fig. 9. All the data were run on a 3.20 GHz Intel quad CPU system with 8 GB RAM. The runtime of the proposed method is not more than 20 min for each test scan. Gray-scale morphological reconstruction takes most of the time. However, this part can be further accelerated by parallel computation.
Statistics of all the 20 cases in the EXACT09 test set
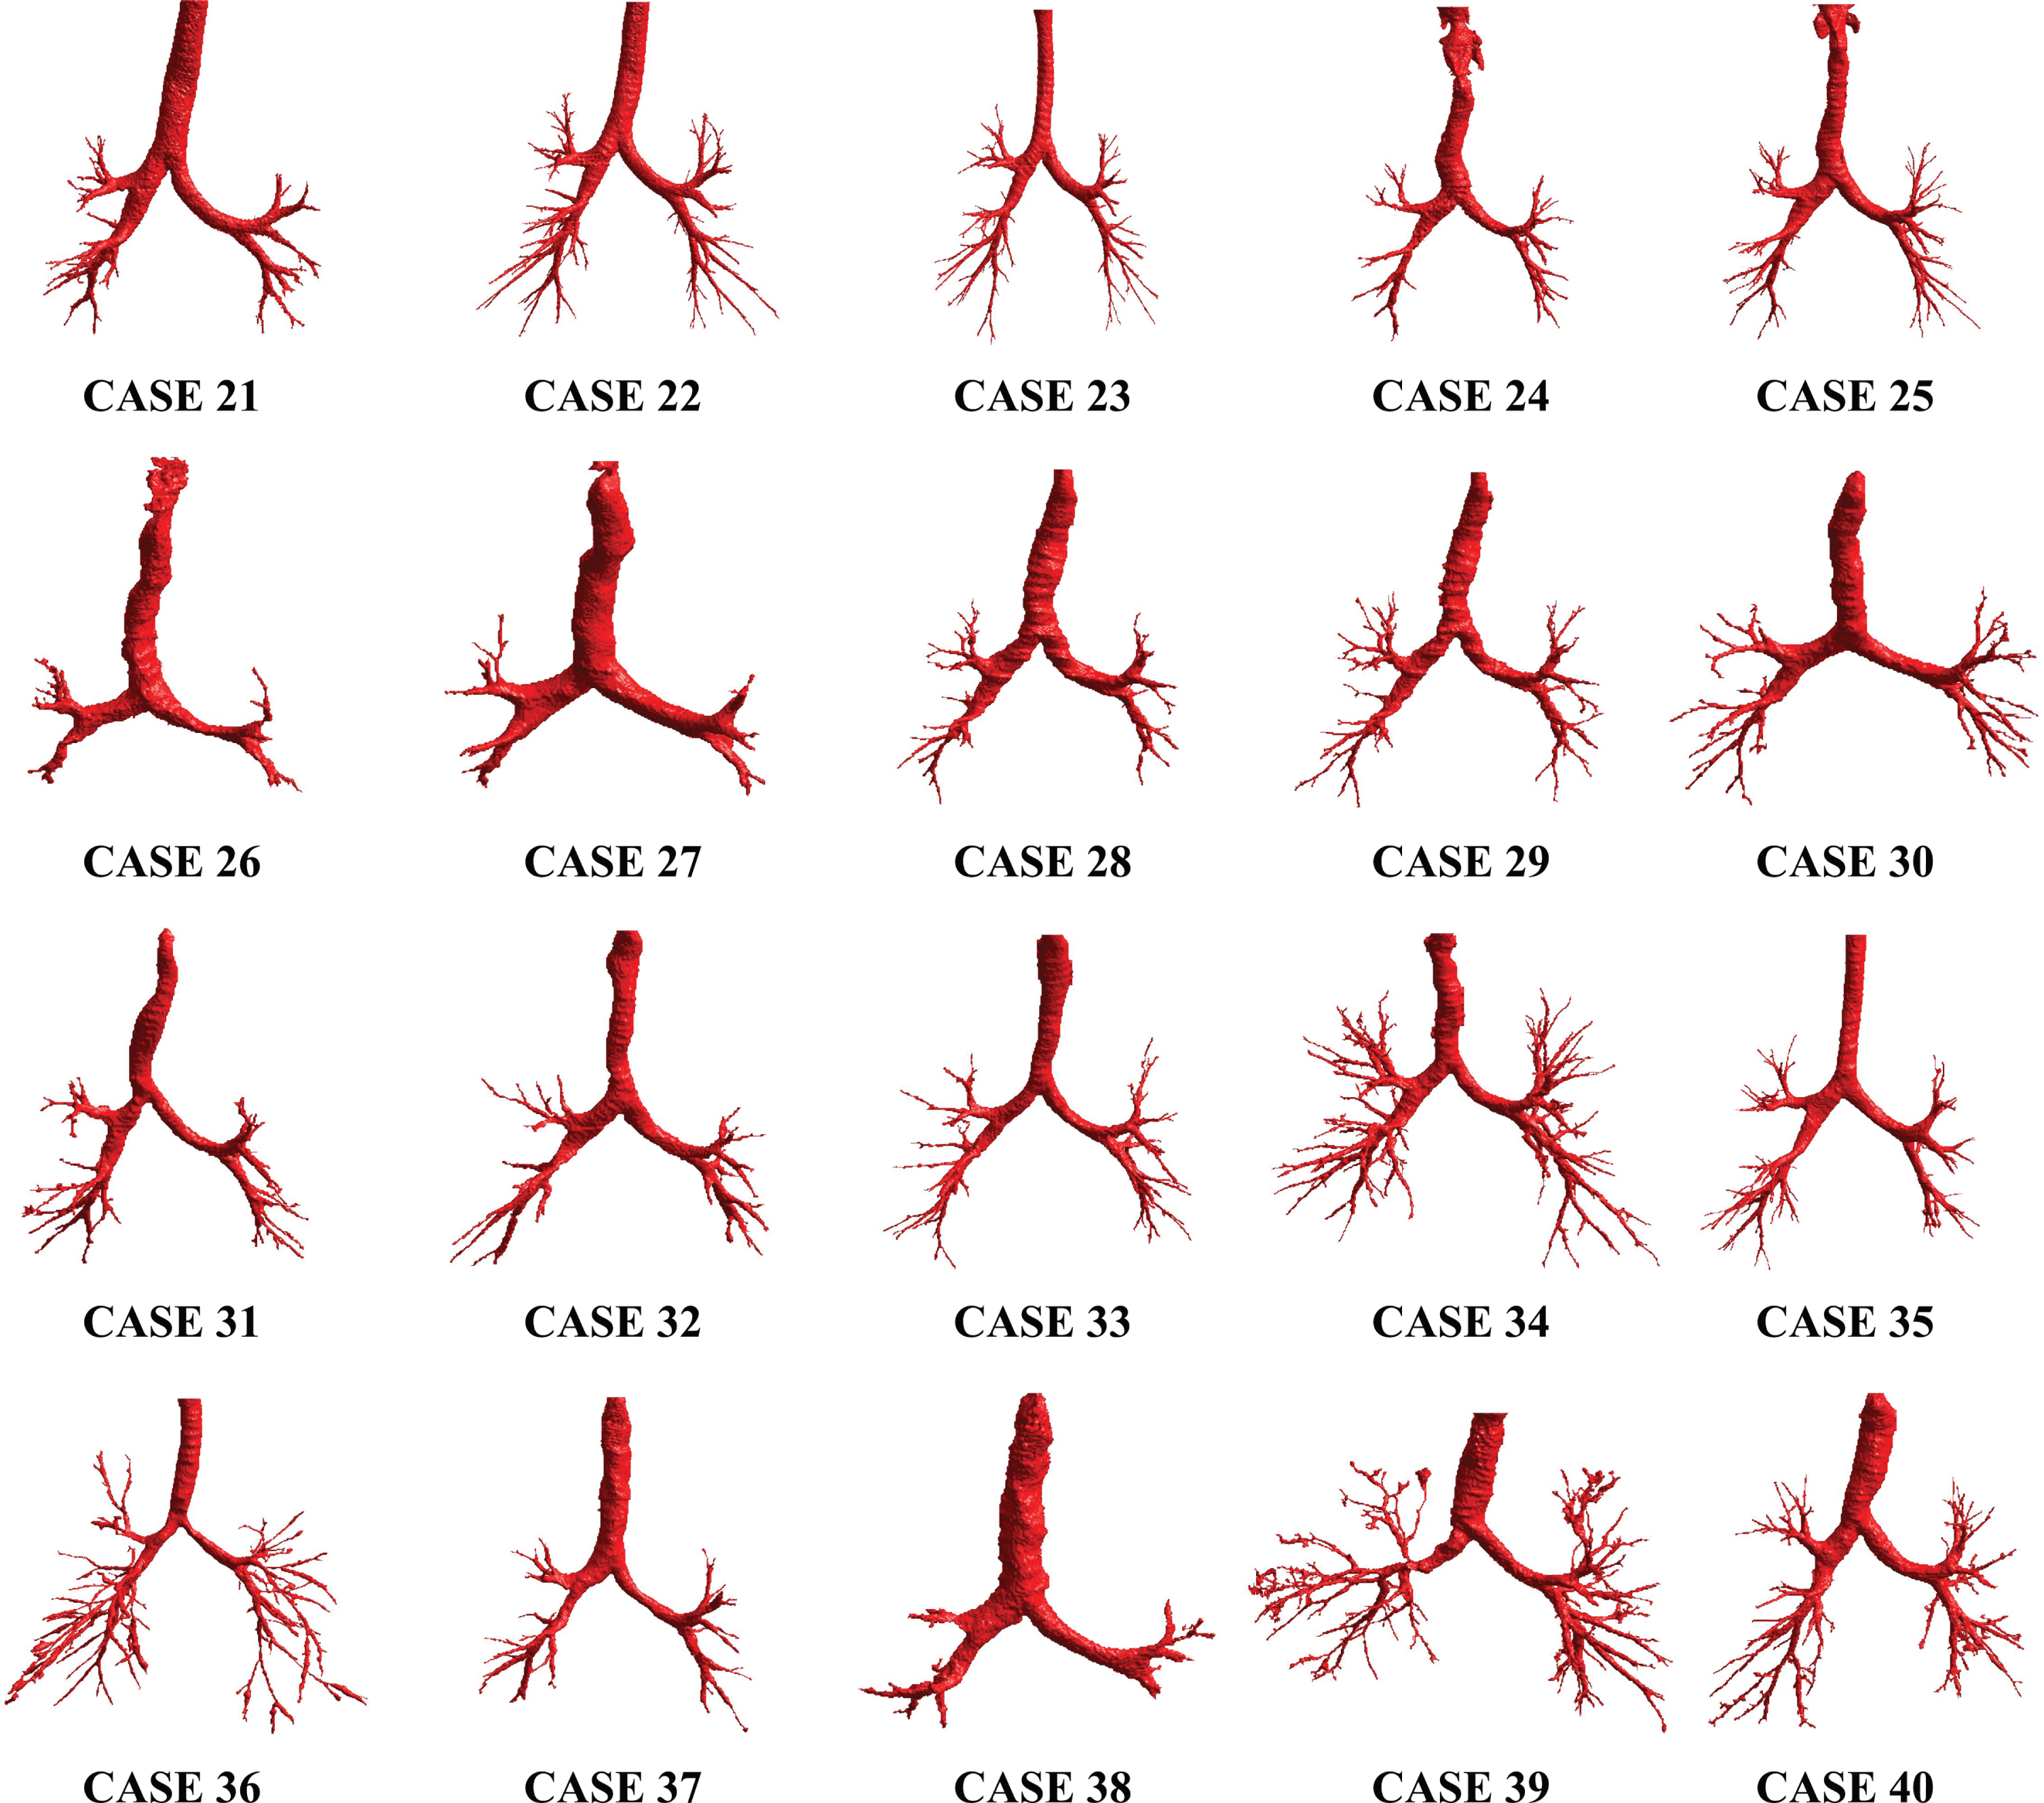
Reconstruction of 20 cases in EXACT09 test data.
For airway tree segmentation, higher detection scores are often obtained at the expense of larger false positive rate and leakages. Nevertheless, satisfying these two contradictories requires a considerable increase in computational time. It is a challenge to achieve an optimal result in all these three items simultaneously. As an attempt to address this problem, we extended our previous method [18] and validated it on multiple datasets. In the first experiment, an average of 155.9 branches was extracted from 25 cases. The results indicated that compared to our previous method [18], the leakage regions were removed with a decrease of 0.06% in the average branch count. For a more quantitative evaluation of detection scores and the amount of leakage reduction, we conducted the second experiment. The performances of the proposed method and other participants’ methods in the EXACT09 workshop are shown in Fig. 10, in which a plot of the detected tree length against the false-positive rate is presented. Ideally, the closer the point gets to the upper left corner of the graph in Fig. 10, the better overall performance of the method. In the airway segmentation, we are interested in having a high detected tree length and a low false-positive rate. However, as mentioned previously, it is difficult to optimize these two performance indices at the same time. For instance, Yun et al. [16] adopted the orthogonal patches of axial, coronal and sagittal directions to form the training data set. Compared with other methods, the 2.5D CNN resulted in a higher detected tree length but a larger false-positive rate. On the contrary, Xu’s group [14] obtained a relatively low false-positive rate, but the detected tree length was less than ideal. As shown in Fig. 10, our proposed method was marked in green. The methods of Xu’s group [14], Yun et al. [16], and Charbonnier et al. [15] were marked with the numeral 17, 19 and 20, respectively. We achieved a moderate detection score with a low false-positive rate. Therefore, by comprehensive consideration, the proposed method maintains a good balance between detected scores and FPR.

Comparison of our method with other participants’ methods of EXACT09. The name of the interactive approaches was highlighted in red. The proposed method and our previous method in [18] were highlighted in green and blue, respectiviely. The methods of Xu’s group [14], Yun et al. [16], and Charbonnier et al. [15] were marked in yellow, purple and orange, respectively.
Table 3 further lists the statistic of three methods which accuracy is close to our proposed method. One reference method was designed by DIKU group [12], who hosted the challenge. Another reference method was designed by Xu’s group [14]. In order to quantitatively evaluate the performance of our leakage elimination method, the result of our previous method [18] was also used as a reference. Moreover, the results were presented as boxplots in Fig. 11 to show the difference between the reference methods.
Quantitative analysis of airway segmentation given by EXACT09 organizer. Overall performance of four groups (std. dev. is the standard deviation)
The DIKU group [12] utilized the orientation relationship between the airway tree and vessel to formulate a voxel classification method. The results prove that k nearest neighbor (KNN) classifier combined with vessel orientation similarity can significantly reduce the false positive rate. Xu’s group [14] combined the morphological filter with multi-scale vesselness enhancement and further made use of them to guide FC computation. By comparison, we first applied grayscale morphological reconstruction on three planes to increase the detected tree length. Then a leakage elimination approach was proposed to achieve a low FPR. Furthermore, we separated the elimination process from the segmentation step. This mechanism ensures a preferable branch detection rate and a low false-positive rate. The detected tree length and FPR of our method are 50.1% and 0.75%, respectively. Relative to our previous method, the leakage is reduced. After applying the leak reduction, the false-positive rate is reduced from 2.4% to 0.75%, while the detected tree length slightly drops from 50.6% to 50.1%. The results demonstrate that our method for leakage elimination achieved good sensitivity and specificity. Our method is outperformed by the DIKU group, but the techniques we used are simple, and thus resulting computationally fast. The average calculation time is as shown in Table 4. As can be seen from the table, after adding the process of leakage detection and elimination, there is only a small increase in the average calculation time.
The average calculation time of the reference methods and the proposed method
In general, CNN-based methods, such as the works of Charbonnier et al. [15] and Yun et al. [16], typically require large data and powerful GPUs to train. By comparison, our proposed method is simpler and more robust in absence of large datasets. The computational resources we required are less than the CNN-based method, as well. However, our detected tree length remains to be improved. Charbonnier et al. [15] and Yun et al. [16]. Charbonnier et al. detected a tree length of 65.4% at an average FPR of 1.68%. The scores of Yun et al. were 60.1% and 4.56%, respectively. Although the FPR of our proposed method is better than that of these two methods, there is a 10% to 15% difference in the detected tree length.
Such a difference may result from the criteria we adopted to segment the main bronchus. We intended to ensure that all the segmentation results were leak-free, thus parts of the branches would be omitted. In Fig. 12, two graphs are presented, in which the results in Table 2 are displayed as scatter plots of branch count versus false-positive rate and detected tree length versus false-positive rate, respectively. As can be seen from the figure, along with the increase of the detected tree length, the false positive rate increases. More specifically, the more airway branches are detected, the higher the risk of leakage. Because some cases, e.g. the CASE 39 and CASE 40, achieve a high branch count, but their detected tree length rates are relatively low. Further, we illustrated a few reconstruction results obtained by using different parameter settings.
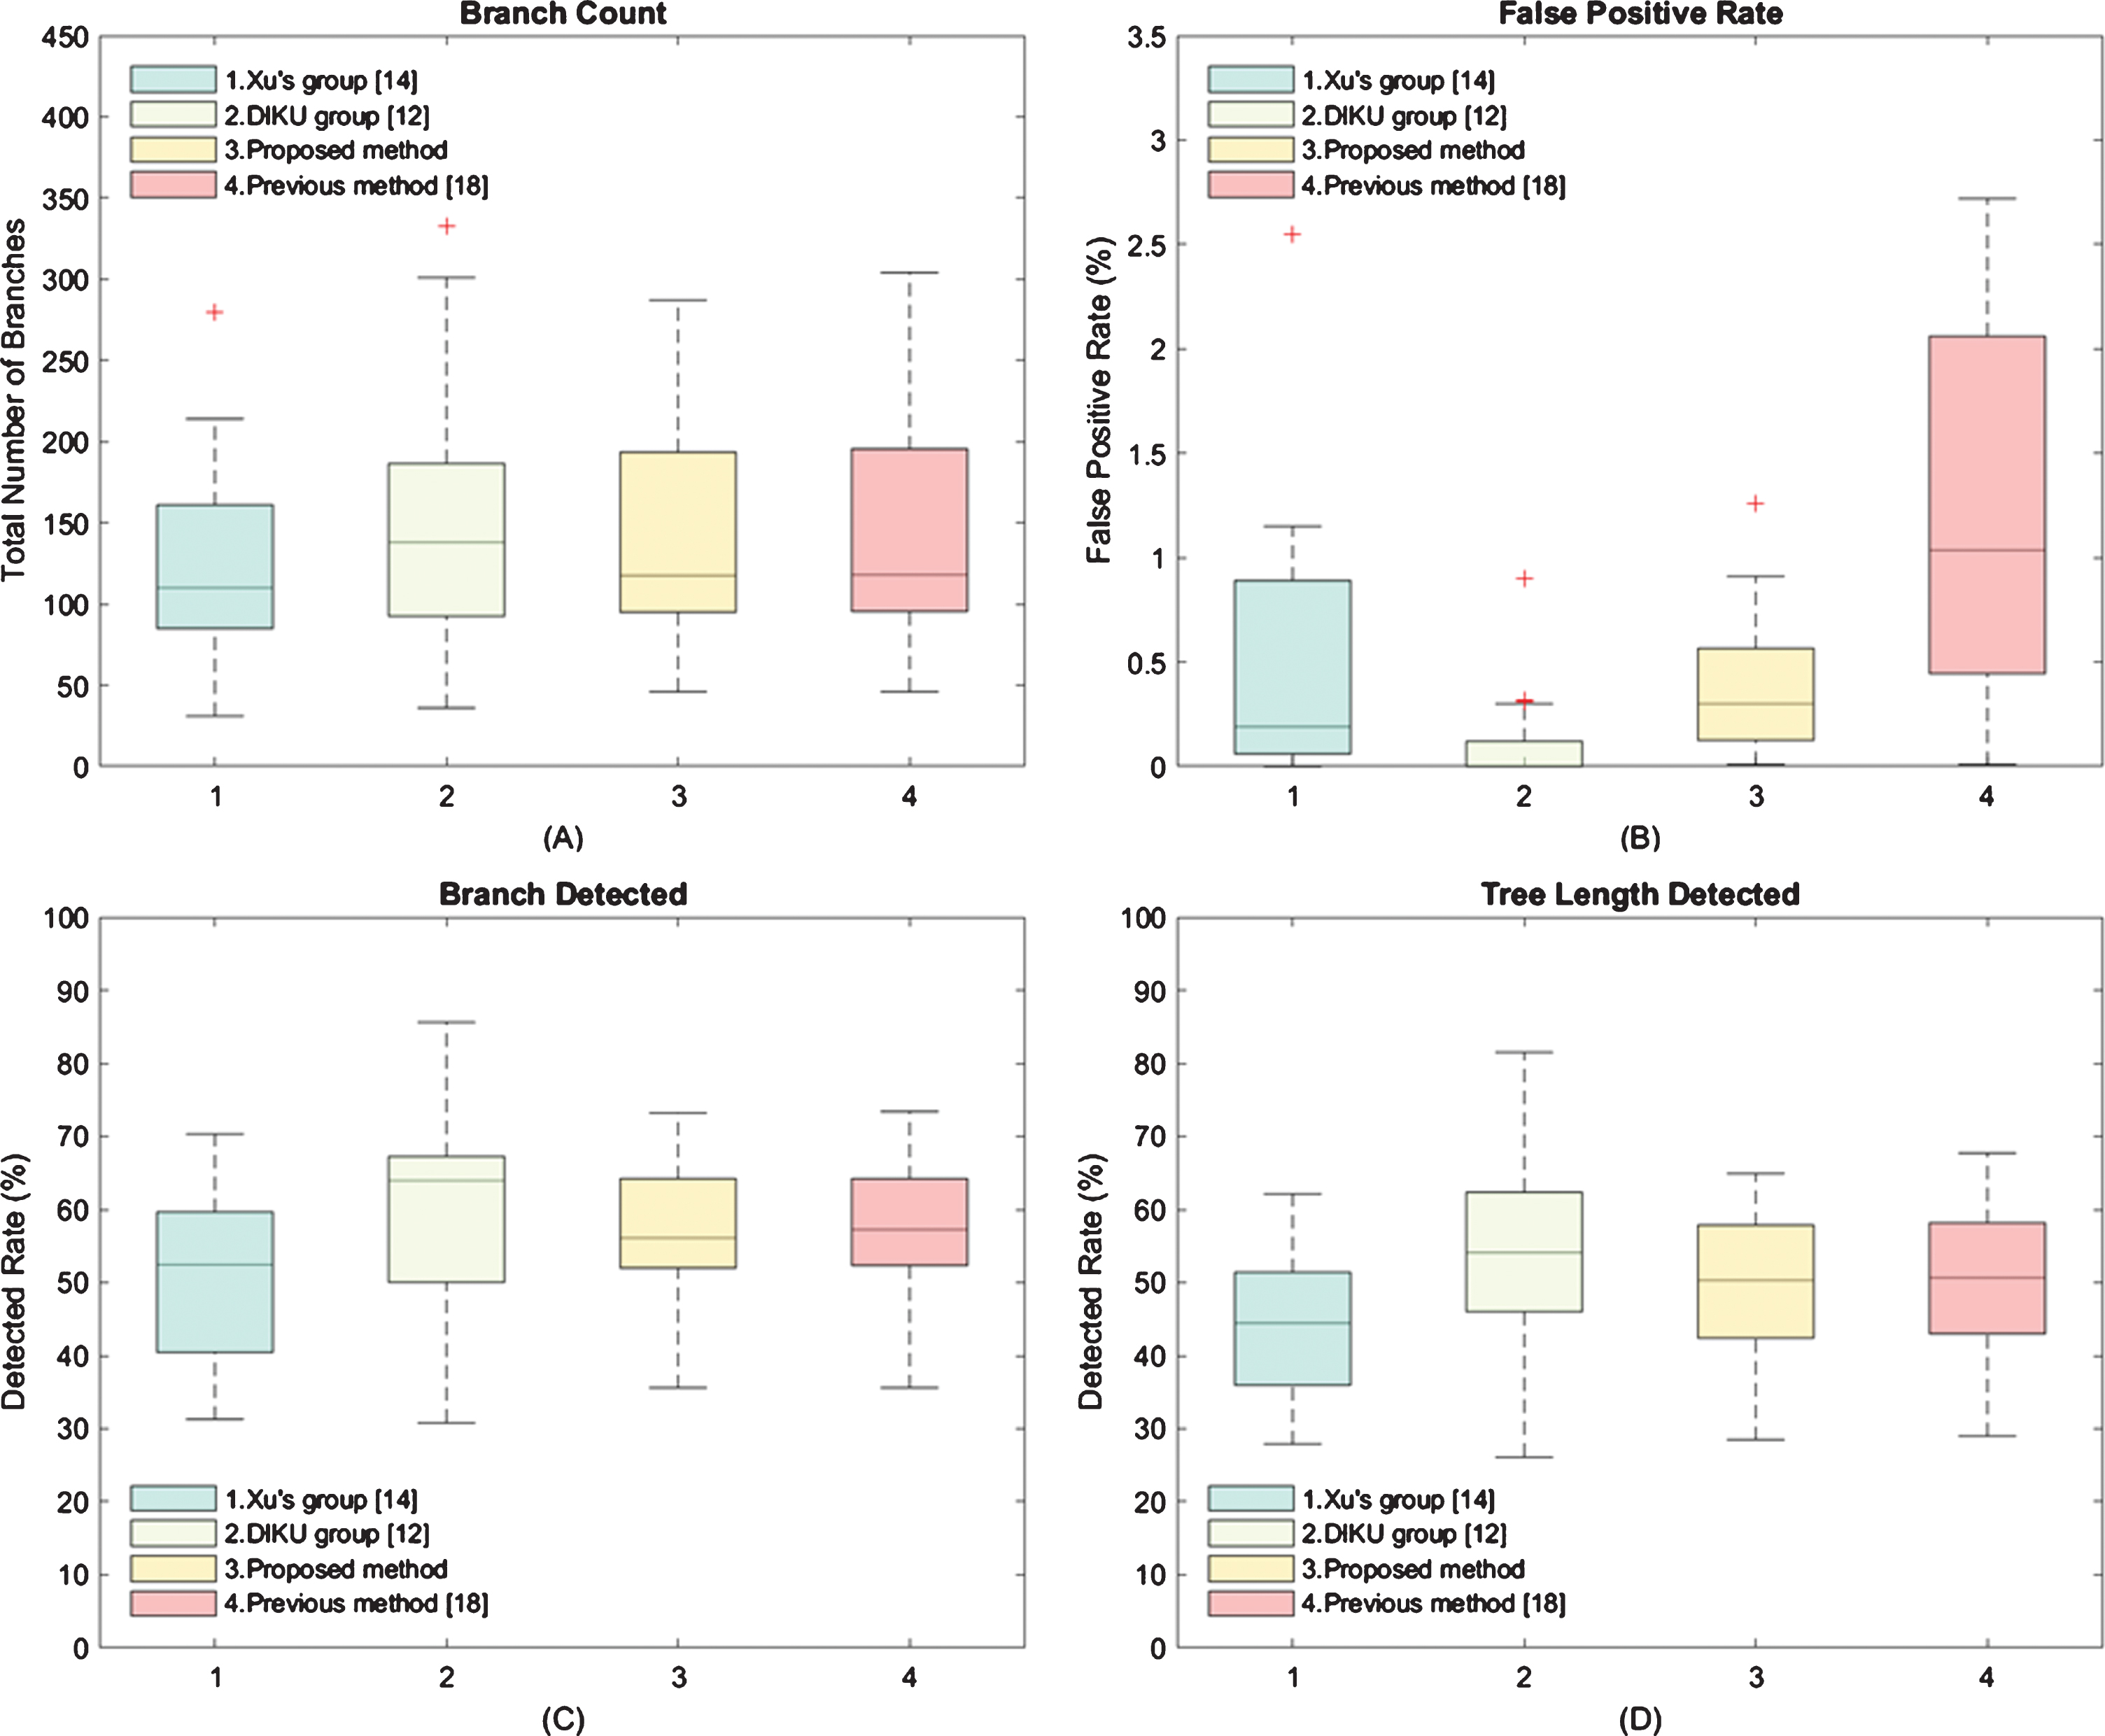
The boxplots of the (A) branch count, (B) false-positive rate, (C) branch detected and (D) tree length detected, respectively. In the plot (B), we assign a value of 0.009 if the false-positive rate is less than 0.01 (<0.01). Meanwhile, there is reported 0% FPR for some cases of Xu’s and DIKU’s group. The detail results can be found in [14] and [12], respectively.
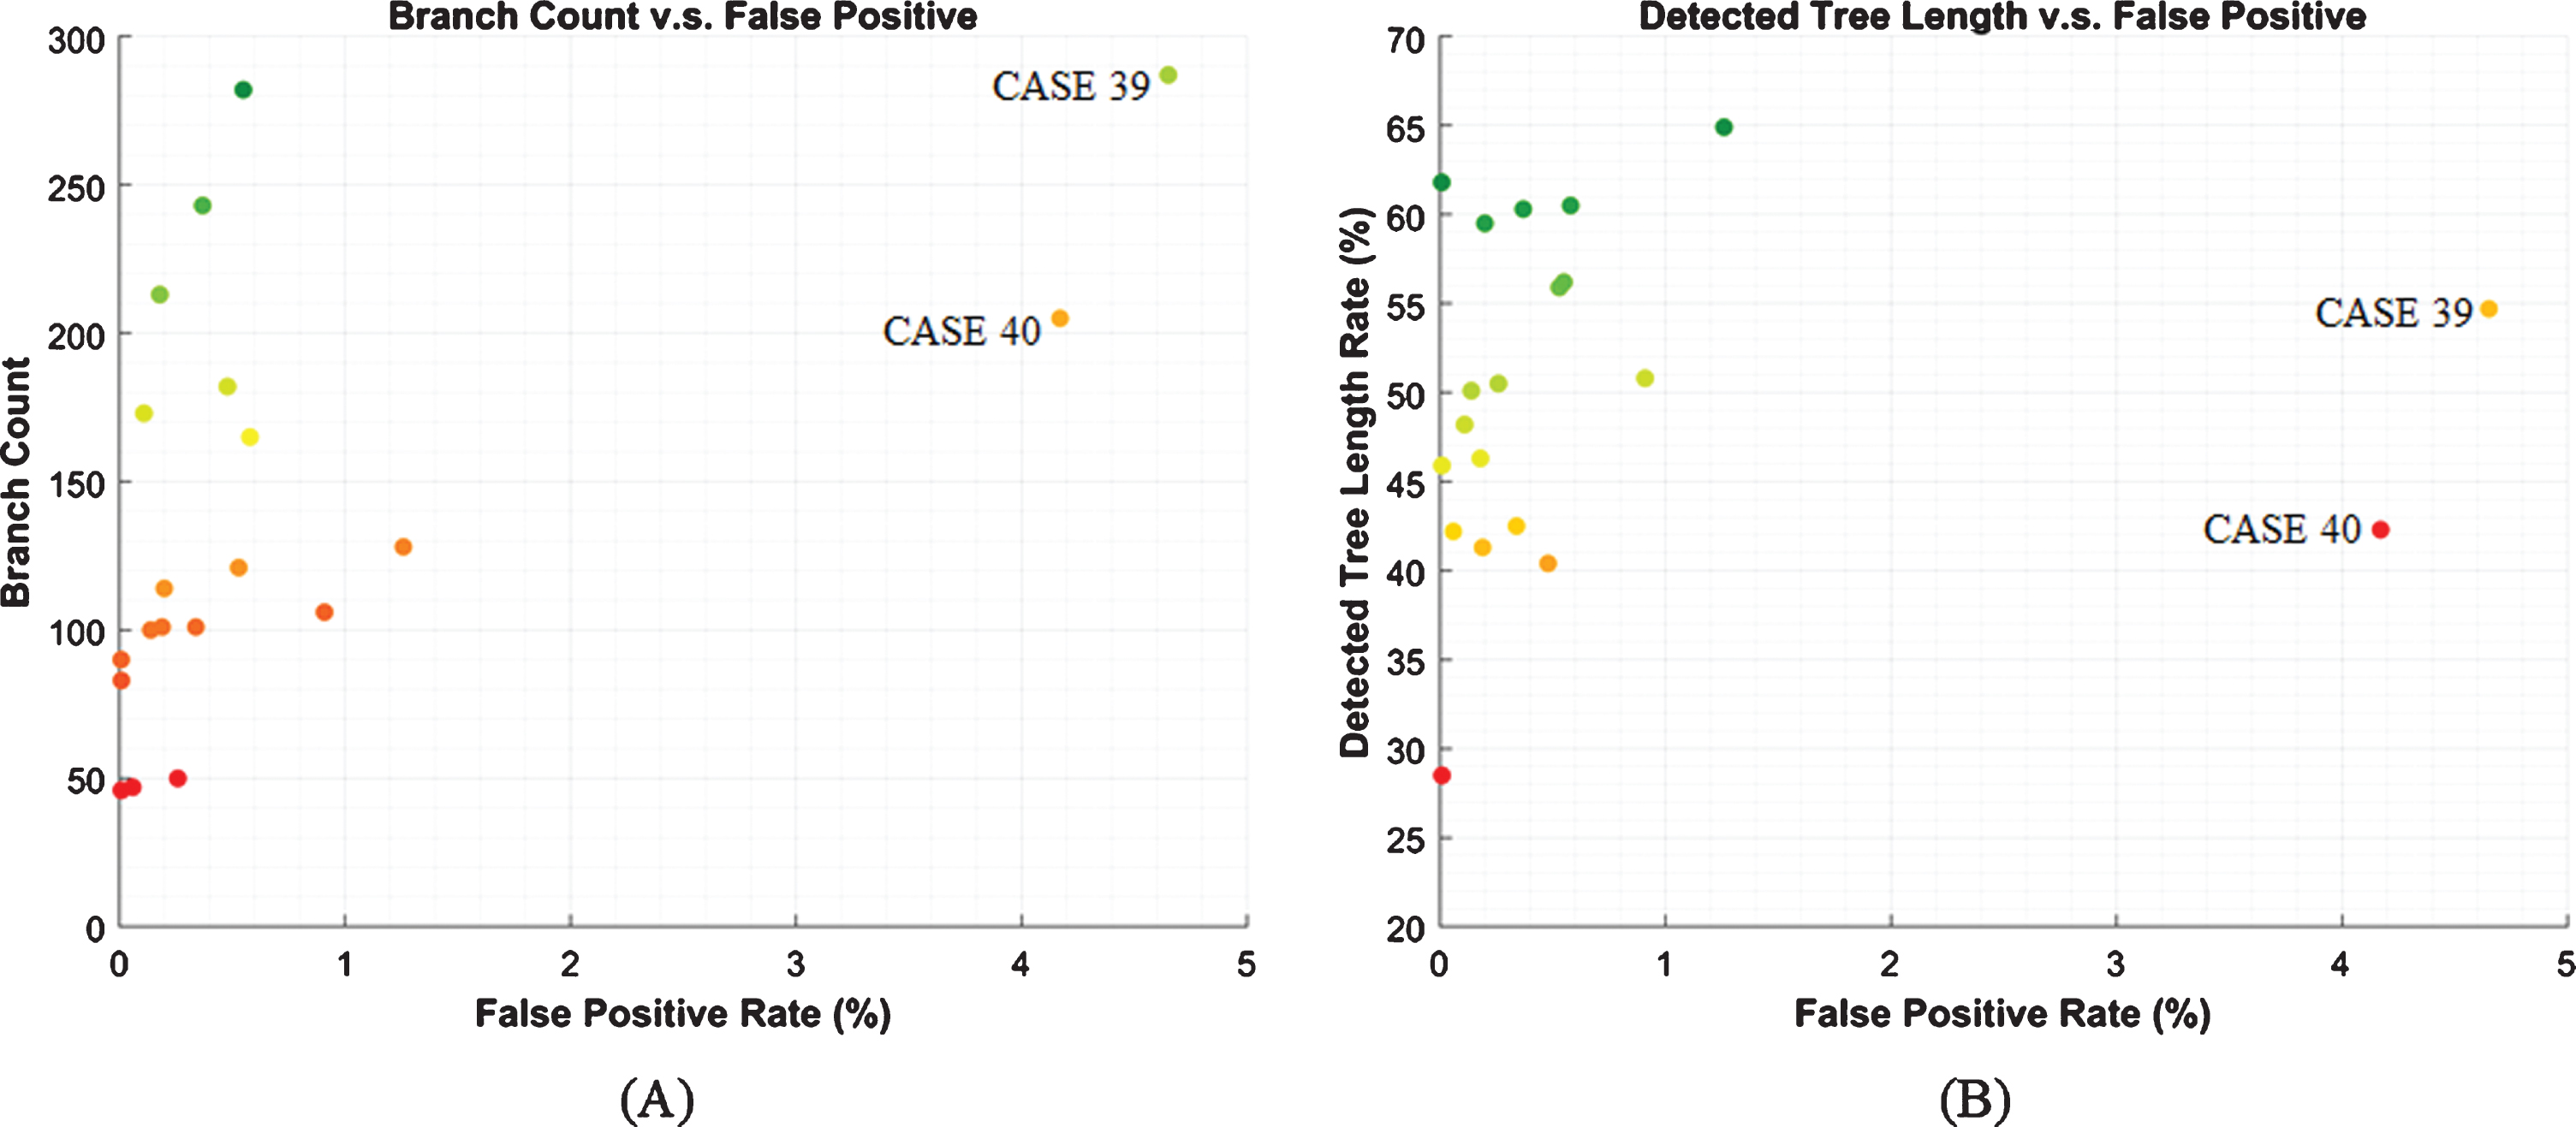
The scatter plots of Branch Count versus False Positive Rate, and Detect Tree Length versus False Positive Rate, respectively. The dark green dots that close to the upper-left corner indicate high performance. Conversely, the dots that close to the right-button corner will be marked in dark-red, and indicate poor performance. The plotted data corresponds to the results from the proposed method using the EXACT09 testing set.
As shown in Fig. 13 (a) and (e), if we used stringent parameters for segmentation, it would cause a decline in the branch count and detected tree length rate, and the false positive rate would decrease as well. The dots in the graphs of Fig. 12 might move to the lower left-hand corner. On the contrary, if the values of those parameters were slightly increased, more branches were detected, and the airway tree length increased accordingly. Meanwhile, as the circled regions marked in Fig. 13 (c) and (g), new leakages were found by our radiologists at the end of the branches. Thus, the dots in Fig. 12 might move to the top right corner. As the mx a vr g , mx h , and mx v further increased, some cases, e.g. CASE 22 shown in Fig. 13 (d), can achieve high performance with an acceptable increase in leakage. Nevertheless, during the first-pass region growing, massive leakage would occur in other cases, e.g. CASE 23 shown in Fig. 13 (h). For most airway segmentation methods, including ours, such leakage is a disaster. This kind of result is not expected because the following processes become invalid, and the overall performance will be seriously affected. Therefore, one should use the relatively stringent parameters to avoid massive leakage.
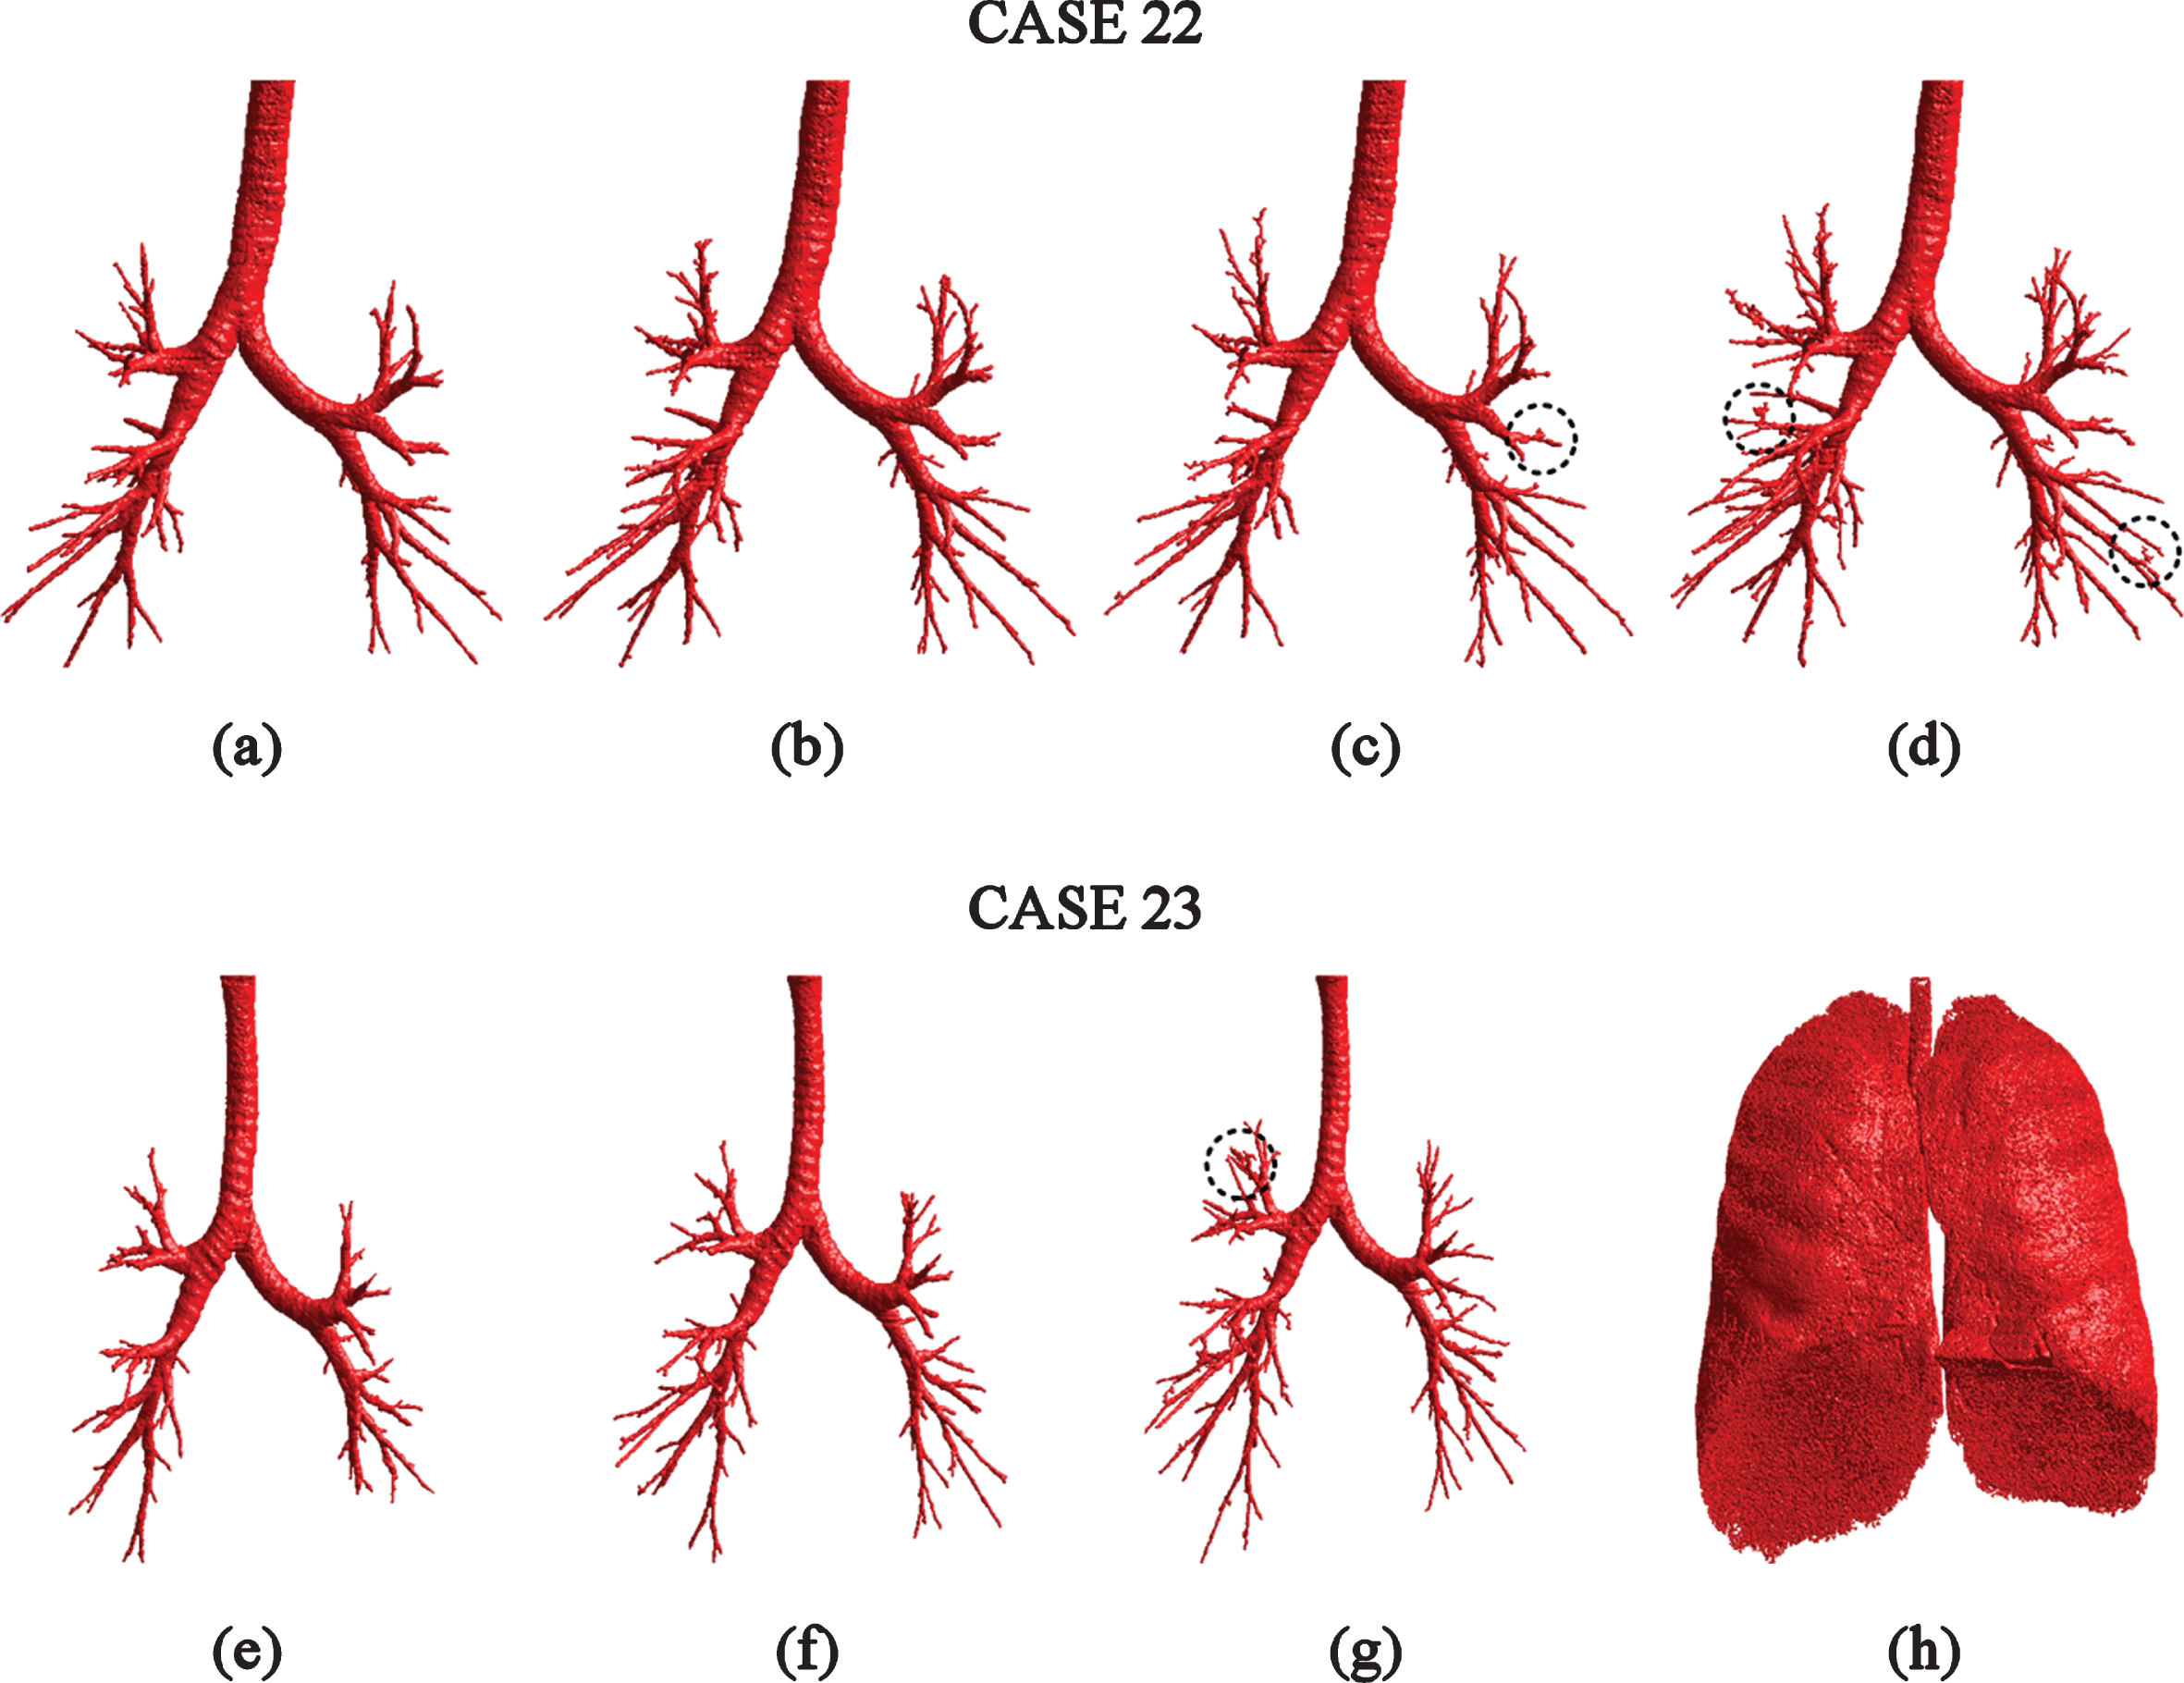
The reconstruction results with respect to different mx a vr g , mx h , and mx v . (a) and (e): the mx a vr g , mx h , and mx v were set as -900 HU,0.09 and 0.17, respectively. (b) and (f): mx a vr g , mx h , and mx v took the same values as in Experiments set-up section (mx a vr g = -848.5HU, mx h = 0.11, and mx v = 0.2). (c) and (g): the mx a vr g , mx h , and mx v were set as –848.5 HU, 0.13 and 0.23, respectively. (d) and (h): the mx a vr g , mx h , and mx v were set as –800 HU, 0.15 and 0.26, respectively.
Meanwhile, we found that some specific leakage cannot be detected by our method. Figure 14 presents three reconstruction results from the EXACT09 organizer, in which the red parts show the leakages. In these cases, most of the leakages look like terminal branches and have a rod-like shape. To verify whether or not the red parts are rod-like leakages, we invited radiologists from Shanghai Pulmonary Hospital to evaluate the segmentation results. After careful comparison and analysis, the radiologists come to basically the same conclusion as the EXACT09 reference. These ‘terminal branches’ are considered as leakages. Although in the reconstruction results, parts of the ‘terminal branches’ seem like airway, they could not find obvious characteristics in the CT scans to support its validity and reliability. Therefore, the proposed leakage elimination method is not sensitive to non-sphericity leakages, which is also the cause of the leakages as shown in Fig. 13 (c), (d), and (g). Because the leakage detector is designed to identify the quasi-circular structure or mesh structure in the skeleton. If the leakage region has a rod-like structure, its skeleton would be line-like. The detector will regard the leakage as airway, then result in a relatively high false-positive rate compared to DIKU group. This drawback might be overcome by performing the CNN-based method on the distal airway. Similarly, the false-positive rate of CNN-based methods can be further reduced by eliminating the leakage along the peripheral skeleton and the skeleton marked by our proposed method.
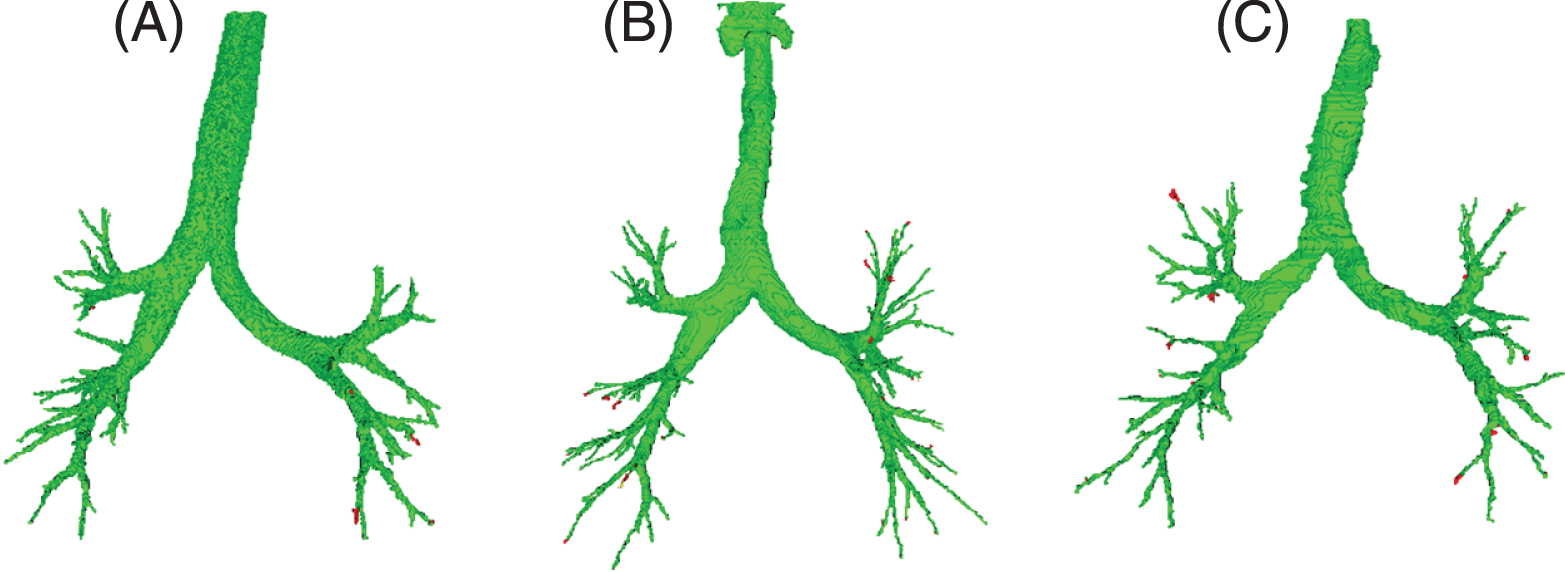
The leakage cases in the results of EXACT09. ((A), (B) and (C) are CASE 21, CASE 25 and CASE 29 respectively).
In this work, a novel method for airway tree segmentation is introduced. The experiments were conducted using a total of 45 CT scans. Different criteria were adopted to evaluate the proposed method. The proposed method combines region growing with multi-plane gray-scale morphological reconstruction. The rough airway tree is refined by implementing the proposed leakage detector. The leakage elimination method can also be used as a standalone tool and combined with other segmentation methods.
However, the detected tree length should be further improved. The method used to detect and eliminate the rod-like leakage should be further researched. The airway pathology and its clinical significance should also be considered when evaluating the performance of the segmentation method.
Footnotes
Acknowledgments
This work is supported by the National Natural Science Foundation of China under Grant No. 60972122; the Shanghai Natural Science Foundation under Grant No. 14ZR1427900; the National Natural Science Foundation of China under Grant No. 81830052.