
Abstract
BACKGROUND:
Although computed tomography (CT) is a powerful diagnostic imaging modality for diagnosing vascular diseases, it is some what risky to human health due to the high radiation dosage. Thus, CT vendors have developed low dose computed tomography (LDCT) aiming to solve this problem. Nowadays, LDCT has gradually become a main stream of CT examination.
OBJECTIVE:
This study aimed to assess the feasibility of LDCTAin an animal model and compare the imaging features and doses in two clinical scanners.
METHODS:
Twenty-two New Zealand rabbit head and neck CTA images pre- and post-contrast agent injection were performed using256-sliceand 64-slice CT scanners. The tube voltages used in the 256-slice and the 64-slice CTA were 70 kVp and 80 kVp, respectively. Quantitative images indices and radiation doses obtained from CTA in these two scanners were compared.
RESULTS:
More neck arterial vessels could be visualized in multi-planar reconstruction (MPR) CTA on the 256-slice CT scanner than on the 64-slice CT scanner. After contrast agent injection, all observed neck arterial vessels had higher CT numbers in 256-slice CTA than in 64-slice CTA. There was no significant difference in contrast-to-noise (CNR) of CTA images between these two scanners. CT dose index (CTDI) and dose length product (DLP) for the 256-slice CTA were lower than those for the 64-slice CTA.
CONCLUSIONS:
Low dose CTA of rabbits with 70 or 80 kVp is feasible in a 256-slice or a 64-slice CT scanner. The radiation dose from the 256-slice CTA was much lower than that from the 64-slice CTA with comparable SNR and CNR. The technique can be further applied in longitudinal monitoring of an animal stroke model in the future.
Keywords
Introduction
Computed tomographic angiography (CTA) is a noble and rapid imaging modality, which can generate the detailed images of blood vessels in the human body in a very short time [1, 2]. CTA can be used to examine cerebral vascular malformation, congenital hemangioma, coronary artery stenosis, chronic total occlusions, common carotid artery plaque, pulmonary embolism, and acute limb ischemia, etc. CTA has the capability to detect large arteries and veins in most important organs, find the diseases and facilitate a treatment plan [4–10].
The blood vessels show low-density on the CT images prior to iodine-containing contrast agent (CA) injection. The iodine-containing contrast agent can reduce the X-ray penetrating of the blood, so that the blood vessel appears brighter on the CT images. Contrast-enhanced CTA can improve the diagnostic performance, e.g. more sensitive vessel occlusion sign in invasive pulmonary aspergillosis (IPA) patients, increased accuracy of cardiovascular risk assessment, better distinction among carotid artery lumen, carotid stent, and neck, and so on [11–13].
The contrast agents used in CTA is injected intravenously via the forearm. Compared to traditional transarterial catheter angiography, CTA is non-invasive and less risky. CTA can show the anatomical details of the blood vessels. It requires less examination time than magnetic resonance angiography (MRA) and has higher spatial resolution than Doppler sonography [14, 15].
Although CTA is an excellent and noninvasive imaging modality for many clinical applications, one disadvantage is that CTA has ionizing radiation. Radiation-induced cancer risk is still an important issue [15, 16]. Recently, low dose CT (LDCT) with low tube voltages has become the mainstream of CT imaging modality and LDCTA has become an effective screening method for clinical diagnosis because it requires shorter examination time and less radiation dosage [17, 18].
Animal studies have been carried out for CTA research studies [19, 20]. The purpose of this study was to assess the feasibility of LDCTA in an animal model and compare the imaging features and radiation dose of LDCTA in normal New Zealand rabbit neck vessels with contrast agent injection using two clinical CT scanners.
Materials and methods
Experimental design
The animal use protocol was reviewed and approved by the Institutional Animal Care and Use Committee(vghks-2016-A014), Kaohsiung Veterans General Hospital, Taiwan, ROC. Two clinical CT scanners were used, a 256-slice GE Revolution CT Scanner (GE Healthcare, Chicago, IL, USA) and a Philips Brilliance 64-slice CT scanner (Philips Medical Systems, Eindhoven, Netherlands). Twenty-two 24-week-old healthy New Zealand male rabbits, weighing 3.5 to 4 kg were divided into 256-slice CTA (n = 11) and 64-slice CTA (n = 11) groups. Zoletil 50 (Virbac, Carro, France) and Rompun (Bayer Korea Ltd, Ansan-si Gyeonggi-do, Korea) mixed solution was used for anesthesia via intramuscular injection.
After anesthesia, a rabbit was positioned carefully on an examination table of a CT scanner. Afterwards, “Scout View” was first performed to determine the region to be scanned. CT scan was performed twice, i.e. before and after contrast agent (CA) injection, for every rabbit. The CA used was Xenetix 350 (Guerbet, Aulnay-sour-Bois, France) which is a water-soluble nonionic contrast agent. The imaging parameters on the 256-slice CT were as follows: tube voltages = 70 kVp, tube current = 375 mA, exposure time = 1000 ms, slice thickness = 0.625 mm, field of view = 113×113 mm, matrix = 512×512. The imaging parameters on the 64-slice CT were as follows: tube voltages = 80 kVp, tube current = 161 mA, exposure time = 623 ms, slice thickness = 0.90 mm, field of view = 111×111 mm, matrix = 512×512.
The volume CT dose index (CTDIvol) and dose-length product (DLP) for each CTA were obtained directly from the scan protocol to evaluate if there was significant difference in radiation dosage of CTA between 256-slice and 64-slice CTA scanners. The units of CTDIvol and DLP were mGy and mGy · cm respectively.
Image analysis
All the acquired CTA cross-sectional images were transferred to the Advantage Window workstation (GE Healthcare, Chicago, Illinois, USA) and Extended Brilliance Workspace (Philips Medical Systems, Eindhoven, Netherlands) for maximum intensity projection (MIP) and 3D multi-planar reconstruction (MPR) to obtain CT angiogram. Afterwards, the acquired data sets were transferred to the PC-based workstation HP-Z600 (HP Inc., Taipei, Taiwan, R.O.C.) for quantitation analysis, including the CT number (CTN), signal-to-noise ratio (SNR) and contrast-to-noise ratio (CNR) for both pre-CA and post-CA CTA images using ImageJ software (National Institutes of Health, Bethesda, Maryland, USA.) for region-of-interest (ROI) measurements.
The SNR was defined as the following equation,
The CNR was defined as the following equation,
SPSS 16.0 software (SPSS Inc., Chicago, Illions, U.S.A.) was used for statistical analysis. A nonparametric Mann-Whitney test was applied to evaluate the differences in CTN, SNR and CTN between 256-slice and 64-slice CTA. There was significant difference if p < 0.05.
Results
Figure 1 shows CTA MPR images with various orientations after CA injection. It also illustrates that more vascular vessels appear on the 256-slice CTA images than on the 64-slice CTA images. The CTA, SNR, and CNR values of cross-sections 1 and 2 are demonstrated in Figs. 3–5 and 6–8 respectively. Figure 2 illustratesthe ROIs on CTA images for quantitative analysis. Lines1 and 2 on the MPR image (left column) show the positions of two cross-sections of interest. Two lines shown in Fig. 2 demonstrate two axial slices chosen for ROI measurements. One of the author placed these two lines for measurement. The first line was determined in the middle of LVA and the second line was determined in the middle of LCCA on the MIP image. Circles show ROIs on the CTA images before CA injection (middle column) and after CA injection (right column), including left common carotid artery (LCCA), left vertebral artery (LVA), right vertebral artery (RVA), right common carotid artery (RCCA), left external carotid artery (LECA), left internal carotid artery (LICA), right external carotid artery (RECA), right internal carotid arteries (RICA) and muscle.
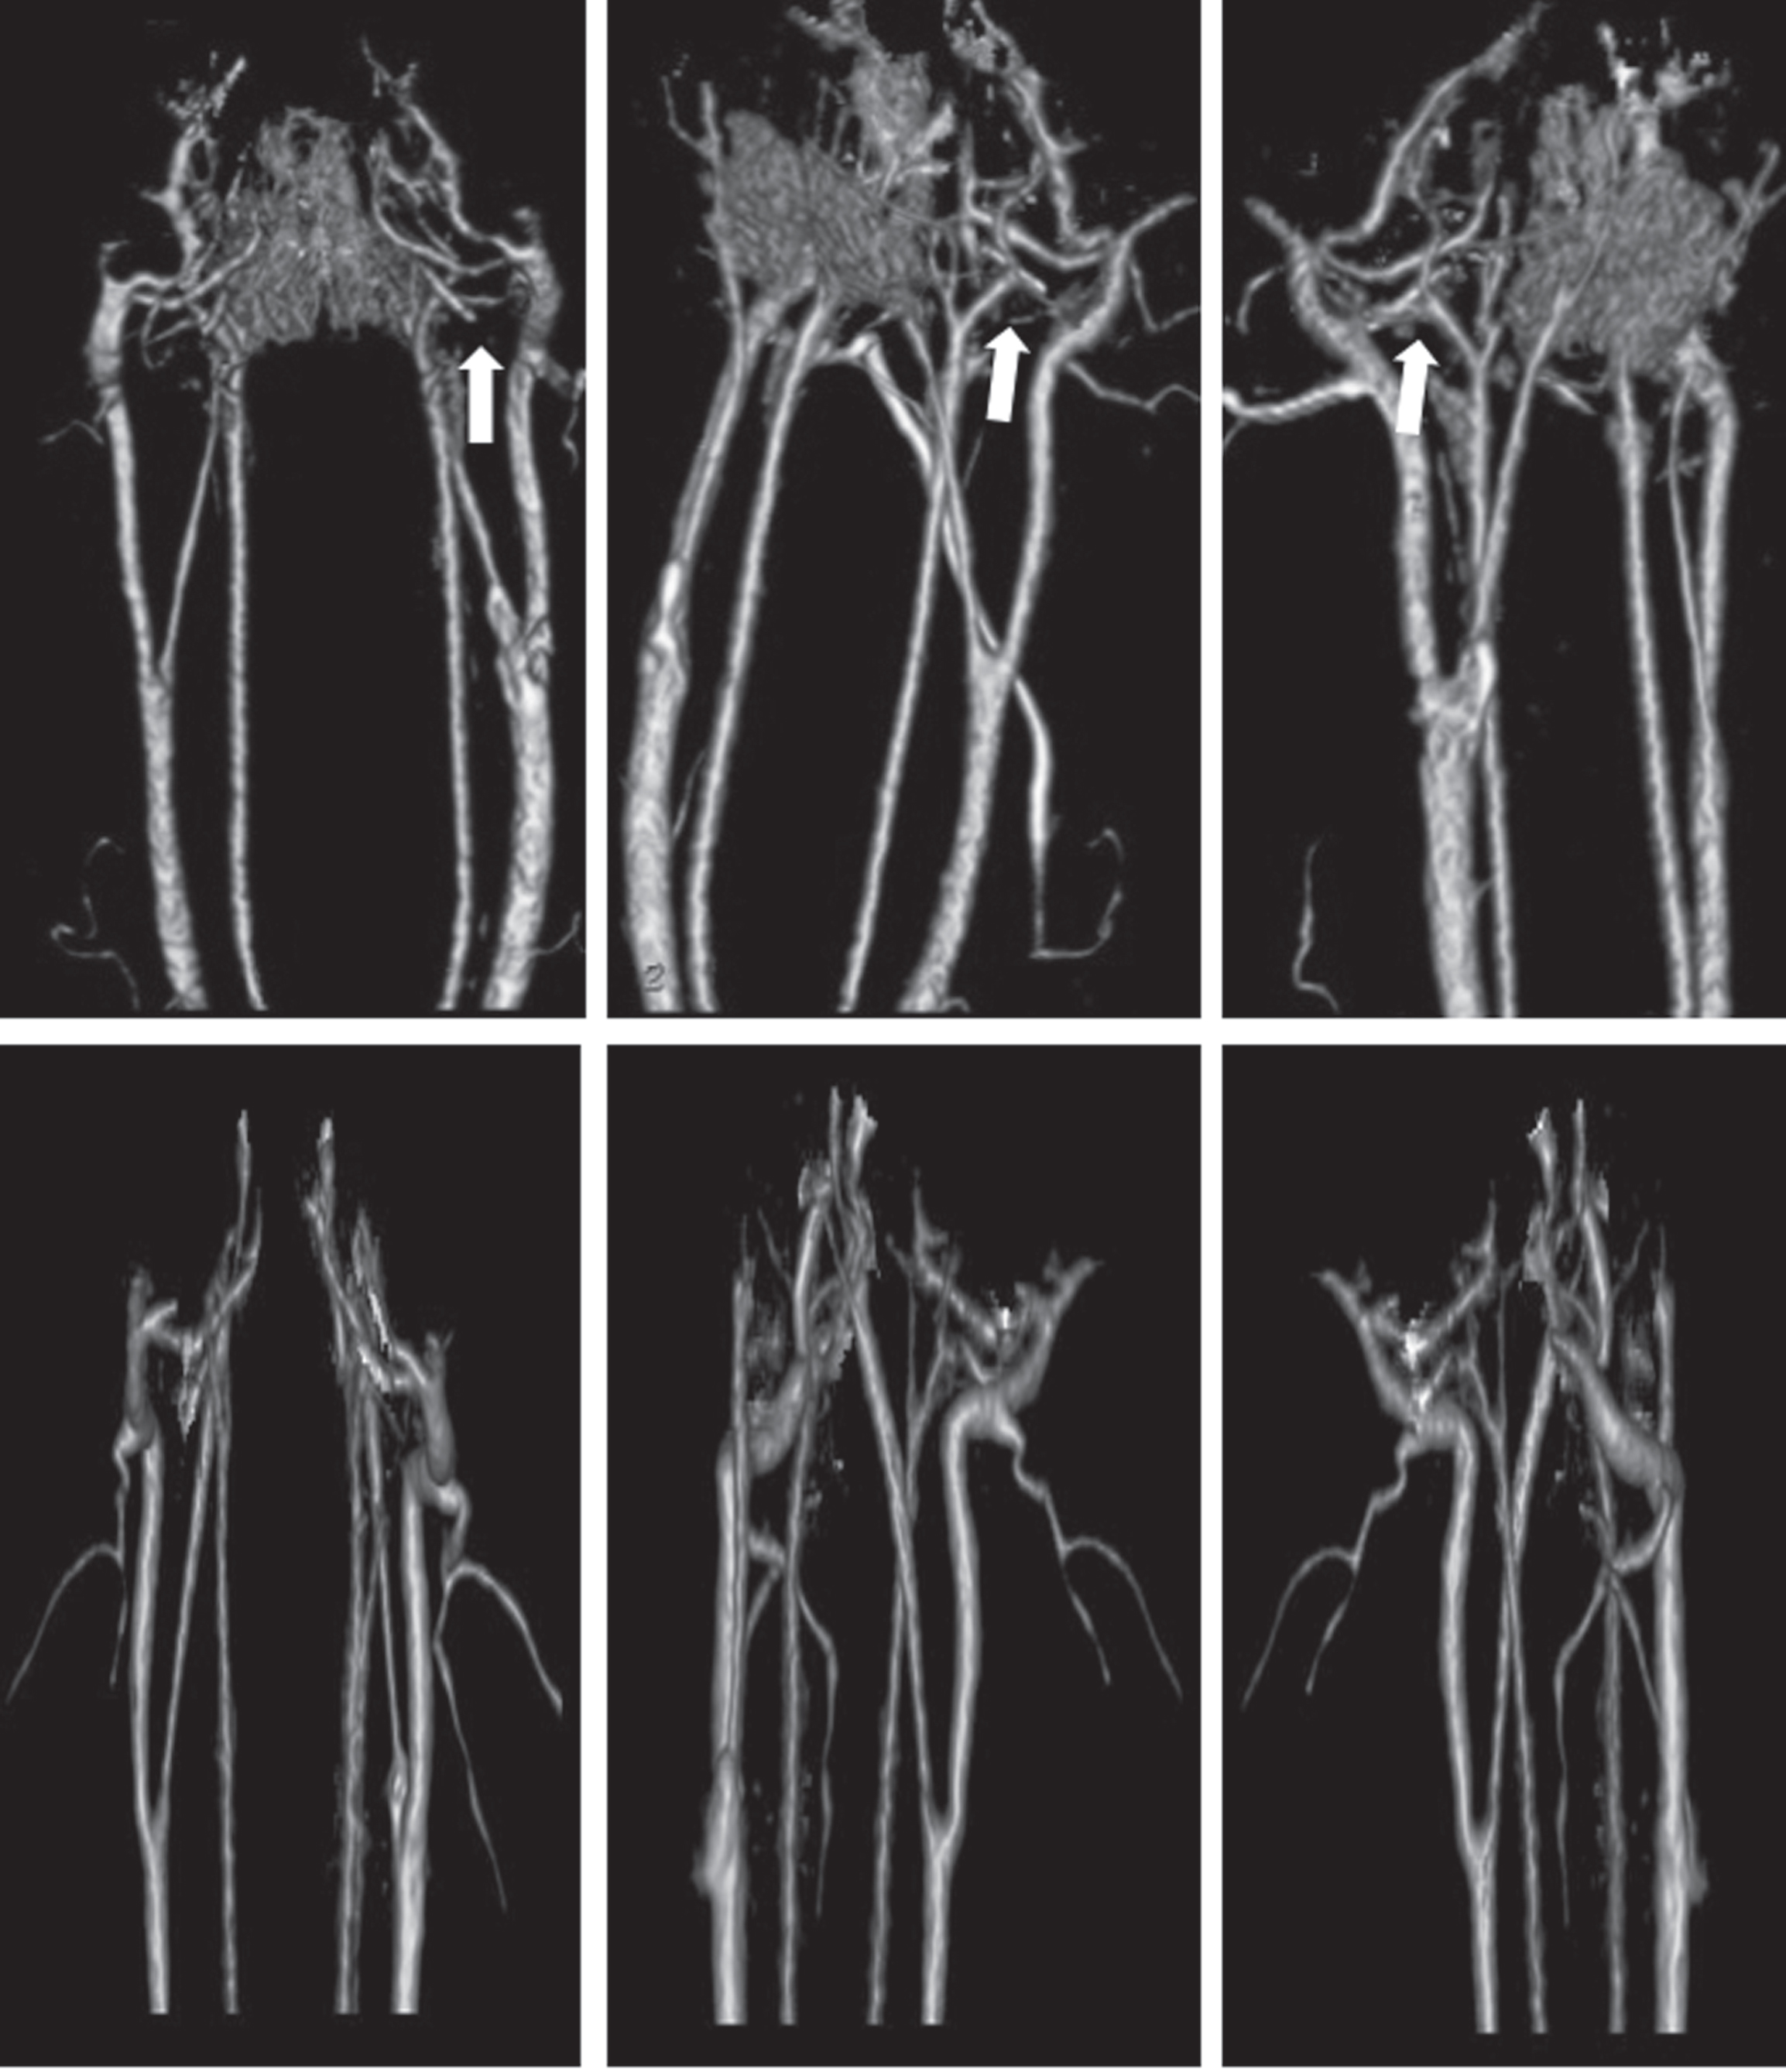
CTA MPR images with various orientation after contrast agent injection. Above: 256-slice CTA, below: 64-slice CTA.
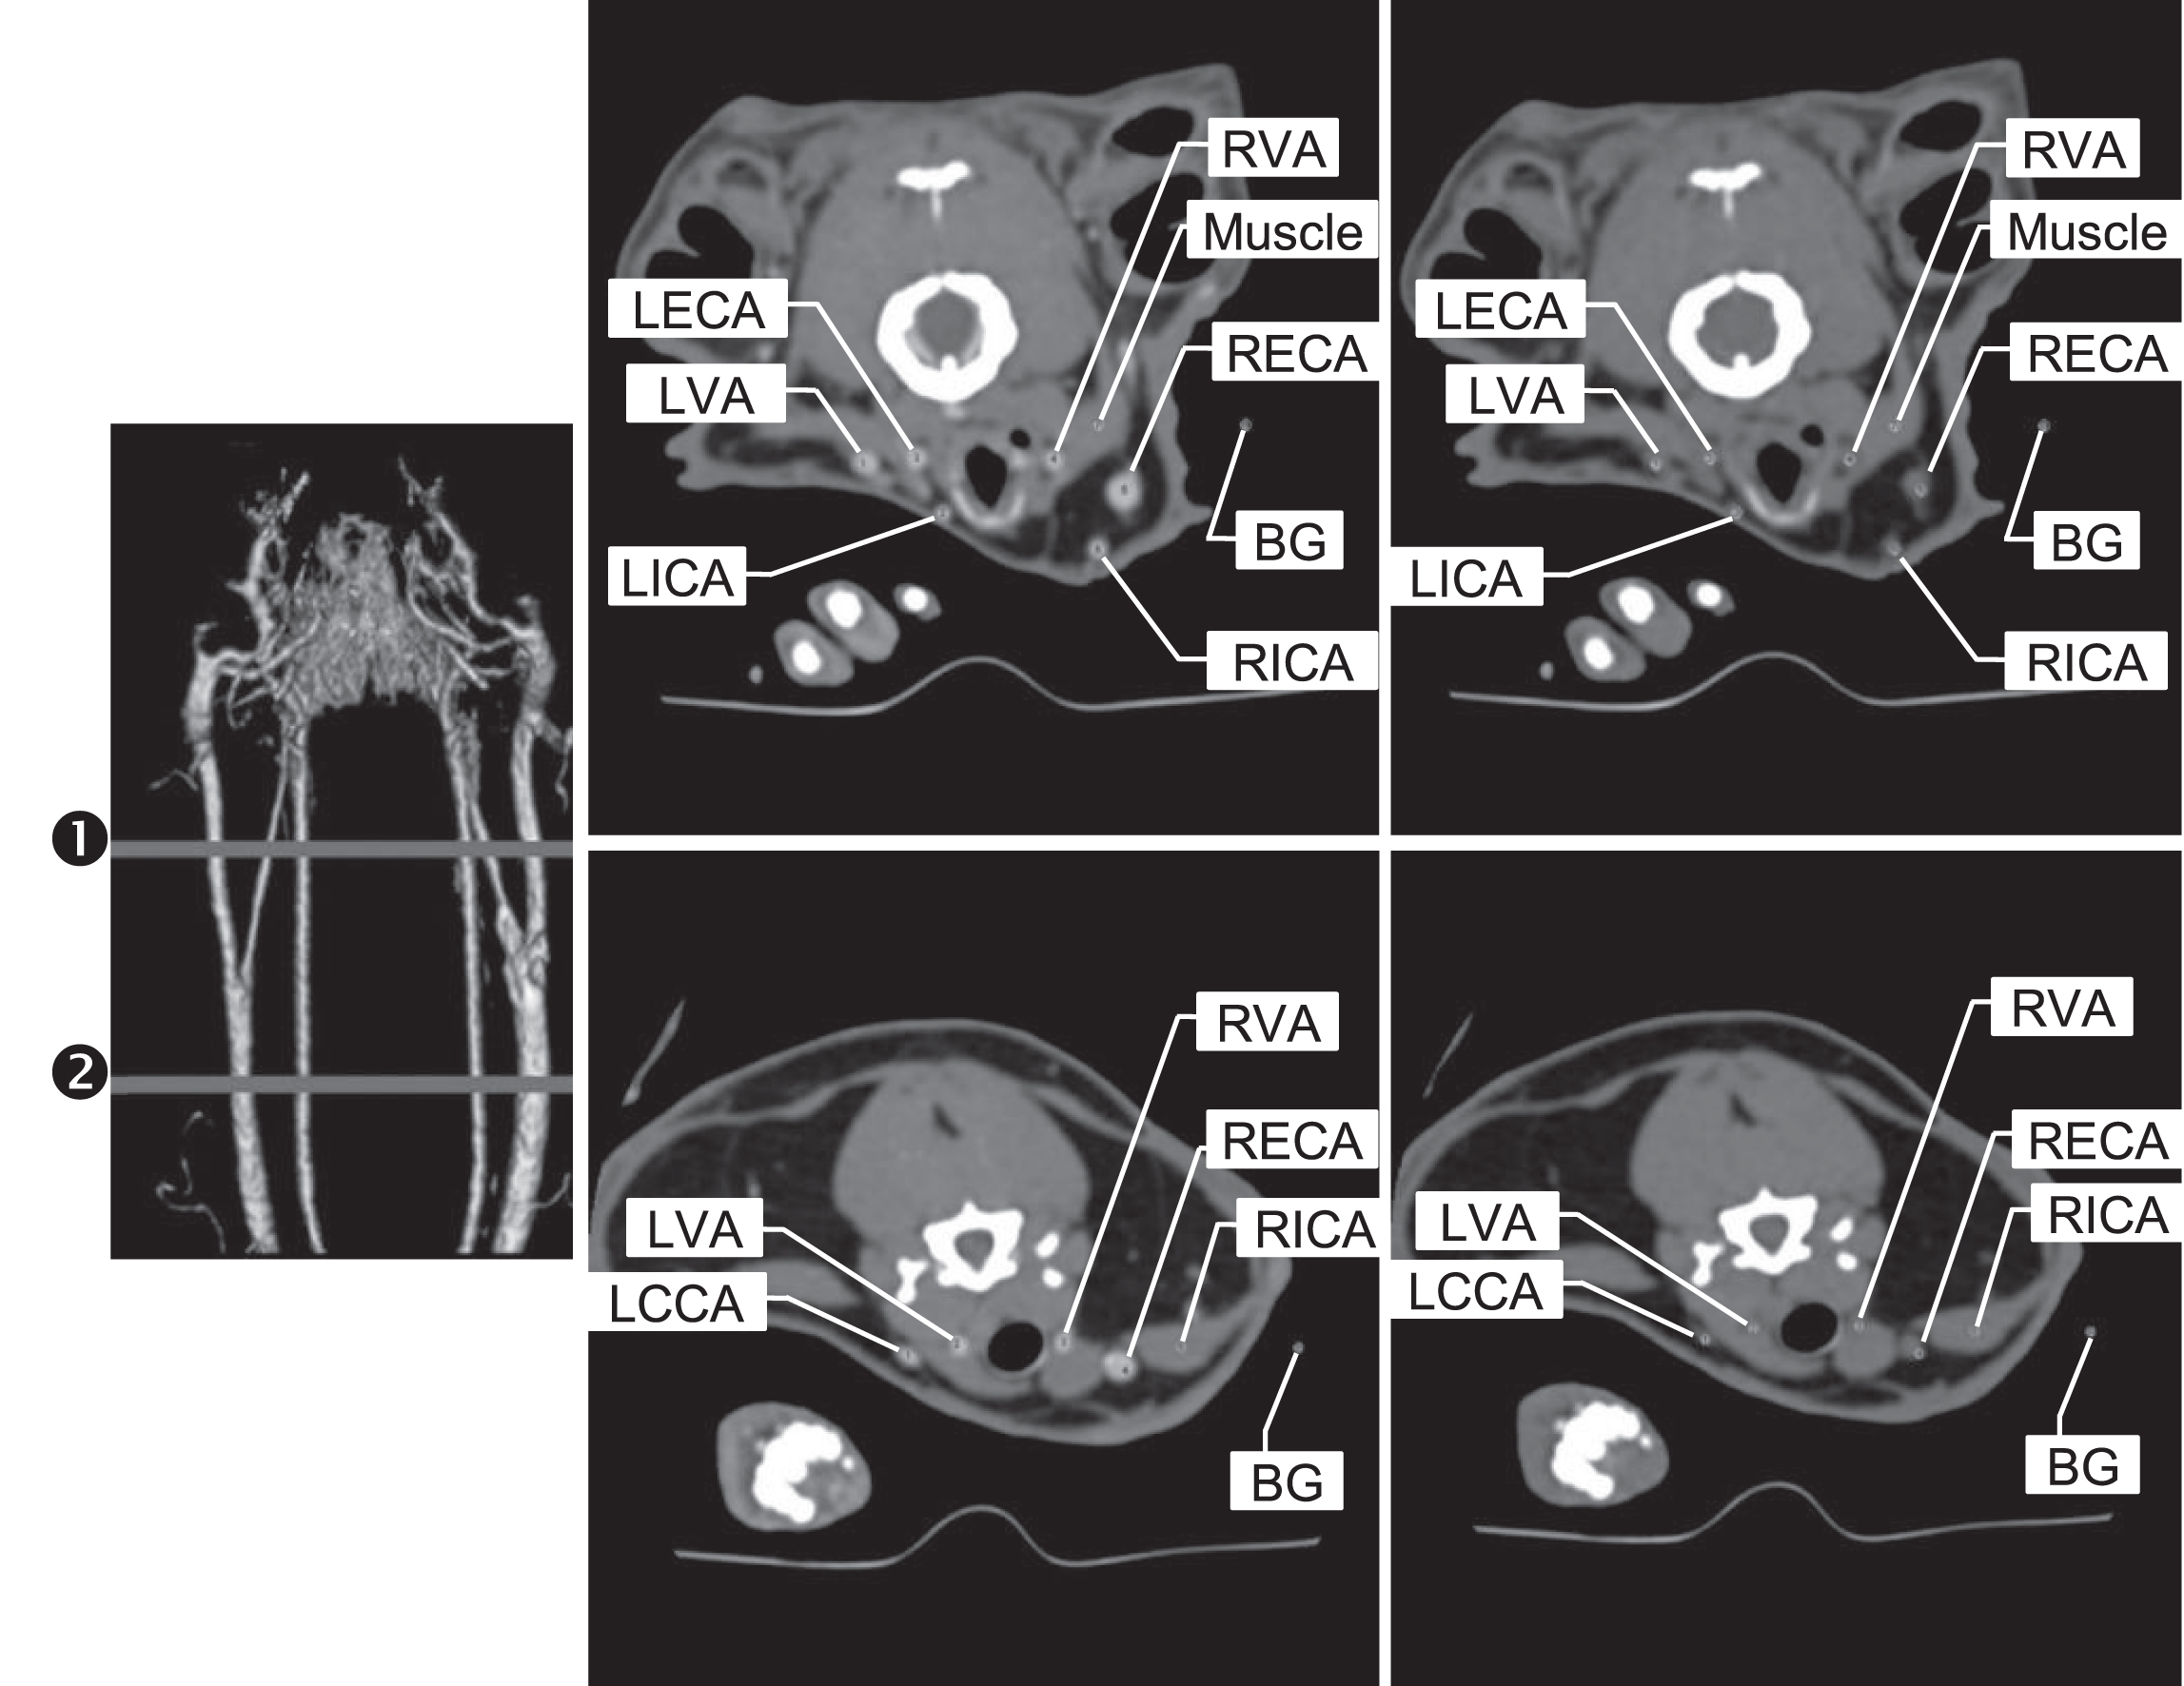
Illustration of quantitative analysis on CT images, lines 1 and 2 on MPR image (left) show the cross-sections of interest. Circles on the middle column (non-contrast agent) and on the right column (contrast agent) images show the ROIs.
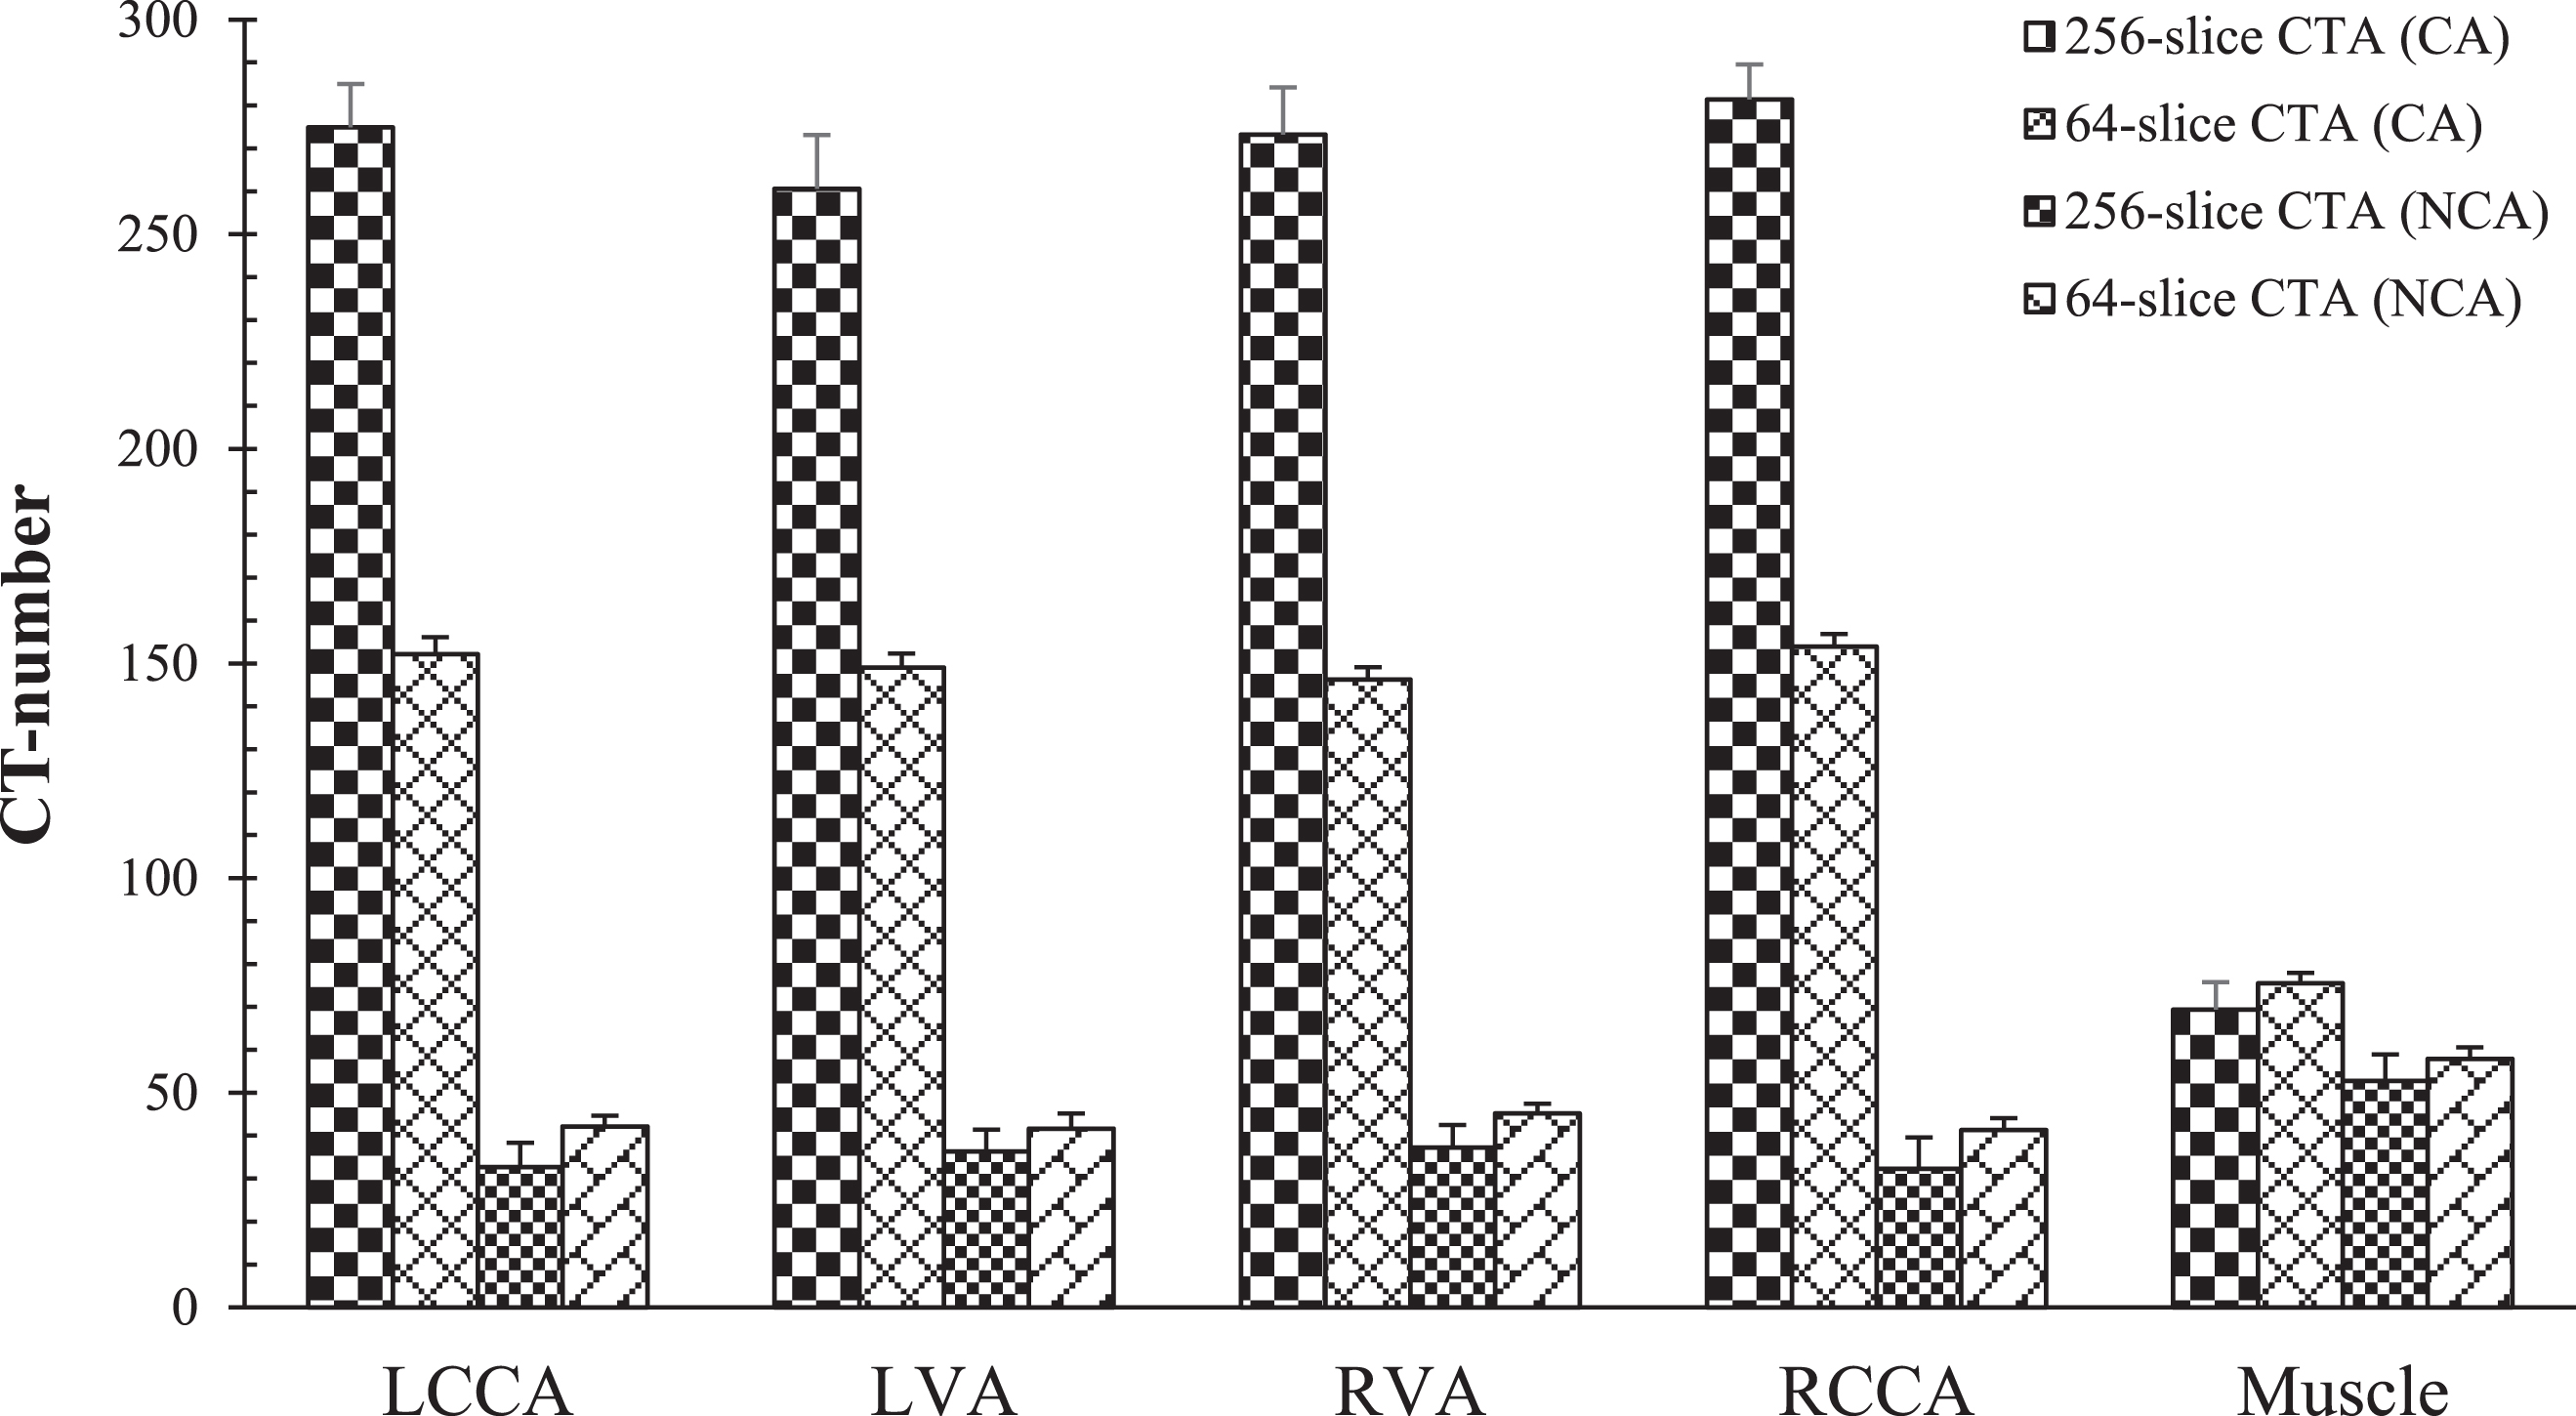
The CT numbers of each vessel and branch before and after contrast agent injection of the cross-section 1 on 256-slice CTA and 64-slice CTA images.

The SNR of each vessel and branch before and after contrast agent injection of the cross-section 1 on 256-slice CTA and 64-slice CTA images.

The CNR of each vessel and branch before and after contrast agent injection of the cross-section 1 on 256-slice CTA and 64-slice CTA images.
The CT numbers of each vessel and branch before and after contrast agent injection of the cross-section 2 on 256-slice CTA and 64-slice CTA images.

The SNR of each vessel and branch before and after contrast agent injection of the cross-section 2 on 256-slice CTA and 64-slice CTA images.

The CNR of each vessel and branch before and after contrast agent injection of the cross-section 2 on 256-slice CTA and 64-slice CTA images.
Figure 3 depicts the CTN of LCCA, LVA, RVA, and RCCA before and after CA injection on the cross-section 1 of 256-slice and 64-slice CTA respectively. It shows that all the CTNs of LCCA, LVA, RVA, and RCCA after CA injection were higher than those before CA injection (p < 0.05). It also shows that all the CTNs of LCCA, LVA, RVA, and RCCA after CA injection on the 256-slice were higher than those on the 64-slice CTA (p < 0.05). On the contrary, all the CTNs of LCCA, LVA, RVA, and RCCA before CA injection on the 256-slice CTA were lower than those on the 64-slice CTA (p < 0.05).
Figure 4 depicts that the SNRs of LCCA, LVA, RVA, and RCCA after CA injection were higher than those before CA injection on the cross-section 1 of 256-slice and 64-slice CTA respectively (p < 0.05). It shows that the SNRs of LVA and RVA after CA injection on the 256-slice were lower than those on the 64-slice CTA (p < 0.05). The SNRs of LCCA and RCCA after CA injection on the 256-slice were higher than those on the 64-slice CTA. There was significant difference in the SNR of RCCA after CA injection between the 256-slice and the 64-slice CTA (p < 0.05), but there was no significant difference in the SNR of LCCA after CA injection between the 256-slice and the 64-slice CTA (p = 0.87). The SNRs of LCCA, LVA, RVA, and RCCA before CA injection on the 256-slice CTA were lower than those on the 64-slice CTA (p < 0.05).
Figure 5 depicts the CNRs of LCCA and RCCA after CA injection on the 256-slice were higher than on the 64-slice CTA (p < 0.05). There were no differences in the CNRs of LVA (p = 0.533) and RVA (p = 0.533) after CA injection between the 256-slice and 64-slice CTA. There were also no significant differences in the CNRs of LCCA (p = 0.12), LVA (p = 0.34), RVA (p = 0.20) and RCCA (p = 0.06) before CA injection between the 256-slice and 64-slice CTA.
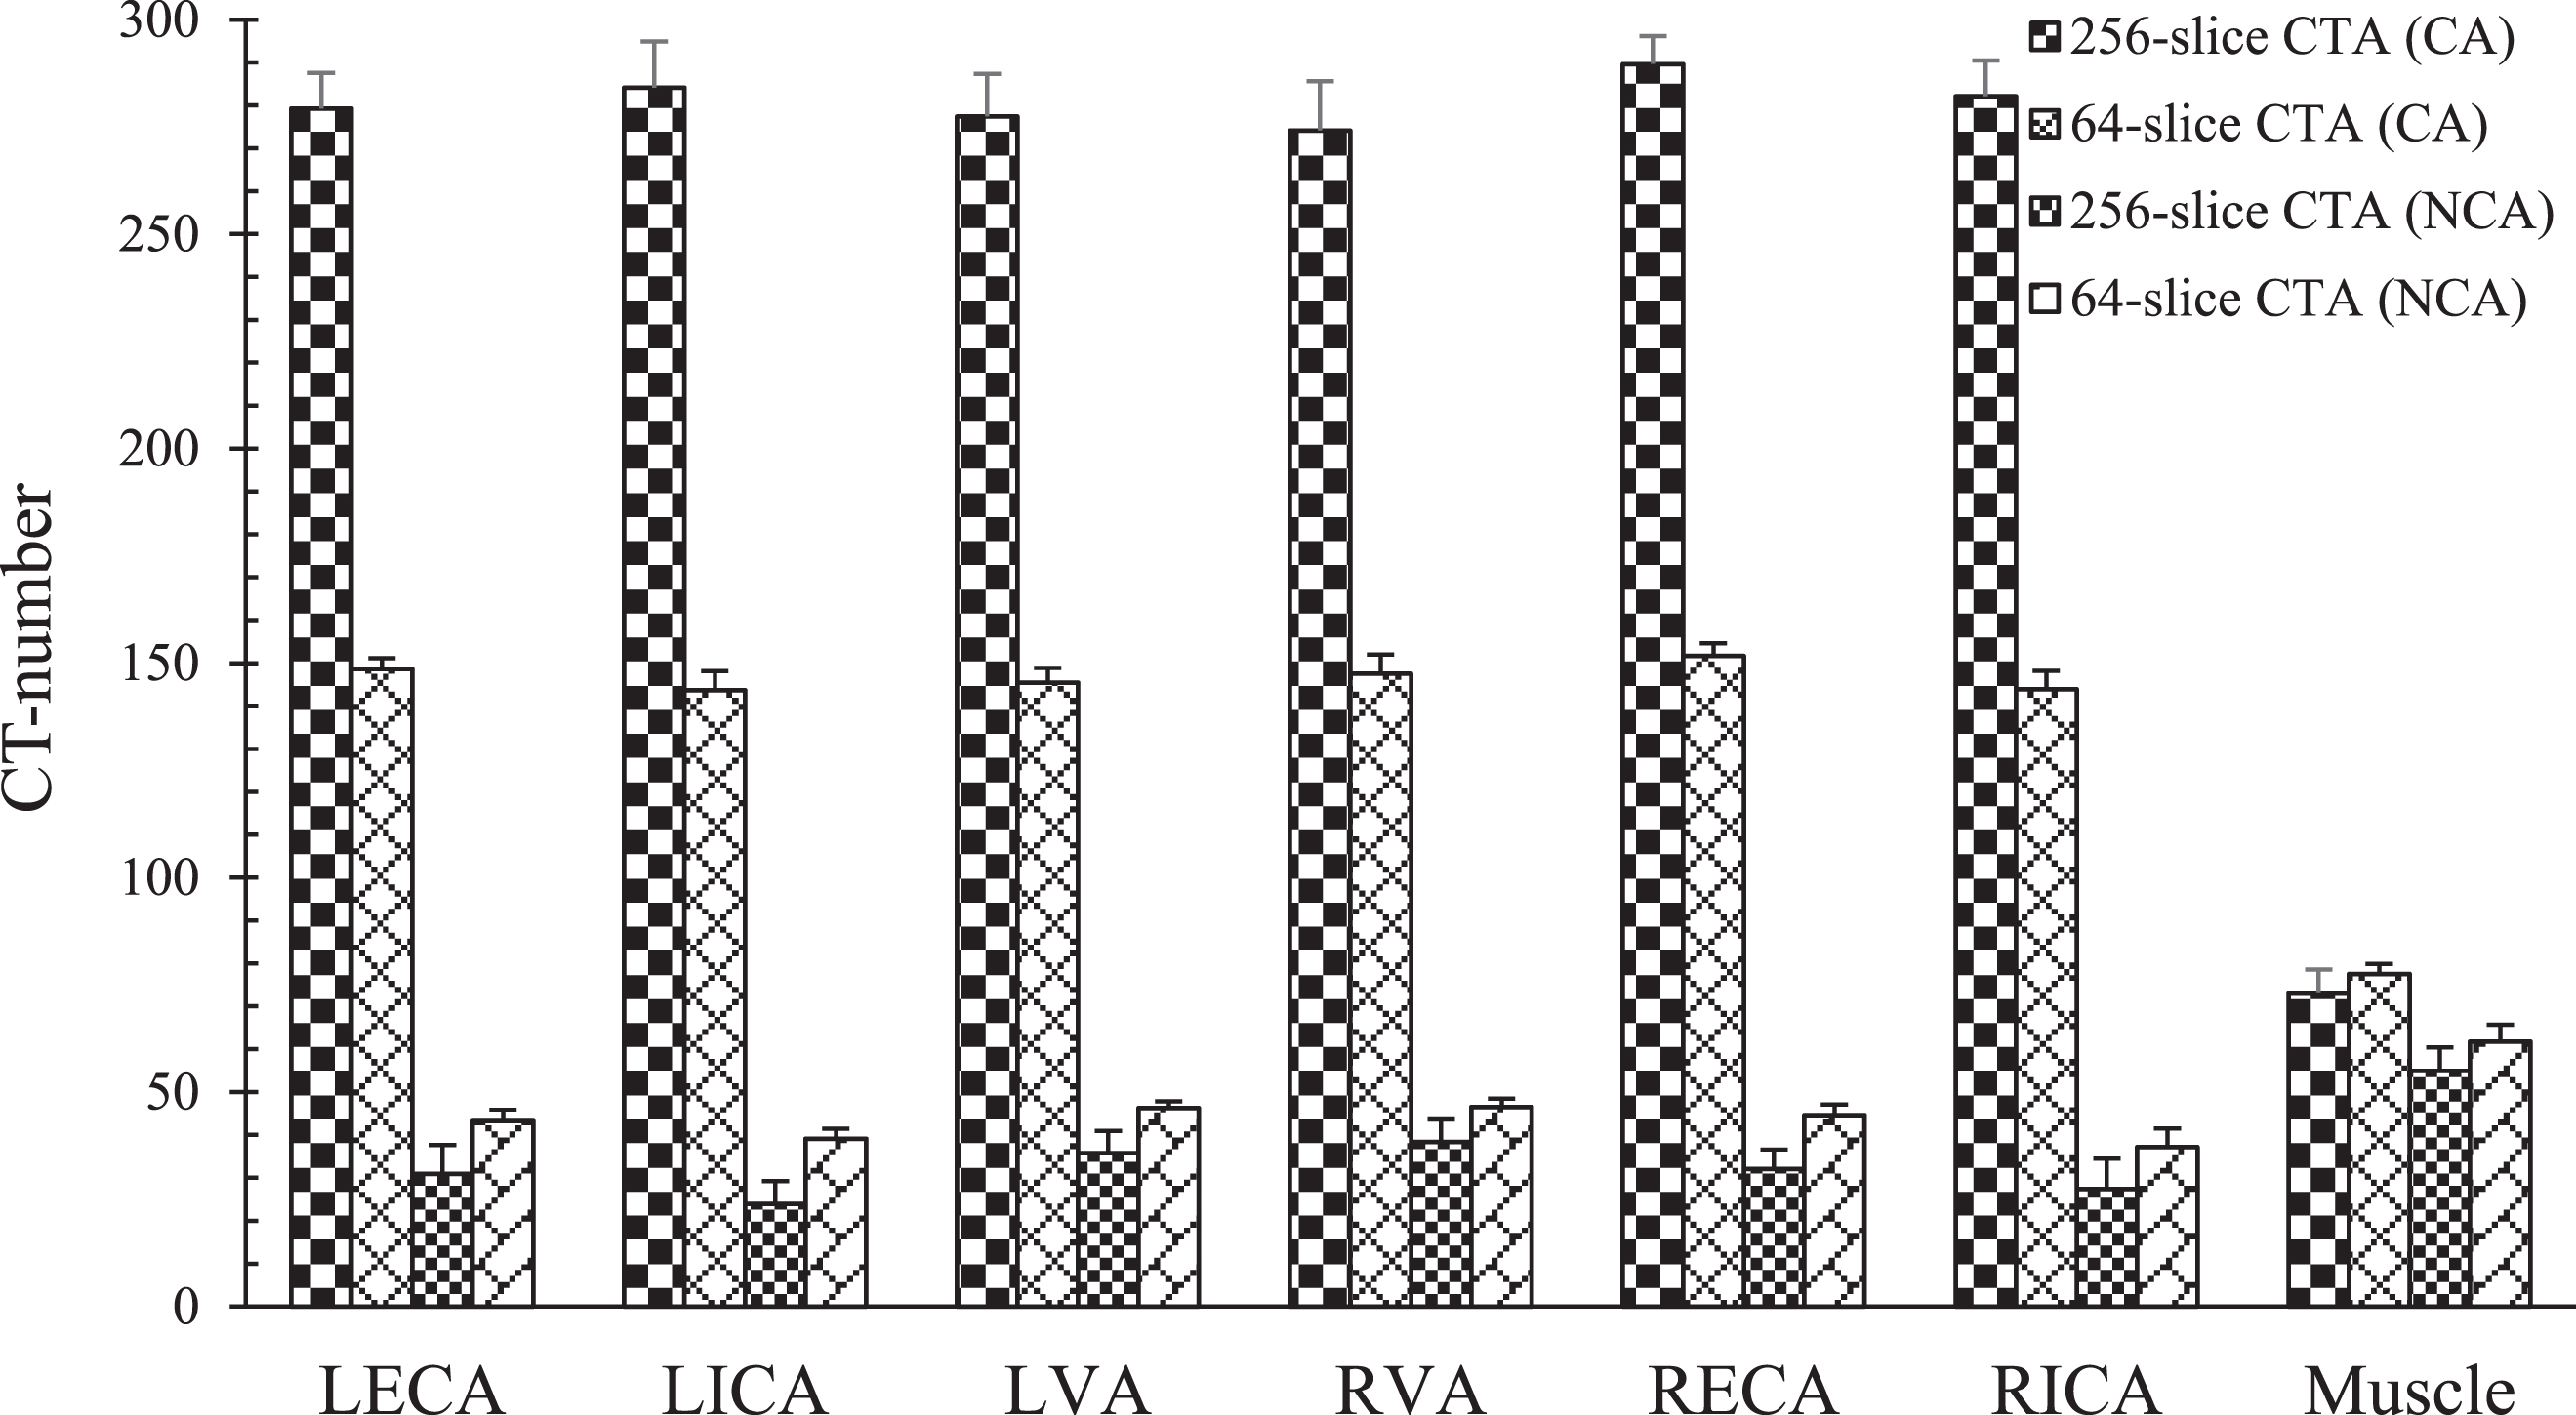
Figure 6 depicts the CTNs of LECA, LICA, LVA, RVA, RECA and RICA after CA injection were higher than those before CA injection on the 256-slice CTA and 64-slice CTA (p < 0.05). The CTNs of LECA, LICA, LVA, RVA, RECA and RICA after CA injection on the 256-slice were higher than those on the 64-slice CTA (p < 0.05). However, the CTNs of LECA, LICA, LVA, RVA, RECA and RICA before CA injection on the 256-slice were lower than those on the 64-slice CTA (p < 0.05).
Figure 7 depicts that the SNRs of LECA, LICA, LVA, RVA, RECA and RICA after CA injection were higher than those before CA injection. There were no significant differences in the SNRs of LECA (p = 0.92), LICA (p = 0.87), LVA (p = 0.28), RVA (p = 0.62), RECA (p = 0.58) and RICA (p = 0.11) after CA injection between 256-slice and 64-slice CTA. The SNRs of LECA, LICA, LVA, RVA, RECA and RICA before CA injection were lower on 256-slice CTA than those on 64-slice CTA (p < 0.05).
Figure 8 shows that the CNRs of LECA, LICA, LVA, RVA, RECA and RICA after CA injection were higher than those before CA injection on the 256-slice CTA and 64-slice CTA (p < 0.05). The CNRs of LECA and RICA after CA injection were higher on the 256-slice CTA than those on the 64-slice CTA (p < 0.05). There were no significant differences in the CNRs of LICA (p = 0.77), LVA (p = 0.87), RVA (p = 0.16), and RECA (p = 0.12) after CA injection between the 256-slice and 64-slice CTA. The CNRs of LICA and RICA before CA injection were higher on the 256-slice CTA than those on 64-slice CTA (p < 0.05). There were no significant differences in the CNRs of LECA (p = 0.38), LVA (p = 0.08), RVA (p = 0.18), and RECA (p = 0.41) before CA injection between 256-slice and 64-slice CTA. The error bars of Figs 3–8 show the standard deviation (variation) for each group.
Last, the measurement data show that the CTDIvol values of 256-slice and 64-slice CTA were 16.78 mGy and 95.57 mGy, respectively. The DLP values of 256-slice and 64-slice CTA were 235.78 mGy-cm and 1320.42 mGy-cm, respectively.
The rabbit neck CTA was performed on two clinical CT scanners: a 256-sliceCT (n = 11) and a 64-sliceCT (n = 11). More vascular vessels were detected on MPR MRA of the 256-slice than on the 64-slice CTA. Because the vessels of rabbits are narrower than those of human. The vessels which disappear in rabbit CT angiography may appear in human CT angiography. The point for Fig. 1 is to compare in the spatial resolution of rabbit CT angiography between these two modalities.
Ten ROIs on neck arterial vessels of each rabbit were obtained to evaluate if there was significant differences in CTN, SNR and CNR before and after CA injection between the 256-slice and 64-slice CTA. After CA injection, CTN, SNR and CNR were higher than those before CA injection on both the 256-slice and 64-slice CTA. Figure 3 shows that LCCA, LVA, RVA and RCCA after contrast agent injection have significantly higher CTN on the 256-slice CTA than those on the 64-slice CTA. SNR depends on both CTN and noise. CTN and noise are location dependent. Higher CTN with higher noise may cause lower SNR. It happened on the LVA and RVA. SNRs of LVA and RVA were significantly lower on the cross-section 1 of the 256-slice CTA after CA injection than those on the 64-slice CTA. There were similar results on the cross-section 2. After CA injection, the CTNs of LVA, RVA, RECA, LECA, LICA, and RICA were all significantly higher for the 256-slice than the 64-slice CTA. However, SNRs of LVA, RVA and RECA were significantly lower on the 256-slice CTA than those on the 64- slice CTA. After CA injection,all the CTN was higher on the 256-slice than those on the 64-slice CTA (p < 0.05). There were no significant differences in SNRs of 7 ROIs (70%) between the 256-slice and 64-slice CTA. There were no significant differences in CNRs of 6 ROIs (60%) between the 256-slice and 64-slice CTA.
The CTDIvol of the 64-slice CTA (95.57 mGy) was nearly 5.7 times that of the 256-slice CTA (16.78 mGy). The DLP of the 64-slice CTA (1320.42 mGy-cm) was nearly 5.6 times that of the 256-slice CTA (235.78 mGy-cm) as well. The results demonstrated that the radiation dose of 256-slice CTA was much lower than that of 64-slice with comparable SNR and CNR of arterial vessels of rabbit neck between the 256-slice and 64-slice CTA. Lower radiation might be a method of choice for patients in clinical applications.
CTA has been widely applied in many clinical examinations. Because CTA has ionizing radiation, radiation-induced cancer risk is still an important concern [15, 16]. Many strategies have been developed to reduce the patient dose, including low tube voltage, low iodine, iterative image reconstruction, and so on. The goal is to reduce the radiation dose during scanning, but still to maintain good image quality for accurate diagnosis [17, 21–31].
The radiation dose produced by X-ray from X-ray machine is proportional to the square of tube voltage. Therefore, using a lower tube voltage can reduce the radiation dose. A 120 kVp protocol is commonly used in clinical CT examinations. Lower tube voltages, e.g. 70, 80, or 100 kVp (<120 kVp) were used to reduce the radiation dose [21–31]. Most of time, contrast agents are used to enhance the image quality in clinical situations unless the image quality is high enough without contrast agents. The contrast agent consists of iodine, which has higher atomic number and higher X-ray attenuation coefficient than blood. That’s why the CTN of all the ROIs of vessels in our study increased after CA injection. Due to the photoelectric effect, the attenuation coefficient of iodine decreases while the tube voltage increases. Our results met this theorem after contrast injection on the kV point of view, i.e. the CTNs of the 256-slice CTA (70 kVp) were higher than those of the 64-slice CTA (80 kVp) after CA injection. However, the results were opposite before contrast injection, i.e. the CTNs of the 256-slice CTA (70 kVp) were lower than those of the 64-slice CTA (80 kVp) before CA injection. Except for tube voltage, the CTN of CTA could be influenced by other factors, e.g. scanning parameters, reconstruction algorithm, tissue compositions, body mass index and noise, etc. The overall effects of these factors might cause CTN change. The impact of tube voltage outweighed the other factors after CA injection, therefore, CTNs consistently decreased with increased tube voltage after CA injection. All factors contribute some impacts on SNRs and CNRs as well. There were no significant differences in SNRs and CNRs between the 256-slice and 64-slice CTA after CA injection in our results.
CA can improve the image quality of CTA. However, iodine-containing contrast agents might cause severe allergic effects. Although these can be alleviated by using a non-ionic iodine-free contrast agent. Xenetix 350 used in this study is a water-soluble nonionic contrast agent. The leakage of intravenous contrast agent injection under the skin might result in skin damage as well; therefore, care should be taken while injecting the CA for patient safety. The concentration and volume of CA is also related to the image quality and radiation dose. It is feasible to keep the image quality by reducing the concentration of CA with the help of iterative image reconstruction method [24, 28].
At present, CT has become an important method for disease diagnosis and screening. After CTA scanning, cross-sectional images were reconstructed into a 3-dimensional (3D) blood vessel image using maximum intensity projection (MIP) and 3D multi-planar reconstruction (MPR). Through the reconstruction, blood vessels can be distinguished from periphery tissues and displayed in all different orientations. The effectiveness of diagnosis depends on the CTA image quality. The better the image quality, the higher the accuracy of diagnosis. Currently, the use of iterative reconstruction can reduce the noise and improve the image quality [21–23]. Although low tube voltage might cause higher noise, low tube voltage combined with iterative reconstruction can reduce the radiation dose and maintain the image quality. Adaptive statistical iterative reconstruction (ASiR) is the image reconstruction method for Revolution CT and is the most commonly used iterative reconstruction technique. The ASiR was tested from 10% to 90%, and the results showed that CTN, SNR and CTR all showed no significant differences. However, the reconstructed 3D vascular image is preferably 50% ∼70% iterative. Therefore, 60% iteration was adopted in this study for CTN, SNR and CNR data analysis [23].
One of the fast growing LDCTA techniques is the highly efficient detector system, like Gemstone™ Clarity detector (GE), Stellar detector (Siemens) and Nano Panel Elite CT detector (Philips) [32–34]. These highly efficient detector systems offer significantly higher image quality (SNR, spatial and contrast resolution), higher temporal resolution, faster patient workflow and lower dose. Developments of detectors aim to improve the value of lesion detection rate and disease identification ability, while also providing diagnostic confidence. We compared the image quality and radiation dose of two clinical CT scanners. The hardware and software may be different between these two scanners. The clinical protocols were used for comparison in this study. The results observed could be the combination of many factors, including the hardware and software. Generally speaking, 256-slice CT can achieve higher image quality and scanning efficiency (lower dose) than using 64-slice CT, but at a higher cost. Not many sites have 256-slice CT. The 256-slice CT used in this study is a new modality in the hospital. This study provides the quantitative data for comparison between these two CT scanners.
The minimum tube voltage for the two types of CTs was selected in this study, 70 kVp for the 256-slice CTA and 80 kVp for the 64-slice CTA. The 256-slice CTA has a 16 cm scanning coverage with a gantry rotating speed of 0.28 seconds/revolution which has shorten the exposure time than 64-slice CTA. In addition, adaptive statistical iterative reconstruction (ASiR) further reduce the radiation dose to more than 80% compared to 64-slice CT [35, 36].
CTA has been widely used in clinical routine examination. How to increase diagnostic confidence by improving image quality and reduce radiation dosage are crucial issues in clinical applications. Studies related to CTA animal models are also important [19, 31]. The study results from animals might not exactly applicable to human studies. This study was focused on CTA of rabbits. The image quality and dose of rabbit CT angiography might be different from those of human. However, the CTA animal model could be useful for therapy monitoring and drug development. The results of this study could provide helpful information for further CTA animal studies in the future.
Conclusion
The innovation in this study is we obtained contrast-enhanced head and neck CT angiography of New Zealand rabbits using two clinical CT scanners. Besides, we did the quantitative comparison between these two CT scanners. This study confirmed that quantitative analysis of CTN, SNR and CNR values is feasible on a rabbit model using clinical CT scanners. CTN, SNR and CNR on CTA after CA injection were all higher than those on CTA before CA injection. After CA injection, CTNs on the 256-slice CTA were higher or no less than those on the 64-slice CTA. The radiation dose from the 256-slice CTA was much lower than that from the 64-slice CTA with comparable SNR and CNR. This information might be helpful for further CTA studies on animal models.
Disclosure
The authors declare that they have no conflict of interest. All applicable international, national, and/or institutional guidelines for the care and use of animals were followed.
Footnotes
Acknowledgments
This study was funded under grant number VGHKS105-066 by Kaohsiung Veterans General Hospital, Taiwan, R.O.C.