
Abstract
BACKGROUND/OBJECTIVE:
In this retrospective study, we aimed to investigate a new 3D evaluation method for evaluating bone regeneration after cystectomy of odontogenic cysts.
METHODS:
The study included 26 patients who underwent cystectomies between 2012 and 2017 and had received either fillings or non-fillings with autologous iliac crest. Bony regeneration was analyzed using 3D imaging software and comparing identical regions of interest (ROIs) that were determined by exact overlays of the postoperative cone beam computer tomography (CBCT) or computer tomography (CT) images. Outcome measures, including volume changes according to the defect size and configuration, patient age, the entity and distribution of the cysts, were collected.
RESULTS:
Twenty-six patients (5 women and 21 men) had 30 defects, including nine keratocysts, seven radicular cysts and 14 dentigerous cysts. A total of 73% of the defects were in the mandible. The mean 3D follow-up time was 12 months. According to the 3D evaluation of bony regeneration, the defect size and configuration showed no significant differences between the groups (filled or non-filled with 15 defects per group).
CONCLUSIONS:
By establishing a standardized 3D method for evaluating bone regeneration, healing can be better monitored and evaluated.
Introduction
Odontogenic jaw cysts can occur during every period of life. Their location (upper or lower jaw) is dependent on the origin of the cyst. These cysts can exist as single or multiple cavities that are lined by a specific cyst epithelium. The cysts are usually characterized by a small and asymptomatic growth, which mostly results in large bone cavities. The most frequently occurring cysts are radicular cysts followed by follicular cysts and keratocystic odontogenic tumors (KCOTs) [1]. The new WHO classification released in 2017 has reclassified the former KCOT as a keratocyst. The total removal of these cysts remains the primary aim in preventing their recurrence. Two different operation techniques have been described. The first technique is the decompression technique [2–4], in which communication between the cyst and the mouth is created and appositional bone regeneration is therefore triggered, reducing the diameter/volume of the cyst. With this technique, primarily two surgical procedures are necessary to remove the cyst completely. The other technique is primary enucleation, which involves removing the cyst completely [5, 6].
The resulting cavity can be left untreated in order to wait for spontaneous bone regeneration, either from the formed blood clot or the adjacent bone walls covered by soft tissue [7–10]. The other option is to fill the cavities with autologous bone or bone substitute material [11]. It is well documented in the literature that in animal studies, bony defects larger than a so-called critical size defect (CSD) with a size of < 1 cm3 do not show complete regeneration when left untreated [12]. In addition to clinical aspects, the control of regeneration is primarily detected with radiology techniques, usually via panoramic radiography [13, 14]. Pre- and postoperative images are evaluated and compared with regard to the consolidation of the defects after cystectomy (regardless of whether the defects were filled).
The assessments in the current literature are based on the comparison of the bone density between the defect and local bone surrounding the defect or the percentage changes in the bone defect using programs such as Nemoceph-NemoStudio NX Pro-Nemotec, where linear measurements in mm of the cystic lesion (horizontal, vertical and left/right diagonal) and the distance from the outer boundary of each line to the point of intersection are recorded. These measurements are taken in the same way in each postoperative image to determine the decrease in size and density by the program [11]. The latest studies have already explained that it is not the bone density but rather the bone volume of the defect that is a better assessment of regeneration and that the three-dimensional technique is therefore indispensable. A systematic review from 2018 analyzed previous studies[15], which addressed the filling or non-filling of defects after cystectomies. Thirteen studies were included, but a general procedure could not be declared primarily because the assessments in the studies, in particular the assessment of the bone regeneration of the defects, were based exclusively on 2D analyses (x-ray radiography). The authors concluded that more 3D analyses are needed to provide a conclusive statement about the healing process. In terms of bone material, autologous bone remains the gold standard, especially in defects larger than a CSD.
We assumed an incomplete healing of the bony defects larger than a CSD. According to latest literature no evidence-based recommendation for surgeons how to deal with such defects should be made. Filling with autologous bone always results in co-morbidity. And for the patient, it is largely irreversible in everyday life whether a bony defect heals completely as long as function and anatomy are preserved, but probably whether a second surgical field is necessary.
Therefore, the aim of this retrospective analysis was to develop a 3D method for assessing bone defect development after cystectomy to predict the regeneration of filled defects compared with that of non-filled defects.
Materials and methods
Study design and setup
This study reports the retrospective analyses of data. The patients undergoing cystectomies of odontogenic cysts in the Department of Oral and Maxillofacial Surgery at the University of Erlangen-Nuremberg in Germany between 2012 and 2017 were screened. The patients who received either filling or non-filling of the cavities and 3D postoperative imaging scans (the first immediately postoperative) were included. The exclusion criteria were missing 3D computed tomography (CT) or cone-beam CT (CBCT) follow-up scans. Additionally, patients with a partial or total resection of the jaw were excluded. The screening process for the patients was performed with patient charts and was performed according to the inclusion/exclusion criteria. Ethical approval (No. 37_18Bc) was obtained from the ethics committee of the medical faculties of the Friedrich-Alexander University Erlangen-Nuremberg in Germany. The bony defects (in the upper and lower jaw) were partially left untreated after enucleation (non-filling), while the other defects were filled. For the filling process, autologous bone from the iliac crest was used. The decision to fill the defect was made independent of this study. The aim was to evaluate bony regeneration by postoperative 3D image assessments. Every procedure was performed under general anesthesia. The patients received a perioperative antibiotic agent (Augmentan® 875/125 mg; Western Pharma GmbH, Quettingen, Germany or clindamycin 600 mg, Hexal AG, Holzkirchen, Germany) for a primary wound closure without oral tension and at the iliac crest donor site.
Data extraction and methodology
We analyzed the patient data according to the following parameters: Bone regeneration in terms of filling or non-filling with 3D evaluation Defect configuration (bony walls) Location of cysts Entity of the cysts Sex and age of patients
Outcomes
Our primary outcome was defined as bony regeneration during the follow-up by a 3D- evaluation of the volume changes in the defect in terms of filling vs. non-filling. The secondary outcome parameters were the location (maxilla, mandible), defect configuration and entity of the cysts in relation to the sex and age of the patients.
3D – Methodology
Both patient groups were analyzed with postoperative 3D images regarding the bone regeneration of the defects (by three calibrated examiners). For this purpose, the corresponding DICOM (Digital Imaging and Communications in Medicine) data sets were converted into STL (stereolithography) files using the software InVesalius (Brazilian Science and Technology Center, Centro de Tecnologia da Informação Renato Archer, Amarais – Campinas/Brazil) as seen in Fig. 1.

Showing the STL file and postoperative defect after cystectomy (non-filling case) in the anterior mandible (32–42).
To better assess the increase in bone volume and the decrease in the size of the residual defect, an initial defect volume was determined according to the first postoperative image. Three-dimensional reconstruction of the defect was performed using the GOM software Inspect-Professional (GOM Branch Benelux, Leuven, Belgium). The defect was covered by so-called generated fitting polynomial surfaces (based on the remaining bone walls after cystectomy), and thus, anatomically correct bone continuity was simulated as seen in Fig. 2. These were converted into CAD surfaces using the “Triangulate Geometric Element” function (Fig. 3). By creating mesh bridges the cavity was closed in the last step so that the initial defect volume (mm3) could be determined as seen in Fig. 4. Based on the initially determined defect volume, the increase can be calculated in the following.
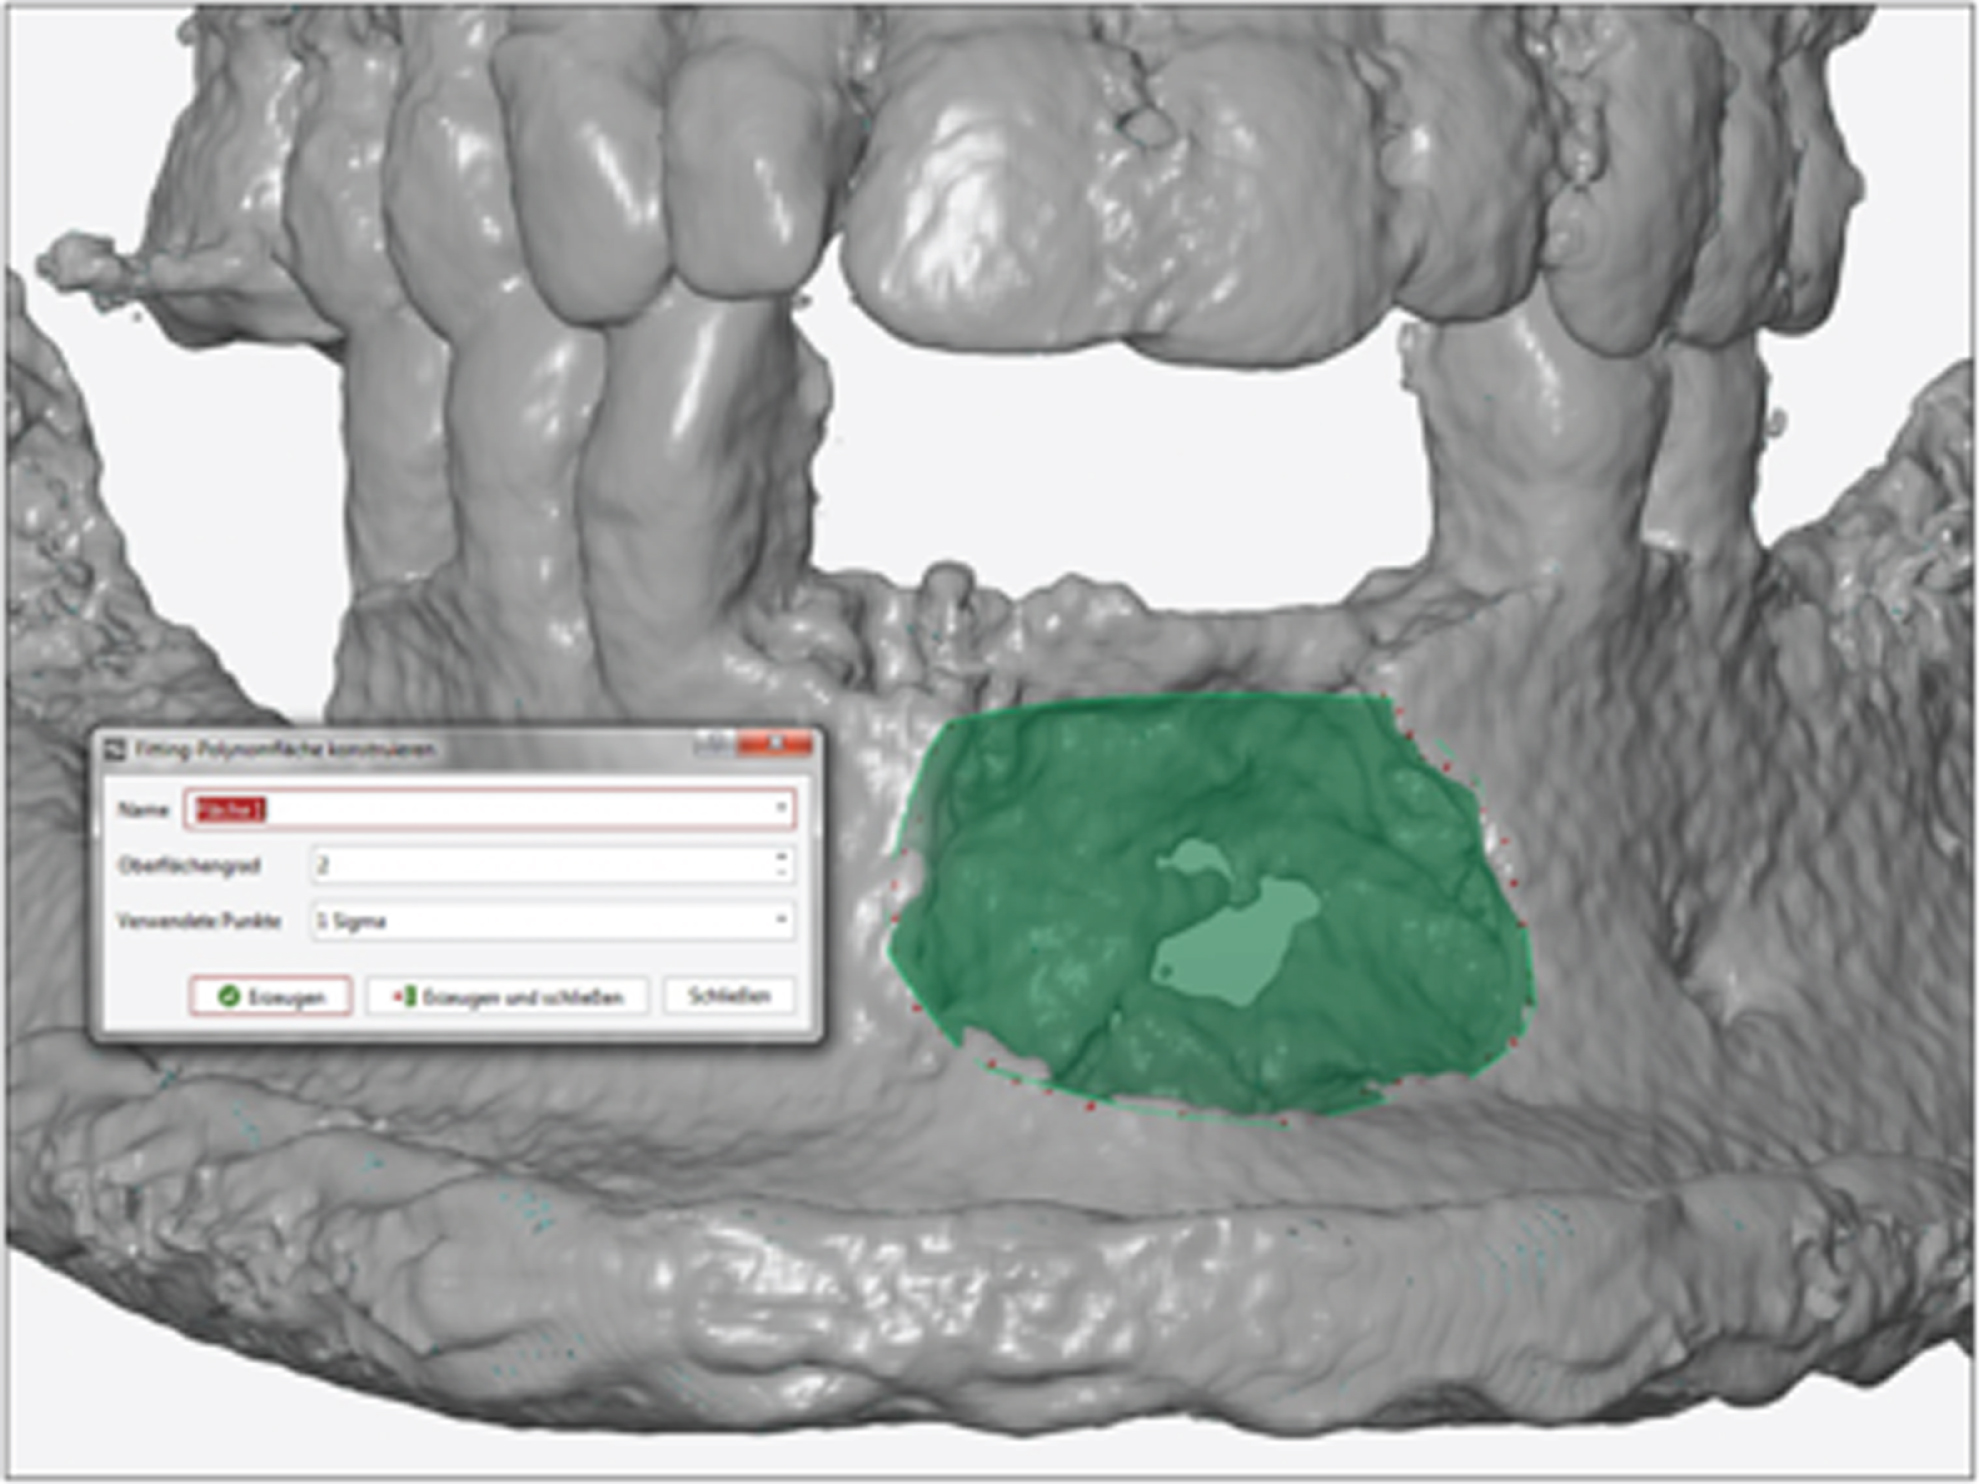
Showing the fitting polynomial surface (based on the remaining bone walls after cystectomy).
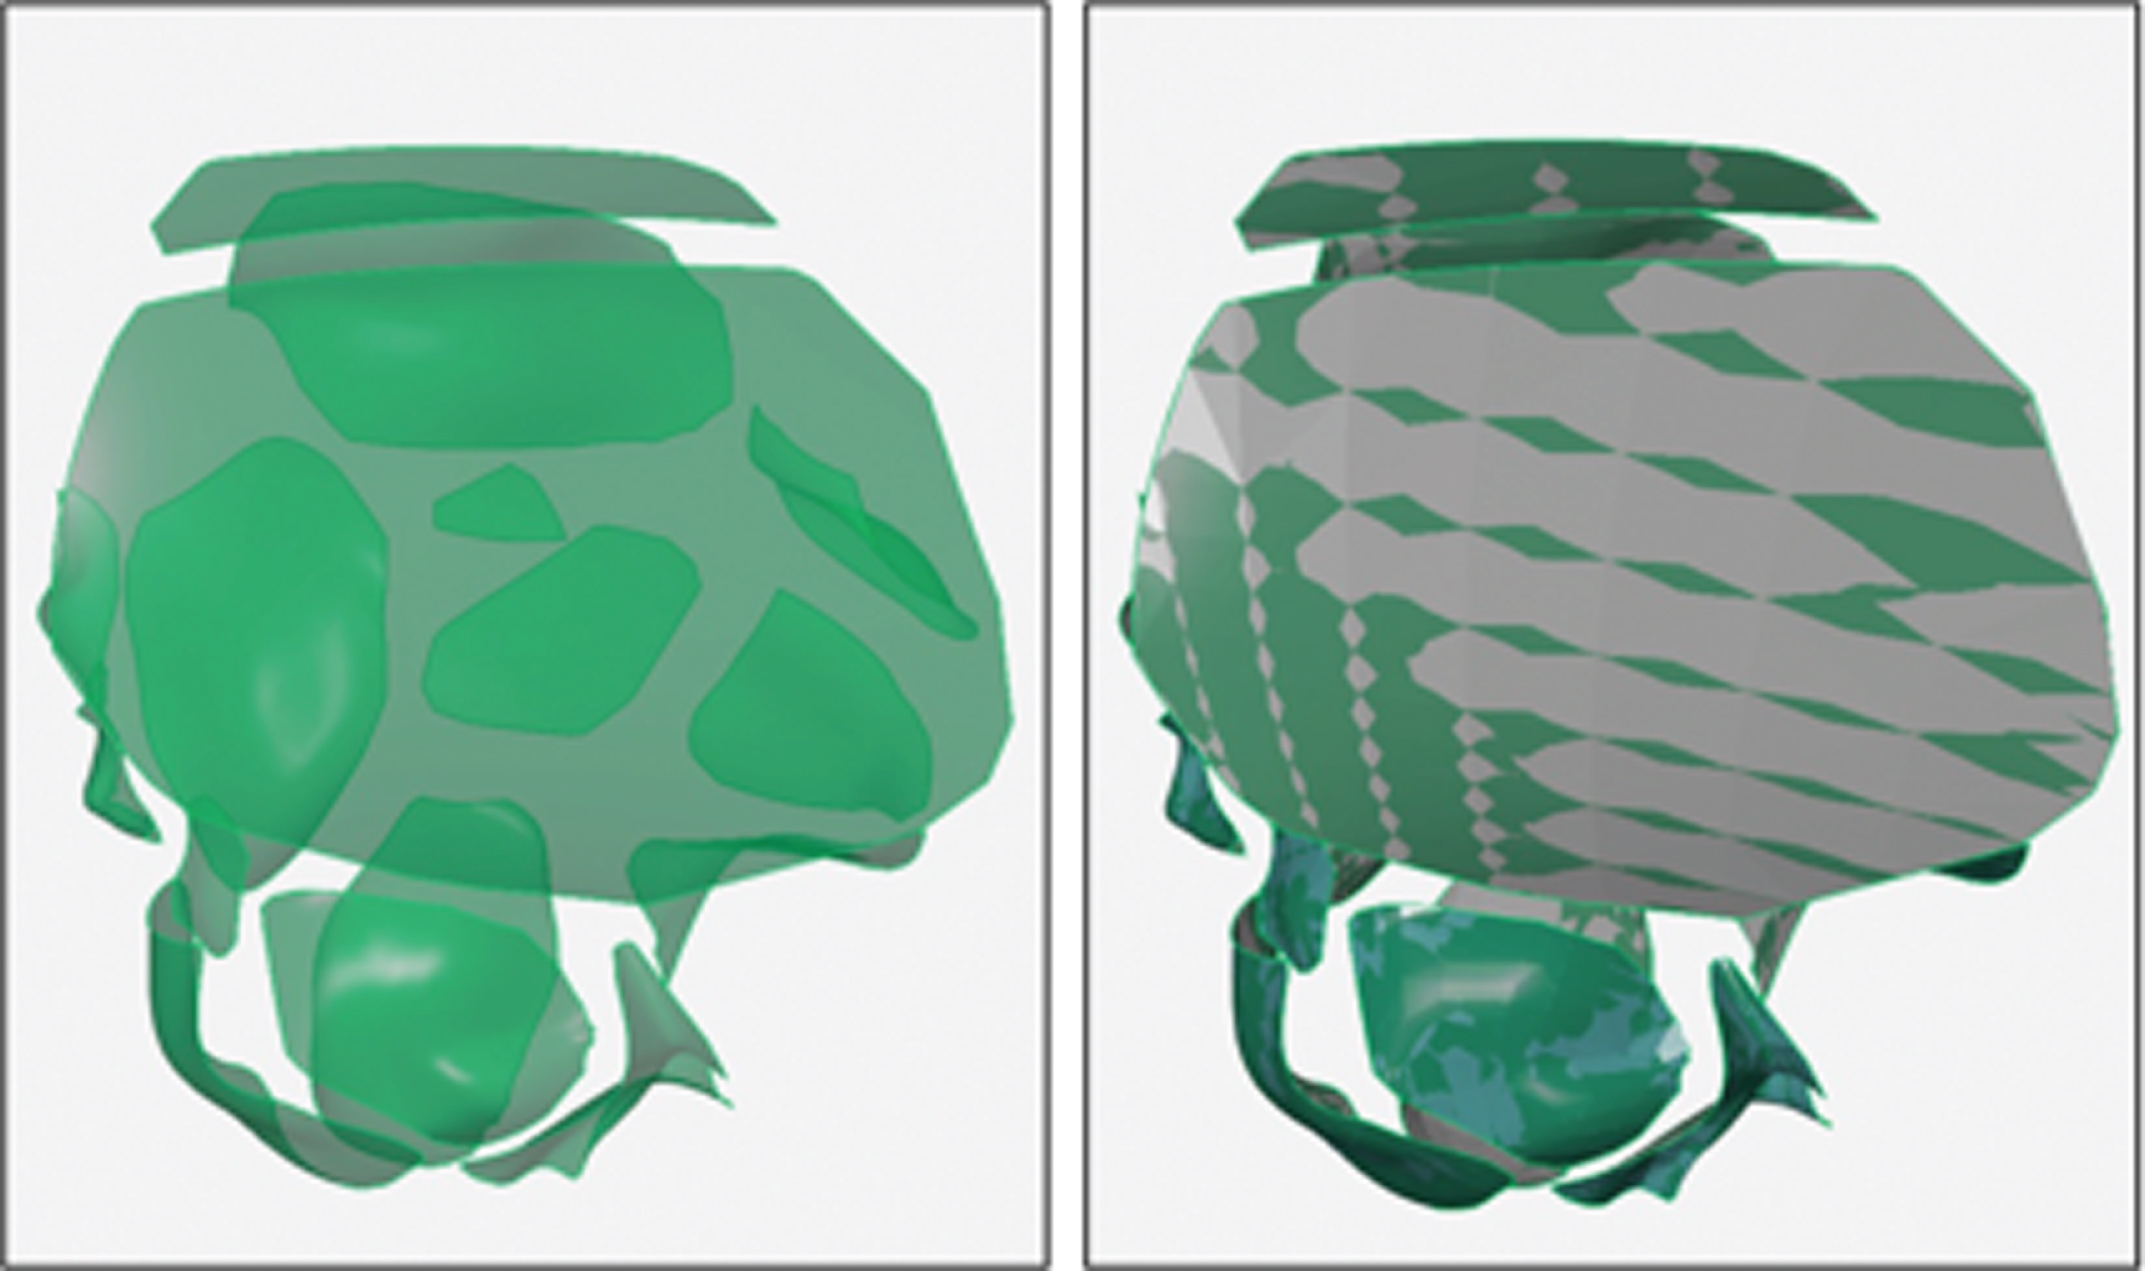
Showing the CAD surfaces within the designed polynomial surface.

Showing the initial postoperative defect with the polygon 3D reconstruction and determination of the defect volume.
The subsequent postoperative follow-up images were then matched and compared with the corresponding initial image to determine the volume development. Using software tools and a three-point alignment method, a local best fit was generated, and all follow-up images were superimposed. After all follow-up scans have been matched to the postoperative scan, all matches must be merged into one document via drag and drop in order to define the identical region of interest (ROI) for all of them. Without a uniform ROI, the results would not be comparable, since only in this area the volume development is assessed (Fig. 5).
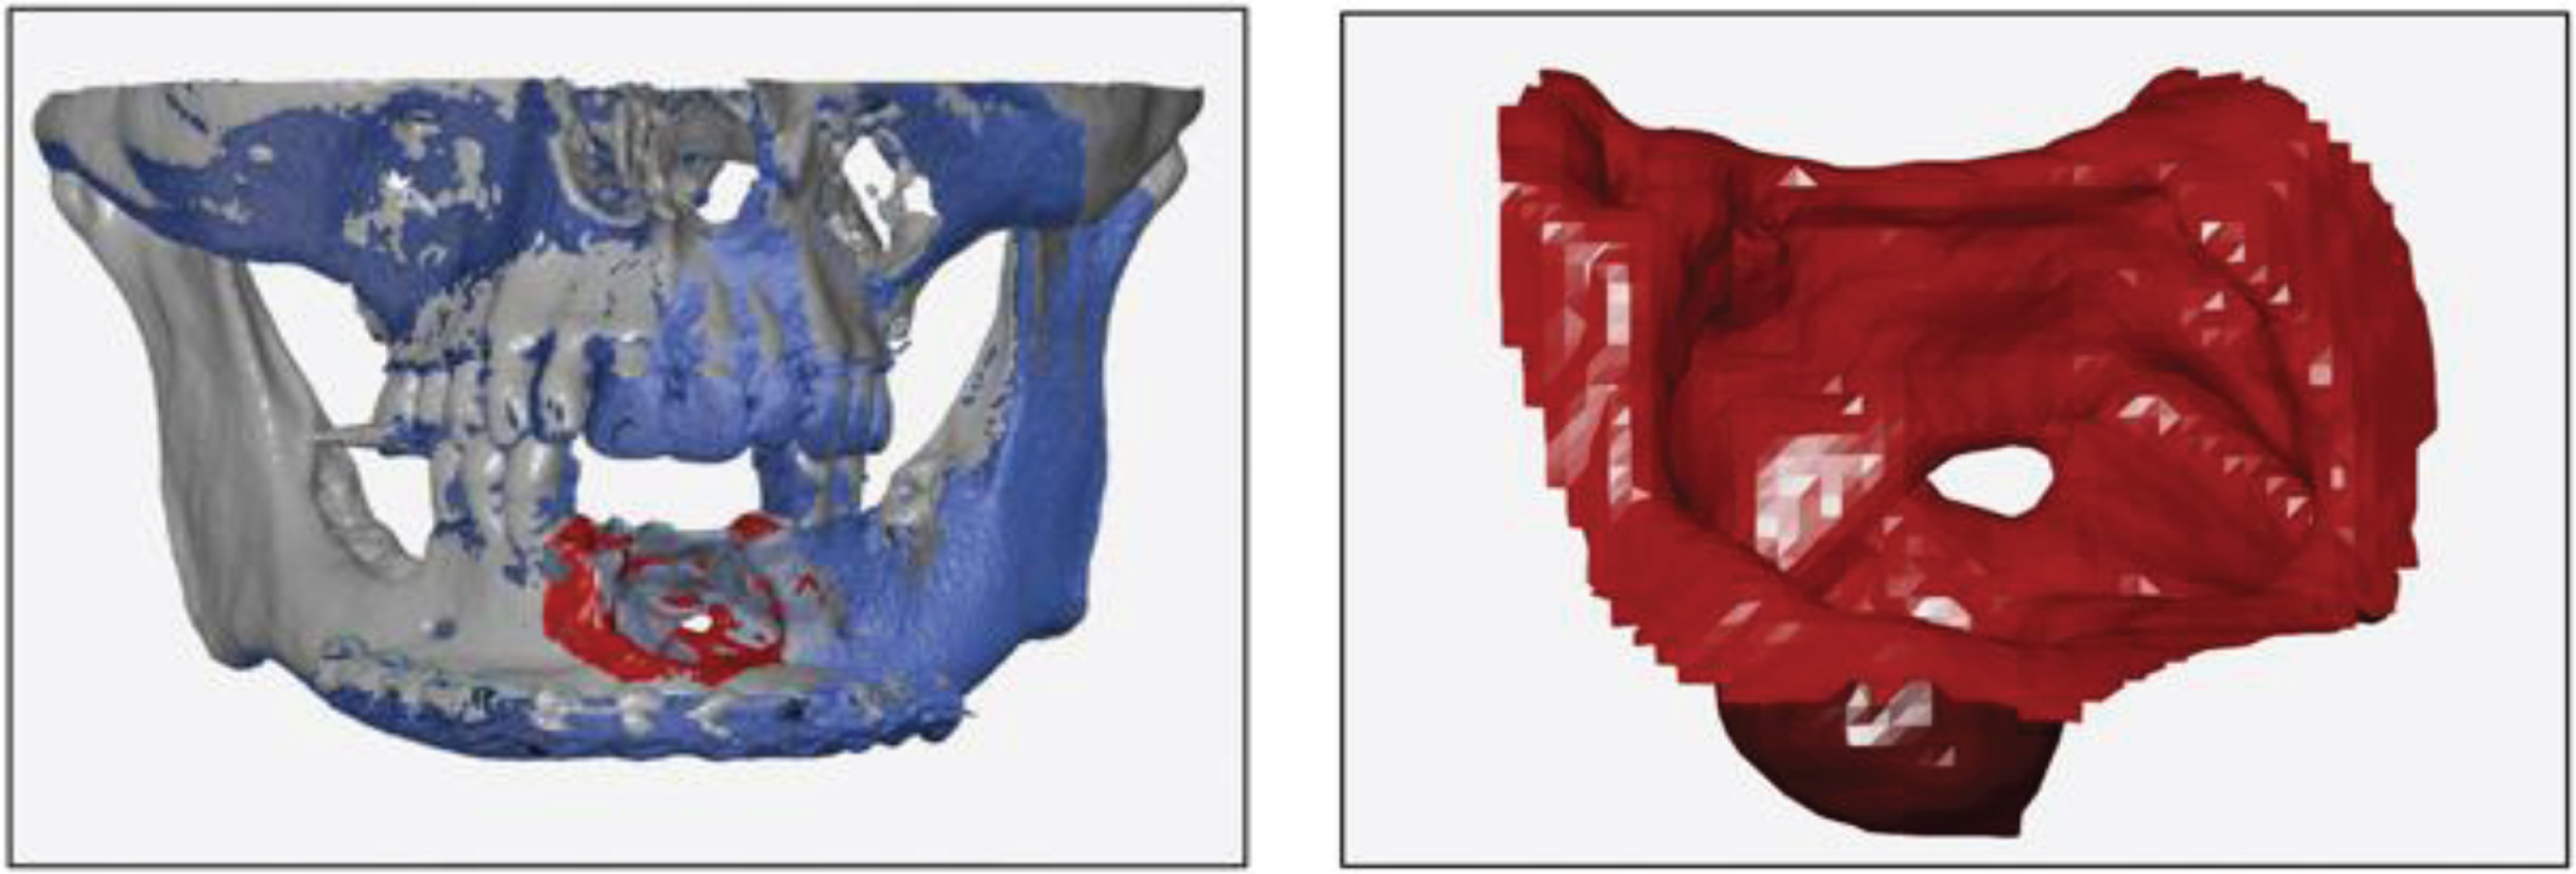
Showing the local best fit selection via the matched follow-up scans and the selected ROI.
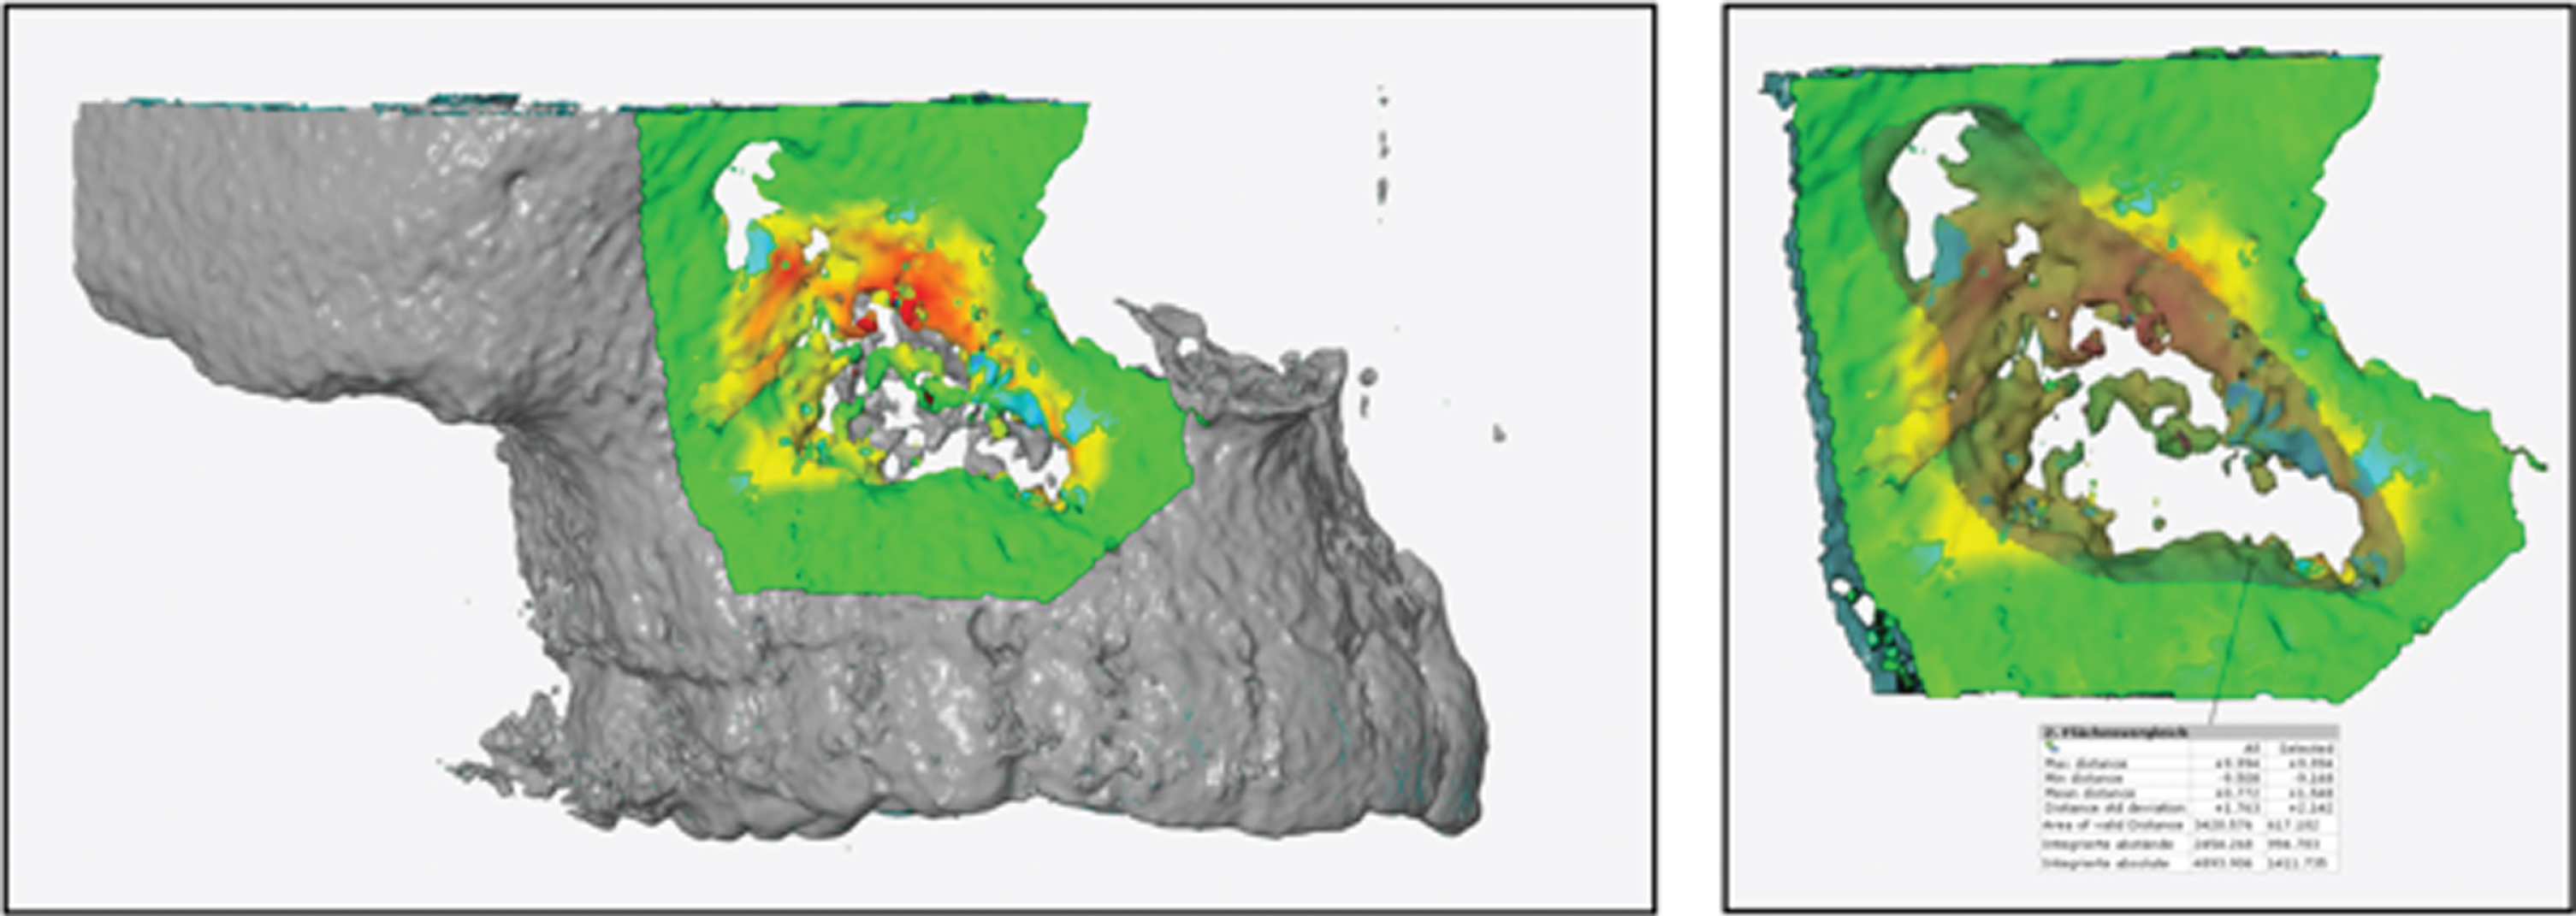
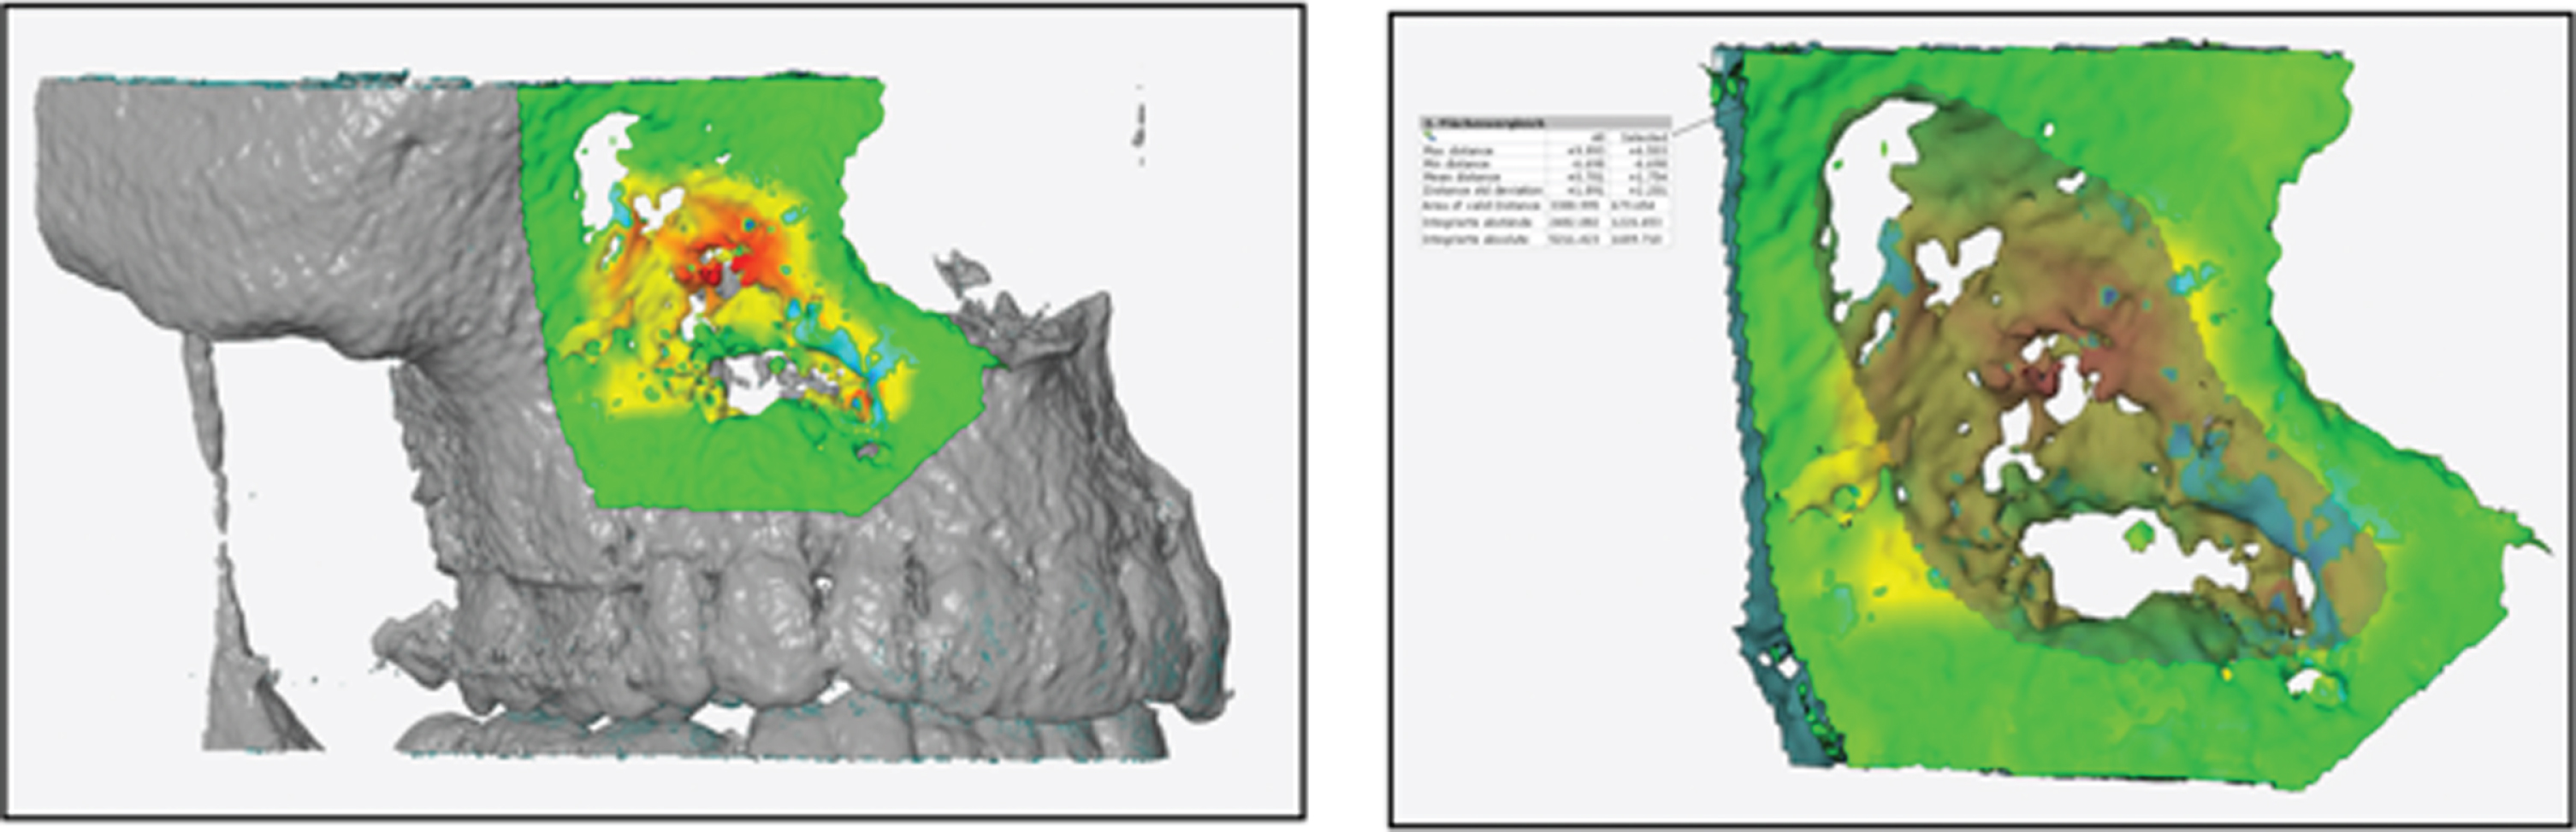
After defining the ROI, the area must be selected again in order to generate the network comparison, which provides information about the volume development of the defect. Using a scale in mm3, decreases or increases in volume were determined within the defect and compared at different postoperative times (Fig. 6).

Showing the matching of 3D images after 5 months (left: initial image; right: follow-up) and the coloured ROI with a mm3 scale sideways.
To determine the volume development in the defect (and not only the ROI), the remaining bone walls must be selected manually of the examiner before evaluation. Then the determination with correspondingly listed values (Table 1) is carried out by mouse click. The full process is semi-automated. Figures 7–10 show additional illustration with a filled (autologous bone from the iliac crest) defect in the right maxilla.
Showing the determined parameters within the defect by mouse click

Showing the initial postoperative defect with the polygon 3D reconstruction (after cystectomy and filling with autologous bone from the iliac crest in the right maxilla) with a determined total volume of 1453,219 mm3.

Showing the ROI and determined volume increase of 206,445 mm3 (with a 2-month follow-up).
Showing the ROI and determined volume increase of 994,783 mm3 (with a 14-month follow-up).
Showing the ROI and determined volume increase of 1226,654 mm3 (with a 25-month follow-up) from the initial defect volume of 1453,219 mm3.
Statistical analysis was performed using the statistical programming language R V3.6.1 (R Core Team (2019). R: A language and environment for statistical computing. R Foundation forStatistical Computing, Vienna, Austria). Associations between residual defects and several factors were examined using a mixed model with the square root transformed percentage of residual defects as dependent variable and time, wall thickness, localization (maxilla vs. mandible) and groups (filling vs. non-filling) as independent variables. After square root transformation of the percentage of rest defect, residuals of the model were normally distributed (Shapiro test: p = 0.302). Fisher’s exact test and the exact conditional test were used to examine the distribution of gender of patients in different groups. P values <0.05 were considered statistically significant.
Results
Patient cohort
The image data of 26 patients including five women and 21 men according to inclusion criteria (complete follow-up 3D imaging and no partial or total resection of the jaws) were retrospectively collected and used in this study. These patients were treated in our hospital from 2012 to 2017. In these 26 patients, a total of 30 defects emerged after cystectomy. One group (15 defects) received primary enucleation and filling with autologous iliac crest, the other group (15 defects) received non-filling after primary enucleation.
Primary outcome
The maximum postoperative volume was 12736.06 mm3 for the patients with filling restoration of the defect and 7153.87 mm3 for the patients with only enucleated defects. On average, the defect size was 5436.07 mm3 for the filled defects and 3358.26 mm3 for the non-filled defects as illustrated in Table 2. As seen in Table 3 the average defect size was 3020.790 mm3 for non- filled defects (p < 0.001). According to the model, the residual defect decreases by 55.836 mm3 with increasing month (+1). The group “with filling” was examined as a factor in comparison to the reference category. However, with p = 0.135 there is no significance, so the form of therapy does not show a decisive influence on the development of the defect. However, they tended to be larger (coefficient of the group: +1650.632 mm3) than defects that were not filled. The variable “months” were examined as a numerical variable with p = 0.002. The residual defect decreases by 55.836 mm3 with increasing month (+1). The group “with filling” was examined as a factor in comparison to the reference category. With p = 0.135, however, there is no significance, so the type of therapy does not show a decisive influence on the development of the defect. It is shown that defects filled with autologous iliac crest did not show a significantly larger or smaller residual defect. Table 4 and Fig. 11 illustrates this in percentage terms.
Defect development (mm3) and standard deviation under consideration of the therapy form
Defect development (mm3) and standard deviation under consideration of the therapy form
Showing the influence variables, the estimated coefficients, the corresponding 95% confidence interval and the corresponding p-value. The intercept describes the mean value of the residual defect for the reference category; in the case this corresponds to defects that were not augmented after cystectomy (mm3)
Defect development (%) and standard deviation under consideration of the therapy form, according to figure 6
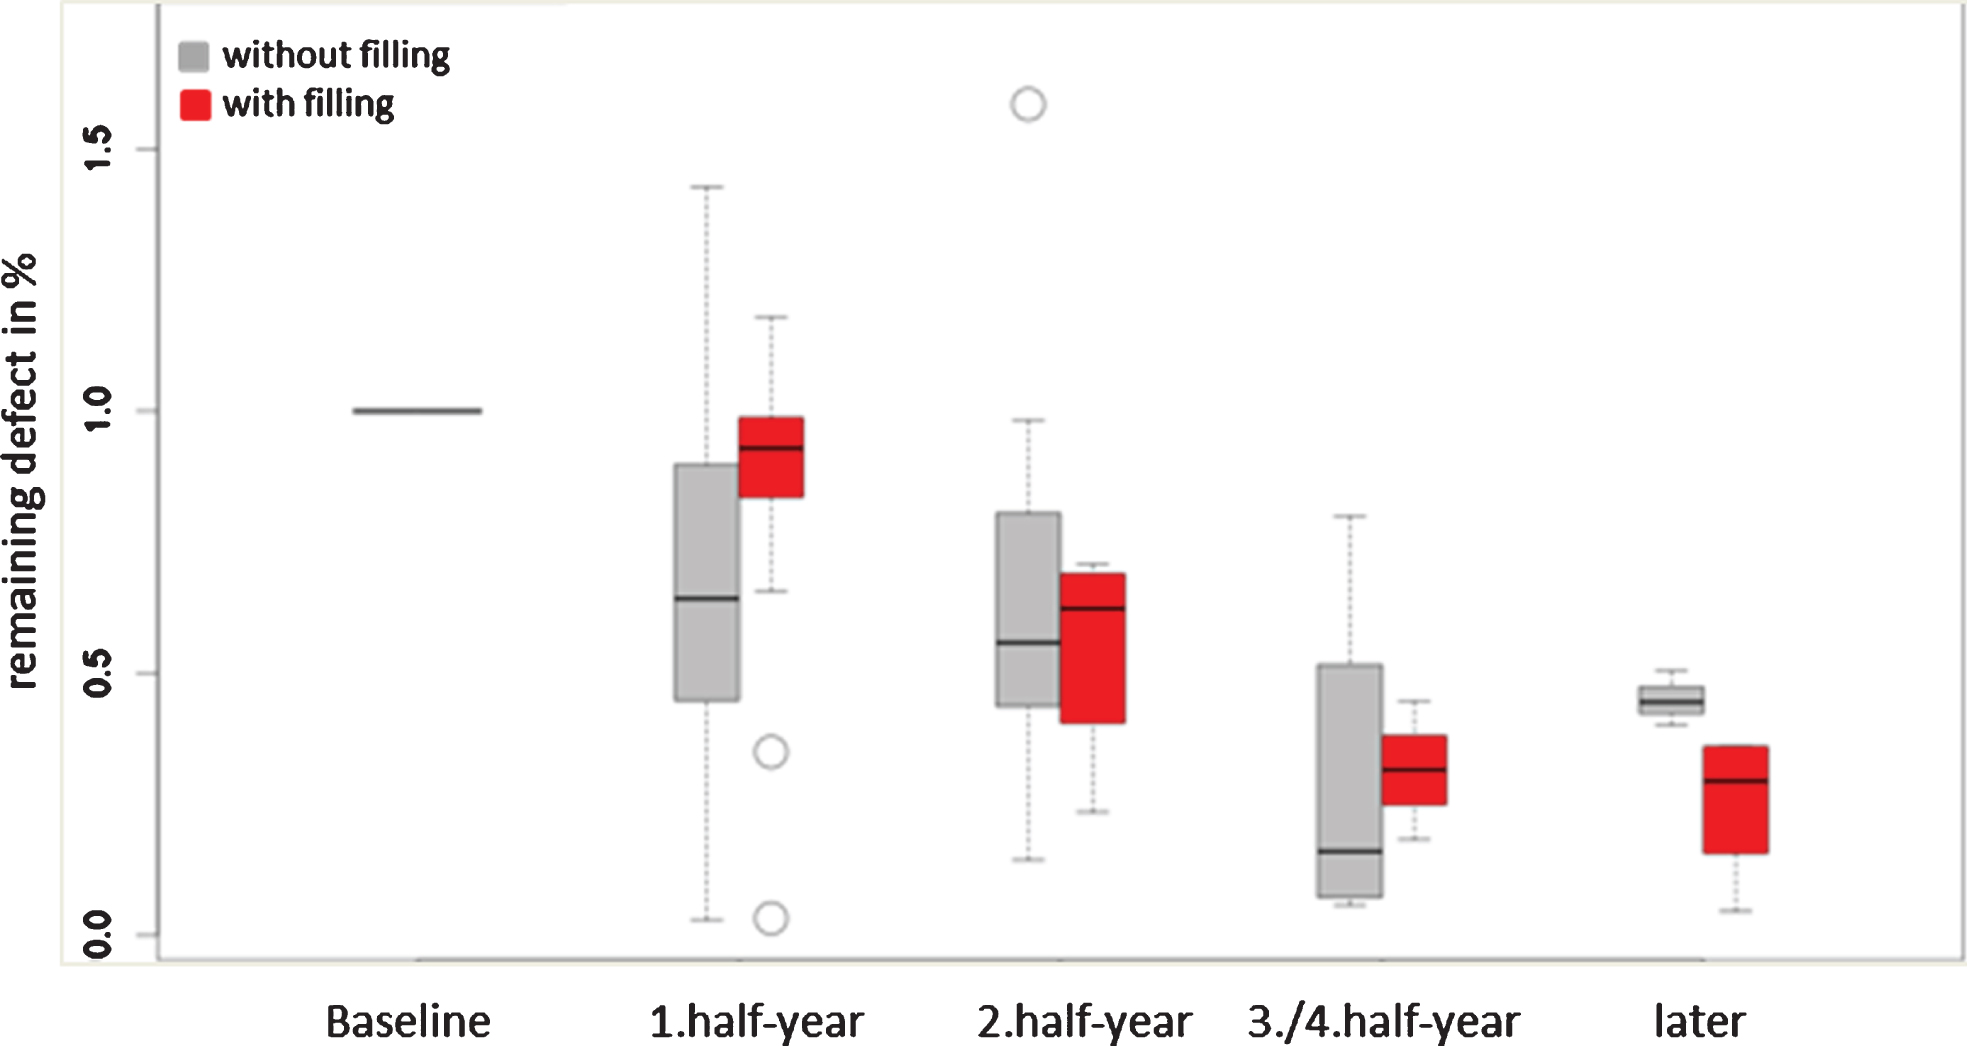
Showing the decrease (%) of the defect volume during the follow-up observation without no significance between the both groups (filling vs. no filling; p = 0.505).
Location (mandible, maxilla)
The defect growth showed no significant difference with regard to the location (maxilla or mandible), as illustrated in Fig. 12. Only the month/time factor had a significant influence; in fact, the defect size decreased over time. Defects that were only enucleated and not filled showed an increase in the residual defect size at 1.5 and 2 years postoperatively, but the differences were not significant (Table 5). The intercept describes defects in the maxilla that were not filled after the cystectomy. “Months” was examined as a numerical variable and shows a significance with p = 0.002. According to the model, the residual defect decreases by 55.833mm3 with increasing month (+1). The localization “mandible” was examined as a factor in comparison to the reference category (maxilla). However, with p = 0.187 there is no significance, so the localization does not show a decisive influence on the development of the defect.
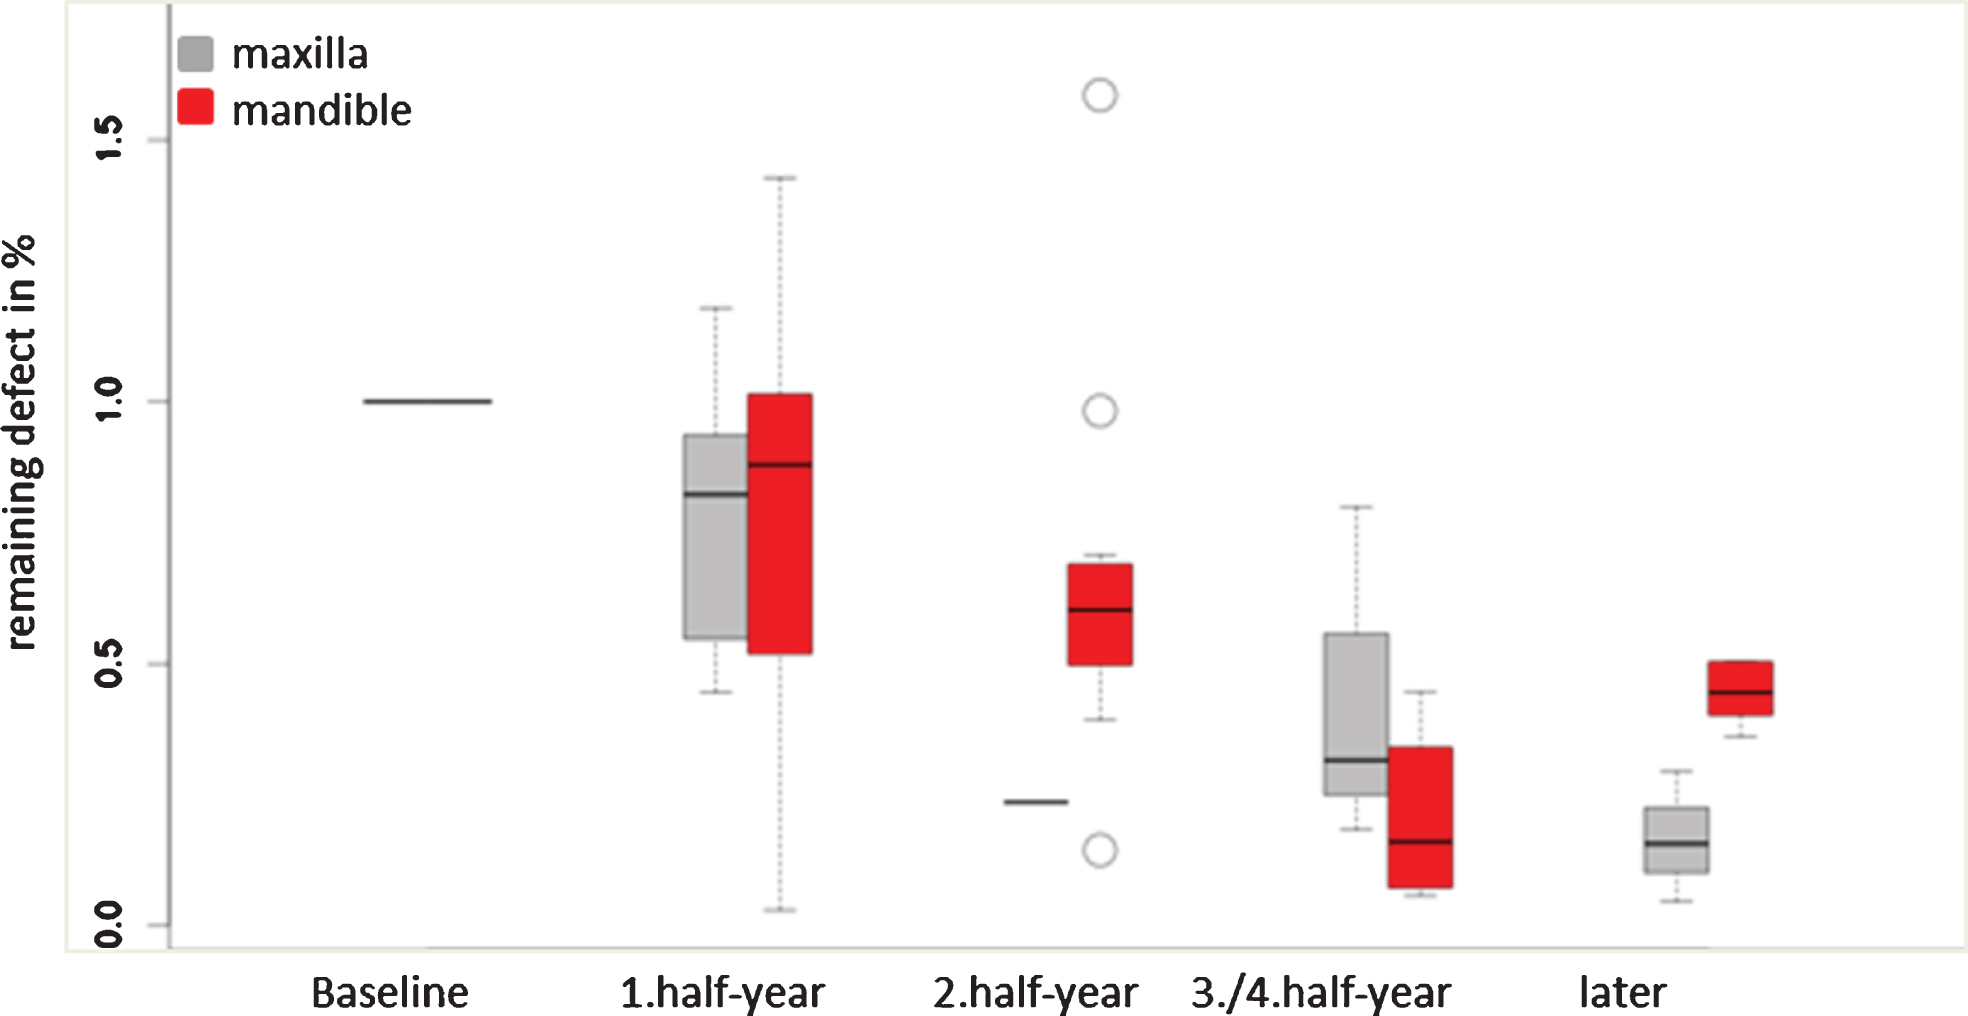
Showing the decrease (%) of the defect volume during the follow-up observation with no significance between maxilla and mandible (p = 0.187).
Showing the influence variables, the estimated coefficients, the corresponding 95% confidence interval and the corresponding p-value. The intercept describes the mean value of the residual defect for the reference category; in the case this corresponds to mandible and maxilla (mm3)
The results showing that the defect growth is dependent on the remaining bone walls were unexpected. Defects with one remaining wall (of the maximum of 4 walls surrounding the cyst) showed an increase in continuous bone over the period of investigation, and after 1.5 and 2 years, the residual defect grew even more. Defects with two remaining walls showed a similar trend, whereby the amount of bony regeneration was comparable to that of defects with one wall. Defects with three remaining walls showed an increase in the residual defect size and therefore bone loss compared with defects with 1 and 2 walls at 1.5 and 2 years. Overall, there is no significant difference between the walls, even after the type of therapy was taken into account, as illustrated in Fig. 13 (2 remaining bony walls with p = 0.332, 3 remaining bone walls with p = 0.674).
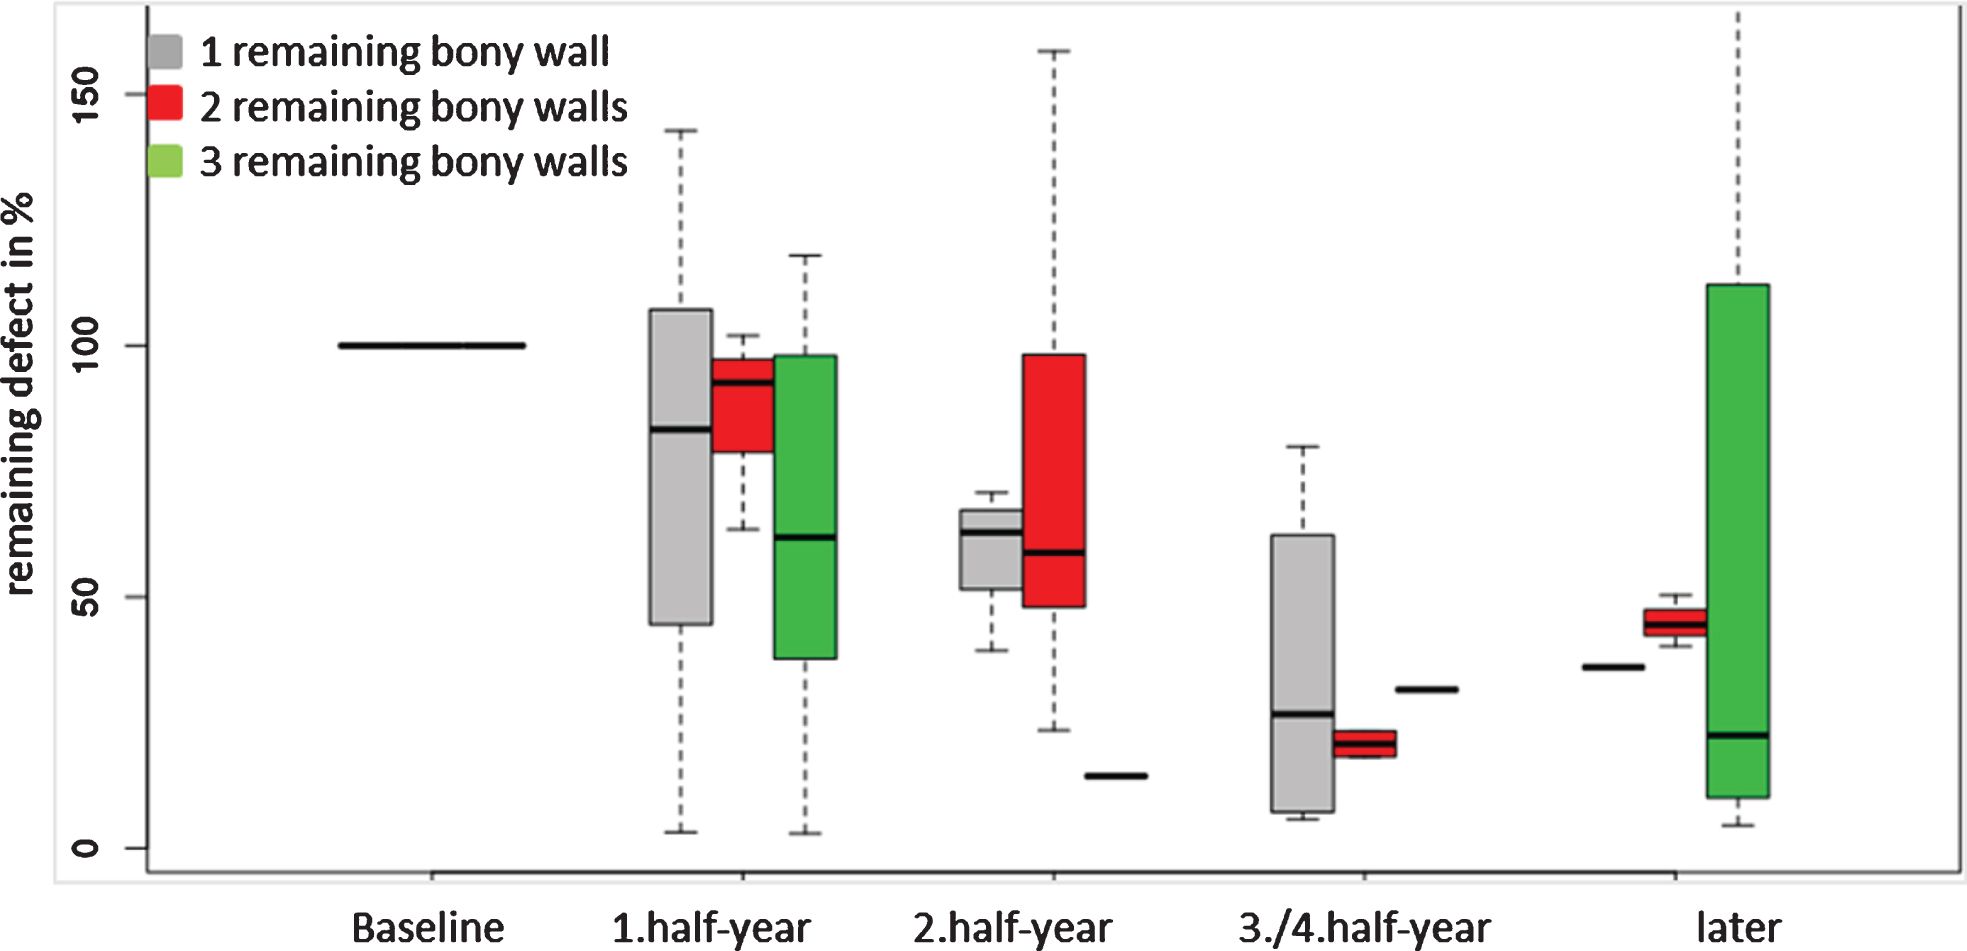
Showing the decrease of the defect volume during the follow-up observation without no significance between the defect configuration (2 remaining bony walls with p = 0.332, 3 remaining bone walls with p = 0.674).
The entity characteristics related to the sex of the patient and whether he or she received filling vs. nonfilling is illustrated in Table 6. There were nine keratocysts, seven radicular cysts and 14 dentigerous cysts. The average age was between 16 and 80 years. The majority of the defects were in the lower jaw (73%). Twenty-one (81%) of the treated patients were male. The minimum follow-up period was two months, the maximum was 48 months, and the average was 12 months.
Showing the entity of cysts in relation to sex and both groups (filling and non-filling; Fisher’s exact test: p = 0.141) and also remaining bone walls and localization (exact conditional test: p = 0.323)
Showing the entity of cysts in relation to sex and both groups (filling and non-filling; Fisher’s exact test: p = 0.141) and also remaining bone walls and localization (exact conditional test: p = 0.323)
The surgical approach for treating odontogenic cysts is based on two possibilities. While decompression should first reduce the volume of the cyst and thus prevent the cyst from invading anatomical neighboring structures, primary cystectomy is based on the immediate removal of the cyst. The resulting cavity can be left or filled with bone (autologous or bone substitute material). Regardless of the surgical procedure and the material in case of filling, bony regeneration of the defect is crucial. A systematic review from 2018 [15] addressed this exact issue. The included studies were, however, very heterogeneous regarding the methodology of the analysis of bony defect regeneration. Some of the studies used densitometry with panoramic tomography and software programs for the evaluation. However, these were very different, and no standardized procedure was found. In addition, densitometry only allows the defect to be assessed on the basis of the surrounding bone, which makes it impossible to adequately assess how the defect actually heals, especially when the defect is filled. Compared to two-dimensional imaging, 3D evaluations can assess the defect more precisely since the actual size can be determined more precisely. However, this type of evaluation strongly depends on the quality of the images used, so some patients with images that could not be used due to artifact inclination and distortions caused by movement had to be excluded. For this reason, the evaluations of CBCT images in this study were better than those of CT images.
Moreover, Saati et al. published a study comparing the geometric accuracy of 3D reconstructions from multislice CT images (MSCT) with those from CBCT images. The accuracy of the reconstruction was slightly better with CBCT scans than with MSCT’s and showed better image quality [16].
Two criteria are important for assessing defect regeneration. The size of the defect and the remaining intact bone walls after cystectomy, i.e., the defect configuration. Regarding the defect size, there have been studies that have shown that defects larger than a CSD do not heal completely and on their own, regardless of how long they are observed [17–19]. Schlegel et al. showed that unfilled monocortical defects with a size of 10×10 mm showed incomplete bone healing after 52 weeks. Those filled with autologous bone showed complete bony healing after 26 weeks [12].
While previous studies did not provide any information about the size of the defects, in this study we determined the exact defect size or the defect volume as a baseline value according to the first postoperative image and a software program. This method ensured that the following postoperative images were always compared with the same initial volume and that a certain standardized procedure was maintained. The average defect size was 5436.07 mm3 in the filled defects and 3358.26 mm3 in the nonfilled defects. Therefore, the defects in both groups were larger than a CSD. Our follow-up average time was also 12 months, and 48 months was the maximum. According to the literature, complete healing should not be expected for unfilled defects during this period. We did not observe any significant differences in the defect volume over time during the healing process between the two groups. However, our observations are in agreement with the previous observations that showed that defects that are not filled have an enlarged bony defect after 12–24 months. Additional observations occurring after 24 months also showed no significant decrease in the defect size in the filled group. However, both groups otherwise showed a reduction in the defect volume over the observation period and in comparison with that of the initial defect volume.
Another influencing factor is defect configuration. It is assumed that defect regeneration is dependent on the number of intact remaining bony walls after cystectomy. Sufficient stabilization of the blood clot in a defect with preserved bony walls and bone regeneration from the adjacent bony sites lead to partial or total defect consolidation. According to the literature, if the lingual or buccal bone lamella is missing or removed during surgery, the defect cannot heal completely, and fibrous scar tissue forms [7, 9]. Of course, it is unclear whether the surgery is truly necessary if continuity can still be maintained and the jaw remains functional. To the best of our knowledge, however, this issue has not yet been further investigated, especially with 3D evaluations. We investigated healing according to the number of remaining bone walls. According to the literature, defects with more intact bone walls after cystectomy should show better bone healing with less scarring. We found no significant differences between defects with 1 to 3 intact bony residual walls. Even in the 3-walled defects, at 1.5 and 2 years, an increase in the residual defect size was observed compared with that of 1- or 2-walled defects. We did not observe a significantly faster or more predictable bone healing process in any of the three groups.
According to a systematic review in 2018 [15], after a mean observation period of 12 months, sufficient bony regeneration occurs, and the authors of the studies concluded that defect filling is not necessary. The size of the defect was, however, not investigated preoperatively or postoperatively during the follow-up period, and the histological appearance of healed tissues was not investigated [9–11, 20–22]. After cystectomy, spontaneous bone healing can occur in defects, provided that bony walls and the periosteum are preserved. In these cases, the size of the defect as well as the type of the cyst do not seem to be important [15].
However, it must be contemplated that the methodological approaches of measuring defect consolidation after treatment may impact the results. The systematic review concluded that measuring bony regeneration by 2D X-rays or densitometry might lead to an inaccurate assessment of bone regeneration [15].
In recent years, more 3D approaches have been used to assess the defect size or volume changes in jaw cysts. A recent study [23] analyzed the effect of surgical decompression prior to second-stage enucleation of cysts in the mandible (which were >3 cm in diameter according to 2D X-ray images). For this purpose, the authors examined the change in volume from a preoperative CT scan to a 6-month postoperative CT scan using 3D software. Using an adapted marching cube algorithm, a 3D model was generated with software to determine the initial volume. The volume decreased significantly during the six-month follow-up period.
Another study [24] also investigated the effect of decompression using 3D analysis with another software program. Here, follow-up CT images after 3 and 12 months were used for preoperative volume measurements. The defect size was first measured in 2D images, and then a 3D model generated by superimposition was used to determine the volume. The decompression process showed a reduction in volume in this study. Additionally, Shudou et al. [25] investigated the volume decrease by using 3D analyses in KCOT cases.
Although these studies have shown that 3D analyses can be used to assess defect volume loss and thus better determine the time for the second operation compared with previous methods in terms of decompression therapy for jaw cysts, they do not provide any information about the (bony) healing process after the second operation. Therefore, there is currently no information about the remaining bone walls or actual defect size after enucleation, which we have methodically addressed through our 3D analysis. To the best of our knowledge, no research group has yet used 3D analyses to evaluate defects after cystectomy, which is why we have tried to establish a methodology for this approach.
No treatment (either filling or non-filling) leads to a predictable bony healing after cystectomy. The current literature not considering the size of the defect or comparing different defect sizes treated with different treatment approaches in terms of 2D evaluation can be seen critically.
There are a few shortcomings of this study that need to be mentioned and critically discussed. First and foremost, the retrospective evaluation of the parameters should be mentioned. As a result, the size of the groups and the time periods of 3D scans varied greatly within the groups. The errors resulting from the non-uniform time periods were taken into account in the evaluation and critically assessed in the discussion. Moreover, it should be mentioned that the statistical power within the small dataset is reduced. However, the hypothesis, that over time (especially 1.5 and 2 years postoperatively) the non-filled defects showed an increase in defect volume could be substantiated significantly by means of the methodology.
Conclusion
With the methodology reported here, the two most important factors, namely, defect size and defect configuration, can be included in the evaluation of bone regeneration. In addition, a standardized procedure can be ensured by superimposing all images and using the same ROI. In the future, this simple and inexpensive (free downloads of the software are possible) method can also be used to investigate other aspects related to different filling materials for defects that occur after cystectomy of odontogenic cysts. For this purpose, more comparative studies with larger patient cohorts and comparable 3D imaging procedures are required.
Footnotes
Acknowledgments
BK contributed to data acquisition, data analysis and interpretation to obtain the doctoral degree (Dr. Med. Dent.) at the Friedrich-Alexander- University Erlangen-Nuremberg. The authors declare no conflict of interest or any external funding sources.