
Abstract
OBJECTIVE:
To investigate the value of texture analysis in magnetic resonance images for the evaluation of Gleason scores (GS) of prostate cancer.
METHODS:
Sixty-six prostate cancer patients are retrospective enrolled, which are divided into five groups namely, GS = 6, 3 + 4, 4 + 3, 8 and 9–10 according to postoperative pathological results. Extraction and analysis of texture features in T2-weighted MR imaging defined tumor region based on pathological specimen after operation are performed by texture software OmniKinetics. The values of texture are analyzed by single factor analysis of variance (ANOVA), and Spearman correlation analysis is used to study the correlation between the value of texture and Gleason classification. Receiver operating characteristic (ROC) curve is then used to assess the ability of applying texture parameters to predict Gleason score of prostate cancer.
RESULTS:
Entropy value increases and energy value decreases as the elevation of Gleason score, both with statistical difference among five groups (F = 10.826, F = 2.796, P < 0.05). Energy value of group GS = 6 is significantly higher than that of groups GS = 8 and 9–10 (P < 0.005), which is similar between three groups (GS = 3 + 4, 8 and 9–10). The entropy and energy values correlate with GS (r = 0.767, r = –0.692, P < 0.05). Areas under ROC curves (AUC) of combination of entropy and energy are greater than that of using energy alone between groups GS = 6 and ≥7. Analogously, AUC of combination of entropy and energy are significantly higher than that of using entropy alone between groups GS≤3 + 4 and ≥4 + 3, as well as between groups GS≤4 + 3 and ≥8.
CONCLUSION:
Texture analysis on T2-weighted images of prostate cancer can evaluate Gleason score, especially using the combination of entropy and energy rendering better diagnostic efficiency.
Introduction
Prostate cancer (PCa) is one of the most common malignancies in middle-aged and elderly men. In Europe and the United States, it is the second most common cause of cancer-related mortality in men, with increasing morbidity in recent years [1]. The selection of the clinical treatment and prognosis of the PCa are highly depended on tumor invasion degree [2, 3]. Therefore, the assessment on the invasiveness of PCa is greatly significant for clinical decision.
At present, the Gleason grading system, as a widely-accepted method on the invasiveness assessment of PCa, has become one of the important reference indexes for clinical strategy and prognosis evaluation [4, 5]. The Gleason score mainly uses the ADC value in diffusion-weighted imaging of magnetic resonance to evaluate. The tumor ADC value is a more accurate high-risk predictor for evaluating the Gleason score of the biopsy to be performed in radical prostatectomy, and many studies have shown Correlation between ADC value and Gleason score. However, few studies have evaluated the difference in ADC values between (GS = 3 + 4 vs GS = 4 + 3). Gleason grading is generally based on the transrectal ultrasound-guided biopsies after prostatectomy, which however may underestimate the invasiveness of PCa [6, 7] and cause some complications as an invasive test [8]. Therefore, it is necessary to find a noninvasive method to assess the invasiveness of the PCa.
In recent years, magnetic resonance image (MRI) has become the best method for PCa exploration and localization [8, 9], whose diagnosis and assessment has improved significantly on account of the introduction of multiparametric-MRI (mp-MRI) [10, 11]. Despite the improvements offered by mp-MRI incorporation, the separation of same Gleason score (GS = 3 + 4 vs GS = 4 + 3) using conventional MRI parameters tends to be less effective [12]. These two PCa patterns have significantly different prognoses irrespective of having the same GS score [13]. Hence, misclassification could have serious clinical consequences. Accurate classification of GS patterns thus requires objective, sensitive, and reproducible quantitative image analysis methods.
At present, a new image evaluation technique called texture analysis has been used in tumor imaging, which extracts the features invisible for human eyes from the image with the mathematical method. The quantification of these features may reflect the micro-heterogeneity of these medical images [14]. Some recent studies have shown that the texture analysis can be used for lesion detection, classification, treatment efficacy evaluation of many types of cancers (i.e., rectal, breast, colorectal and gastric cancers [15–18]). In addition, T2-weighted imaging (T2WI) provides high signal-to-noise ratio, spatial resolution and soft tissue contrast images of the prostate structures, which was important sequence in mp-MRI [19, 20]. Therefore, with the pathological Gleason grading as the golden criteria of the radical resection of PCa, we in this study used the T2WI derived texture analysis to determine the identification efficiency of each Gleason grade of the PCa.
Materials and methods
General information
The Hospital Ethics Committee approved our prospective study and all patients signed the informed consent. A total of 74 prostate cancer patients undergoing radical prostatectomy in our hospital from June 2018 to July 2019 were included in this study, with the inclusion criteria: the patient was diagnosed as PCa through preoperative prostate biopsy, without preoperative endocrine therapy or radiotherapy, and the patient’s hepatorenal function, blood routine examination and cardiopulmonary function were normal, without surgical contraindications. This study excluded eight patients for the following reasons: three patients failed to complete MRI examination; two patients had magnetic resonance imaging artifacts; postoperative pathological specimens of one patient was found deficient, and two patients’ cancer focus of the pathological specimens did not match clearly with the imaging location. In order to avoid the possibility of bleeding and inflammation in the prostate after biopsy, the final MRI evaluation and analysis will be affected, and the interference factors of the comprehensive evaluation of the prostate surgery plan will be excluded, At least six weeks after the last biopsy all the patients were scheduled to undergo pre-operative MRI, followed by radical prostatectomy within 10 weeks after the MRI.
Pathological specimen preparation
The pathological specimen was fixed with 4% formalin after radical prostatectomy, evenly coated with ink in the Pathology Department, and the whole prostate tissues were cut from the apex layer-by-layer perpendicular to the urethra, with the layer thickness of 3mm. We cut the specimen in appropriate sizes, taking the urethra as the center for each section in the specimen box for subsequent treatment. The slices were embedded in paraffin for fixing and stained with HE. All the slices were read by senior pathologist (with more than 10 years of pathological experience of prostate cancer) for diagnosis and Gleason grading as well as location description of prostate cancer. For each patient, the histopathological slide with the index tumor was selected, for which cancer focus with the GS was defined histo-pathologically with clinical significance (volume ≥0.5 cm3) as shown in Fig. 1.

Histopathological slide is spatially matched to T2-weighted image slice based on anatomical landmarks.
We performed MRI conventional sequence, DWI sequence and LAVA dynamic enhancement scanning by 3.0TMRI scanner (GE Discovery MR 750). The axial view, sagittal view and coronal view of T2WI, which were acquired with a propeller sequence (TR/TE 5629/86 ms; Flip Angle: 90 degrees FOV: 320×320; Slice thickness: 3 mm; Reconstruction Interval: 0.3 mm; Signal-to-noise ratio: 1; In order to avoid too long scan time due to too many MRI patients, we set the interslice gap to 0.5 mm; NEX: 2.5; Echo Train Length: 28), and axial view of T1WI of conventional sequence were used with FSE sequence. DWI (b = 800 s/mm2, b = 0) scan was used with EPI echo sequence. Ultimately, we carried out the scanning of LAVA dynamic contrast enhancement sequence, of which the scan range included the entire prostate and seminal vesicles.
Image texture extraction
The MRI exams was read by two radiologists A and B (with 10 years and 5 years of experience in the MRI diagnosis of prostate cancer respectively) based on T2WI images with the reference to DWI and enhanced LAVA images. Meanwhile, we took the pathological specimen of the radical prostatectomy as the reference, identified the best corresponding axial T2WI slice with the guidance of anatomical landmarks, and consulted with the pathological experts to select the corresponding tumor site of T2WI for ROI delineation. The ROI placement shall comply with the following principles: (1) Select the center of lesions to place ROI. (2) ROI shall cover suspicious lesions as large as possible. (3) Try to keep away from the junction of the peripheral zone and the central gland, the root of seminal vesicle, hemorrhage or calcification lesions, blood vessels and other areas that may lead to the deviation of measurement. Try to keep away from the urethra when placing ROI in the central gland. Omni-Kineitics software from GE company were applied for the extraction of texture features, which shall automatically calculate the texture parameters within the ROI range, such as skewness, kurtosis, entropy and energy. Entropy, this is a measure of randomness, having its highest value when the elements are all equal. In the case of a checkerboard, the entropy would be low. Energy, this feature returns the sum of squared elements in the GLCM, represents the magnitude of values in an image.
Statistical analysis
All data were statistically analyzed with SPSS20.0 and MedCalc software. Counting data are expressed as percentage, and measurement data are expressed as X (average)±standard deviation (SD). One-way analysis of variance (ANOVA) was used to compare the texture values between the five Gleason scores (GS) groups. Bonferroni method was adopted to check any pairwise comparisons between groups. Statistic difference was confirmed if P value was less than 0.005. The correlation between the texture values of prostate cancer and Gleason grades was analyzed by Spearman method. We constructed the texture combination by logistic regression. We evaluated the Gleason’s validity of each texture and texture combination of the prostate cancer with the receiver operating characteristic curve (ROC curve) and value of residual error, Residual error refers to the difference between the actual observed value and the fitted value. The smaller the residual value, the more reliable the result. In additon, calculated the area under the curve (AUC), and made comparison among groups. Meanwhile, we calculated the sensitivity and specificity, and selected the best threshold according to Youden index.
Results
General condition and postoperatively pathological grading
The average age of the 66 patients included in this study was 67 (48–79 years old). The average value of prostate-specific antigen (PSA) was 43.62 ng/ml (4.31–98.72 ng/ml). A total of 108 regions of interest were selected on the MR T2WI axial view based on the pathology correlation, which were divided into 5 groups according to the latest system of grading groups of the International Society of Urological Pathology (ISUP) in 2014 [21]: GS = 6 scores: 16 regions (15%), GS = 3 + 4 scores: 25 regions (23%), GS = 4 + 3 scores: 27 regions (25%), GS = 8 scores: 21 regions (19%) and GS = 9–10 scores: 19 regions (18%), as shown in Table 1 and Fig. 2.
General characteristics of prostatic cancer patients
General characteristics of prostatic cancer patients

Examples of T2WI images of Gleason score 6, 3 + 4, 4 + 3, 8, 9, and 10 (A–F), respectively, where the white pointed point is the tumor site.
When the Gleason grading increased, the entropy value tended to increase, while the energy tended to decrease, accompanied with statistical differences (F = 10.826, F = 2.796, P < 0.05). The skewness and kurtosis did not increase or decrease significantly, without statistical differences between different groups (F = 1.004, F = 0.84, P > 0.05). The statistical differences (P < 0.005) were evident in each pairwise comparison of energy values between the group with Gleason = 6 and the group with Gleason = 3 + 4, as well as between the group with Gleason = 8 and the group with Gleason = 9–10, as shown in Table 2 and Fig. 3.
Statistical analysis of difference values of texture values between different Gleason scores in prostate cancer
Statistical analysis of difference values of texture values between different Gleason scores in prostate cancer
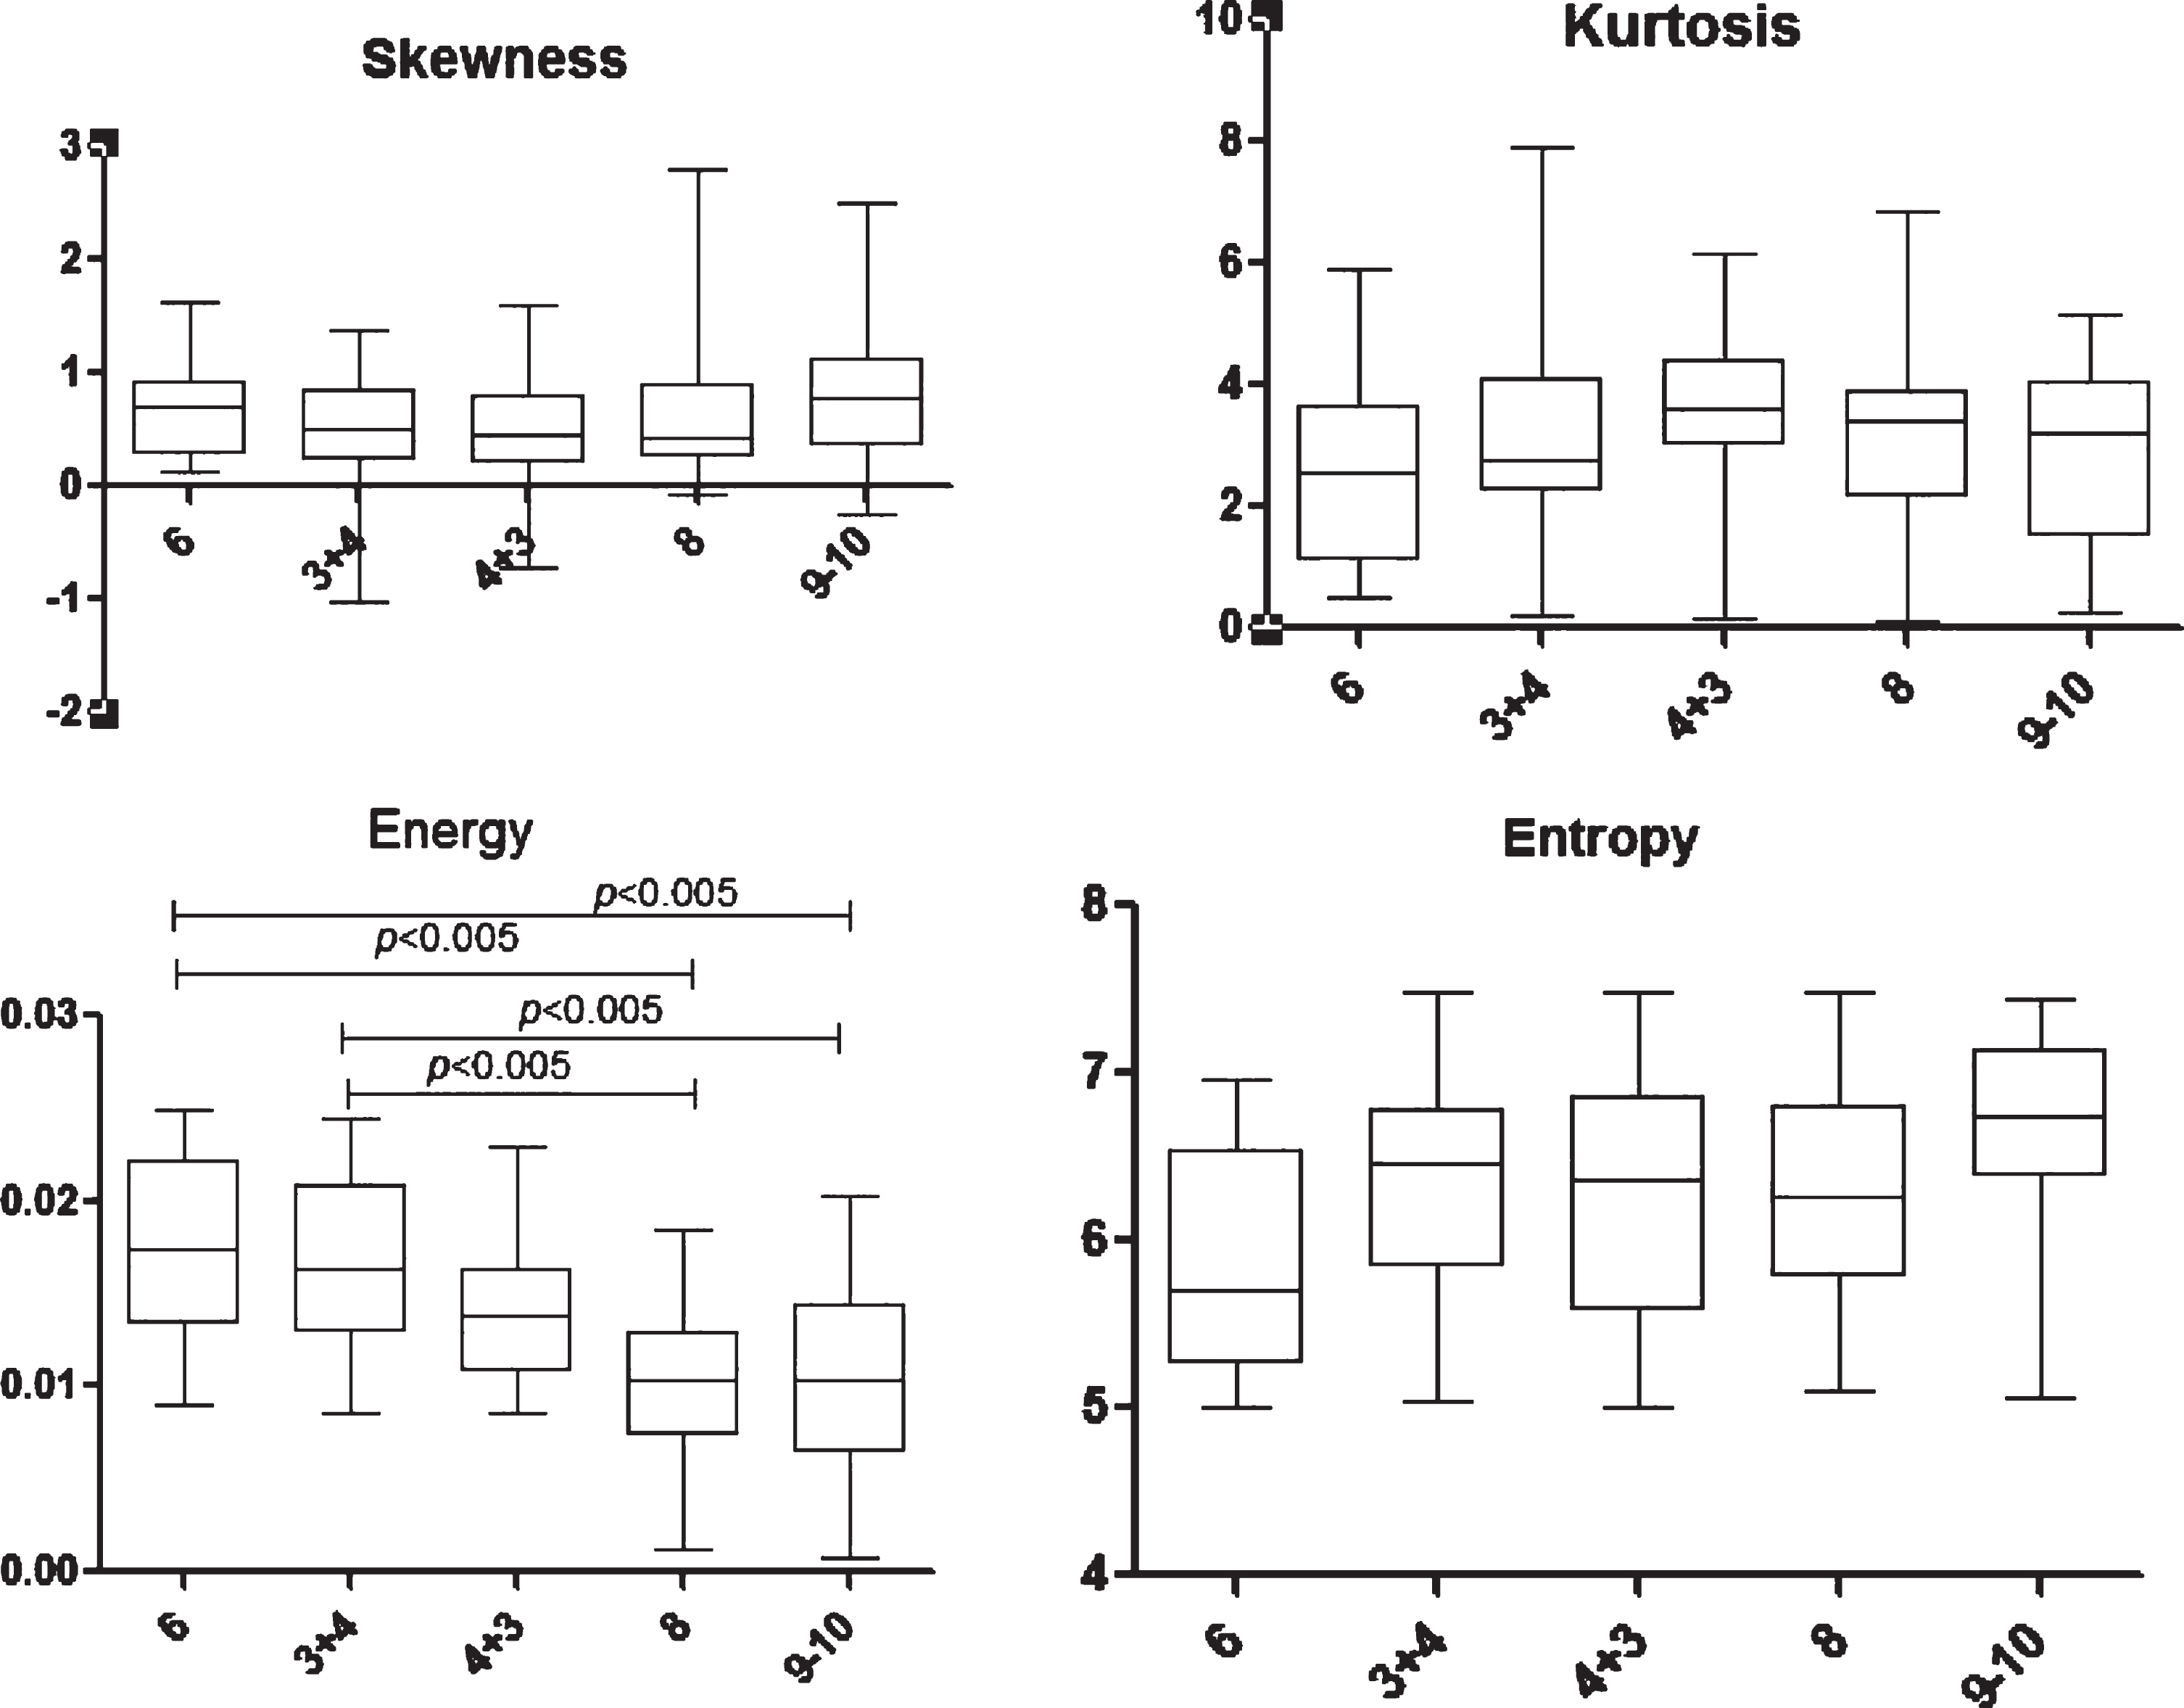
Box diagram of skewness, kurtosis, energy and entropy. The energy value of group Gleason = 6 was significantly higher than that of group Gleason = 8 and group Gleason = 9–10 (P < 0.005), which, was similarly shown between group Gleason = 3 + 4 and group Gleason = 8 and group Gleason = 9–10.There was no significant difference in other texture groups (P > 0.005).
The entropy and energy of prostate cancer area had certain correlations with different Gleason groups (r = 0.767, r = –0.692, P < 0.05), shown as a weakly positive correlation and a moderately negative correlation, respectively. The correlation difference between the skewness and kurtosis of prostate cancer area and different Gleason groups was not statistically significant (r = 0.050, r = –0.405, P > 0.05).
Correlation of each texture parameter value with different Gleason groups
Between Gleason = 6 and Gleason≥7, the AUC of the combination of entropy and energy was higher than that of using energy alone, with a statistical difference (P < 0.05). Between Gleason≤3 + 4 and Gleason≥4 + 3 as well as between Gleason≤4 + 3 and Gleason≥8, the AUC of using energy alone was higher than that of using entropy alone, with a statistical difference (P < 0.05); while the AUC of combination of entropy and energy were higher than that of using entropy alone, with a statistical difference (P < 0.05). Compared with Gleason≤8 and Gleason≥9, the AUC of the combination of entropy and energy was higher than that of using entropy or energy alone, without statistical difference (P > 0.05). Among the residuals of all features and combinations, the combination of entropy and energy is used to distinguish the Gleason≤4 + 3 and Gleason≥8 groups with the smallest residual value (0.40324), indicating the highest prediction performance. As shown in Table 3 and Fig. 4.
Diagnostic significance of texture values analyzed by ROC curve
Diagnostic significance of texture values analyzed by ROC curve
Note: * Showed statistical difference between the AUC of energy and entropy (P < 0.05); # Showed statistical difference between the AUC of energy combined entropy and energy (P < 0.05); & Showed statistical difference between the AUC of energy combined entropy and entropy (P < 0.05).
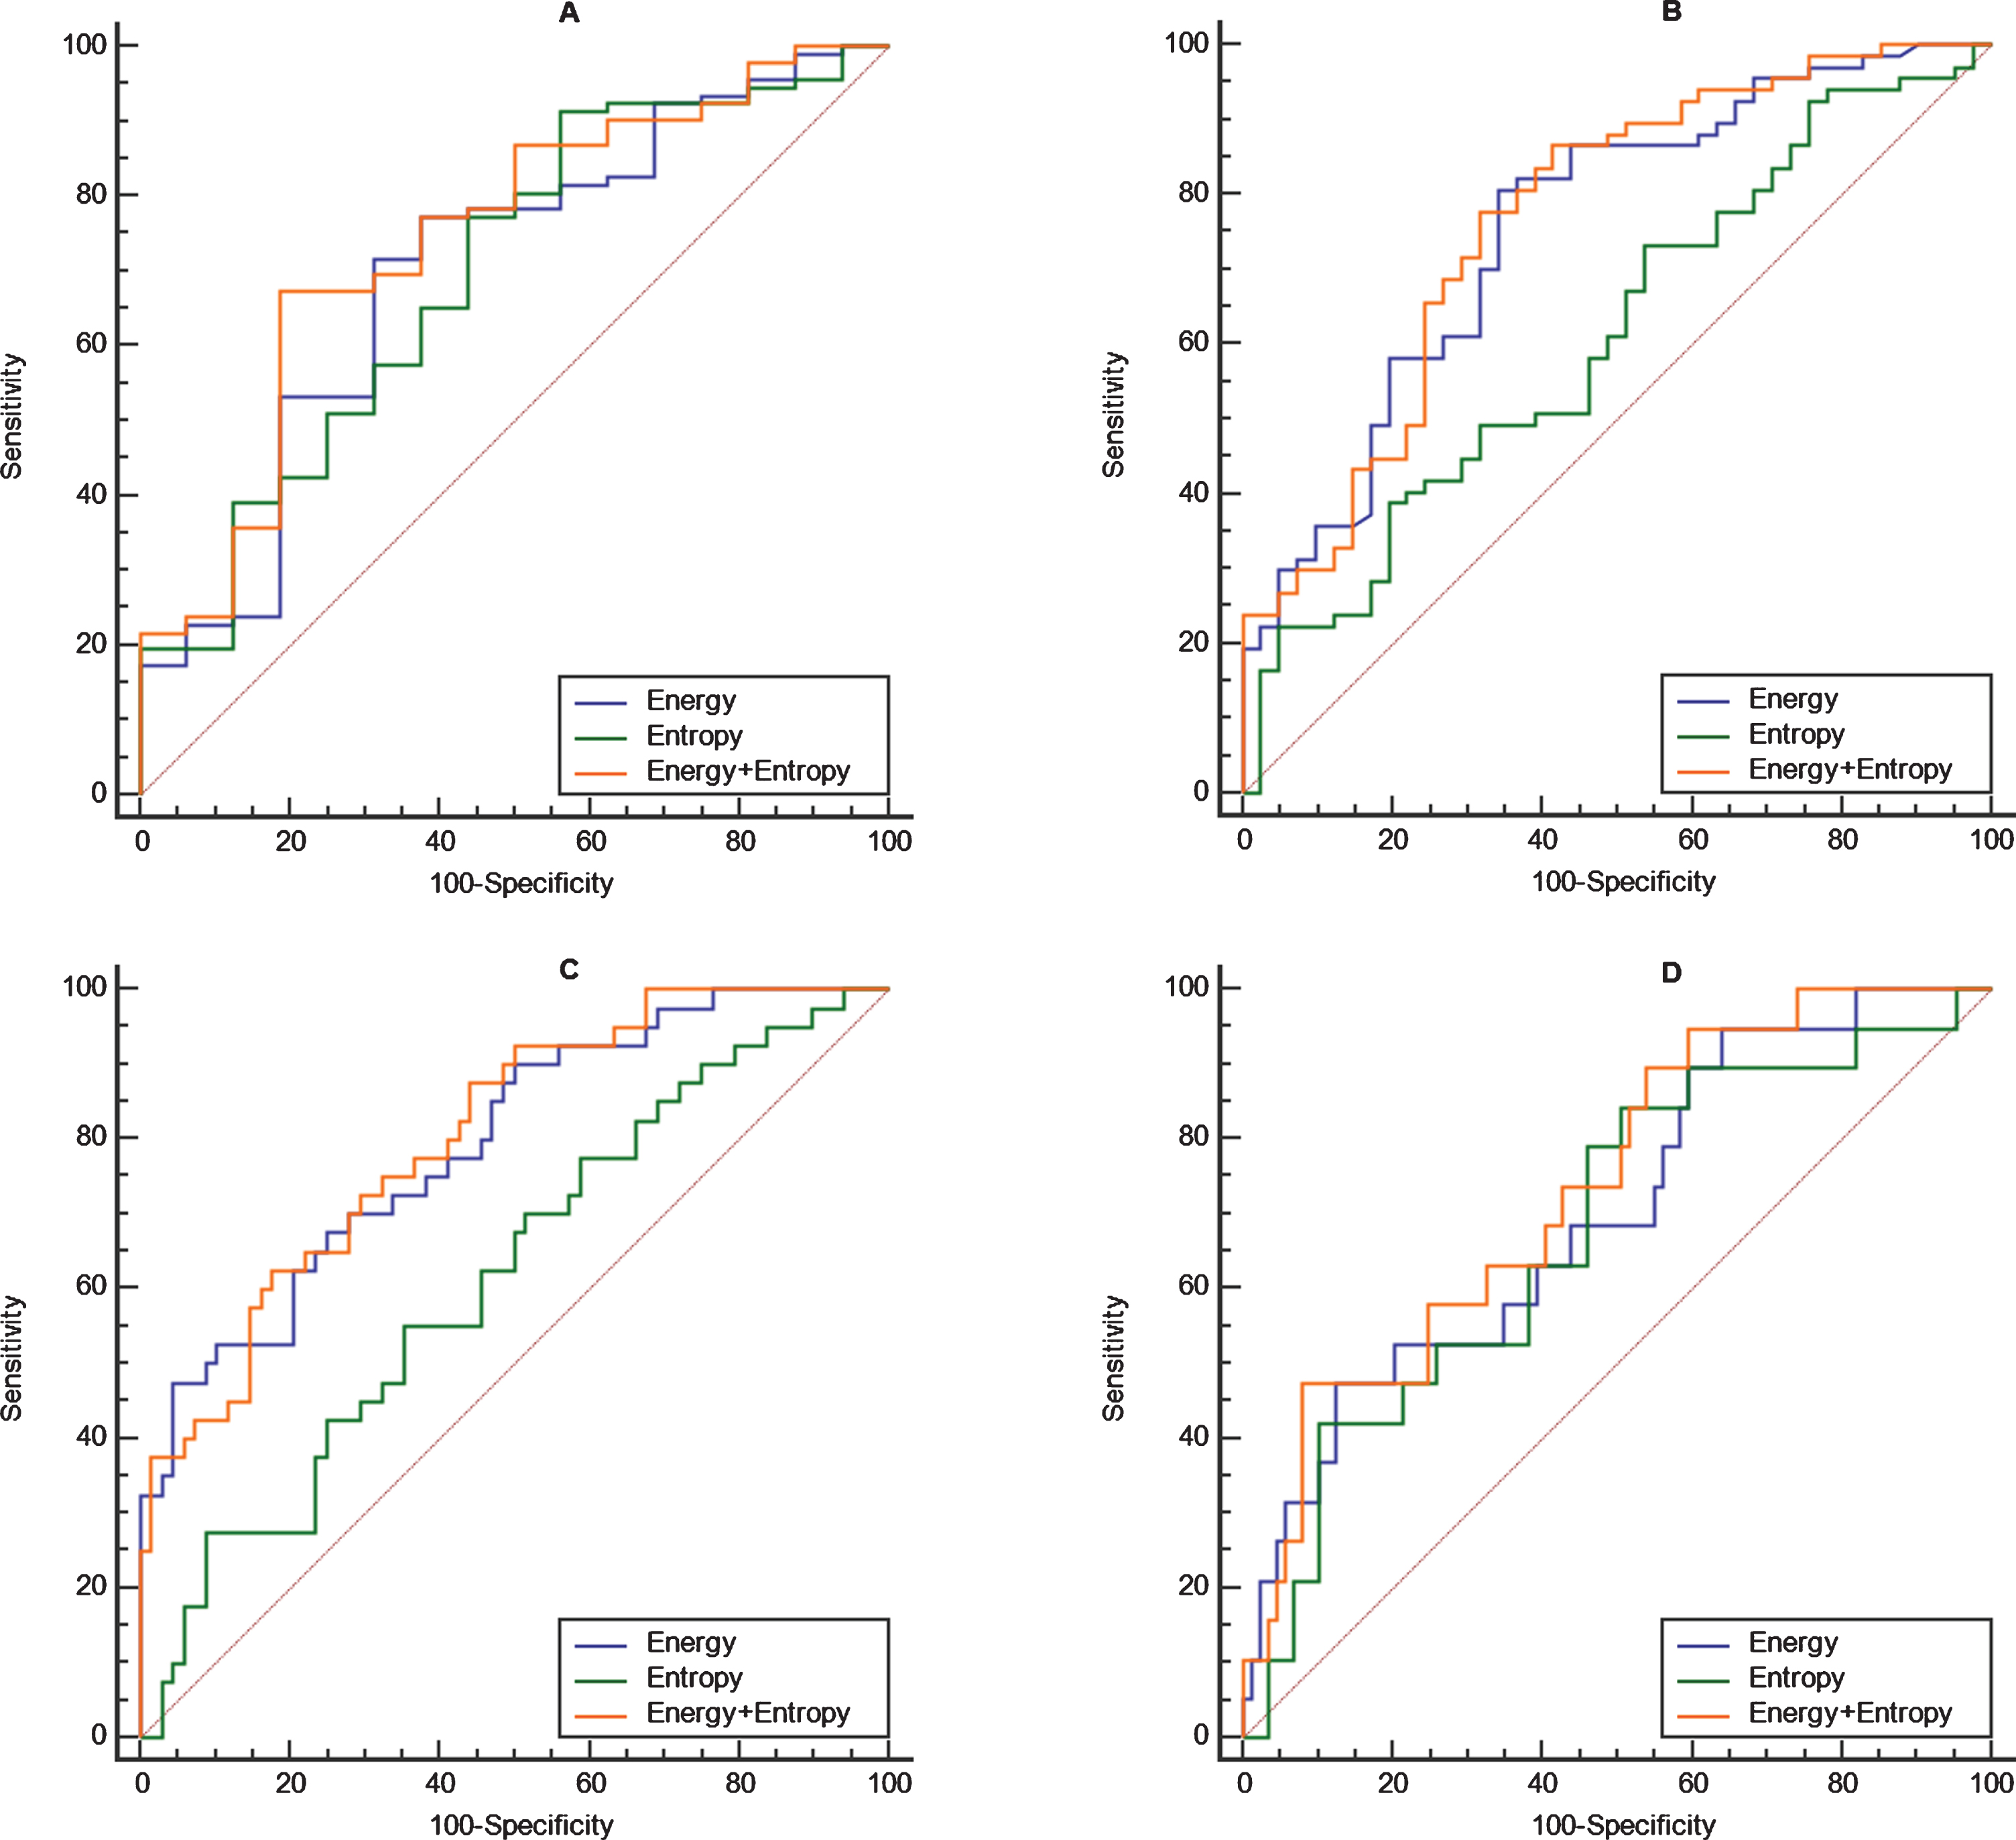
(A) Shows the diagnostic effectiveness of the texture values for distinguishing Gleason = 6 and Gleason≥7 groups; (B) shows the diagnostic effectiveness of the texture values for distinguishing Gleason≤3 + 4 and Gleason≥4 + 3 groups; (C) shows the diagnostic effectiveness of the texture values for distinguishing Gleason≤4 + 3 and Gleason≥8 groups; and (D) shows the diagnostic effectiveness of the texture values to distinguish Gleason≤8 and Gleason≥9 groups.
This study demonstrates that the texture analysis based on MR T2WI images can be used to predict the Gleason grading of prostate cancer, and thus to help develop an appropriate clinical strategy in early stage. In addition, we also found that entropy and energy were significantly correlated with GS grades; meanwhile, the combined diagnosis of entropy and energy could improve the accuracy of Gleason grading. In this study, our research object is a single lesion, not an individual patient. In fact, there will be several cancer lesions in a prostate cancer, and the Gleason score of each lesion may be different, possibly 6 points, or 8 points, and our feature extraction is based on the tumor region of interest (ROI), which means that our features are extracted from a single lesion, so that in order to study the relationship between features and pathology, we must Accurately match the scores of individual lesions and pathologies. In addition, our ROI delineation is done by radiologists. We hope that the location of the ROI delineation is as far as possible where the pathologist takes the pathological Gleason score sampling, so that the pathologist needs to assist in positioning.
The previous reports implied the potential application of texture analysis in PCa imaging. Huynen et al [22]. confirmed that they were able to prospectively distinguish noncancerous from malignant prostate tissue with the combination of texture features in 30 patients. In addition, peripheral zone prostate cancer detections in 20 patients were evaluated by a computer-assisted diagnosis system in another study, delineating that the Entropy on T2WI was one of the most conspicuous features between non-cancerous and malignant tissue [23]. However, as a relatively new field in medical image analysis, texture analysis lacks the pathophysiological semantics and the relevance of textural features currently. The latest prostate imaging reporting and data system (PI-RADS) [24] depicts the texture of prostate tissue as an important feature for identifying PCa. Therefore, this preliminary study investigated the diagnostic relevance of T2W MRI-derived textural features in correlation to parameters with known pathophysiological significance and distinguished pathological grading.
We found the textural features energy and entropy were significantly relevant to GS, while increased PCa aggressiveness was characterized by increased GS, as well as deterioration of the architectural patterns delineating cellular integrity of the prostate gland for the reason of poor differentiation and glandular structure deformation. All of these could lead to increased complexity of the tissue, which was reflected by the reduced textural energy, possibly deciphering the observed correlations with GS, whereas the skewness and kurtosis did not significantly correlate with GS grading. The skewness is the degree of asymmetry in the histogram, which can be applied to any image. Donati OF et al. [25] confirmed that the histogram skewness measured in ROI of prostate cancer focus had less change compared with tumors with higher heterogeneity. Besides, the proportion pixels for our assessment of the tumor may not be sufficient to significantly affect the skewness and kurtosis, especially considering that the cell density changes are not captured by traditional histological grading [26], which may explain why there are no correlations between the textural features (kurtosis, skewness) and GS grading.
Our study showed the entropy tended to increase, while the energy tended to decrease, with the increase of GS grading, which was consistent with the results of several recent studies [27, 28]. The increase of entropy may be because the normal prostate epithelial cells are replaced by large number of tumor cells with the elevated cancer invasiveness. These tumor cells are small and closely arranged with irregular shape, so that the adenoid structures are gradually replaced by solid lamellar, cord-like and unicellular structures, which represents an increase in image complexity. The increase of image complexity often implies a high heterogeneity of the tumor, suggesting higher entropy [29], though no significant differences in the entropy are found by comparison between two groups. Except for the stricter statistical comparison method used in this study, we speculate the possible reason is that the differences among the grading of prostate cancer are insufficient to cause different changes in the entropy.
In addition, the energy decreases with the increase of grading, and the possible reason is that the energy represents the uniformity of normal tissue images. With the increase of the tumor invasion, more different cellular structures and heterogeneous tissue conditions may result in higher heterogeneity [30]. Moreover, PCa is often accompanied by certain degrees of prostatitis [31], which may also augment the image heterogeneity, rendering energy the most sensitive parameter among four texture values. More interestingly, we found statistical differences between low-risk group (Gleason = 6) and high-risk group (Gleason = 8–10), as well as between middle-risk group (Gleason = 3 + 4) and high risk group (Gleason = 8–10), which also shows that energy values are more sensitive than other three texture values to various groups. The mortality of PCa patients with a Gleason grade of 9 to 10 has been confirmed to be higher than that with a Gleason grade of 8 [32]. Despite dividing into moderate-risk groups simultaneously, patients with Gleason = 3 + 4 can conduct the conservative therapy, while patients with Gleason = 4 + 3 are suggested with the radical surgery [33]. Therefore, it is significant to distinguish these two subgroups for clinical therapy. Notably, the energy values of these two subgroups in this study still have no statistical difference, which also shows little heterogeneity difference of cancer cells in these two subgroups, insufficient to make a significant change in energy values.
This study evaluates these Gleason group scores by ROC curve. We found that it is possible to distinguish the medium-risk group and the high-risk group by dichotomy GS ROC curve analysis. This study reveals that both entropy and energy are relevant to the GS grouping of prostate cancer and demonstrates their potential to distinguish GS grading, which the previous studies did not touch on. In the ROC analysis based on the GS dichotomy, we find that the AUC area for the combined use of these two texture quantitative parameters is the largest, especially in the aspect of distinguishing the group of Gleason≤4 + 3 and the group of Gleason≥8. which has statistical difference when compared with that of the entropy alone, however, has no statistical difference when compared with the energy alone. Therefore, it is of great importance for energy in distinguishing the moderate-risk group and the high-risk group.
In this study, some cancer cases have very low PSA values. The analysis believes that under normal circumstances, the normal value of PSA in serum is usually lower than 4 ng/ml. If the patient finds that the index exceeds this value during the examination, it indicates most symptoms of the prostate. We should conduct further inspections in a timely manner. If PSA is greater than 10 ng/ml, it is likely that the patient has developed prostate cancer. Of course, the specificity of PSA screening for prostate cancer is not high, especially whether the PSA value is between 4–10 ng/ml. Whether biopsy needs to be performed has been controversial [34], and there are now studies specifically targeting cancers with low PSA values [35]. This is consistent with the results of this study.
There are some limitations in our study. Firstly, texture values are susceptible to a variety of factors, such as MR images, scanning parameters and so on, so the texture analysis has some limitations in repeatability. Therefore, standardized analysis in subsequent research is needed. Secondly, only patients undergoing radical prostatectomy are included in this study, therefore the exclusion of patients without radical surgery may cause selection bias. Thirdly, in this research, four texture features (skewness, kurtosis, entropy and energy) are all histogram features and are limited to feature extraction software. The software we used when doing this research can only extract these few feature values, so we can only carry out these few in the study. Feature evaluation, of course, in the future we will further consider using high-order texture features for evaluation, of course, the premise is that the software can be updated. Finally, for the placement of ROI, although the lesion location of the radical surgery specimens is taken as a reference standard, the selection location of the image may have some matching error.
Conclusion
Image texture features based on T2WI may prove valuable for predicting Gleason grading of PCa and correlated with the underlying pathophysiology of prostate cancer tissue, which we could enhance existing prostate cancer classification techniques.
Footnotes
Acknowledgments
This study was supported by the Zhejiang provincial medical and health science and technology program (2019KY734), Shaoxing Science and Technology Project (2018C30152).