
Abstract
Currently, cardiac computed tomography angiography (CTA) is widely applied to coronary artery disease diagnosis. Automatic segmentation of coronary artery has played an important role in coronary artery disease diagnosis. In this study, we propose and test a fully automatic coronary artery segmentation method that does not require any human-computer interaction. The proposed method uses a growing strategy and contains three main parts namely, (1) the initial seed detection that automatically detects the root points of the left and right coronary arteries where the ascending aorta meets the coronary arteries, (2) the growing strategy that searches for the neighborhood blocks to decide the existence of coronary arteries with an improved convolutional neural network, and (3) the iterative termination condition that decides whether the growing iteration finishes. The proposed framework is validated using a dataset containing 32 cardiac CTA volumes from different patients for training and testing. Experimental results show that the proposed method obtained a Dice loss ranged from 0.70 to 0.83, which indicates that the new method outperforms the traditional methods such as level set.
Keywords
Introduction
Coronary artery disease (CAD) has seriously affected human health in recent years and thus has become one of the major diseases. Myocardial ischemia caused by coronary artery stenosis is the main reason for CAD. With the increasing demand for the diagnosis of CAD, cardiovascular imaging techniques emerge rapidly. In current clinical practice, conventional coronary angiography (CCA) is a gold standard in CAD diagnosis. Although the lesion of the coronary artery can be shown clearly in CCA, this technique is invasive. With the advent of computed tomography (CT) scanning technology, computed tomography angiography (CTA) has been developed and widely used in diagnosis of cardiac and pulmonary diseases [1, 2]. Specifically, cardiac computed tomography angiography (CCTA) has become the main technique in CAD diagnosis because it is noninvasive and provides high-resolution three-dimensional (3D) data [3]. However, the boundary between tissues is usually blurred in CCTA data because of maldistribution of contrast agent. To improve the efficiency and accuracy of CAD diagnosis, algorithms of medical image analysis are necessary.
Segmentation of coronary artery has significant meaning in CCTA. Firstly, it can be used to measure the coronary artery stenosis. Therefore, it can provide quantitative information to the doctors. Kirili, et al. [1] introduced a standardized evaluation framework for the evaluation of coronary artery stenosis detection and stenosis quantification. Jelmer, et al. [4] proposed a method to score coronary artery calcification. It is crucial for these systems to accurately segment coronary artery. Coronary artery segmentation for CCTA has been a key technique. On the other hand, coronary segmentation can provide doctors registration information of medical images from different sources for heart operations.
With the development of pattern recognition and medical image processing, many coronary artery segmentation algorithms sprang up recently. Zhou, et al. [5] proposed a dynamic balloon tracking method to extract coronary artery tree. The vascular structures within the heart region were enhanced and segmented using a multiscale coronary response in this method. Kitamura, et al. [6] proposed a supervised detection and shape matching method. In their work, a classifier of tubular 3D objects was learned, and then Markov random field (MRF) framework was used to segment vascular structure. Deng, et al. [7] proposed a 3D interactive coronary artery segmentation using random forests and MRF optimization. Basit, et al. [8] presented a multi-scale model for 2D segmentation of coronary arteries combing the directional information and Hessian eigenvalue analysis. Chi Y, et al. [9] proposed a composite of features for learning-based coronary segmentation method, which integrated coronary artery density features, local shape and global structure into the learning framework. Gong [10] proposed an automatic coronary artery segmentation method, which combined the work of Frangi, et al. [11] and region growing method. With the development of deep learning, many algorithms based convolutional neural network (CNN) are applied in coronary artery segmentation. For example, Ronneberger, et al. [12] presented an encoder-decoder CNN called U-Net, which achieved good performance on different biomedical segmentation applications. In 2016, Moeskops, et al. [13] proposed a multi-layer CNN to segment the coronary artery, which is trained by three 2D-patches at the orthogonal views from 3D volumes. In 2017, Øyvind [14] proposed a dual pathway architecture–3D DeepMedic, which could incorporate both local and larger contextual information of coronary artery.
The above methods apply different feature extractors and classifiers to achieve coronary artery segmentation. However, the above-discussed methods need to be improved in two way–automaticity and accuracy. Regarding the lack of automaticity, in the work of Chi Y, et al. [9], the aortic valve and apical coordinates need to be specified manually. The algorithm proposed by Kirili, et al. [1] relies on manual positioning of the aortic valve, mitral valve, and apex. In addition, for most existing methods, the ROI including the entire heart area needs to be interactively intercepted. As for accuracy, artificial features of density or tubular structure are always applied in traditional algorithms. Although those features are significant for segmentation, the performance will be not good if methods only rely on manual features which have weak ability to express model. Other researchers [15, 16] extracted the central lines or segmented coronaries with deep learning methods. Well trained CNN can segment coronary artery well, but the false positive regions are always high because of lacking the fusion of global and local information.
In this study, a fully automatic segmentation method using growing strategy is proposed. In this method, initial seed points are automatically located by detecting the obvious root points of the Left Coronary Artery (LCA) and Right Coronary Artery (RCA). Then, a growing algorithm is developed to segment the coronary arteries. The growing starts from the initial seed points and segment coronary arteries in a neighborhood block with improved 3D U-Net [17, 18]. After segmentation, new seed points are detected and used as the start points of next iteration. When no new seed points are found, the growing stops. Compared with traversing method, growing from seed points can avoid being interfered by other vessel-like structure.
The main contributions of this study are as follows. Automatic segmentation is achieved by automatically locating initial seed points and growing strategy. A growing algorithm combining with 3D U-Net is proposed. The improved 3D U-Net is used for coronary artery segmentation. In order to make the network converge to be optimal, residual block and ‘Two-Phase Training’ are applied in the proposed method. Because the input data of the network is the neighborhood block of a seed point and it makes the coronary artery centered, the proposed network needs only a small-sized training dataset.
The remainder of this paper is organized as follows. Section 2 depicts our method. In Section 3, experimental methods and data analysis results are reported. Finally, conclusions and future work are discussed in section 4.
Methods
In this section, the details of the proposed method will be presented. As shown in Fig. 1, the proposed segmentation algorithm adopts growing strategy and contains the following three main parts.

Flowchart of the proposed method.
2D U-Net based initial seed detection. Initial seed points are the root points of the left and right coronary arteries which are automatically located for starting the growing. 3D U-Net based Coronary artery segmentation by growing. The growing is an iteration procedure, which starts from the initial seed points to obtain the whole coronary arteries until reaching iterative termination condition. For each seed point in the iteration, a block data of size 64×64×64 is cropped and multi-receptive field 3D U-Net is improved to segment the coronary artery. Some new seed points are generated based on the output, and those points are used as seed points for next iteration. Iterative termination condition. The condition decides whether the growing iteration stops.
In this study, the initial seeds are defined as the root points of the left and right coronary arteries, or the points where the ascending aorta (AAO) meets the coronary artery. So, initial seeds are also called root points in this paper. The AAO region in different CT slices are shown in Fig. 2(a), (b), (c), and the reconstructed 3D data is demonstrated in Fig. 2(d). The slice containing RCA root points is called RCA root slice and the slice containing LCA root points is named LCA root slice.
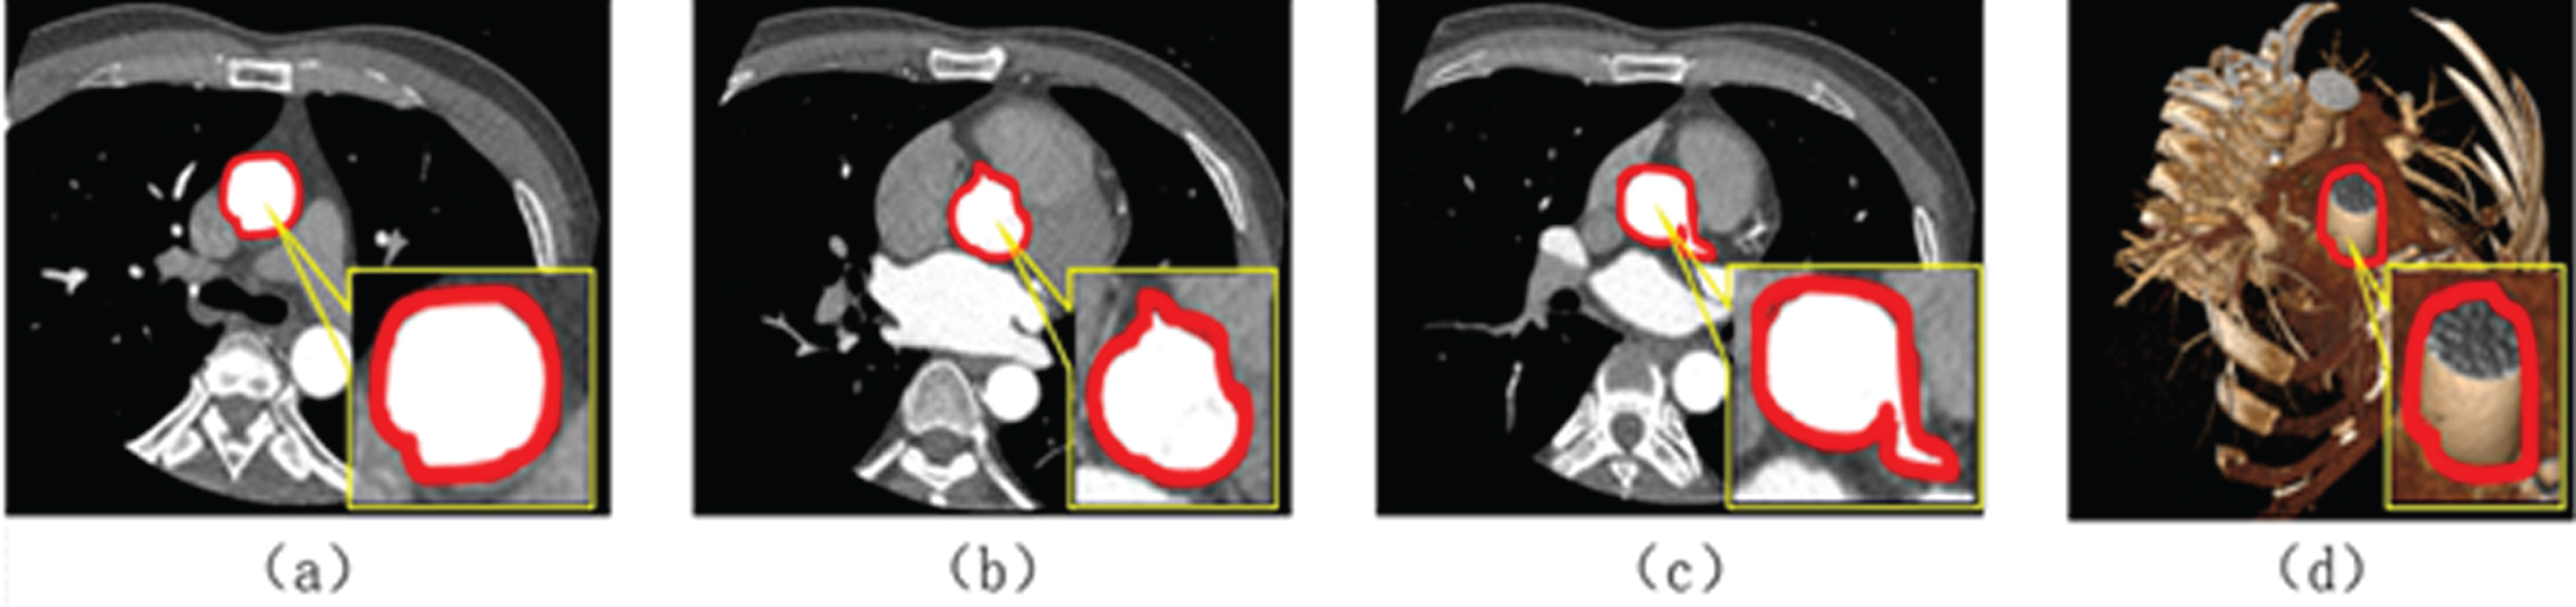
Ascending aorta region (red bordered area): (a, b, c) show 3 different slices with AAO and (d) shows 3D data.
In Fig. 2, although it is shown that the features of AAO are more obvious than that of other tissues, the performance of AAO segmentation is still challenging because CCTA of different patients shows different density due to different dose of contrast agent and different machines for data acquisition. Therefore, the accuracy of root point detection depends on the accuracy of AAO segmentation.
The initial seed detection method is the first step of the proposed method. As shown in Fig. 3, it contains two major procedures: AAO segmentation and the root point location (in the 2 dashed boxes in Fig. 3).
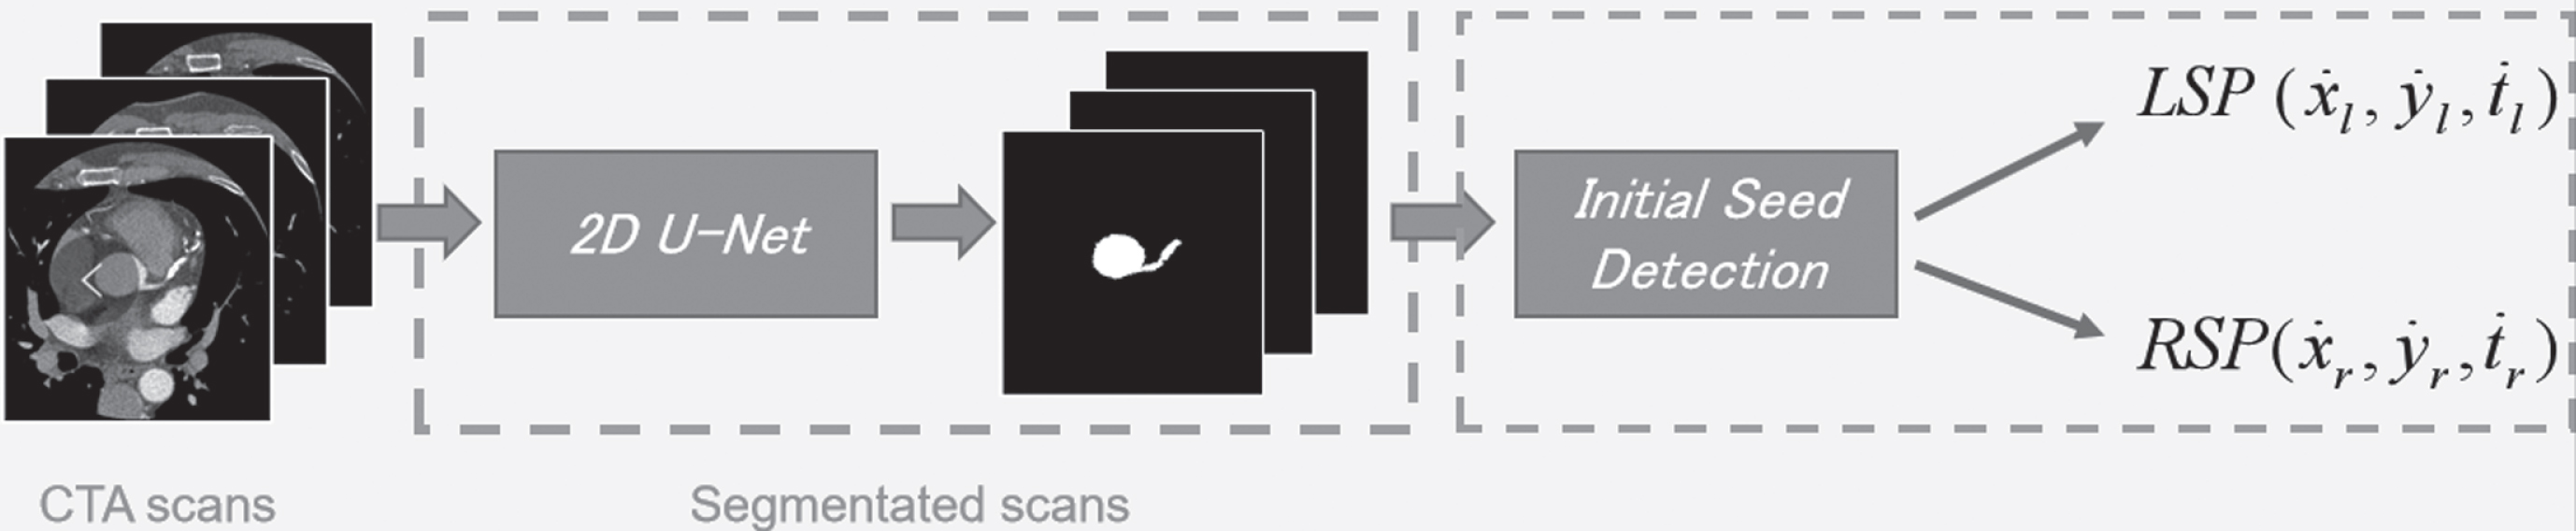
The flowchart of the first part of the proposed method (initial seed detection).
Because ascending aorta segmentation is of great importance for the root point detection, 2D U-Net is used to segment AAO. 2D U-Net is an encoder-decoder convolutional neural network. In the encoder process, abstract features are extracted by convolutional layers and pooling layers. In the decoder process, abstract features are remapped to the original data space by upsampling or transposed convolutional layers. In order to minimize the space loss caused by pooling layers, concatenating corresponding convolutional layers in encoding phase is applied in the network.
Procedure 2: Root point location
The coordinate of a voxel in a volume can be defined as (x, y, t), where t represents the index of a slice in the volume and (x, y) means the coordinates in the 2D slice. The aim of this procedure is to locate the component t and (x, y) individually.
The masks of AAO in CTA slices are obtained, when slices are fed into trained 2D U-Net. Since the area of AAO changes sharply near the coronary root points, it can be used as a feature to detect root points. As is shown in Fig. 10 (c). Specifically, Equation (1) is used to detect the slice where the root point is located.
where
In Equation (2),
The coronary arteries are the arteries of the coronary circulation that transport blood into and out of the cardiac muscle. They are mainly composed of the left and right coronary arteries. Both of LCA and RCA give off branches. Coronary arteries on different slices are shown in Fig. 4 (area surrounded by red).
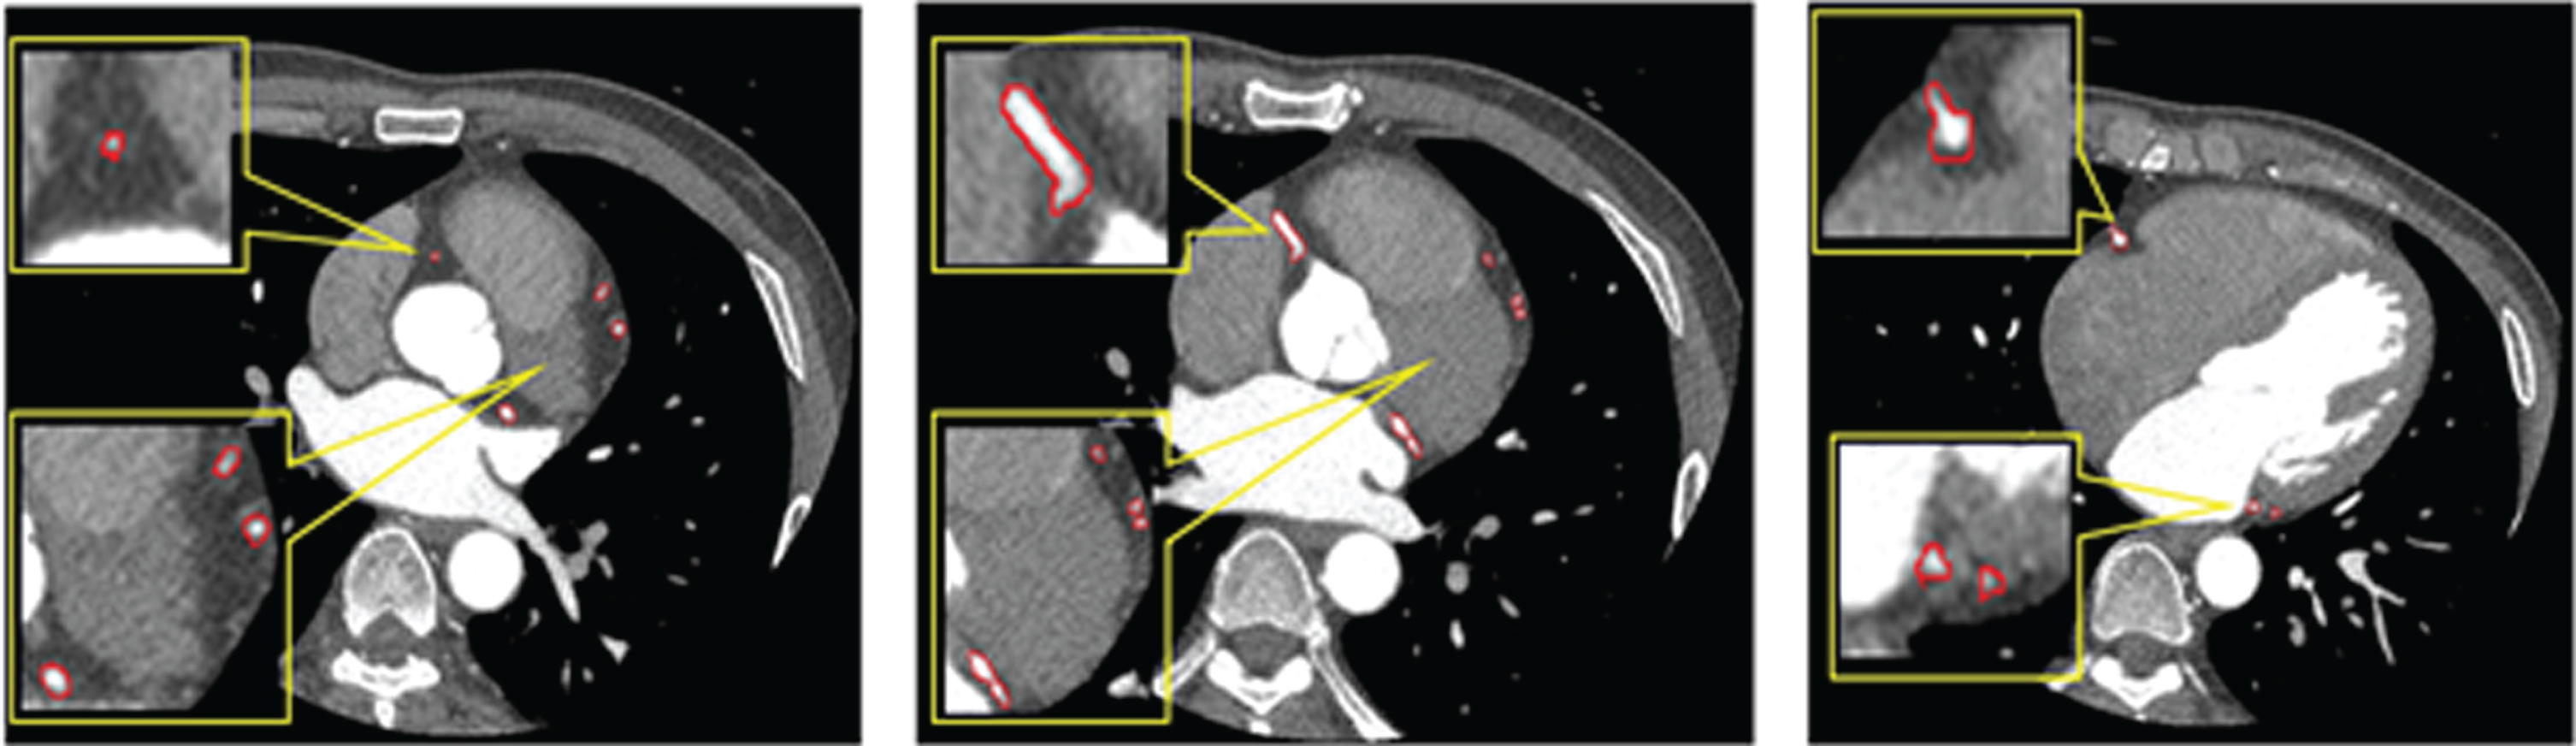
Areas of coronary arteries on different slices.
As shown in Fig. 4, areas of coronary arteries are very small. The diameters of coronary arteries are about 5mm. In this paper, the resolution of each slice data is 512×512 voxels. The image’s field of view is about 20 cm×20 cm. Small coronary arteries occupy about 50 voxels on slice, while large coronary arteries are about 500 voxels. As a result, coronary artery segmentation in 2D space is very difficult.
One of the most popular coronary artery segmentation algorithms is region growing in 3D data. Region growing is a segmentation method based on density and tube-like features. However, the density of coronary artery is determined by the dose of contrast agent and equipment precision. To improve the effectiveness of segmentation algorithms, robust feature extractors are crucial. In this section, the proposed segmentation method which is shown in Fig. 5 is depicted in details. The method mainly included two aspects: segmentation neural network and the growing strategy.

Overview of the second part of the proposed method (growing method using 3D U-Net).
CNN models based on mass data can extract abstract and robust features which are useful for decision making. Since 2D image segmentation performs well in coarse-grained segmentation, the models need to be improved in fine-grained segmentation.

The structure of network modules where (a) shows a pyramid pooling module and (b) shows a residual block.
In the encoder process, 8×8×8×512 feature maps are obtained after block of size 64×64×64 is fed to 8 convolution layers which contain 2 convolutional layers and 3 residual blocks. In the proposed network, a full pre-activation residual block is used because the performance of the architecture was proven to be effective in the paper of He, et al. [21]. Global pooling, 4×4×4 average pooling, and 2×2×2 average pooling are used to separate those feature maps into different sub-region. To maintain the weights of global feature, 1×1×1 convolution layer is used. The different sub-region representations are followed by upsampling and concatenation layers to fuse local and global context information into final feature representation. Pyramid pooling module [22], instead of only max pooling, makes the capacity of the encoder more powerful. In the decoder process, upsampling and concatenation layers are applied. To offset the space loss caused by pooling in the encoder stage, upsampling layers are concatenated with the corresponding convolution layers which have the same size in encoder layers, and two convolutions followed by a BN and Rectified Linear Unit (ReLU). The outputs are mapped from final convolutional layer into 0–1 by Sigmoid activation. The network has 22 convolutional layers in total. The architecture of proposed network is shown in Fig. 7.

The architecture of the proposed network.
In Fig. 7, ‘Ec’ represents the encoder process, while ‘Dec’ denotes the decoder process. The parameters of the convolutional layers of different modules are shown in Table 1, which contains the number, size and stride of convolutional kernels and the output shape of the convolutional layer.
Parameters of the proposed network
where D is a set of 643 voxels, lab and pre represent ground truth and prediction of each voxel respectively, smooth is constant which prevents the denominator from being 0. smooth is set as 1 here. In optimization strategy of loss, Adaptive Moment Estimation (Adam) is used, where learning rate is set to 1e-5, decay rate for the moment estimates is set to 0.95.
There are two patterns to select block data from CCTA: traversing model and growing model. Traversing pattern is transversely selecting the block data from CCTA data. This pattern takes some invalid blocks which do not contain coronary arteries. The segmentation results are easily affected by other blood vessels. On the other hand, too many invalid blocks affect the speed of the algorithm. To make the segmentation robust and accurate, the proposed growing method selects suitable data blocks and searches new seeds on the surfaces of the blocks. The strategy is shown in Fig. 8.

The flowchart of point searching strategy.
As discussed in Section 2.1, the root points of coronary arteries (point ‘O’ in Fig. 8) are located. Those root points are set as the initial seed points of growing method. Block data centered on initial seed point is selected. A mask of the same size (Block 1 in Fig. 8) is obtained after the block data is fed into the trained improved 3D U-Net model. In order to locate the subsequent seed points, the segmentation results of data blocks need to be analyzed. The far ends of the newly segmented region are considered as the candidates of the subsequent seed points. To prevent the possible mis-segmentation from affecting the search of subsequent seed points, only the area connected to the central point is considered. Therefore, a 3D thinning of connected region is firstly applied, and the end point connected to the central point is considered as a new seed. In order to prevent double-counting of data blocks, when the end point is in the region that has been calculated before, the end point would not be considered as the subsequent seed point. For example, in Block 2 of Fig. 8, point ‘O’, ‘3’, and ‘4’ are the end points. Because ‘O’ has been calculated in Block1, ‘O’ would not be considered as a subsequent seed point. In addition, in order to improve the search efficiency, when the end point is in the volume (not on the surfaces of the block), it will not be regarded as a subsequent seed point. For example, in Fig. 8 (Block 2), point ‘3’ and ‘4’ are not extended to the surface, so they are not regarded as subsequent seed points.
According to Fig. 8, there are obvious overlaps between neighbor blocks and the central voxel in each block is definitely a coronary voxel. This means the coronary is aligned in some degree, so it is helpful to train the network with relatively small training dataset.
The proposed growing strategy can be illustrated with a tree (Fig. 9). When there are no new seed points founded, all the branches will reach the leaves and the iteration will be terminated.

The illustration of the proposed growing strategy.
In summary, the segmentation algorithm detects the initial seed, then segment coronary artery by adopting a growing strategy and a modified convolutional neural network. The growing finishes when there are no new seed points. The pseudo-code for the algorithm is shown as Table 2.
The pseudo-code of the proposed method
The segmentation algorithm needs one cardiac CTA data, root points and trained CNN model. Final mask is generated when the segmentation algorithm finished. There are only two values in this mask: ‘0’ and ‘1’. ‘0’ represents the background area, while ‘1’ represents the coronary artery area.
In this section, experiments of both initial seed detection and coronary artery segmentation are introduced in detail. In the experiments, a dataset containing 32 cardiac CTA volumes of different patients is used for training and test. The CTA volumes are captured from some patients including 3 patients who suffer from coronary stenosis. And the segmentation results on the volumes of the 3 patients (called patient 1, patient 2 and patient 3) are reported in Table 4. Those CTA volumes are collected with GE Multidetector CT scanners in Beijing Anzhen Hospital. Each volume has about 224 slices, and each slice has 512×512 voxels. The voxel resolution is 0.3828×0.3828 mm and the thickness is 0.625 mm. In those experiments, the 32 CCTA volumes are divided into 3 groups, 10 for training, 1 for validation, and 21 for test.
Results of initial seed detection
In this experiment, 1000 CTA slices which include 600 positive samples and 400 negative samples are extracted from 10 CTA volumes. The positive samples are slices which contain region of AAO, while the negative samples mean that slices do not contain the interested region. A pre-train model on ImageNet is used to fine-tune our training slices. The area of AAO (Segmentation results are shown in Fig. 10 (b)) could be obtained when the test slices are fed into the trained model. After AAO segmentation, z-coordinate of initial seeds is estimated according to the feature of Fig. 10 (c) and it represents which slice the initial seeds will appear on. When the z-coordinate is set, the x and y can be calculated by computing the centroid of maximal connected domain of area which is obtained by differentiating z-th slice and (z–1)th slice. The centroids are shown as Fig. 10 (d).

Analysis of root points detection. From top to bottom respectively showing (a) one slice from a volume, (b) the segmented AAO corresponding to the slice in (a), (c) AAO area difference of the whole volume, and (d) the slice containing root points region. Two columns (I and II) represent two test CTA volumes.
In this section, three main parts are introduced in detail, including dataset preparation, training and performance evaluation.
Dataset and environment
In this paper, segmentation is a supervised task. To get the labels of dataset, each CTA volume is manually labeled with the help of doctors of Beijing Anzhen Hospital. Then, 1,094 blocks are randomly selected from coronary area of the training volumes, while 500 blocks are randomly selected from areas that do not contain coronary arteries. Some slices and corresponding labels along the coronal plane in training dataset are shown in Fig. 11.

Some slices and corresponding labels on training dataset.
The program is based on the Tensorflow framework, which performs all computation on GPUs in single-precision arithmetic. The experiments are conducted on a computer with Intel Core i5-4590 CPU and a NVIDIA GTX 1080 Ti graphics card.
There are three kinds of evaluation criteria: Dice, Positive Predicted Value (PPV) and Sensitivity as shown in Equation 4.
where T1 is the true coronary artery area and P1 is the subset of voxels predicted as positives for the coronary artery region. |S| represents the size (number of elements) of a set S.
In early stages of training, 1,594 blocks are fed into the network. From dice curves as shown in Fig. 12, to overcome overfitting, two solutions are applied in this network: data augmentation and dropout layer. The training dataset is augmented by rotating 90 degrees and shifting 5–10 voxels randomly in 6 directions, while the training is regularized by dropout regularization for the final convolutional layer (dropout ratio set to 0.5). The network works well on training and validation sets. Figure 12 shows the training loss on training set and Dice on validation set.
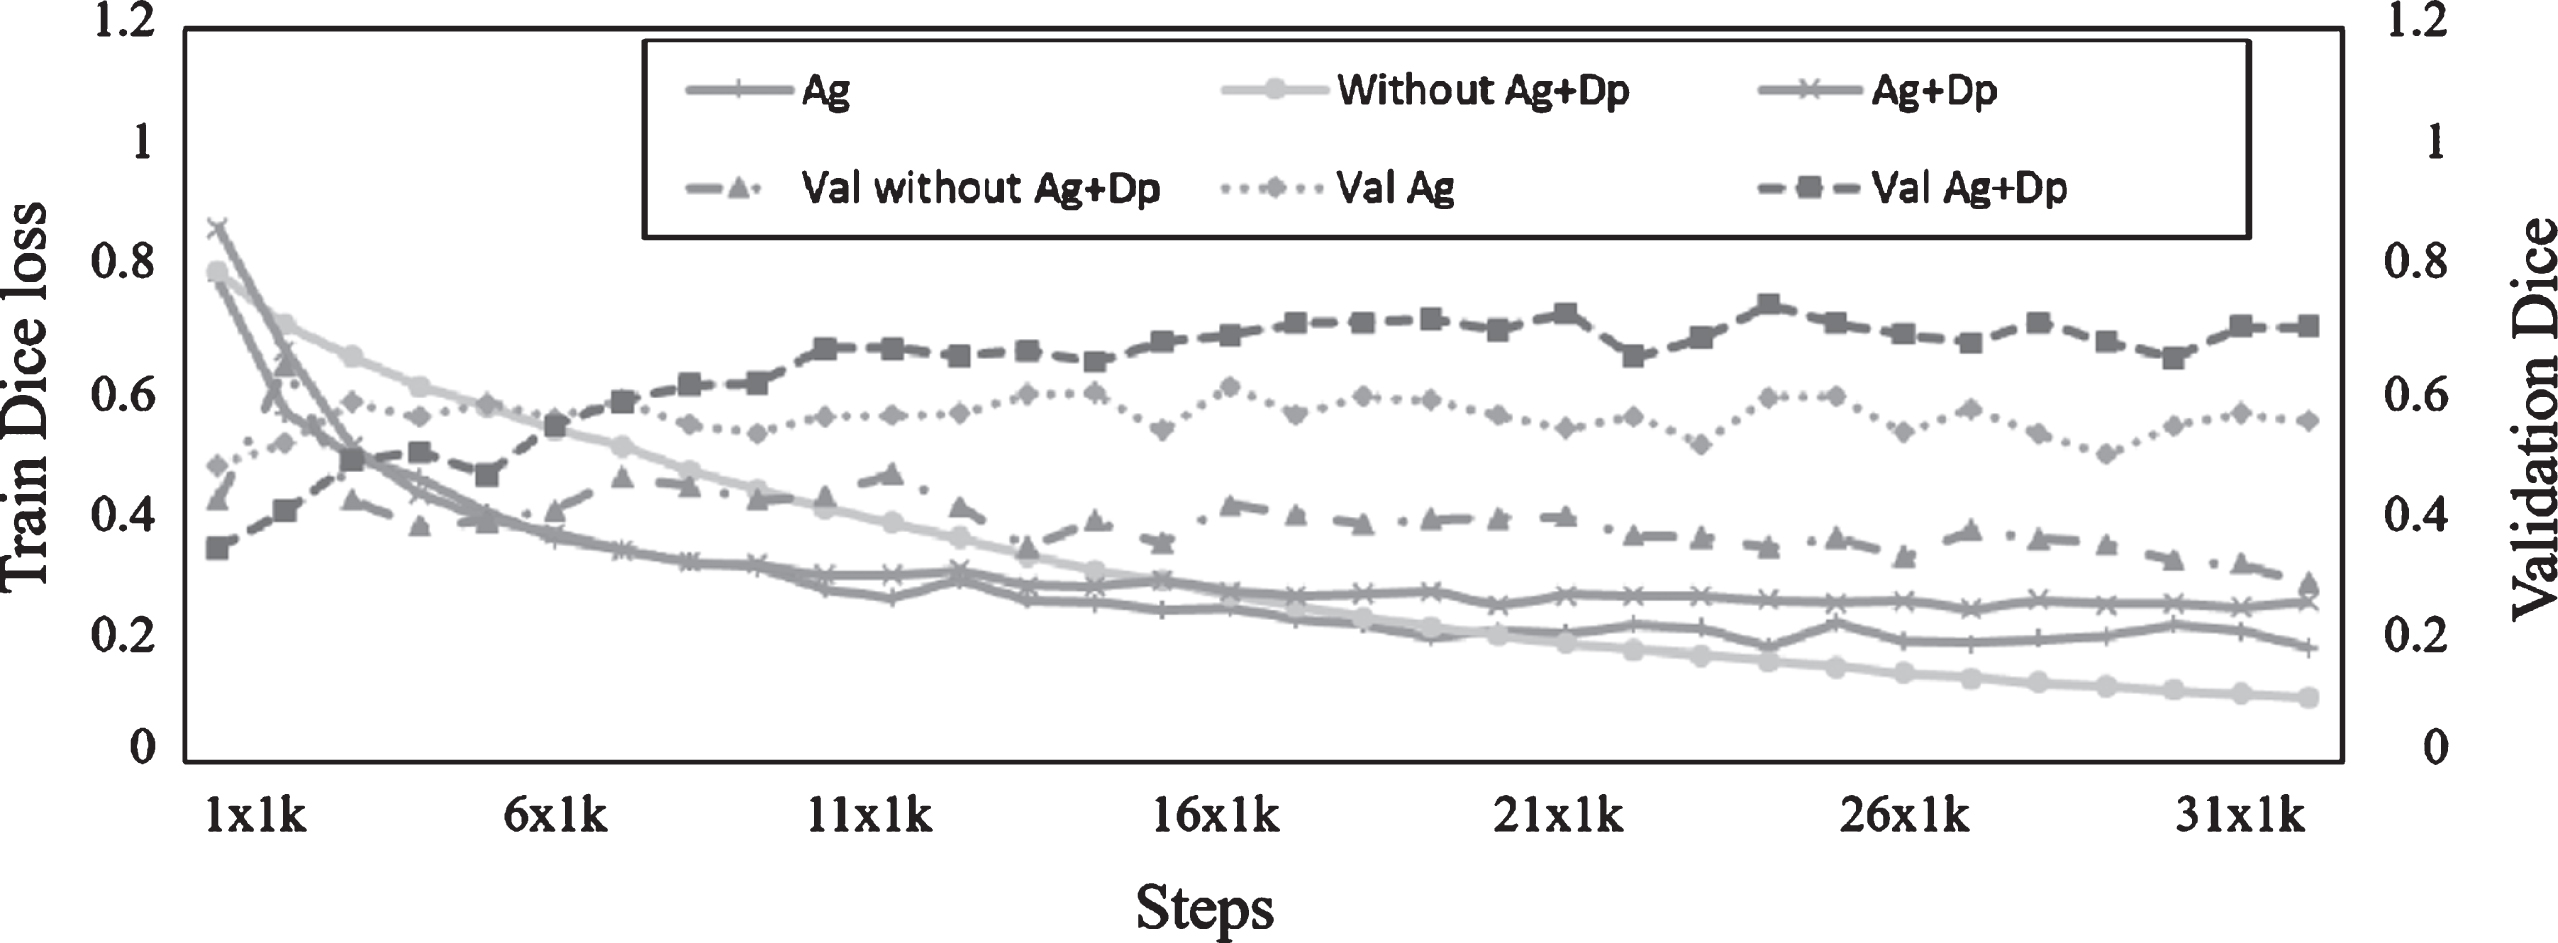
Loss on training set and Dice on validation set.
In the line chart, the dotted lines represent the Dice on validation dataset, while the solid lines represent training Dice loss. The ‘Ag’ represents ‘data augmentation’, while ‘Dp’ represents ‘Dropout’. The performance of the network on the training dataset is better without data augmentation and dropout regularization, but the performance on validation dataset is worse. To avoid overfitting problem, the learning is stopped when the output is stable (in the experiments, it is stable after 31K steps).
Test procedures contain two parts: test on block dataset and test on holistic CTA dataset. Firstly, test on block dataset is introduced. Trained models are tested on the test dataset which contains 3500 selected blocks from 21 test CTA data. The results of two networks are shown in Table 3.
Results on 3500 test blocks with size of 64×64×64
Results on 3500 test blocks with size of 64×64×64
In Table 3, the sensitivity of 3D U-Net is higher, but the PPV is lower. This means the false positive rate is too high and more tissues are mistakenly segmented into coronary artery. The proposed method fuses the different receptive field and incorporates multi-scale features, so fewer tissues are segmented into coronary artery. Thus, the improved network has great improvement compared with the original 3D U-Net in term of Dice. Because the test block data are mostly selected from coronary artery region, the proportion of blocks which contain small arteries is small.
In order to test the performance of the proposed segmentation algorithm, four methods (including growing method based on multi-receive field 3D U-Net (method 4, proposed), traversal method based on proposed network (method 3), region growing method (method 2) and 3D U-Net (method 1)) are tested. Final results of 3 patients suffering from coronary stenosis are shown in Table 4.
Performance comparison of different methods on CTA volumes from 3 patients
In Table 3 and 4, the Dice of method 1 is lower by 0.053 on block dataset and lower by 0.096 on CTA volume data than that of the proposed method. The method 1’s PPV is very low, indicating that false positive region is too large because of lacking the global information. The results of method 3 indicate that the method based on growing is powerful in coronary artery segmentation because this method could find blocks on which CNN model may have good performance instead of sequentially selecting. The PPV of method 2 is highest, but the sensitivity is too low. The results of region growing are determined by a suitable threshold and single threshold does not work well because the distribution of contrast agents is relatively weak in some fine vessels. So, region growing could not segment well the fine vessels, which causes that the sensitivity is too low. Meanwhile, overgrowing is avoided by a relatively suitable threshold, and it makes the PPV very high.
Mask of the coronary artery is computed by the proposed method, and final out is calculated by products of the mask and the original CTA data. To visualize the segmentation results, the segmentation results are reconstructed by professional medical processing software. Two volumes are shown in Fig. 13. Each row represents the segmentation result of one test sample. The first column is the ground truth label of each CTA data. From the second column to the last one respectively represents the segmentation results with region growing, 3D U-Net and the proposed method on the anterior view.

Results of the reconstructed images.
In Fig. 13, left and right main coronary arteries are segmented well with the three methods. Although the segmentation result of 3D U-Net is better than that of the proposed method in some fine arteries, the results are easily influenced by other tissue, which means false positive region is too big. The proposed method reduces the false positive rate by pyramid pooling model which could incorporating the local and global information. The above experiments show that the proposed method is feasible for coronary artery auto-segmentation with an overall better performance on coronary artery segmentation.
Table 5 shows a comparison of Dice among different methods, measured against the ground truth that is manually generated with the help of doctors. It shows that the multi-receive field 3D U-Net method presented in this paper shows better results.
Comparison of difference methods by Dice
We also compared our results with other methods in the state-of-the-art literature, the Mohr, et al. [23] and Shahzad, et al. [24], which are based on the coronary centerline. The comparison results are shown in Table 6.
Comparison with methods introduced in other papers by Dice
Coronary artery segmentation is a challenging task because of its fine vessels and blurring boundary present among tissues. Meanwhile, automatic segmentation is more difficult, because results are easily affected by other tissue without the select region of interest (ROI) or key points such as aortic valve and heart apex. This study proposes and tests a fully-automatic segmentation of coronary artery whose main contribution can be summarized in two ways. First, a root point detection method is used to replace manually selected seed points. Second, a segmentation method based on growing and CNN is used to extract more representative features, which brings evidence that methods based on CNN are feasible for medical image segmentation.
As a result, the growing strategy adopted in this study assures that the central voxel of each block is a coronary voxel, so that we use 10 volumes, a relatively small number of data, to train the network. The study results demonstrate that this strategy is encouraging, especially considering the fully supervised nature of the neural approach, which learns from raw pixel data and does not rely on any a priori knowledge of the vascular structure. To extract robust and higher-order features, two modules containing residual block and pyramid pooling were applied to original U-Net. In this way, the raw block data is transformed into a more abstract representation that implies key information about the expression of coronary arteries, and then the abstract representation is remapped into original parameter space.
The performance of the method suggests that the two modules are helpful for feature extraction and fusion in the encoding stage. The final output is more accurate than the original U-Net and region growing methods which use only original value as criteria. It would be our future work to improve the performance of network on small coronary arteries segmentation. Two aspects about the network are considered to ameliorate: more cardiac CTA volumes should be collected, and the architecture of network should be further improved to segment small coronary arteries. Meanwhile, appropriate preprocessing may help network perform better and some posterior algorithms may be investigated for dealing with the rare cases of incorrect segmentation for refining the result. The potential purpose of coronary artery segmentation is coronary stenosis detection. Although more details on coronary stenosis detection is not covered in this paper, it deserves further study in the future work.
Footnotes
Acknowledgments
The authors would like to acknowledge the financial support from the National Key R&D Program of China under Grant 2017YFB0802300.