
Abstract
Dual-energy computed tomography (DECT) provides more anatomical and functional information for image diagnosis. Presently, the popular DECT imaging systems need to scan at least full angle (i.e., 360°). In this study, we propose a DECT using complementary limited-angle scan (DECT-CL) technology to reduce the radiation dose and compress the spatial distribution of the imaging system. The dual-energy total scan is 180°, where the low- and high-energy scan range is the first 90° and last 90°, respectively. We describe this dual limited-angle problem as a complementary limited-angle problem, which is challenging to obtain high-quality images using traditional reconstruction algorithms. Furthermore, a complementary-sinogram-inpainting generative adversarial networks (CSI-GAN) with a sinogram loss is proposed to inpainting sinogram to suppress the singularity of truncated sinogram. The sinogram loss focuses on the data distribution of the generated sinogram while approaching the target sinogram. We use the simultaneous algebraic reconstruction technique namely, a total variable (SART-TV) algorithms for image reconstruction. Then, taking reconstructed CT images of pleural and cranial cavity slices as examples, we evaluate the performance of our method and numerically compare different methods based on root mean square error (RMSE), peak signal-to-noise ratio (PSNR) and structural similarity (SSIM). Compared with traditional algorithms, the proposed network shows advantages in numerical terms. Compared with Patch-GAN, the proposed network can also reduce the RMSE of the reconstruction results by an average of 40% and increase the PSNR by an average of 26%. In conclusion, both qualitative and quantitative comparison and analysis demonstrate that our proposed method achieves a good artifact suppression effect and can suitably solve the complementary limited-angle problem.
Keywords
Introduction
Generally, computed tomography (CT) is a technology with applications to various disciplines, such as mathematics and computer [1, 2]. The technology uses X-ray projection data of the object at different angles to obtain the characteristic attenuation distribution of object using image reconstruction algorithm; hence, reconstructing the image of the 3D structure inside the perspective object [3, 4]. Presently, the CT has been widely applied for industrial testing [5], medical diagnosis [6] and other applications [7]. Besides, compared with the traditional singleenergy CT imaging, dual-energy CT (DECT) utilizes two different energy spectra to provide two sets of attenuation measurements to improve the accuracy of material decomposition [8, 9]. However, for most industrial inspection objects, the DECT scanning operations increase hardware loss costs. To reduce the radiation dose and hardware loss of the scanning system, we propose a novel DECT imaging system framework with a narrow scanning range (i.e., both high-energy and low-energy scanning ranges are less than 180°), as shown in Fig. 1. The total range of the two energy scanning angles is 180°, of which, the low-energy and high-energy scanning range is the first 90° and last 90°, respectively. However, the problem faced by this framework is a dual limited-angle problem. In our problem, moreover, the lack of low and high-energy angles is complementary. Thus, we define the dual limited-angle problem as a complementary limited-angle problem in our work and the proposed DECT imaging system as a complementary DECT imaging system.
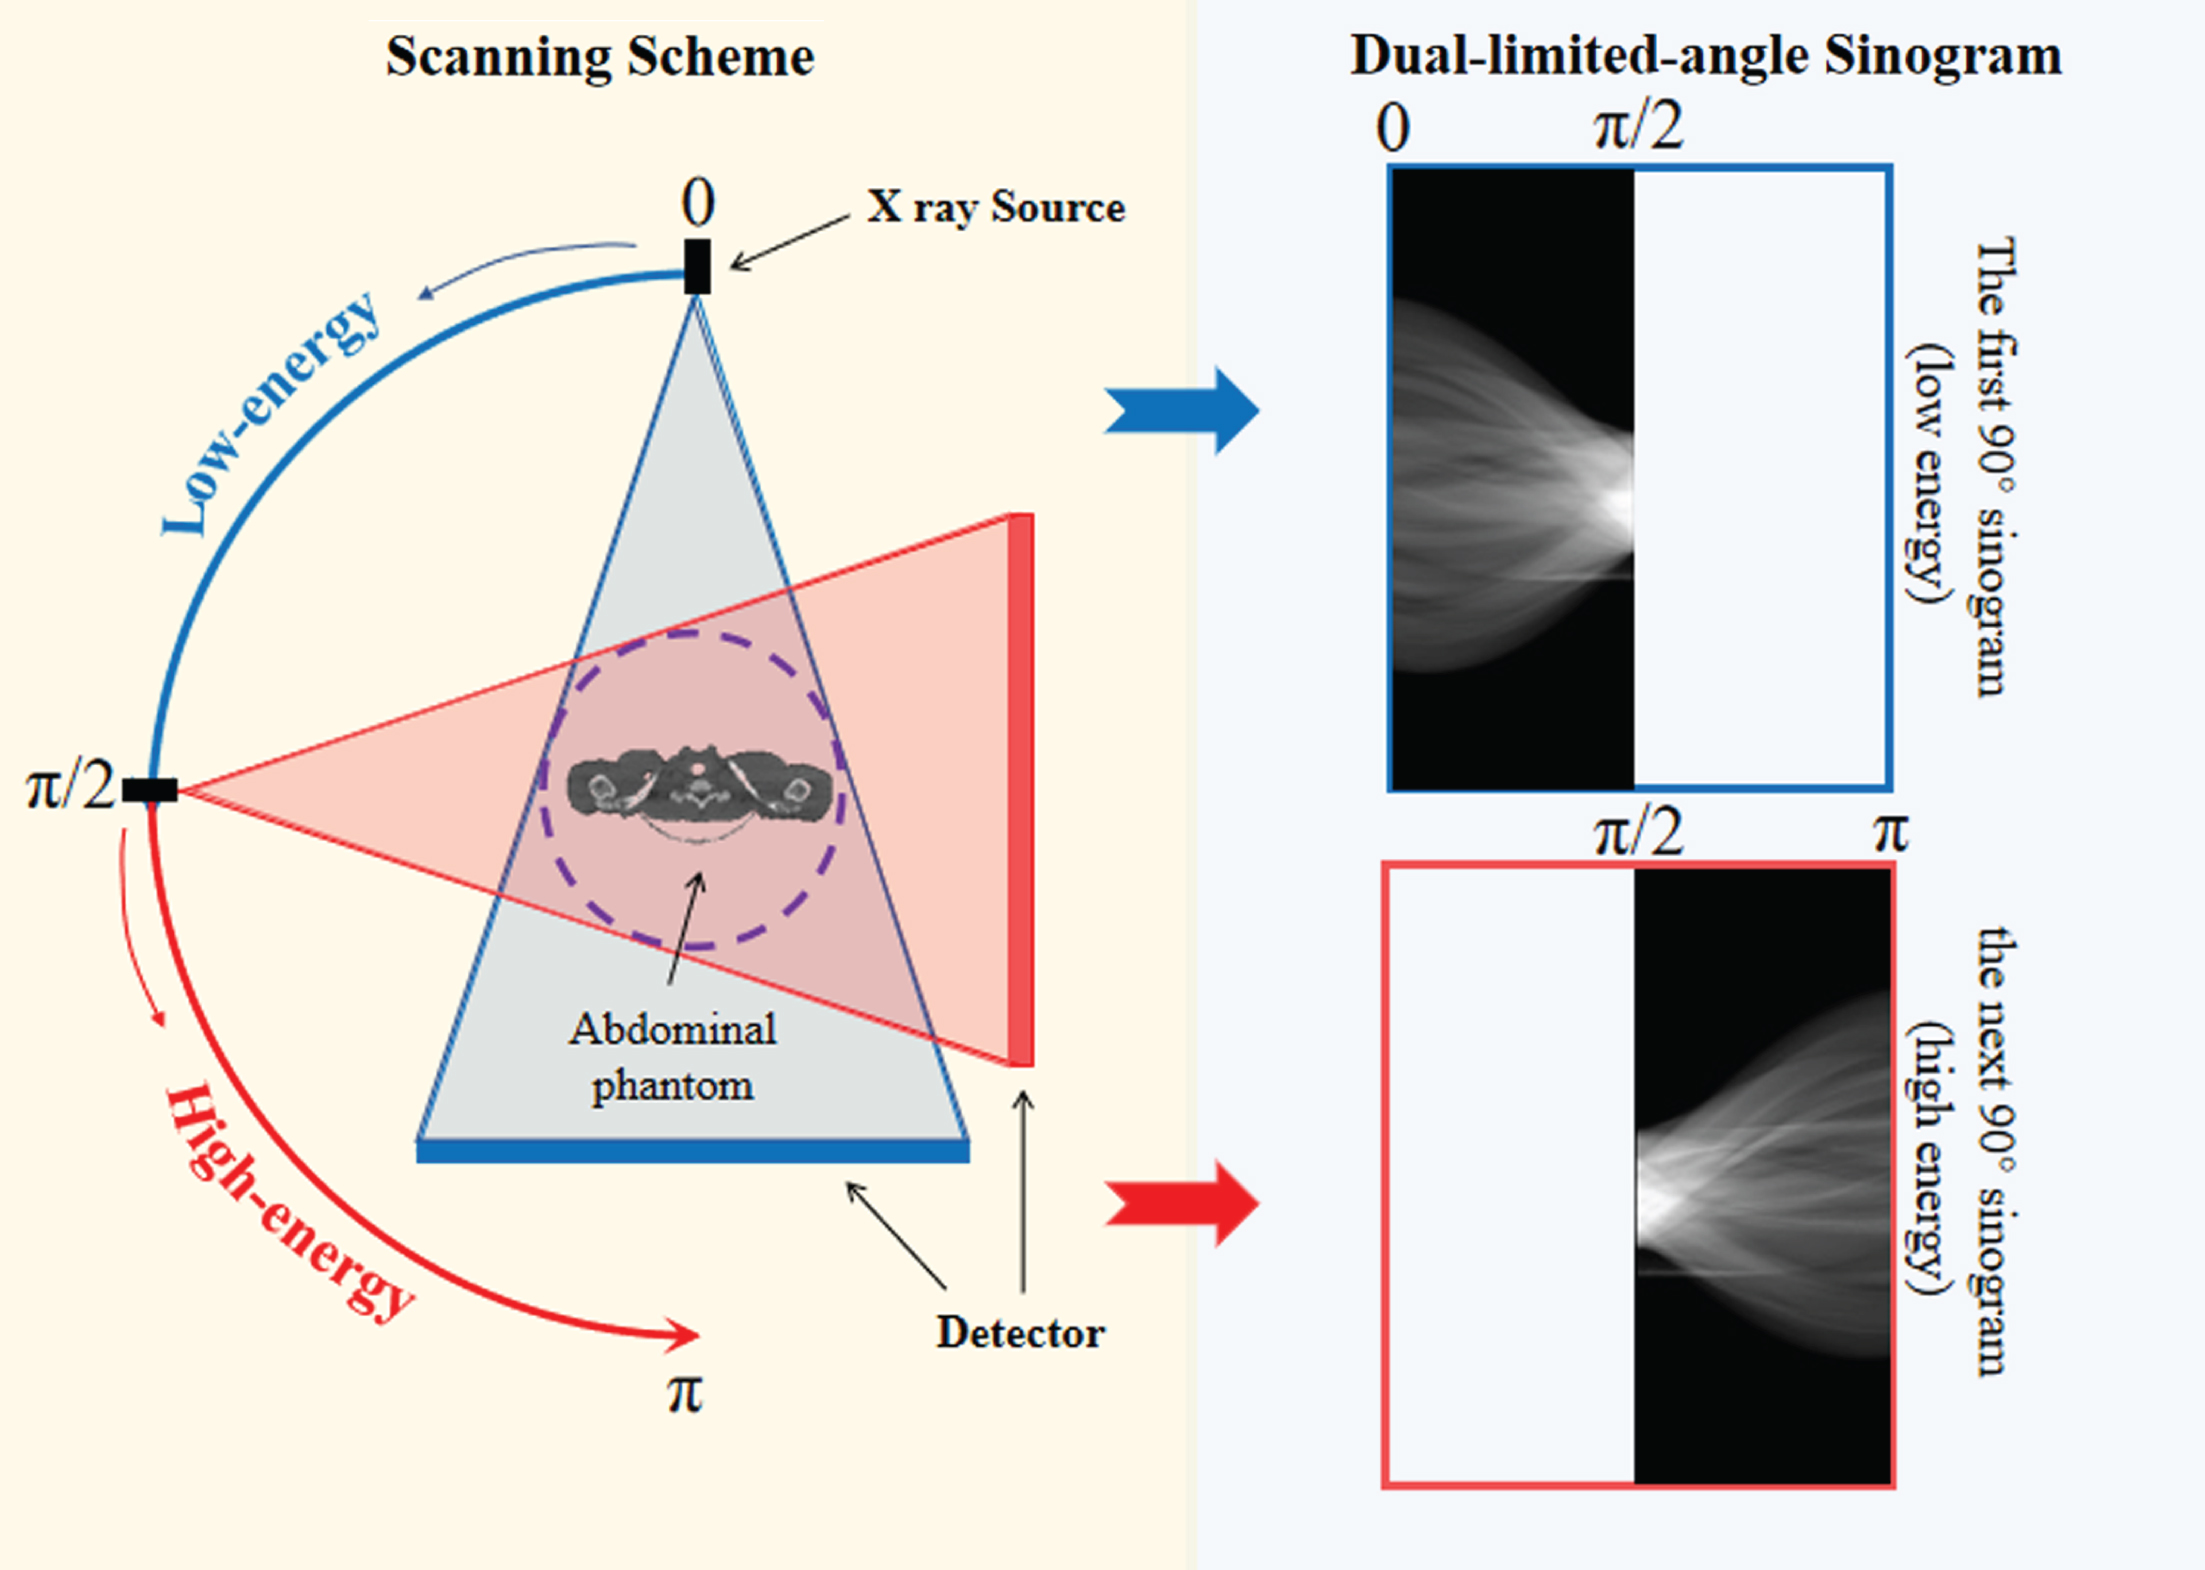
Complementary DECT imaging system. The system first performs a low-energy scan of the object to be scanned at 0–89° (indicated by the blue line), and then performs a high-energy scan of 90–179° (indicated by the red line).
Inspired by the success of compressed sensing (CS) theory [10, 11] in signal processing, the CS-based algorithms have been used to reconstruct images from sparse projection data [12, 13]. The typical method is a method based on total variable (TV) regularization, which uses an energy function to remove noise while preserving the edges [14, 15]. Presently, more popular simultaneous algebraic reconstruction technique with TV regularization (SART-TV) method [11] and alternating direction TV minimization (ADTVM) method [16] are evolved based on the TV regularization method [17–19]. Natterer et al. proved that many singular values decomposition of the system matrix for image reconstruction are close to zero when the sampling angle is less than 120°, making image reconstruction difficult [20]. However, when both the high-energy and low-energy scanning ranges are 90°, these methods cannot obtain accurate images using complementary limited-angle scanning, and the reconstructed images still have bad artifacts.
In recent years, with the continuous improvement of computing capabilities, deep learning has shown obvious advantages in the field of image processing [21, 22]. For example, Wang et al. proposed to combine deep learning and CT imaging to develop CT imaging technology [23] further. In terms of suppressing reconstructed image artifacts, Zhang et al. proposed deep neural network (DNN) to suppress image artifacts reconstructed with filtered back projection (FBP) algorithm under limited-angle scanning [24]. Most of the above methods are based on the post-processing of the reconstructed image in the image domain [25–27]. The inpainting of the scan missing angle in the projection domain [28, 29] improves the quality of the reconstructed image. Since 2017, the effect of generative adversarial networks (GANs) on image inpainting is particularly excellent [30, 31]. The generator in the GAN is used to learn the probability distribution of the training samples and make the output image conform to the learned distribution. Moreover, Jin et al. in their experiments proved that in the face of limited-angle problems, GAN-based sinogram repair methods could be used to improve image quality [32]. In 2019, Li et al. proposed a sinogram using ultra-limited-angle scan (less than 90°) and designed sinogram-inpainting-GAN (SI-GAN) to inpainting sinogram using real head data. The experimental results demonstrate that the sinogram can recover its missing parts even at the ultra-limited-angle scanning condition [33].
Although most of the above methods proposed solutions to the problem of limited-angle scanning using single energy, little research attention has been recorded on complementary limited-angle scanning using dual-energy. In this paper, we propose a GAN-based sinogram inpainting method to solve the DECT of complementary limited-angle scan imaging problems. From [34, 35], we also propose a complementary-sinogram-inpainting GAN (CSI-GAN) using the paired low-energy front 90° sinogram (high-energy back 90° sinogram) / corresponding 180° real sinogram as the input to the network. Then, the reconstruction algorithm (FBP or SART-TV algorithm) is used to obtain the reconstructed image. The experimental results demonstrate that the proposed method can obtain ideal dual-energy reconstruction outcomes using complementary limited-angle scanning.
The rest of this paper is organized as follows. In Sections 2 and 3, we introduce the principle and specific details of the proposed method and qualitatively and quantitatively analyzed the feasibility of the proposed method through simulation experiments, respectively. Finally, related problems are discussed in Sections 4 and 5.
The DECT imaging basics
The X-ray source produces polychromatic X-rays with continuous energy distribution. The intensity of polychromatic X-rays passing through an object is as follows:
where I
l
represents the intensity of remaining photons after continuous X-rays pass through an object of thickness l, I0 (E) is the initial intensity of X-rays with energy E, l represents the object thickness, E
max
is the maximum energy value spectrum, and
where u
m
(E) is the attenuation coefficient of material m for the ray with energy E, and
Based on the above rules, the X-ray attenuation information from various angles is taken as a negative logarithm to obtain projection measurement data p.
where S (E) is the normalized X-ray energy spectrum, expressed as:
In this study, the projection data observed by our proposed complementary DECT imaging system can be described as:
E contains low (E = 1) and high (E = 2) energy spectrum. There is a nonlinear between
The purpose is to inpainting the low- and high-energy sinogram to 180° real sinogram, and then reconstruct low- and high-energy images through FBP or TV-based algorithms.
In the complementary limited-angle problem, two different non-linear mapping relationships need to be solved to achieve projection completion. However, Li et al. described the problem and said that the singularity caused by data loss is difficult to overcome with traditional algorithms, and finally verified through experiments that deep learning has achieved better results when solving the projection completion problem [33]. Therefore, when facing the challenge of complementary limited angles, it is possible to complete the missing information of high- and low-energy sinograms by designing a multilayer neural network.
The design idea of the complementary DECT imaging system proposed in this paper is the low- and high-energy scanning ranges of 90° front and 90° behind, respectively. For the convenience of the expression,
The proposed CSI-GAN aims to realize the conversion of sinogram with missing angles to the 180° real sinogram. Given two sets of paired images sampled from the domains X (missing complementary angle sinogram dataset at dual-energy) and Y (corresponding 180° sinogram dataset at dual-energy), the main task of the CSI-GAN is to learn both the generator G : X → Y and discriminator. The generator maps an image x ∈ X to an image y, G (x, z) ∈ Y, whereas the discriminator discriminates between the fake output of the generator G and real Y-domain member.
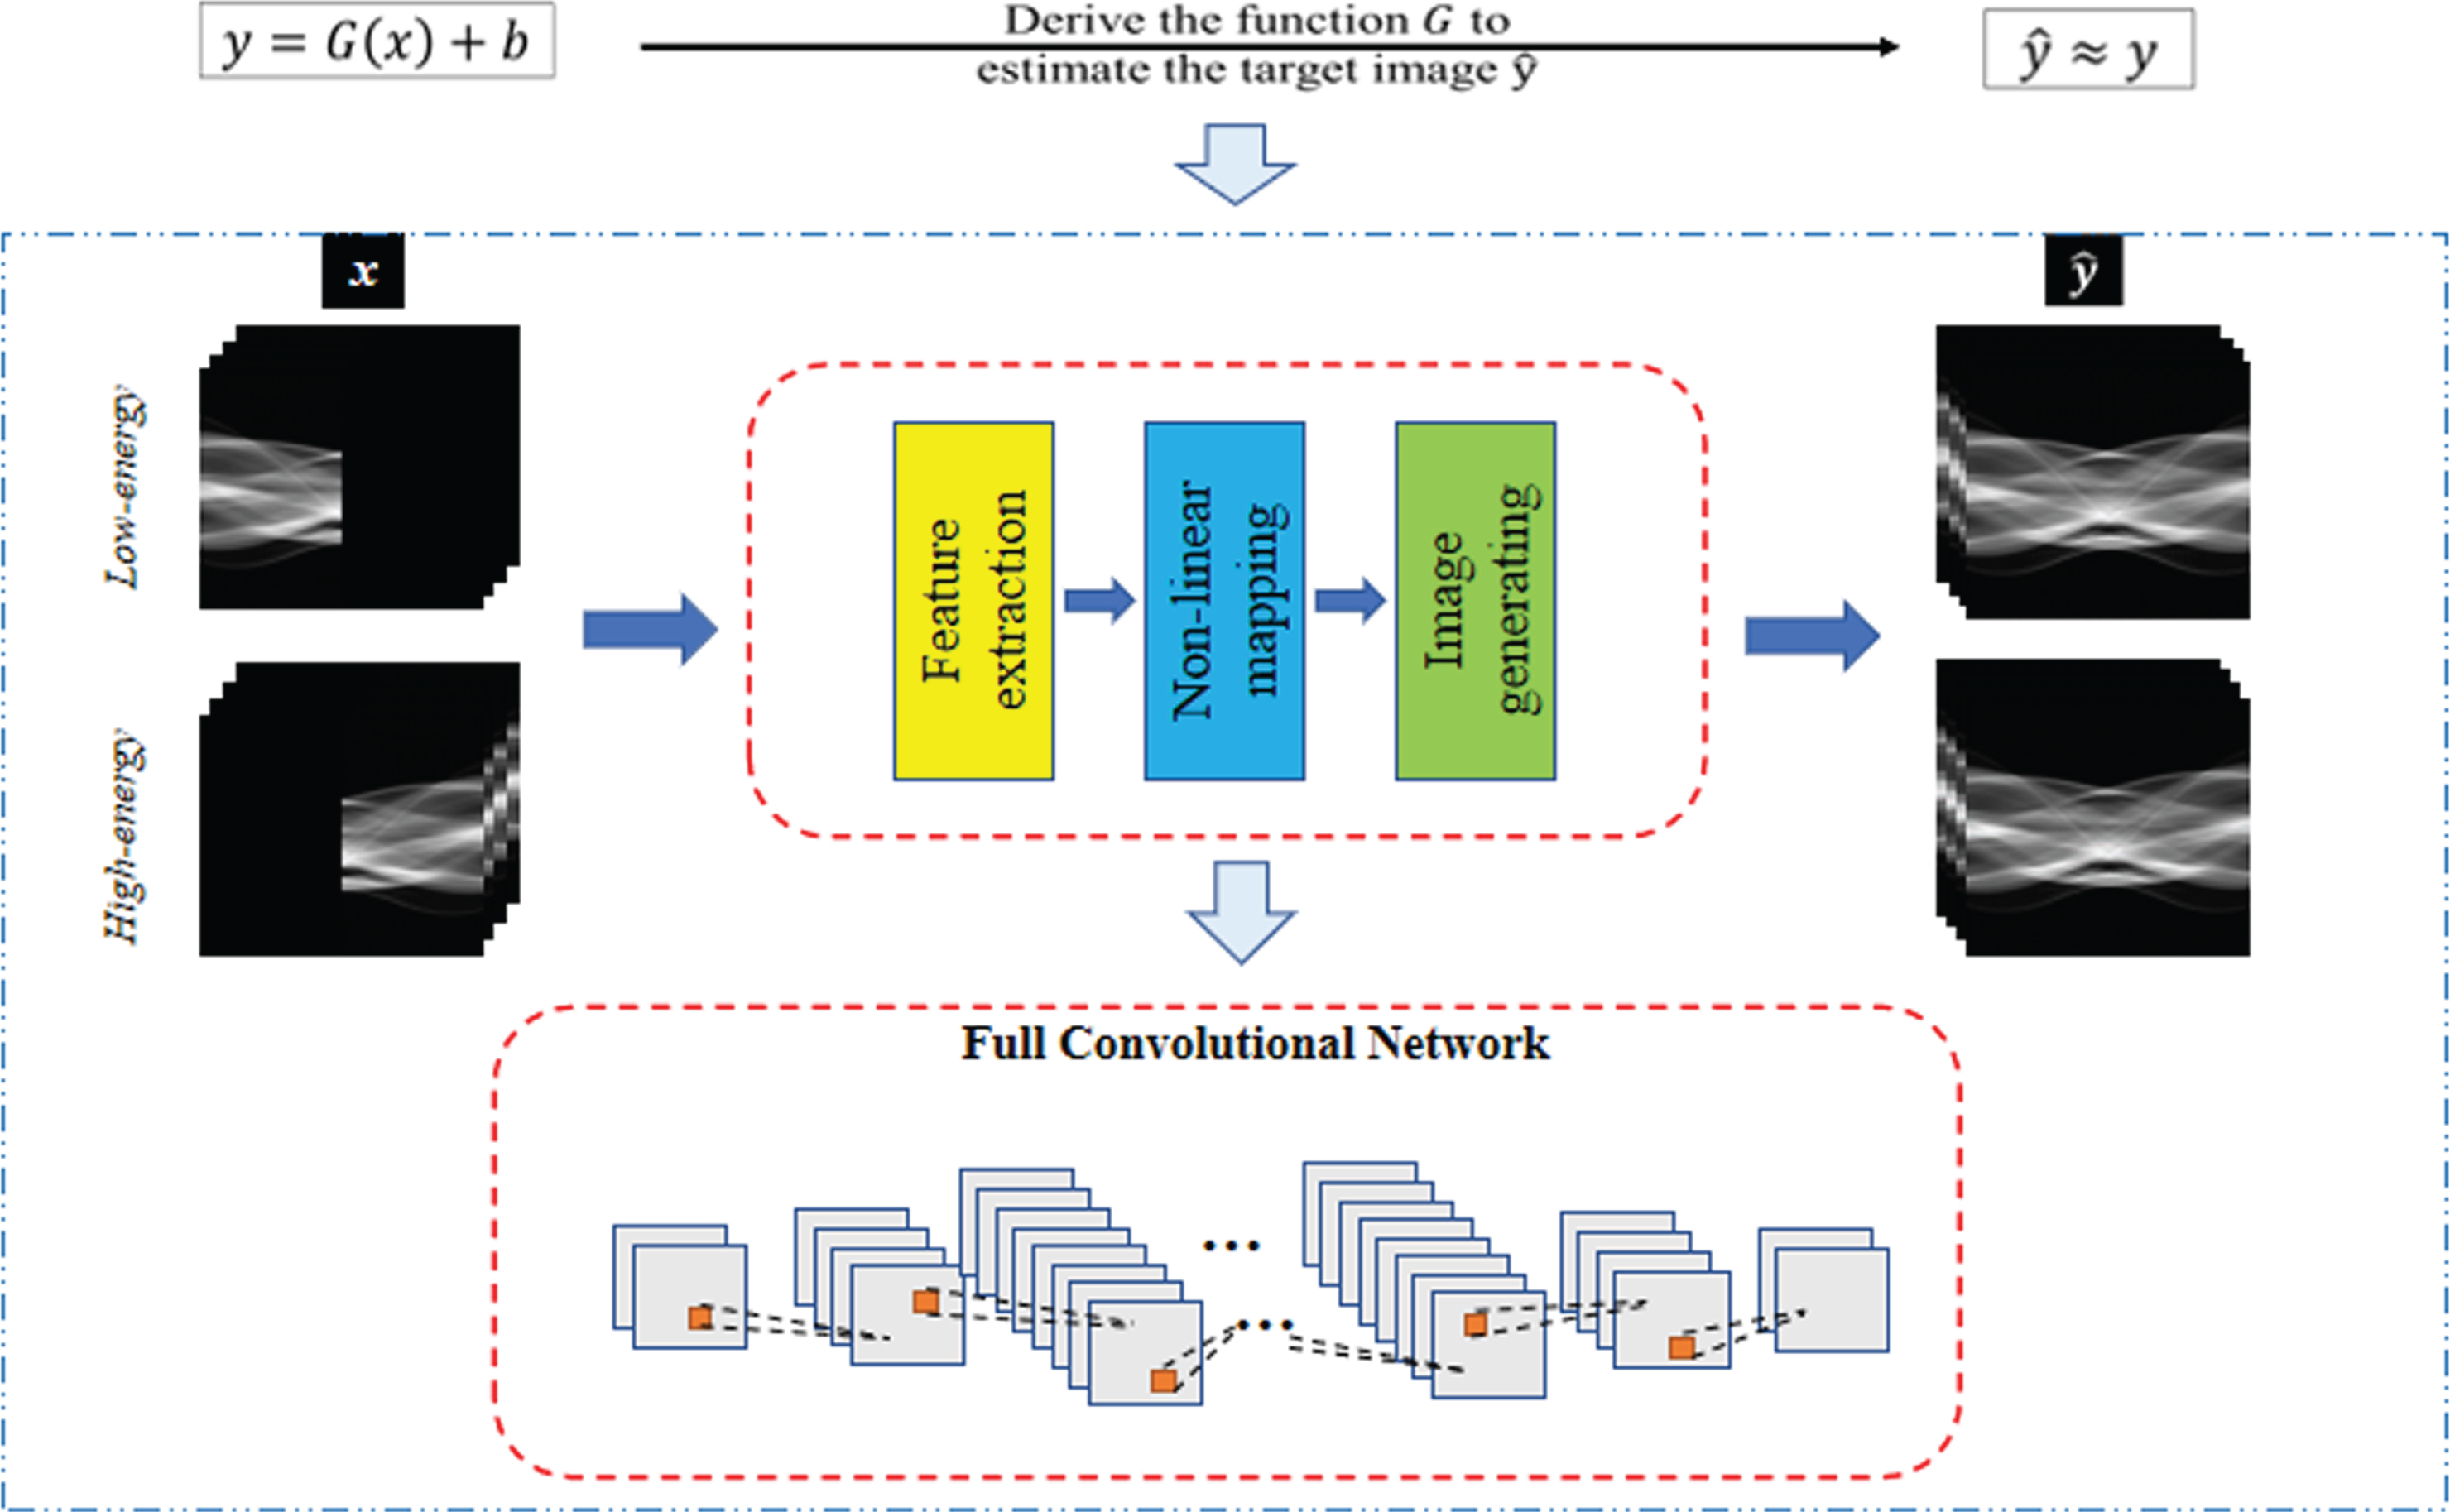
Figure 2 shows the architecture of the CSI-GAN. The generator G is used to transform the complementary limited-angle sinogram in the X domain into the corresponding 180° generated sinogram G(x,z) in the Y domain. The constrain G(x,z) is used to calculate the l1 norm of the difference between G(x,z) and real sinogram y. Discriminator D is evaluates the fidelity between G(x,z) and y. More specifically, the discriminator D is trained with y as a positive sample and G(x,z) as a negative sample. The generator G is optimized to continuously approach the generated image to the real image, thereby making the corresponding discriminator D blind.

The architecture of CSI-GAN. Z is random noise, and G(x,z) is sinogram from the generator G.
In this paper, inspired by conditional GAN (cGAN) learning conditionally constrained generative models, CSI-GAN is designed using the cGAN framework [36, 37]. Mathematically, cGAN’s loss function can be expressed as:
where P data means the real sinogram data distribution and P z (z) represents the random noise data distribution.
To ensure the authenticity of the estimated sinogram, we also added the sinogram loss to constrain the difference between the sinogram G(x,z) generated by the generator G and the corresponding 180° real sinogram y. Mathematically, the sinogram loss function can be expressed as:
where ∥x ∥ 1 denotes the sum of the absolute differences between the real image and the estimated image.
Combining the above two loss functions, the CSI-GAN’s loss function we proposed is defined as:
where λ is penalty coefficient.
In the network training, G tries to minimize the loss function against opponent D, whereas the opponent D minimizes the loss function. Thus, the objective function of the network can be described as:
The CSI-GAN contains a generator G and a discriminator D. As shown in Fig. 2, the main task of the G is to learn a nonlinear mapping from the X domain to the Y domain. Let x and y denote members in X and Y domains, respectively. The connection between the two is described as:
where z is random noise. G (·) denotes nonlinear mapping relationship between limited-angle sinogram and real sinogram, which is used to map the samples from the distribution P data (x) of x to the distribution P data (x, y) of y.
Generator’s working principle. The input of the network is the sinogram of different limited-angle positions from the dual- energy bins. Also, the corresponding 180° sinogram can be generated, which is conditioned on the real sinogram data.
The generator is a structure based on the U-Net architecture [38, 39], including an encoder and a decoder. Then, compared with conventional networks that first down-sample to low dimensions and then up-sample to the original encoder-decoder structure [40], the difference between the U-Net structure is the addition of skip-connection to retain pixel-level details at a different resolution. The design allows low-level information to be shared between input and output, ensuring that high-frequency information is preserved during down-sampling.
The following briefly describes the working principle of the Generator to generate the completed sinogram. Firstly, the input image is down-sampled. During the down-sampling process, there will be nine convolutional layers and multiple convolution kernels between each two convolutional layers. The purpose is to learn different features of the input and obtain multiple features correspondingly map. Thereby mining the data distribution characteristics of the projection domain and extract the sine feature of each voxel in the projection space. These feature maps often contain some details and texture information of the input image that can be recognized by the deep network. Then, the feature map obtained by down-sampling is up-sampled, and the purpose of which is to deconvolve the extracted features to obtain a generated image with the same size as the original image. After that, the loss information which is backpropagated to adjust the parameters for fitting the complex mapping relationship in the limited-angle projection completion problem. So as to realize the effective completion of the missing projection.
For discriminator D, the structure is a patch design discriminator [41]. This structure is effective in capturing local high-frequency features. Assuming that its output is an N × N patch, the probability values of all patches are averaged as the basis for discriminating the authenticity of the matched sinogram. The benefit of such a discriminator design is that the calculation process has fewer parameters, and the running time is reduced. In this paper, the patch size is set to 64×64 dimensions. The input to the discriminator is pairs of limited-angle at the dual-energy level and a corresponding 180° sinogram (i.e., real or fake). The discriminator D we designed in this paper is a fully convolutional network, as shown in Fig. 4.

The network structure for the discriminator D. The green arrow and the blue arrow indicate that the convolution operation is performed first. The difference is that the activation function of the former is a leaky rectified linear unit (LReLU) with a slope of 0.2, while the latter is sigmoid.
The specific part of the network structure includes encoder and decoder for the generator. The input is 90° sinogram images of size 512×512×1. The size of the convolution kernels of the first to third convolutional layers is 4×4, the overlapping step size is 2, and the number of filter kernel channels is set to 64, 128, and 256, respectively. The size of the last six layers of convolution kernel is 4×4, the overlap step is 2, and the number of filter kernel channels is set to 512. The activation functions of the nine convolutional layers are all LReLU with a slope of 0.2. Similarly, the decoder consists of nine convolutional layers corresponding to the decoder. Moreover, the convolution kernel size of the first to fifth layers is 4×4, the overlapping step size is 2, and the number of filter kernel channels is set to 512. The size of the last four layers of convolution kernel is 4×4, and the number of filter kernel channels is set to 256, 128, 64, and 1, respectively. The activation function of the full convolutional layer of the encoder is rectified linear unit. During network training, a total of 73.146 million parameters in CSI-GAN was learned.
Simulation experiment
In the simulation experiments, we established an experimental dataset from a real clinical dataset, which contains 1040 pairs of pleura 512×512 basis material images (including bone and tissue images) from 3 patients, and 740 pairs of cranial cavity 512×512 basis material images (including bone and tissue images) from three other patients. Based on the DECT discrete projection model, the basis material images are used to generate dual-energy projection images (The transformation process is shown in Equation 13). To train the CSI-GAN network, 1500 pairs of dual-energy projection images of 4 patients were selected from 6 patients as training samples, and 100 pairs of dual-energy projection images of the other two patients (One pleural patient and one cranial cavity patient) were selected for testing. Each slice of these two datasets contains two structures of bone and tissue. Table 1 shows the training sample making process.
The process of making training samples
The process of making training samples
For the test dataset of the CSI-GAN, we prepared 100 DECT images different from the training dataset. The DECT images of the pleura and cranial cavity are used to test the reconstruction effect of different parts. The test dataset production process refers to the first three steps of the training dataset production process.
All training works in this experiment were performed on the Pytorch toolbox (ver. 0.4.1) running on a Lenovo Y-9000 workstation with single Intel(R) Core (TM) i9-9900 CPU @ 3.10 GHz. And we used single NVIDIA TITAN V GPU (NVIDIA Corporation) for training and testing. We applied the Adam optimizer of CSI-GAN, and the exponential decay rate of moment estimation is β1 = 0.9 and β2 = 0.999. The total training process has nepochs = 600. In the first half of the training process, the learning rate is fixed at 0.0004, whereas in the second half of the training process, the learning rate decreases linearly from 0.0004 to 0. In the simulation experiment, the high- and low-energy tube voltage was set to 140 kVp and 80 kVp, respectively. The batch processing size was set to 16, and the total training time was 60 hours.
To evaluate the completion capability and performance of the CSI-GAN in the face of complementary limited-angle problems, the conventional FBP, SART-TV, and Patch-GAN methods were also performed. We adjust the parameters of SART-TV according to experience to obtain excellent performance. During the training and testing phase, we set the parameters of SART-TV to 20 steps of TV, and the simulation factors are α = 0.01 and α s = 0.95. α represents the maximal step for the steepest descent, α s the decreasing scale of α after each computation.
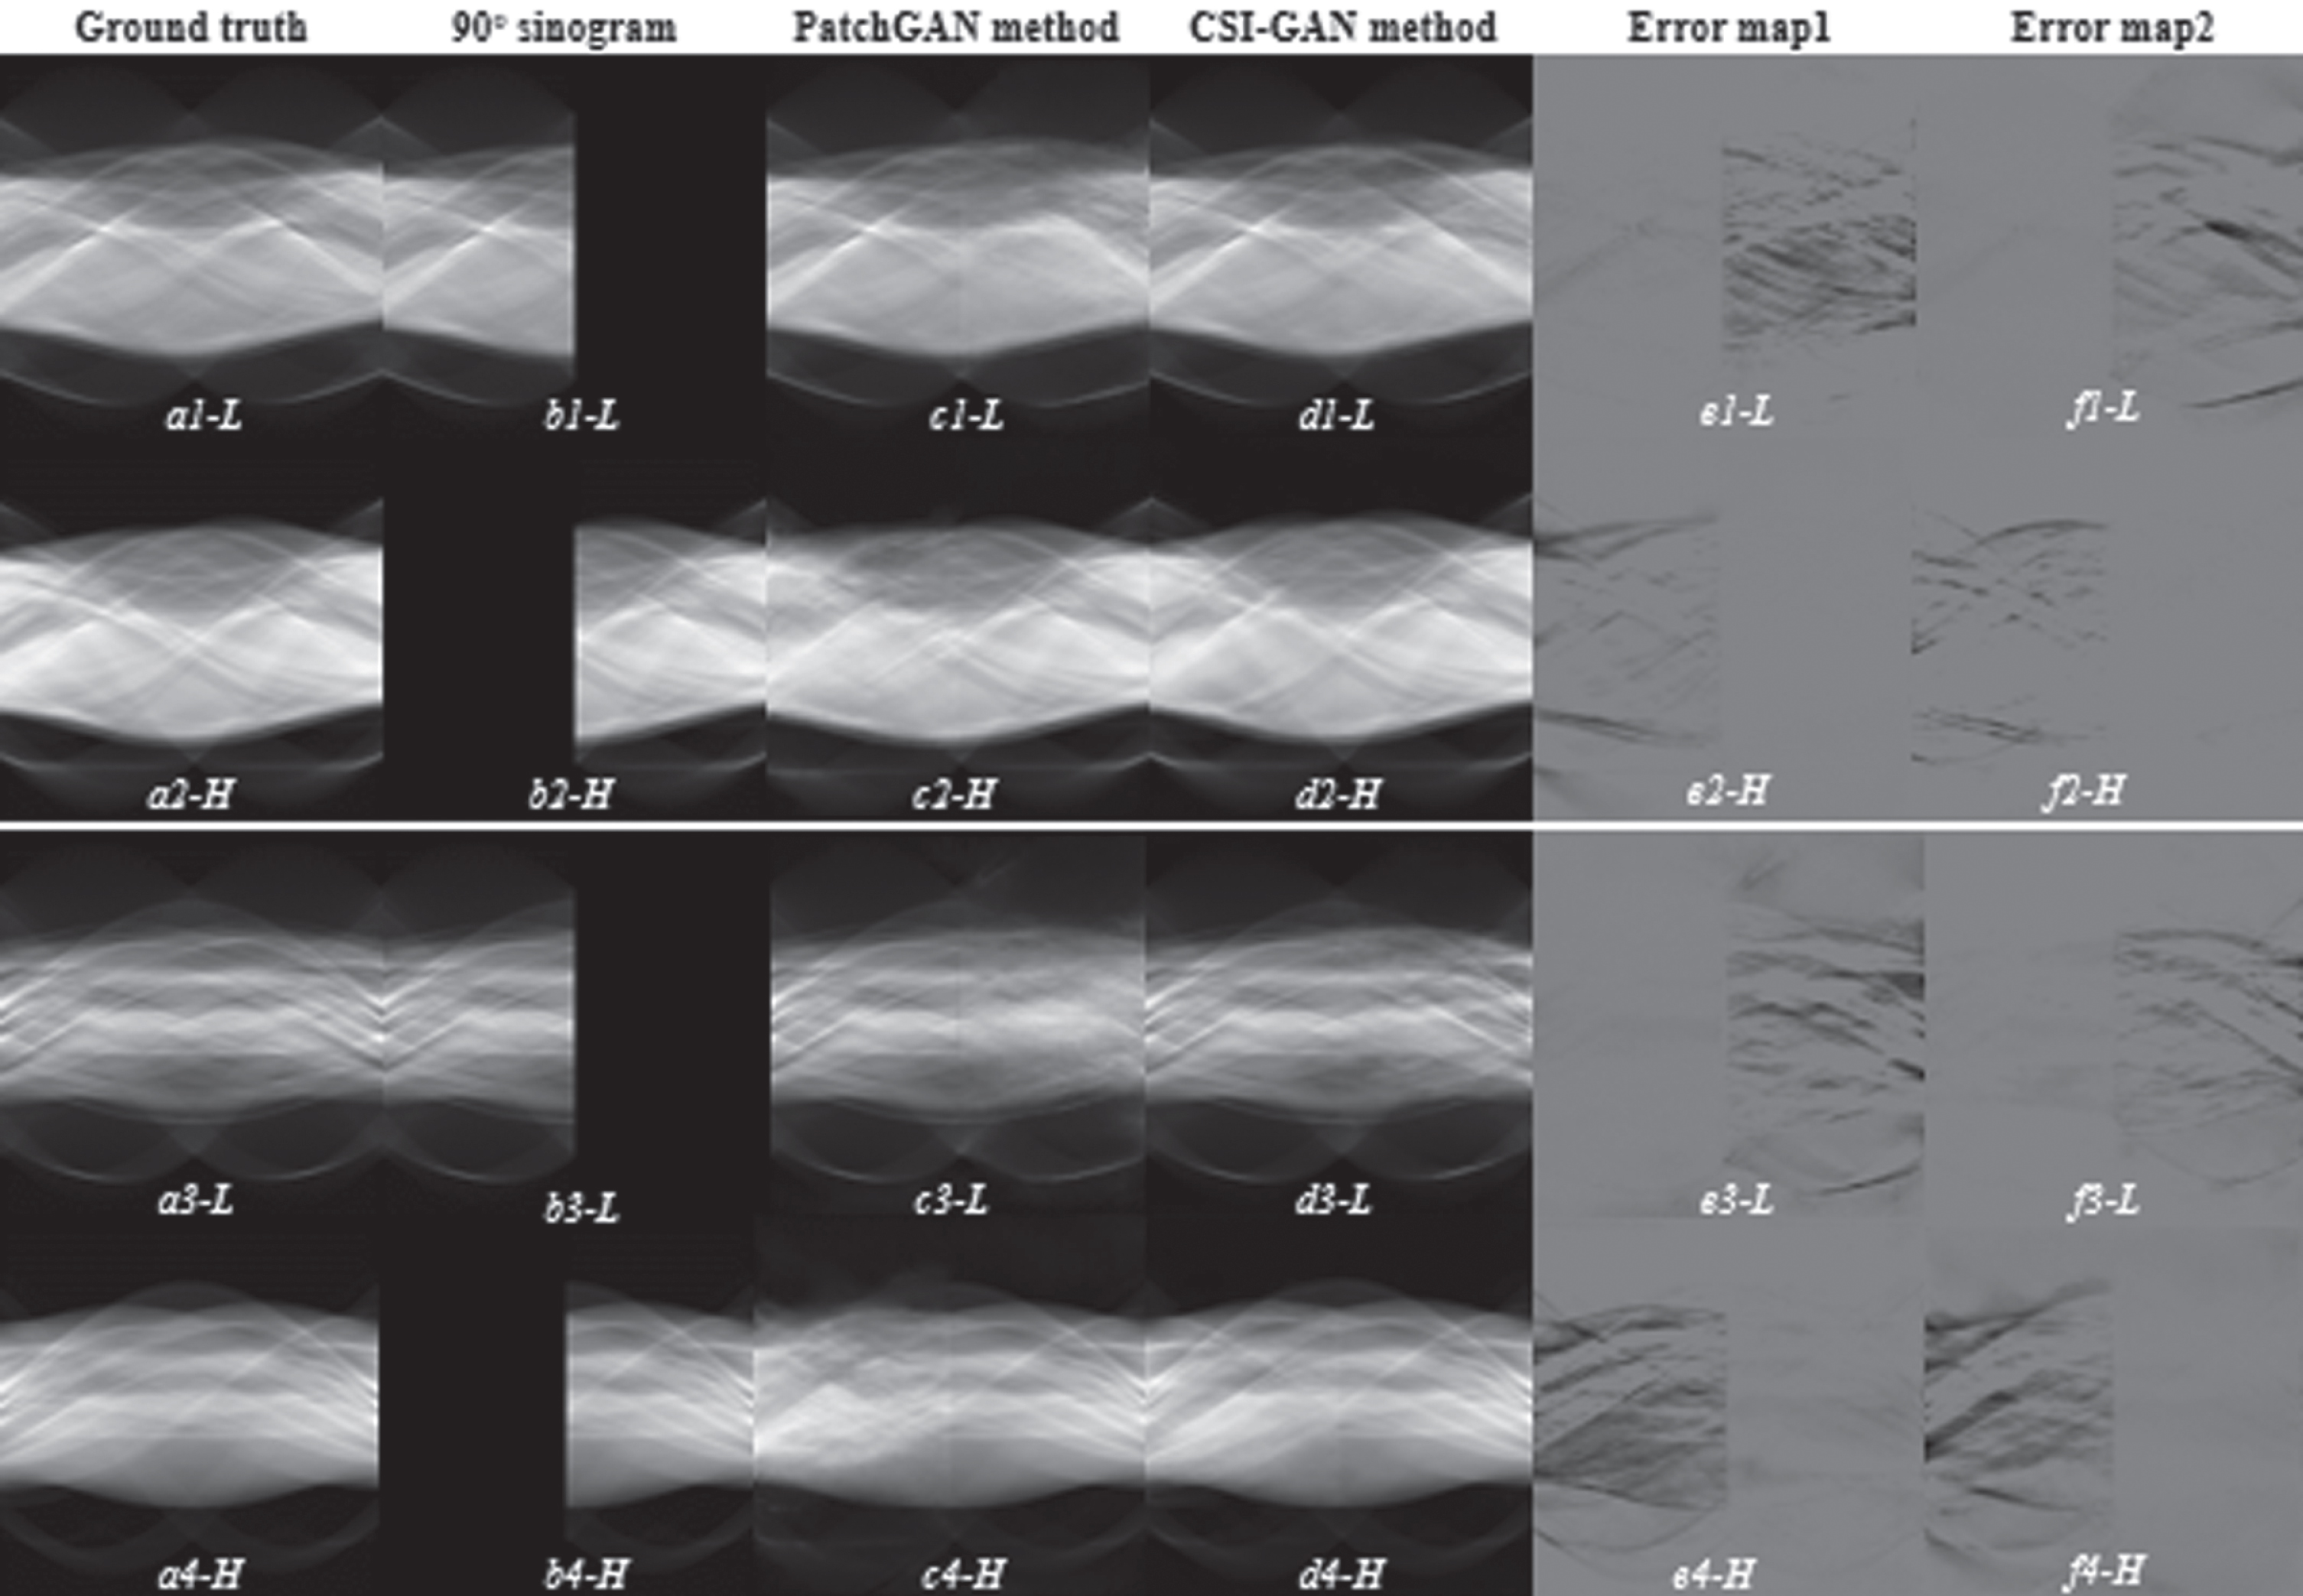
Using two datasets, we first compare the CSI-GAN with other methods in the following complementary-sinogram-inpainting task: pleural (Figs. 5 and 6) and cranial cavity (Figs. 9 and 10). Figures 5 and 9 show the results of the inpainting sinogram, though the sinogram of the two network completions is not significantly different from the naked eye. However, from the error data in the last two columns of the figure, it can be seen that the CSI-GAN is also superior to Patch-GAN in terms of clarity of output and fidelity of the input image. From Figs. 6 and 10, we show the four images reconstructed using different methods. In the absence of specific information in the projection domain, the reconstructed image quality of the FBP method and SART-TV method is poor, and the artifacts are severe. So, it is impossible to obtain precise details and edge information in the image. The outcome indicates that the traditional reconstruction algorithm is difficult to reconstruct high-quality images when the angle range of the missing projection data is too large. However, when the proposed method is used to complete the sinogram information first, then the FBP or SART-TV reconstruction method can be used to obtain excellent image effects. Compared with the reconstructed image generated by Patch-GAN, the image created by the CSI-GAN will not be blurred, and it can better retain the content structure in the input and capture the characteristics of the target domain. The improvements are attributed to sinogram loss.
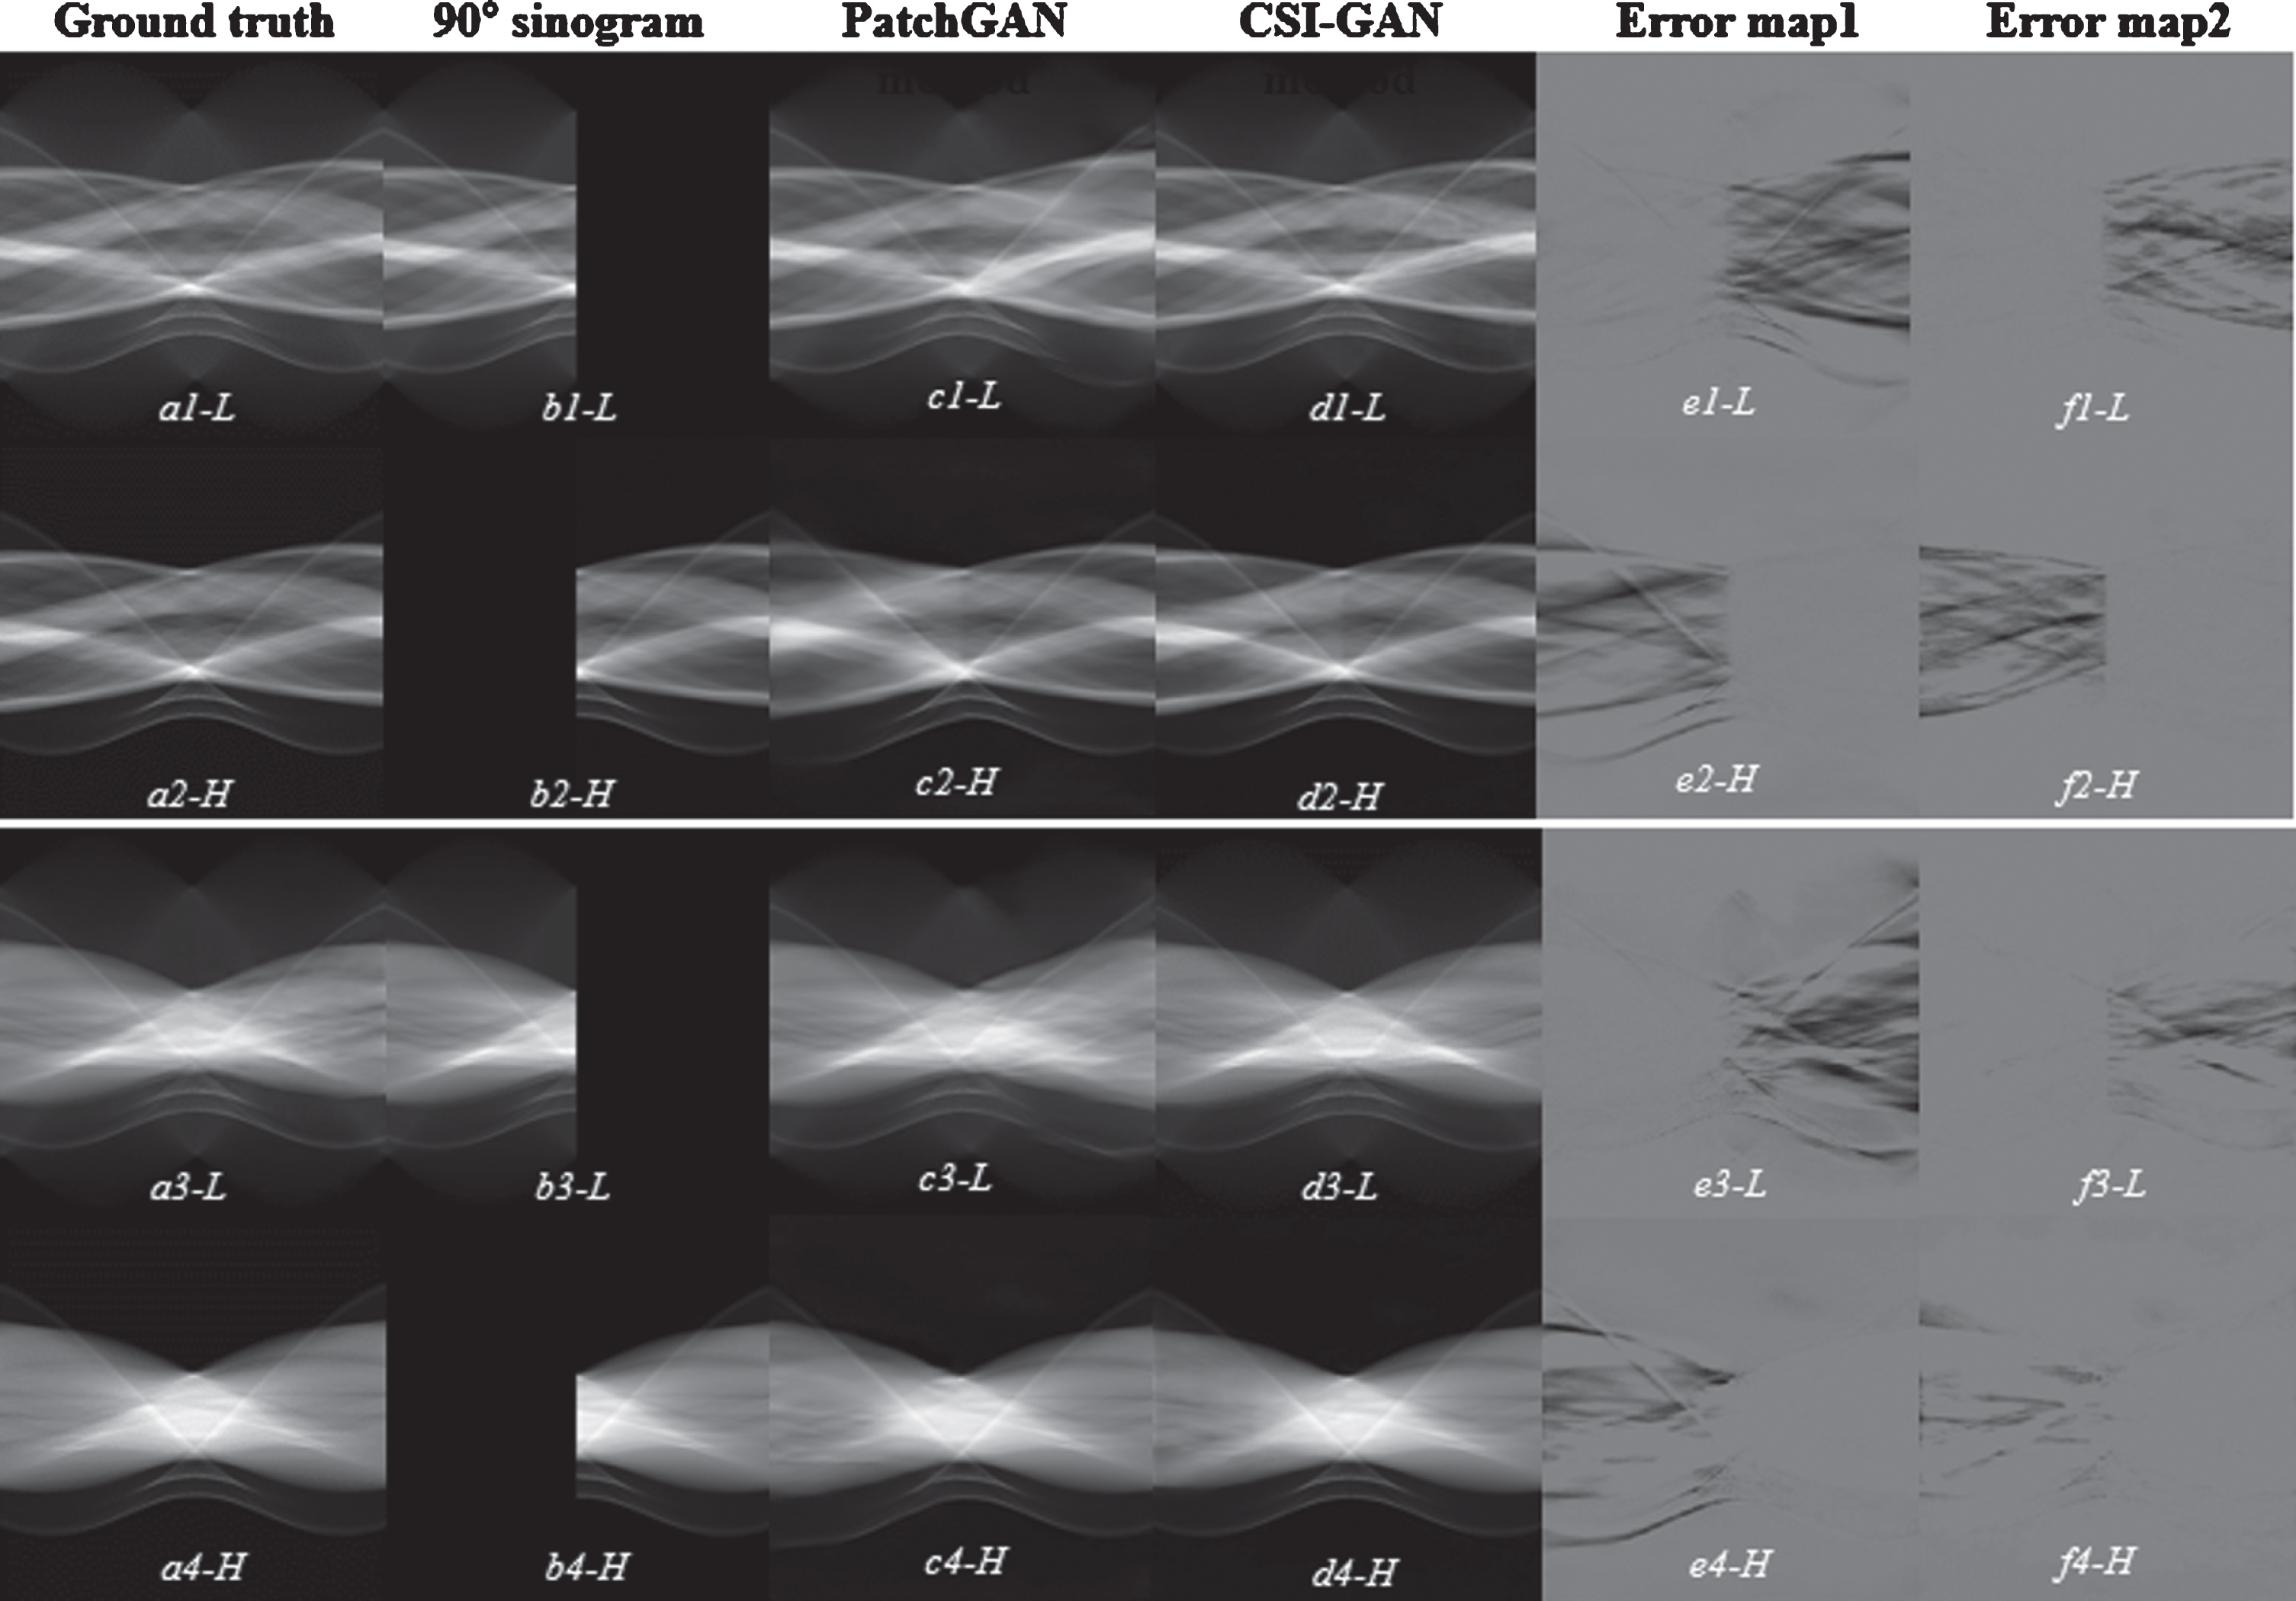
Inpainting sinogram results from the pleural CT slices. (a) the ground truth is 180° sinogram, (b) 90° limited-angle sinogram as input to the network, (c) estimated 180° sinogram by Patch-GAN, (d) estimated 180° sinogram by CSI-GAN, (e) error between (a) and (c) data, (f) error between (a) and (d) data. The (–H) and (–L) of normal dose using the high-energy of 140 keV and the low-energy of 80 keV simulations, respectively. The display window of (a)–(d) is [0,1]. The display window of (e) and (f) is [–0.09 0.09].
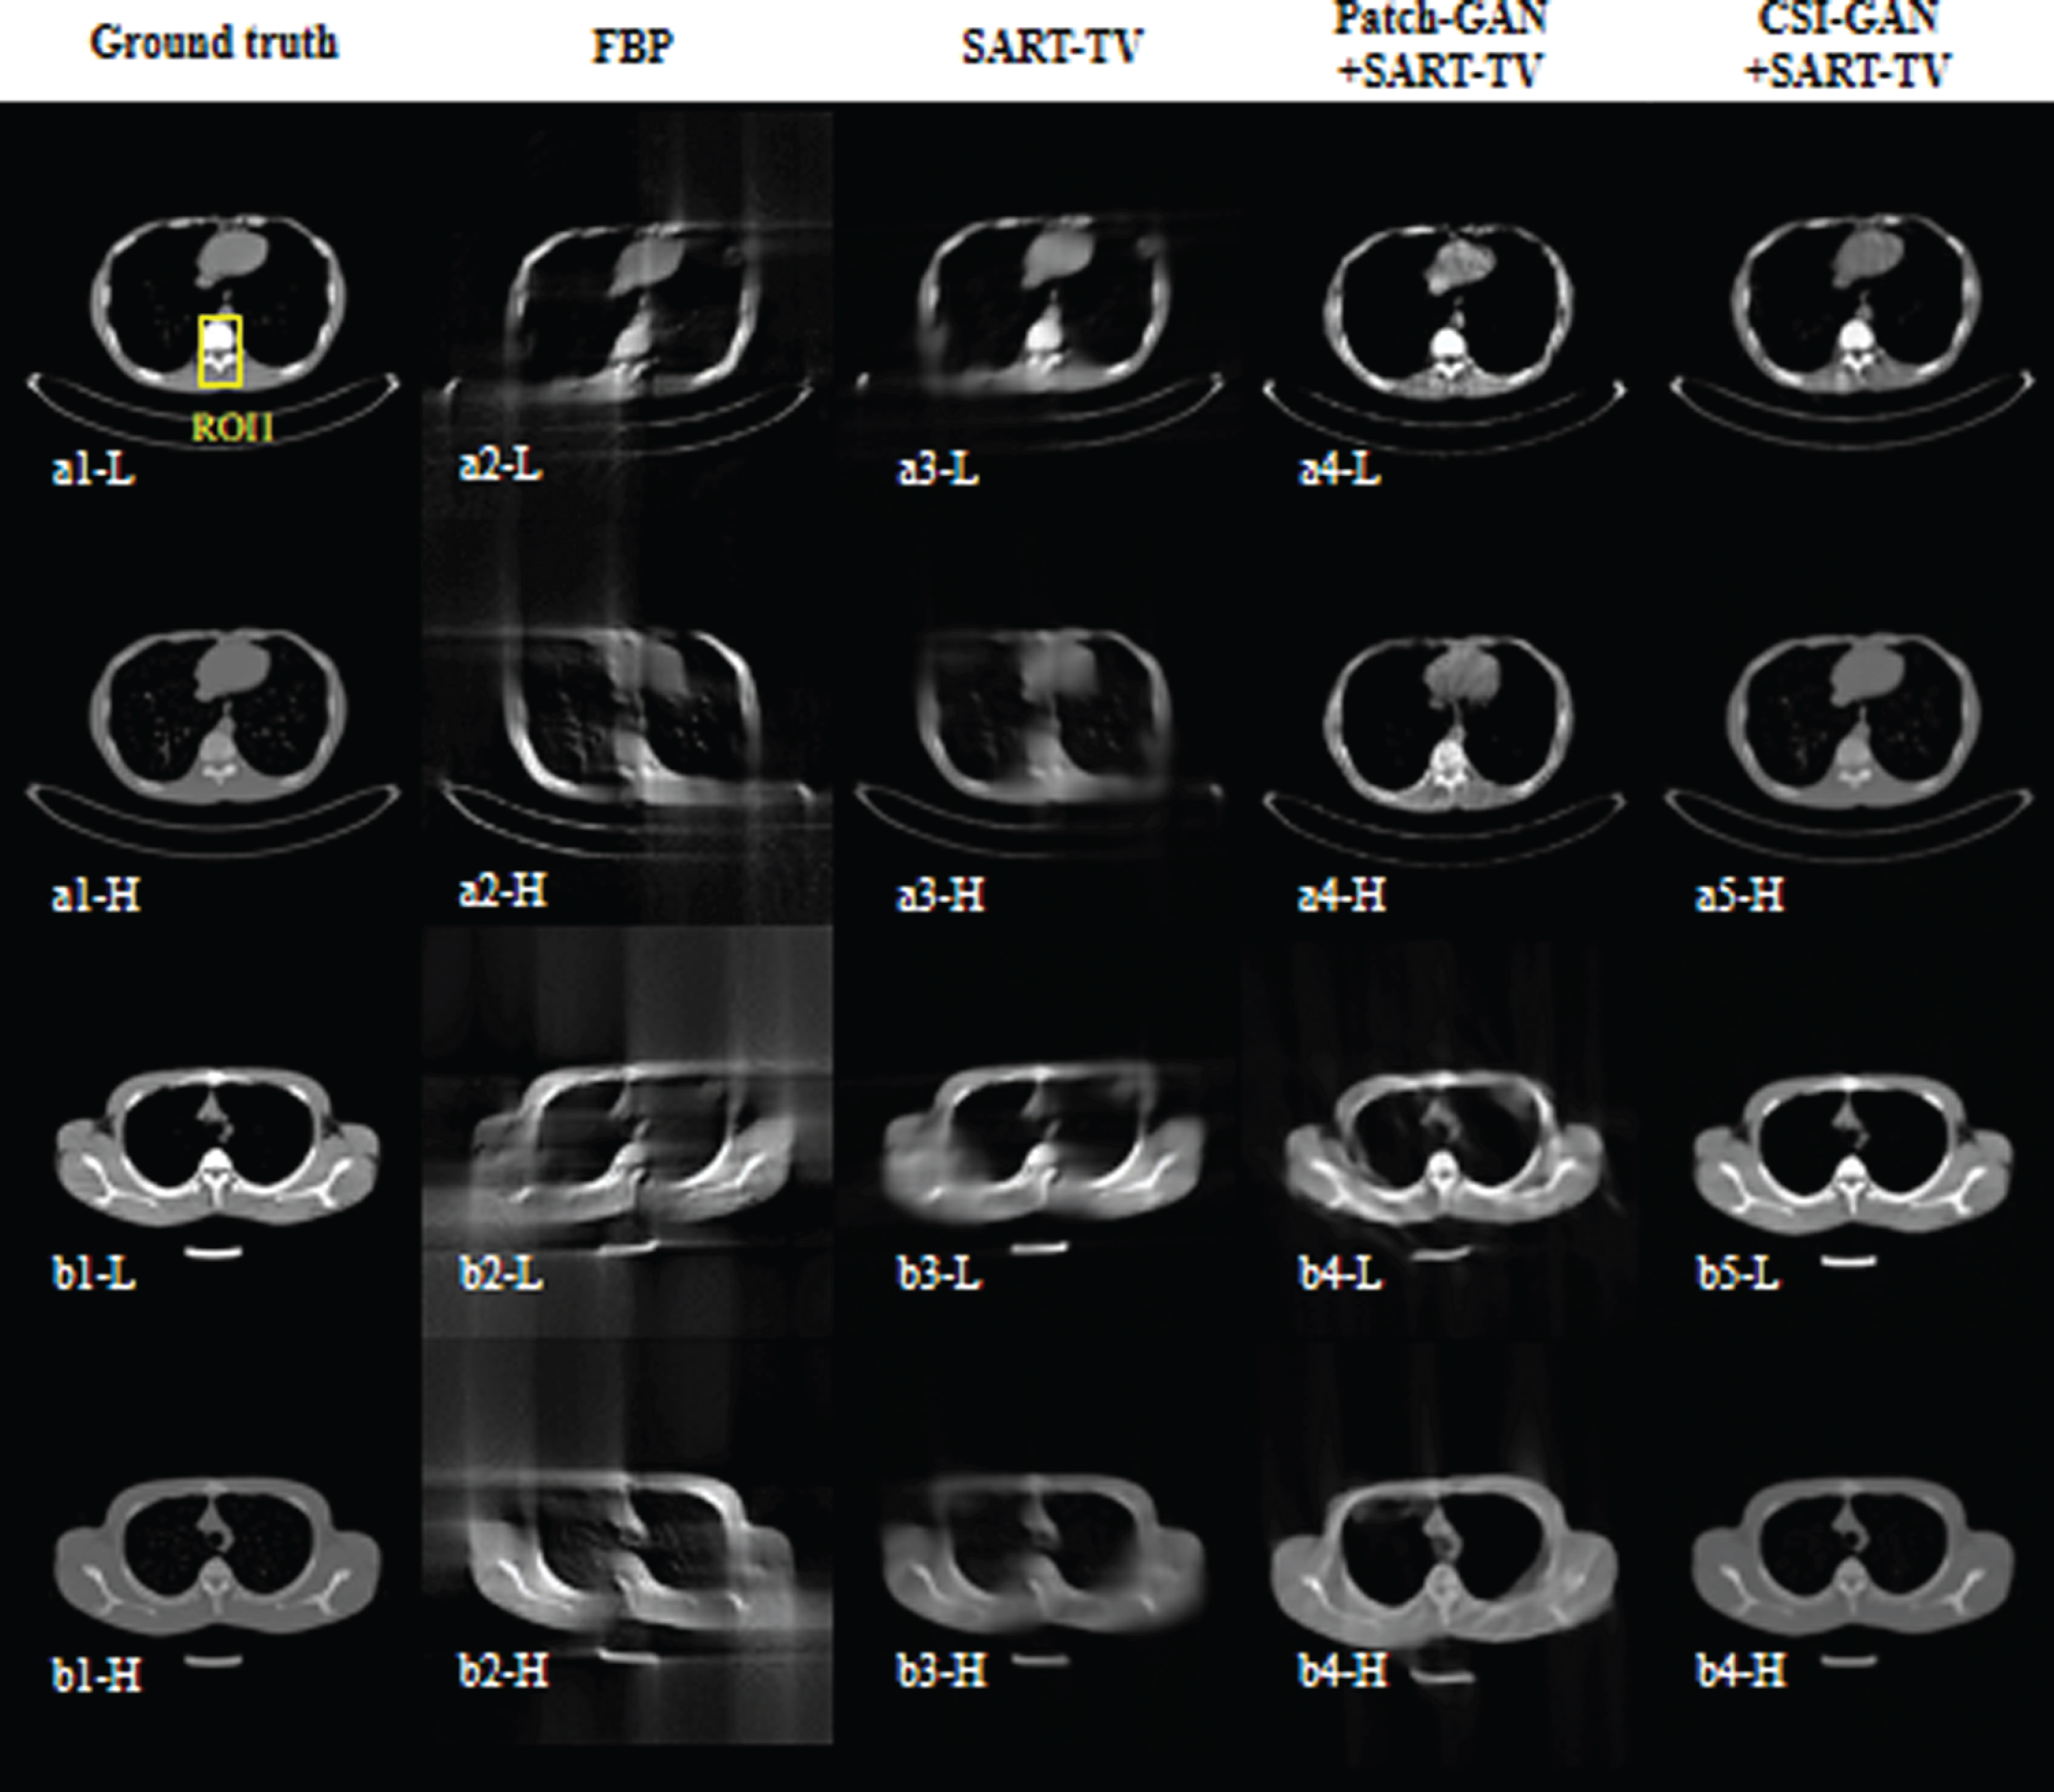
Reconstruction results from the pleural CT slices. The left to right columns represents the reference images and the reconstruction results of the FBP, SART-TV, Patch-GAN + SART-TV, and CSI-GAN + SART-TV, accordingly. The display window is [0,1].
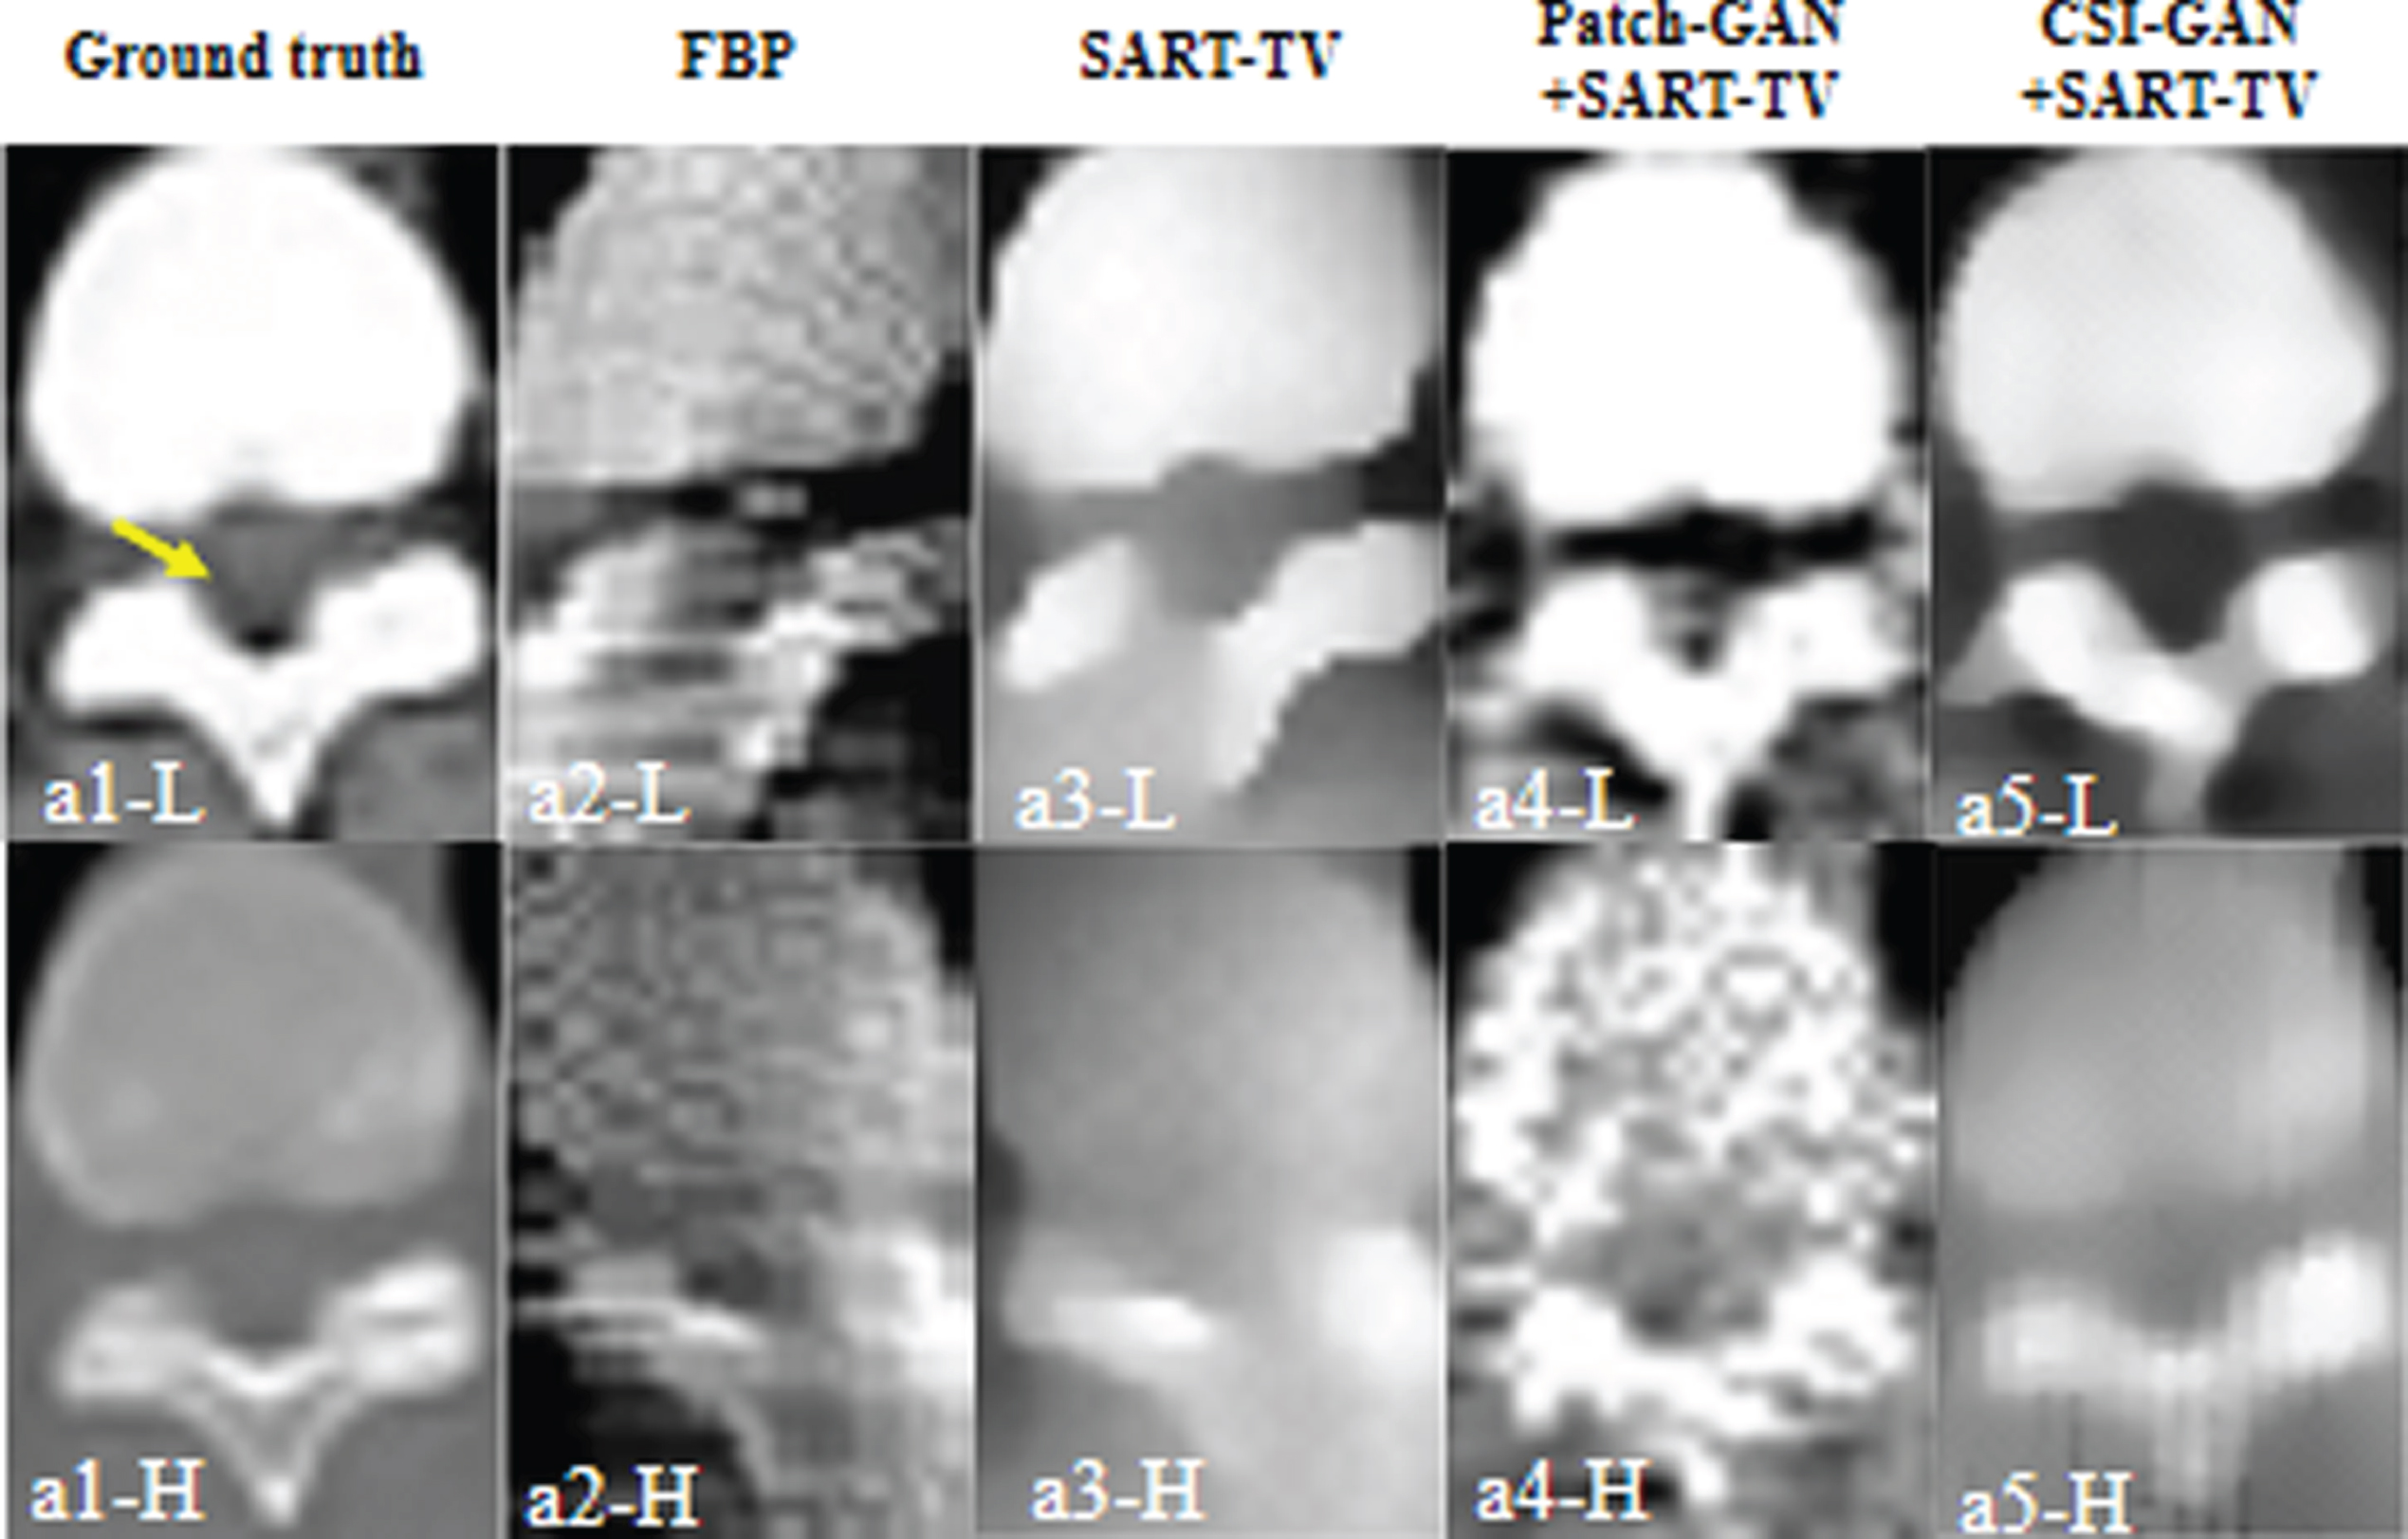
The magnified region of interest (ROI) of reconstruction results (denoted by a solid yellow line in Fig. 6). Left to right columns represent the ROIs of the reference images and the reconstruction results of FBP, SART-TV, Patch-GAN + SART-TV and CSI-GAN + SART-TV. The two rows represent the dual-energy ROI of the reconstructed image. The display window is [0,1].

Decomposition results of bone and tissue basis materials based on reconstructed images. The left to right columns represents the decomposition results of reference images, Patch-GAN + SART-TV and CSI-GAN + SART-TV. Top to bottom represent bones and tissues. The display window of bone and tissue basis material is [0.2 0.8] and [0.1 0.3], respectively.
Inpainting sinogram results from the cranial cavity CT slices. (a) the ground truth is 180° sinogram, (b) 90° limited-angle sinogram as input to the network, (c) estimated 180° sinogram by Patch-GAN, (d) estimated 180° sinogram by CSI-GAN, (e) error between (a) and (c) data, (f) error between (a) and (d) data. The (–H) and (–L) of normal dose using the high-energy of 140 keV and the low-energy of 80 keV simulations, respectively. The display window of (a)–(d) and (e) and (f) is [0,1] and [–0.09 0.09], respectively.

The reconstruction results from cranial cavity CT slices.
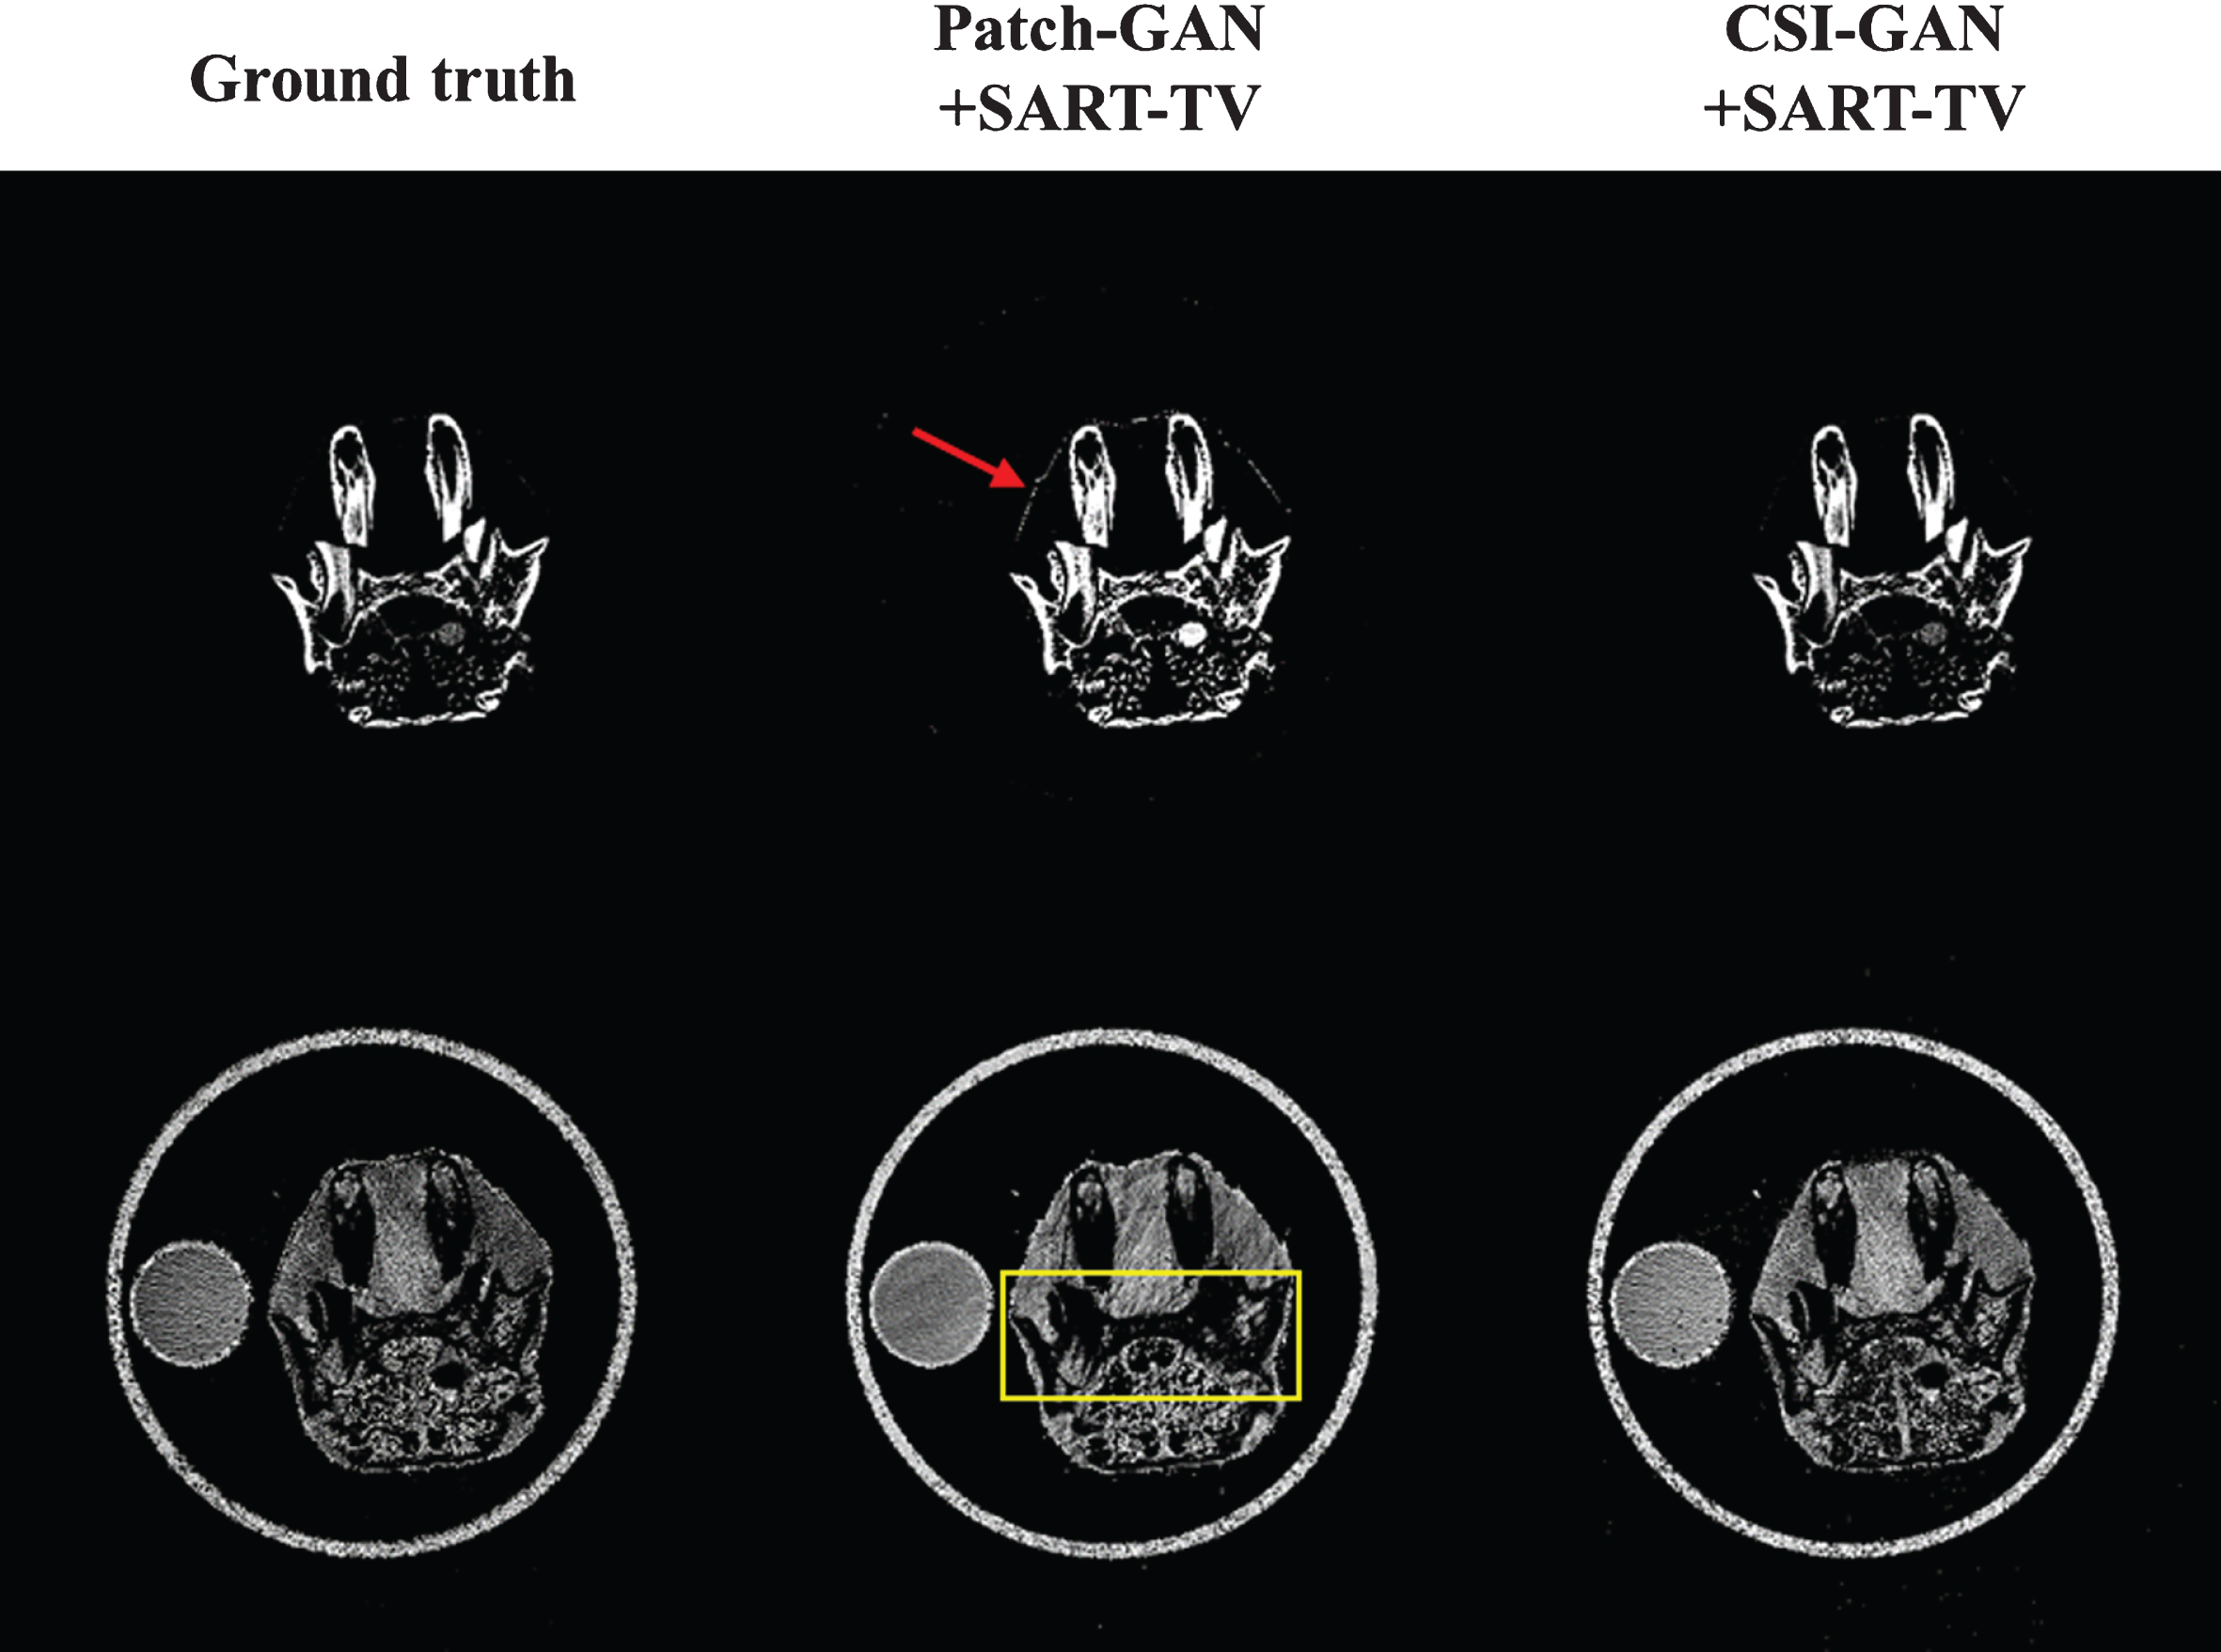
To observe the details of the reconstructed image, we selected the slices from the pleura and cranial cavity for analysis and then selected two regions as ROI. From Figs. 7 and 11, the reconstruction result of the FBP method contains many artifacts, as the shape of the object cannot be distinguished. The SART-TV method has better image quality than FBP, but there are still severe directional artifacts problems. Then we can visually compare the Patch-GAN + SART-TV and CSI-GAN + SART-TV methods. The Patch-GAN + SART-TV method can observe errors in the ROI area, that is, the structure in the ROI area is blurred, and there are severe artifacts. Besides, bones and tissues cannot be well distinguished, which creates a lot of trouble for the subsequent multiple materials decomposition. The difference between the CSI-GAN + SART-TV results and the actual situation is almost non-existent. The proposed method has apparent image details at the positions shown by the arrows, and no obvious errors are observed. This means that the proposed method has some advantages in terms of detail reduction and blur reduction.
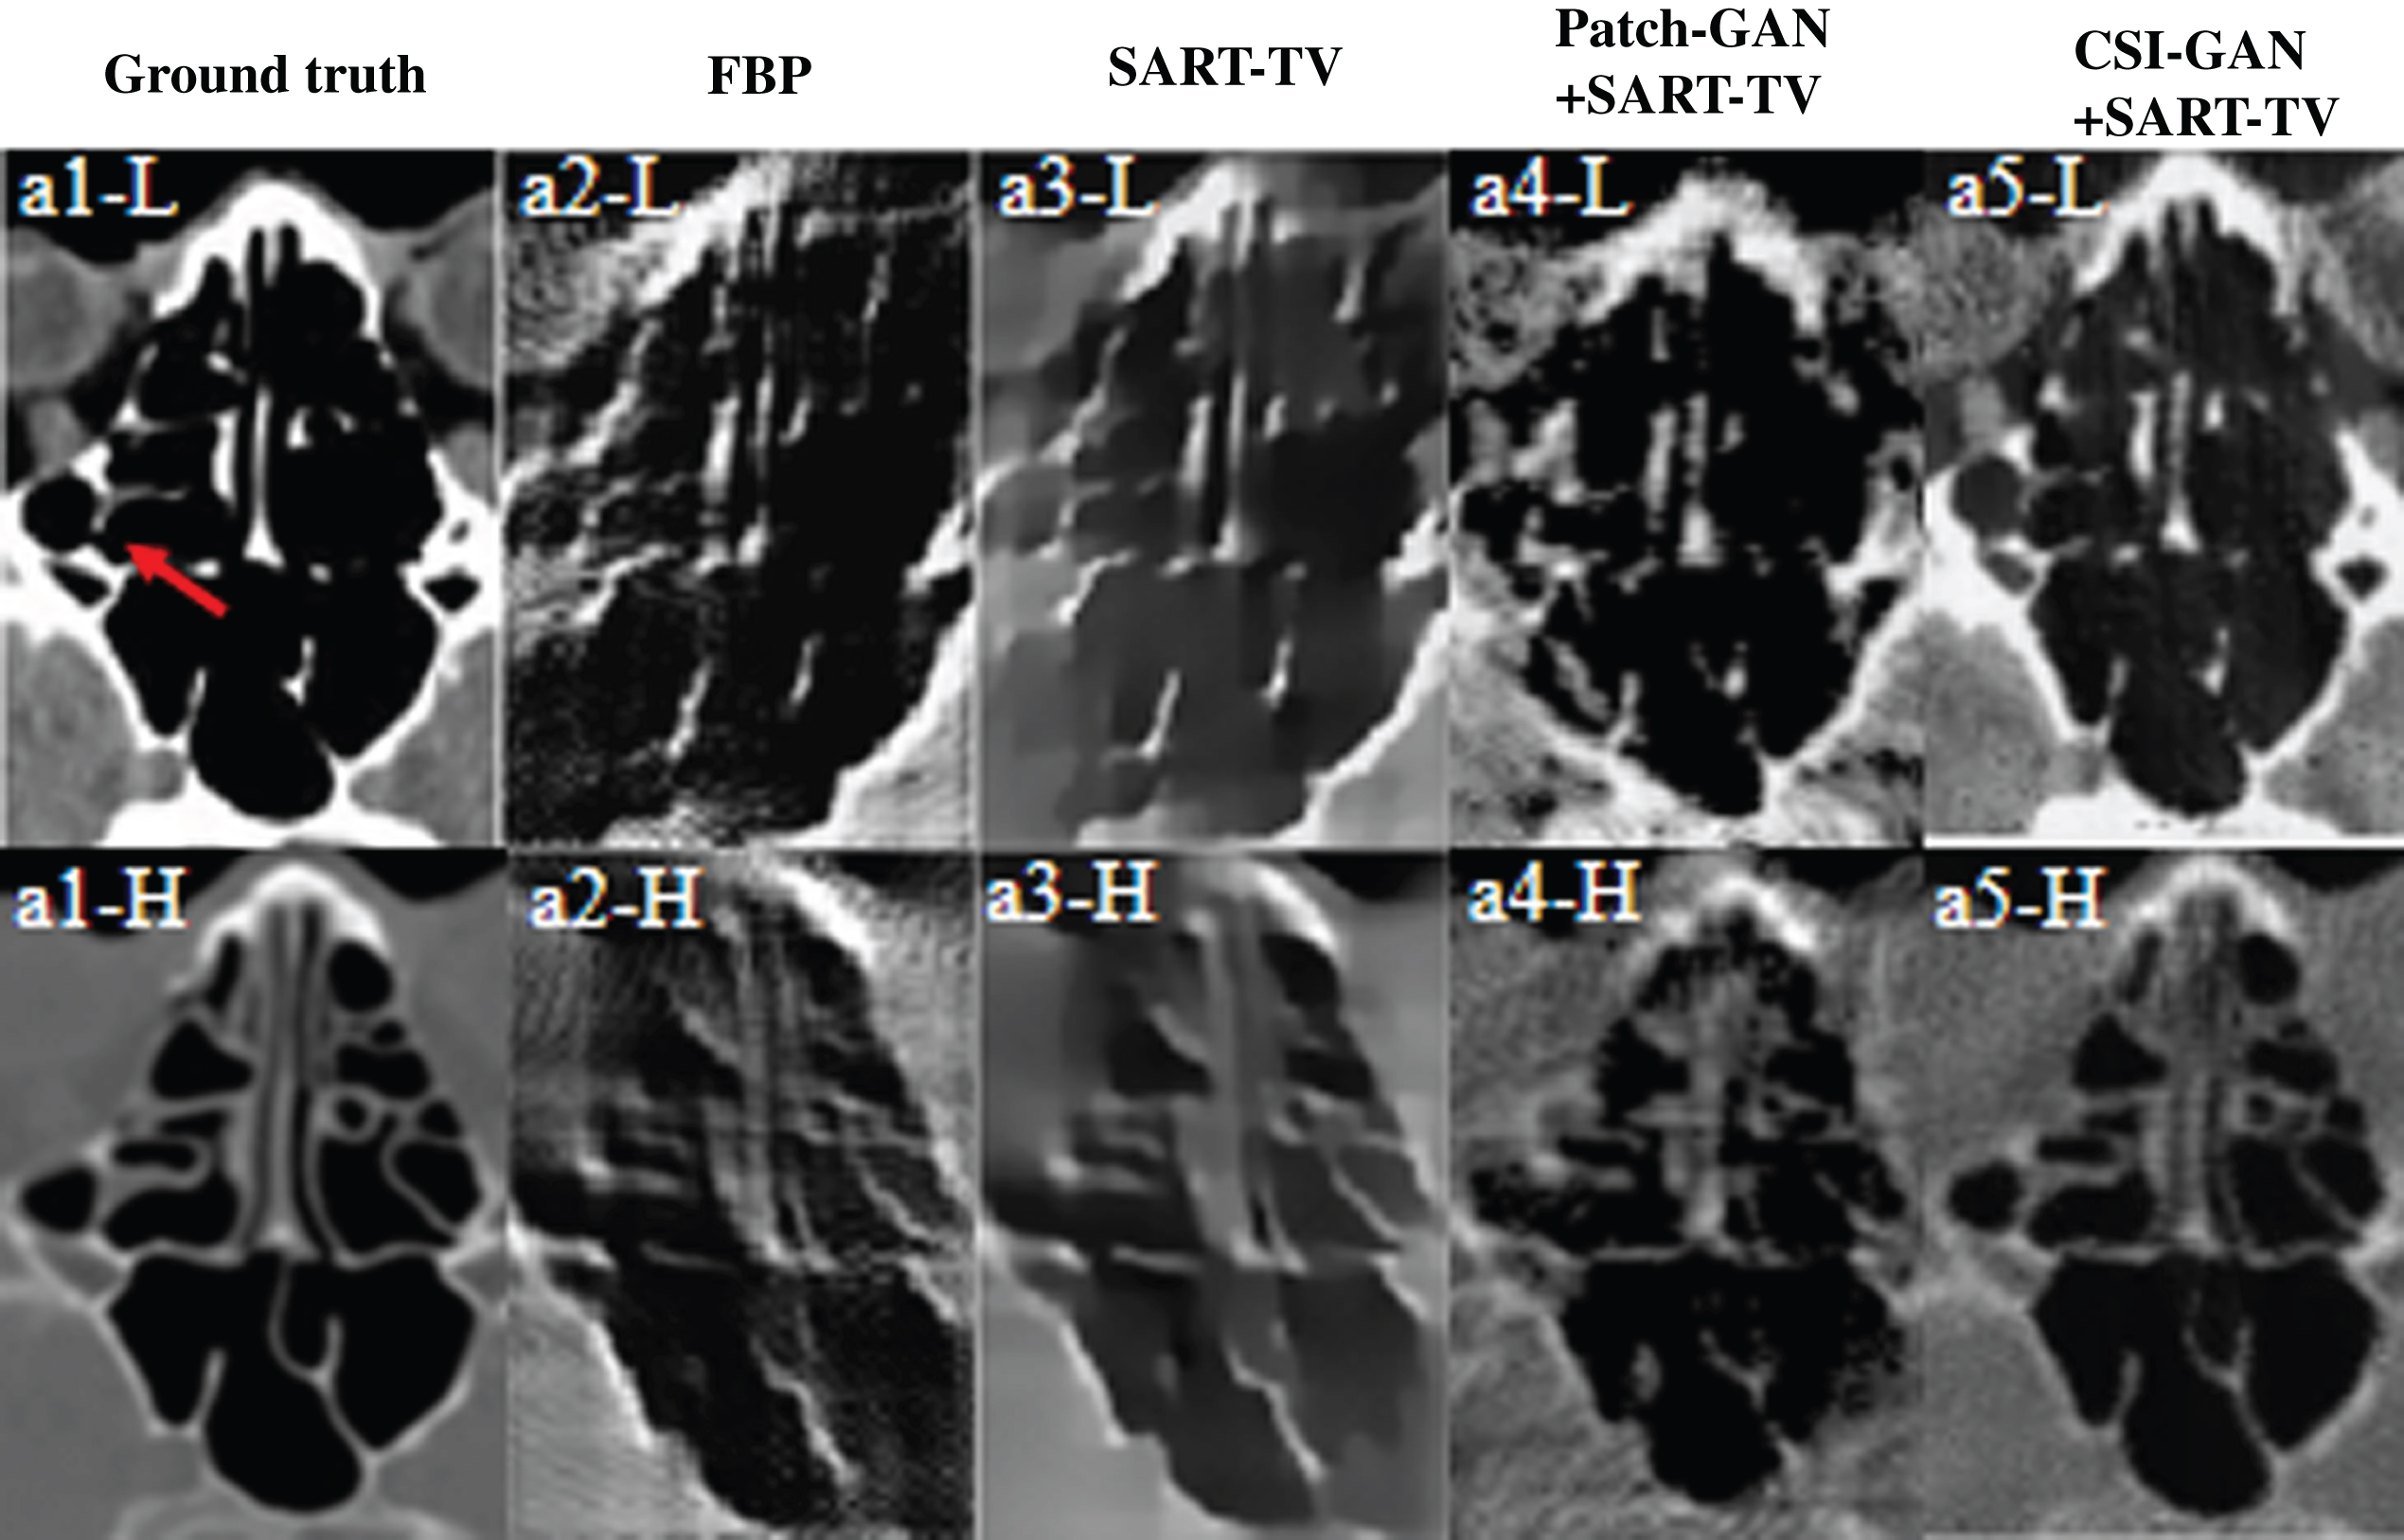
The magnified ROIs of reconstruction results (denoted by a solid red line in Fig. 9). The left to right columns represents the ROIs of the reference images and the reconstruction results of FBP, SART-TV, Patch-GAN + SART-TV and CSI-GAN + SART-TV, accordingly. The two rows represent the dual-energy ROI of the reconstructed image. The display window is [0,1].
Figures 8 and 12 show the decomposition results of the pleural and cranial cavity basis materials. The columns from left to right represent the decomposition results of reference images, Patch-GAN and the proposed method based on the reconstruction images at low- and high-energy spectra. As shown in Fig. 8, we can clearly see that the results of the material decomposition of the Patch-GAN method are not ideal. And in the result of Patch-GAN method decomposition in Fig. 12, there are problems with blurred edges and serious artifacts. And again, the proposed method in this paper can effectively reduce the decomposition noise and intuitively provide clear edge results.

Decomposition results of bone and tissue basis materials based on reconstructed images. The left to right columns represents the decomposition results of reference images, Patch-GAN + SART-TV and CSI-GAN + SART-TV. Top to bottom represent bones and tissues. The display window of bone and tissue basis material is [0.2 1.0] and [0.1 0.22], respectively.
To evaluate the CSI-GAN, we chose three quantitative indicators to measure the quality of the reconstructed image compared with the ground truth images under different methods. The methods include root mean square error (RMSE), peak signal to noise ratio (PSNR), and structural similarity (SSIM). The smaller the RMSE value or, the more significant the PSNR value, the lower the distortion of the reconstructed image. Moreover, the SSIM measures image similarity from three features: brightness, contrast, and structure. Generally, the value range of the SSIM is [0,1]. The larger the value, the smaller the image distortion. The RMSE and PSNR are calculated as follows:
where R real (i) represents the number of ground truth CT images at i pixel, R fake represents images reconstructed from sinogram output by the CSI-GAN or Patch-GAN, and N represents the total pixel of the image.
Further, we analyzed the results of reconstruction of the pleural and cranial cavity CT slices using different methods, as shown in Table 2 of Fig. 6 and Table 3 of Fig. 10. The experimental results show that the CSI-GAN outperforms Patch-GAN on sinogram completion tasks of complementary limited-angle problems. From the pleural results, the SSIM of the reconstructed dual-energy sinogram of the CSI-GAN reached 0.8154/0.8384 (low-/high-energy), which demonstrate that the image is very close to the ground truth in terms of brightness, contrast and structure. Compared with the Patch-GAN network, the proposed CSI-GAN method further improves the PSNR by 28.56% /24.34% and reduces the RMSE from 0.0602 to 0.0356/0.0448 to 0.0218. Similarly, the results of the cranial cavity also suggest that the proposed method performs well in sinogram inpainting and produces small errors in the reconstructed image.
Quantitative results related to different methods in Fig. 6
Quantitative results related to different methods in Fig. 6
Quantitative results related to different methods in Fig. 10
To further reflect on the advantages of the method proposed in this paper, we study the sinogram loss function of the two networks. Figure 13 is the convergence curve of the Patch-GAN and CSI-GAN regarding the loss of the sinogram. In the first 40 epochs, the loss curves of the Patch-GAN and CSI-GAN overlapped. After 40 epochs, the gap between the two network structures gradually manifests; then, the loss of CSI-GAN is always lower than that of Patch-GAN, indicating that the CSI-GAN is better than Patch-GAN in the ability to inpainting sinogram. After 500 epochs, compared with the Patch-GAN, it can be observed that the fluctuation amplitude of the CSI-GAN loss curve is small and infrequent, indicating that the CSI-GAN has better stability and is less sensitive to the noise of the input data. The small picture in the figure is the enlarged area of the black rectangular frame. It shows that the difference between the convergence curves of the two network structures is about 0.2. And the CSI-GAN’s loss is stable below 0.8. Therefore, we assume that it may be the reason why the CSI-GAN outperforms the Patch-GAN.
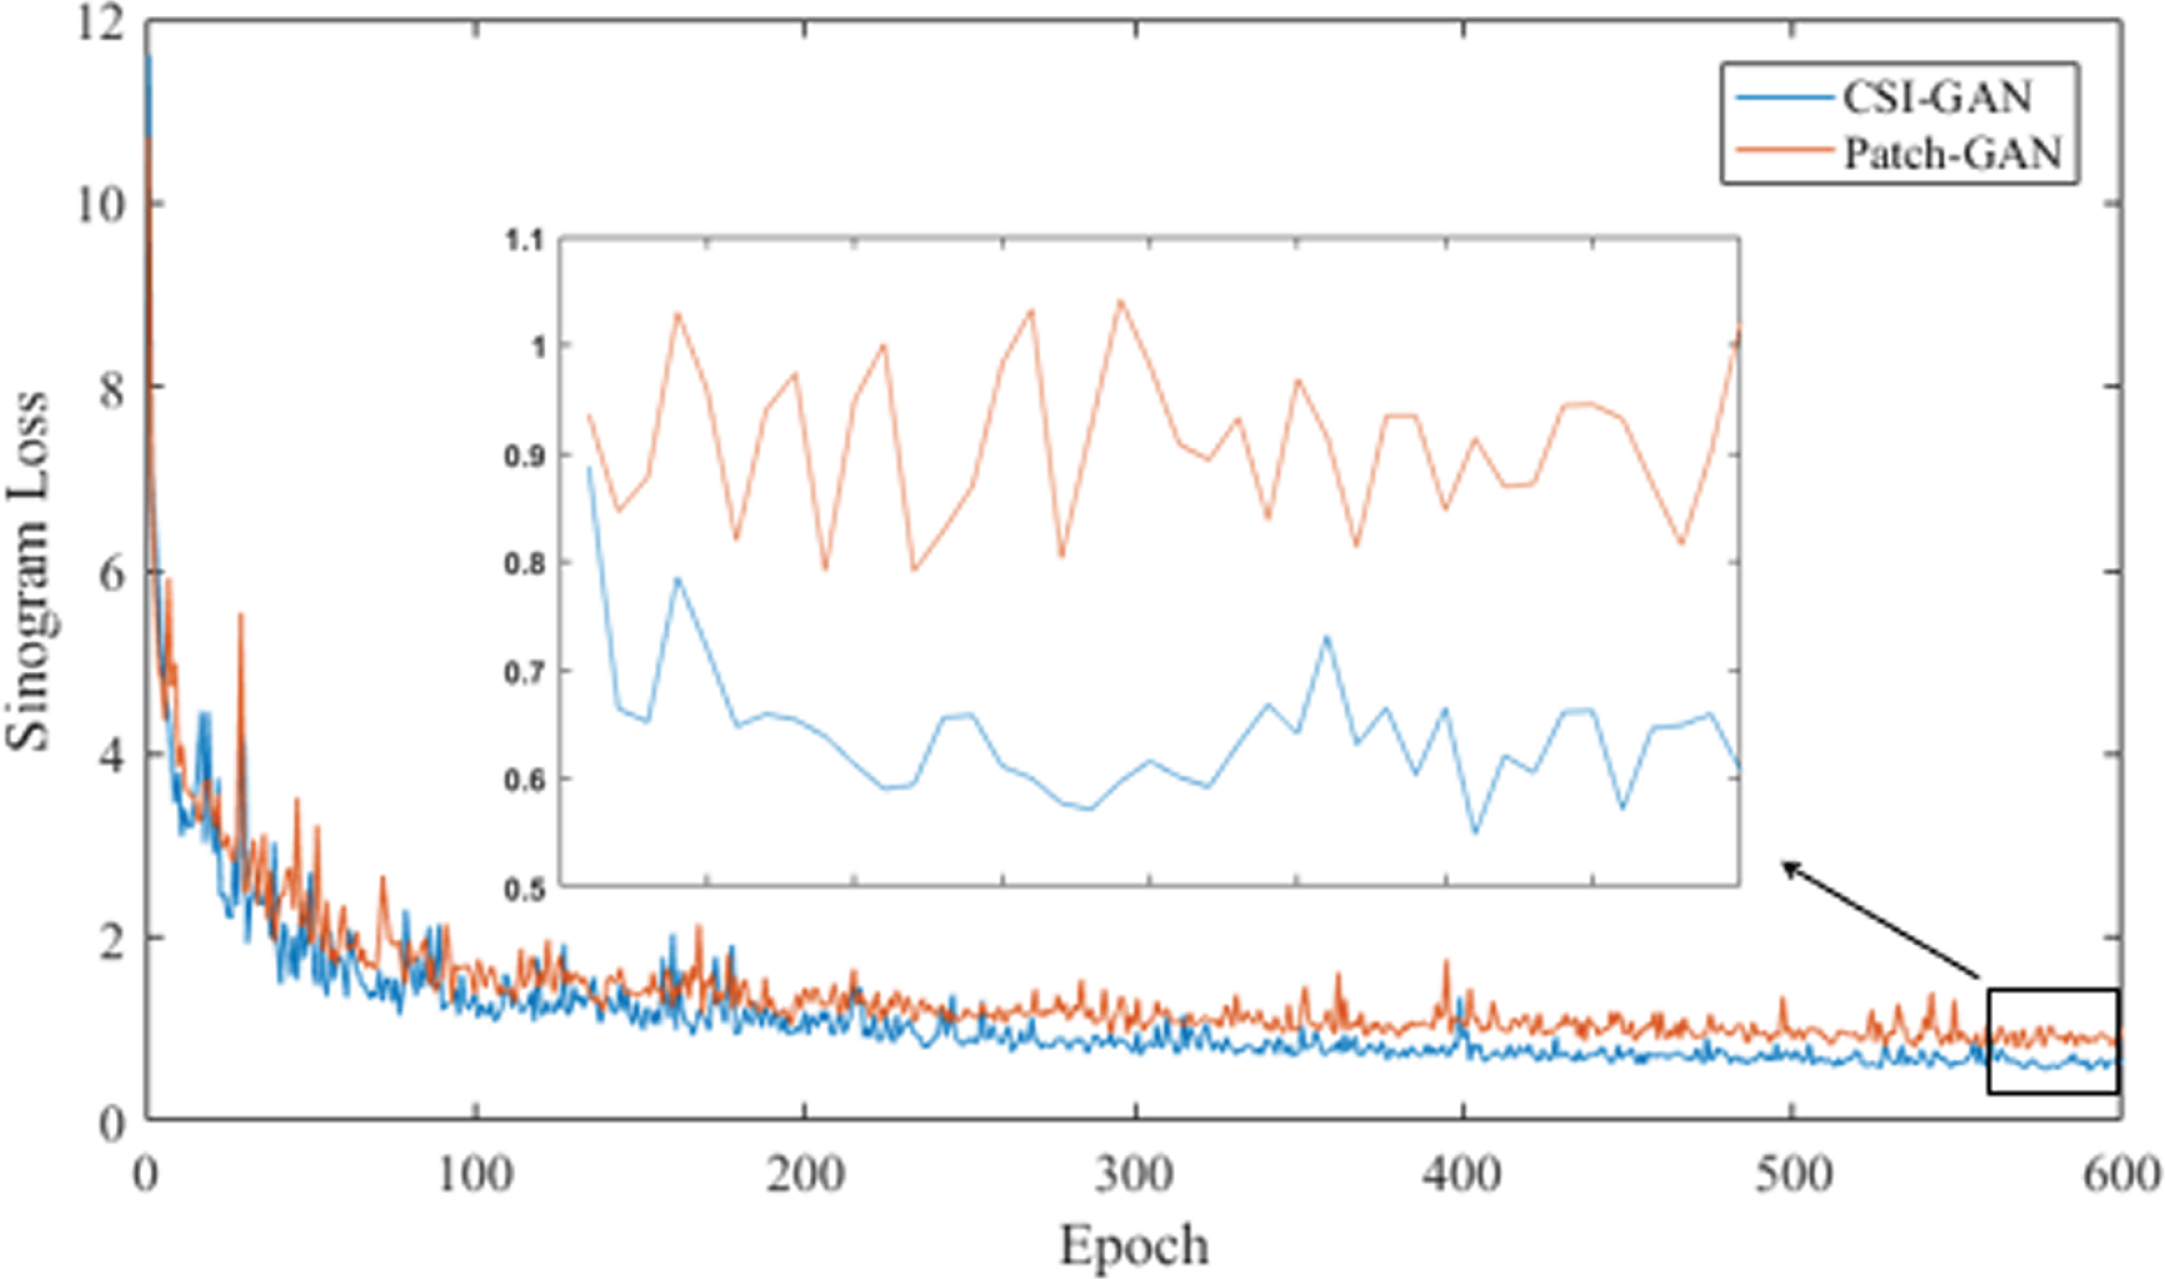
Sinogram loss curve of two networks. The blue line represents the CSI-GAN curve; the red line represents the Patch-GAN curve. The value on the y-axis is the result of multiplying by 10-2.
Experiments with real data were carried out in our laboratory using industrial CT systems. The industrial CT system in our laboratory is a CT system for circular trajectory scanning, which includes detectors, ray sources, stages, mechanical systems, and computer acquisition and projection software. The ray source is 150 kV MICROFOCUS X-RAY SOURCE L12161-07, and the detector is THALES PIXIUM RF 4343. We used different tube voltages to scan QRM phantoms and dead rabbit heads as real data for experiments. As shown in Fig. 14, we experimented with QRM phantoms using real data, which has five different tissue-equivalent materials. The QRM phantom has a diameter of 100 mm, and each cylinder is 20 mm. It scans twice along a circle with tube voltages of 80 and 120 kVp. The X-ray tube current was set to 220μA for two scans. The spectrum of the two scans is estimated using a transmission-based method [43], in which a cylindrical phantom with a uniform known material is scanned under dual-energy spectra. The low- and high-energy projections are sampled at 360 with a scanning interval of 1. The source-to-object distance and the source-to-detector distance are 309.5 mm and 969.7 mm, respectively. The central slice of each 2D projection is extracted and down-sampled into 512 bins for use in the experimental material reconstruction. The decomposed image size is 512×512, and the pixel size is 0.265×0.265 mm. And again, we put the dead rabbit head and the fixed rod into a plastic container for experiment. It has three different tissue equivalent materials: PTFE, bone and tissue. It scans twice along a circle with tube voltages of 80 and 140 kVp. The X-ray tube current for the two scans was set to 125μA and 71μA, respectively. The low- and high-energy projections are sampled at 720° with a scanning interval of 0.5°. The distance from the source to the object and the distance from the source to the detector are 228 mm and 775 mm, respectively. The pixel size is 0.2445×0.2445 mm. Finally, we compared the reconstruction results of different methods and analyzed the performance of real data imaging under different methods.
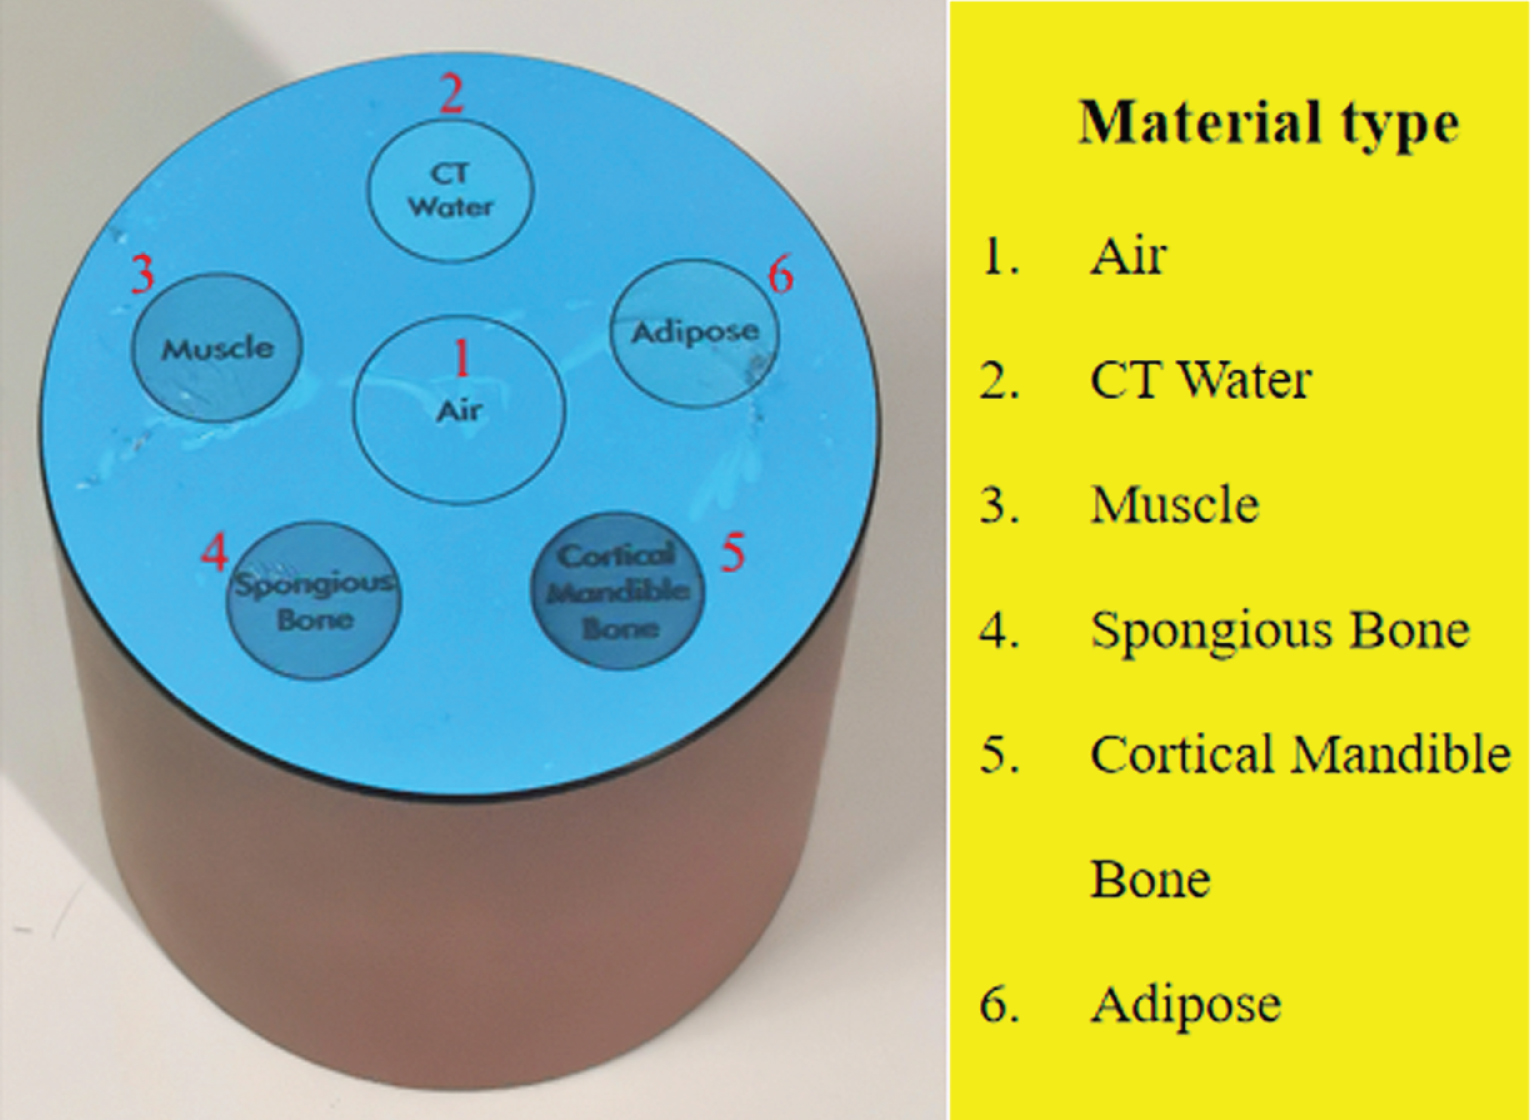
The QRM phantom used for a real data experiment. The QRM phantom contains six substances, namely air, CT water, muscle, spongious bone, cortical mandible bone, and adipose.
We scanned QRM and dead rabbit head separately through industrial CT and scanned twice at low- and high-energy at all angles. The two datasets of the experiment collected 400 and 500 pairs of dual-energy projection images respectively. We choose 320 and 430 pairs of dual-energy projection images as the training dataset of the network model. For the CSI-GAN test dataset, we prepared 40 and 50 pairs of dual-energy projection images that are different from the training dataset.
In real data experiments, we use two datasets to compare the CSI-GAN with other methods in the following complementary-sinogram-inpainting task: QRM phantom (Figs. 15 and 16) and dead rabbit (Figs. 19 and 20).

Inpainting sinogram results from the QRM phantom (left) and the error map (right). (a) the ground truth is 180° sinogram, (b) 90° limited-angle sinogram as input to the network, (c) estimated 180° sinogram by Patch-GAN, (d) estimated 180° sinogram by CSI-GAN, (e) error between (a) and (c) data, (f) error between (a) and (d) data. The (–H) and (–L) of normal dose using the high-energy of 120 keV and the low-energy of 80 keV simulations, respectively. The display window of (a)–(d) and (e) and (f) is [0,1] and [–0.12 0.12], respectively.
Reconstruction results of the QRM phantom for different methods. The left to right columns represents the results of Ground truth, TV-based, SART-TV-based, Patch-GAN + SART-TV, and proposed method. (–H) and (–L) of normal dose use the high-energy of 120 keV and the low-energy of 80 keV. The display windows are [0.1 0.8].

The magnified ROIs of reconstruction results (denoted by a solid red line in Fig. 16). The left to right columns represents the ROIs of the reference images and the reconstruction results of FBP, SART-TV, Patch-GAN + SART-TV and CSI-GAN + SART-TV, respectively. The two rows represent the dual-energy ROI of the reconstructed image. The display window is [0.2 0.6].

Decomposition results of bone and tissue basis materials based on reconstructed images. The left to right columns represents the decomposition results of reference images, Patch-GAN + SART-TV and CSI-GAN + SART-TV. Top to bottom represent bones and tissues. The display window is [0.2,0.8].

Inpainting sinogram results from the rabbit (left) and the error map (right). (a) the ground truth is 180° sinogram, (b) 90° limited-angle sinogram as input to the network, (c) estimated 180° sinogram by Patch-GAN, (d) estimated 180° sinogram by CSI-GAN, (e) error between (a) and (c) data, (f) error between (a) and (d) data. The (–H) and (–L) of normal dose using the high-energy of 140 keV and the low-energy of 80 keV simulations, respectively. The display window of (a)–(d) and (e) and (f) is [0,1.0] and [–0.1 0.1], respectively.
Reconstruction results of the rabbit for different methods. The left to right columns represent the results of Ground truth, TV-based, SART-TV-based, Patch-GAN + SART-TV, and proposed method. (–H) and (–L) of normal dose use the high-energy of 140 keV and the low-energy of 80 keV. The display windows are [0.2 1.0].
Figures 15 and 19 show the results of the inpainting sinogram. The figures in the columns from left to the right represent ground truth, 90° limited-angle sinogram, PatchGAN-based completion results, CSIGAN-based completion results, and error maps. And the error data occurred in the last two columns of Figs. 15 and 19, the result of CSI-GAN is closer to the true value. The completion effect of the missing part of the projection is better than the Patch-GAN.
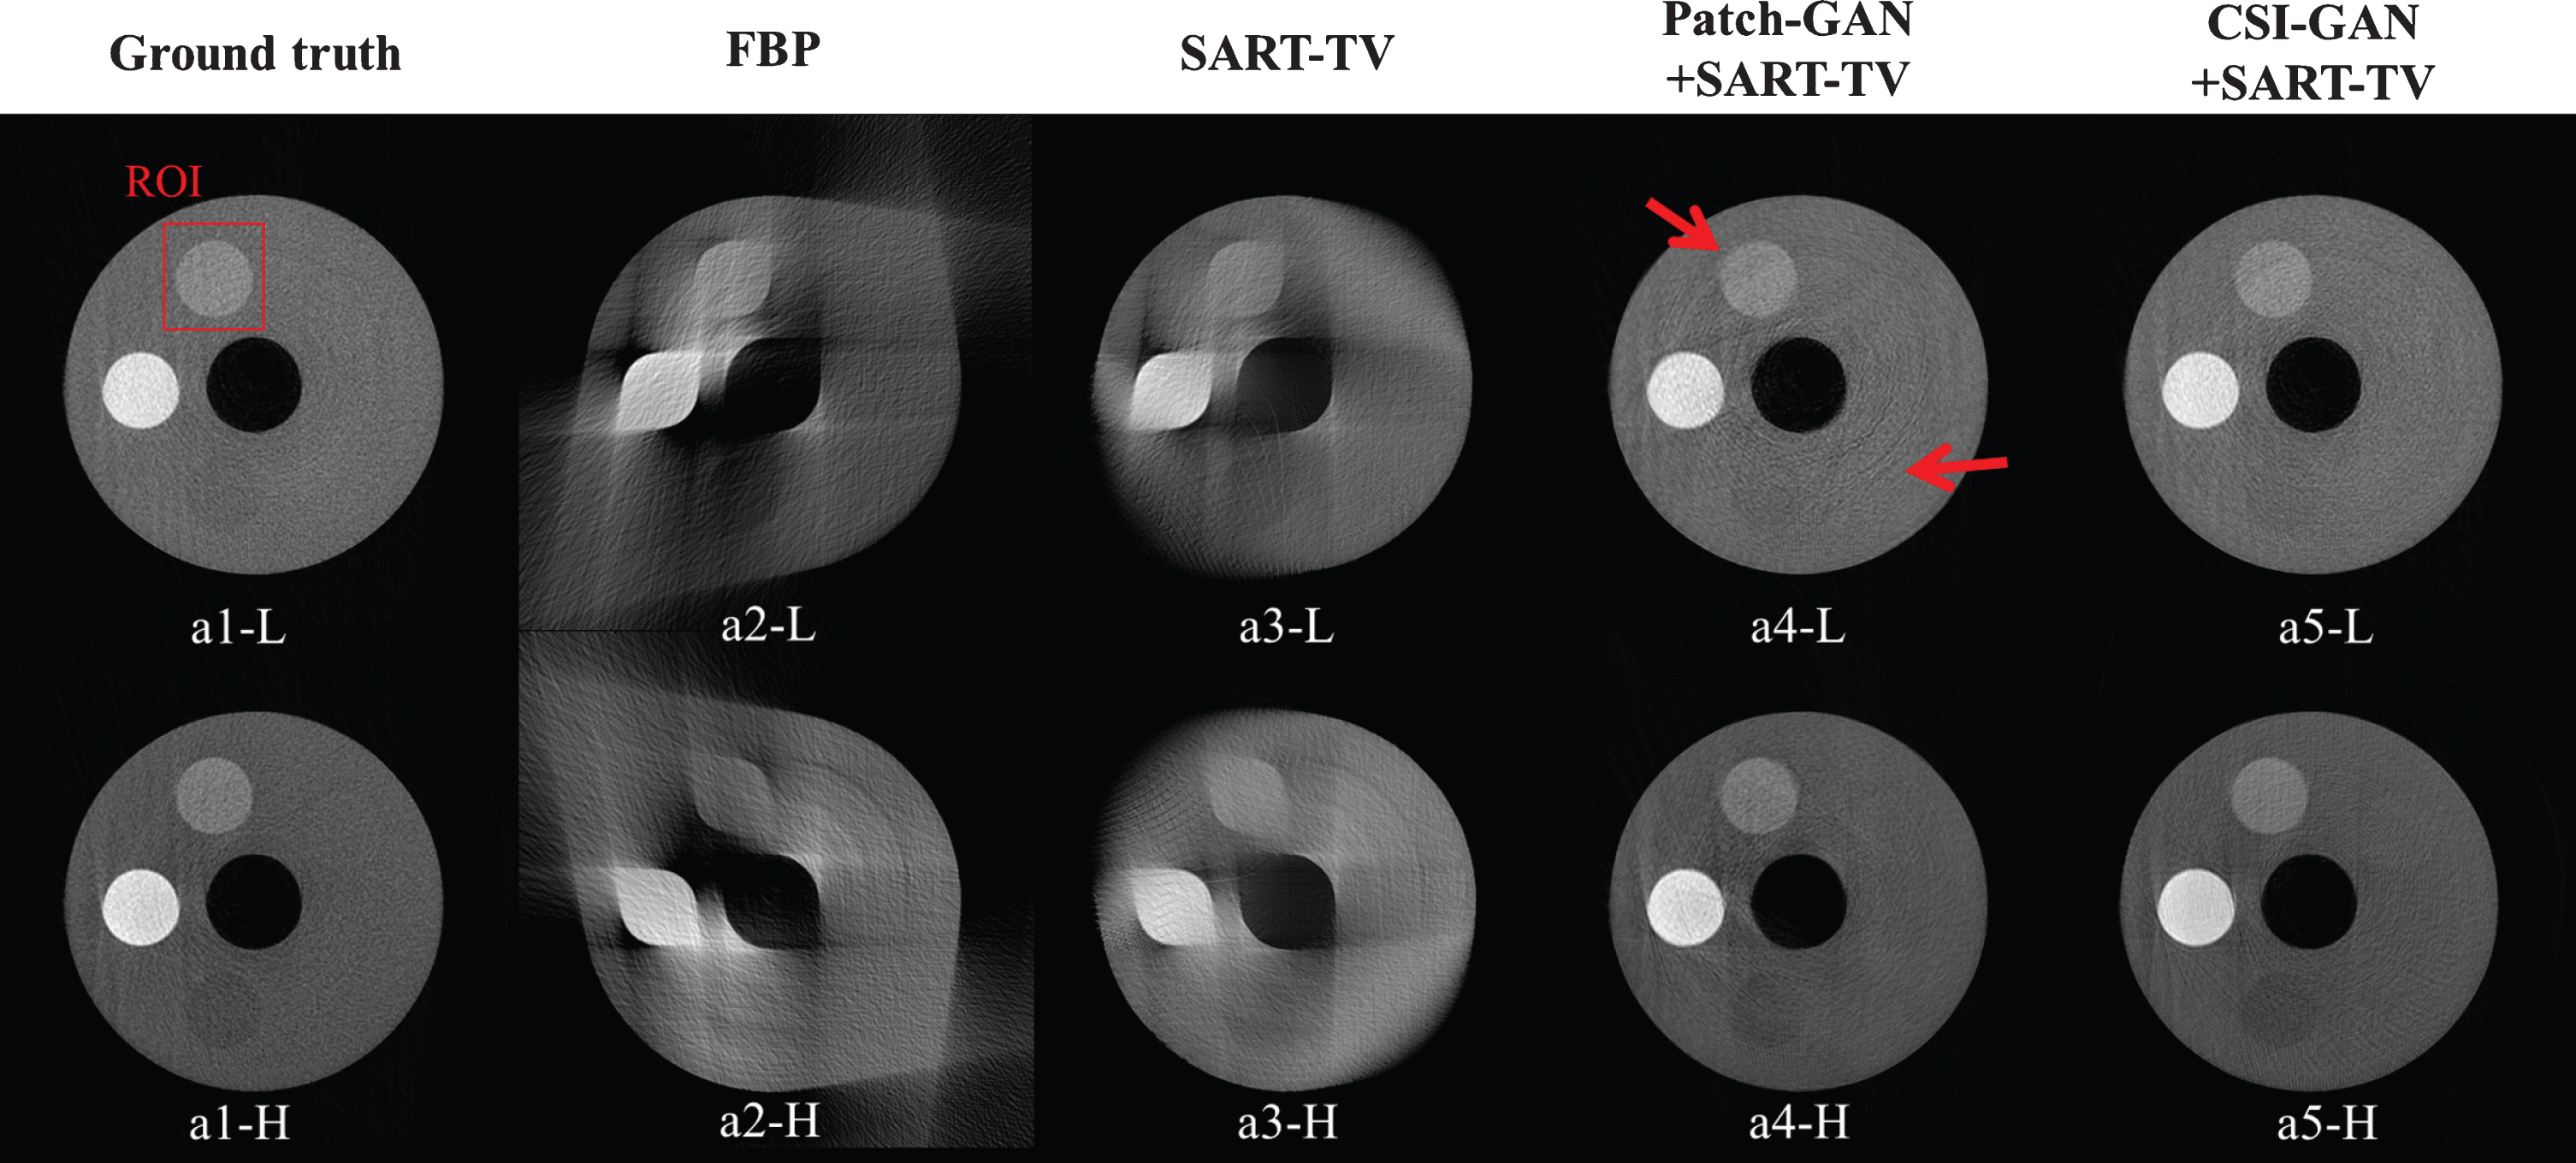
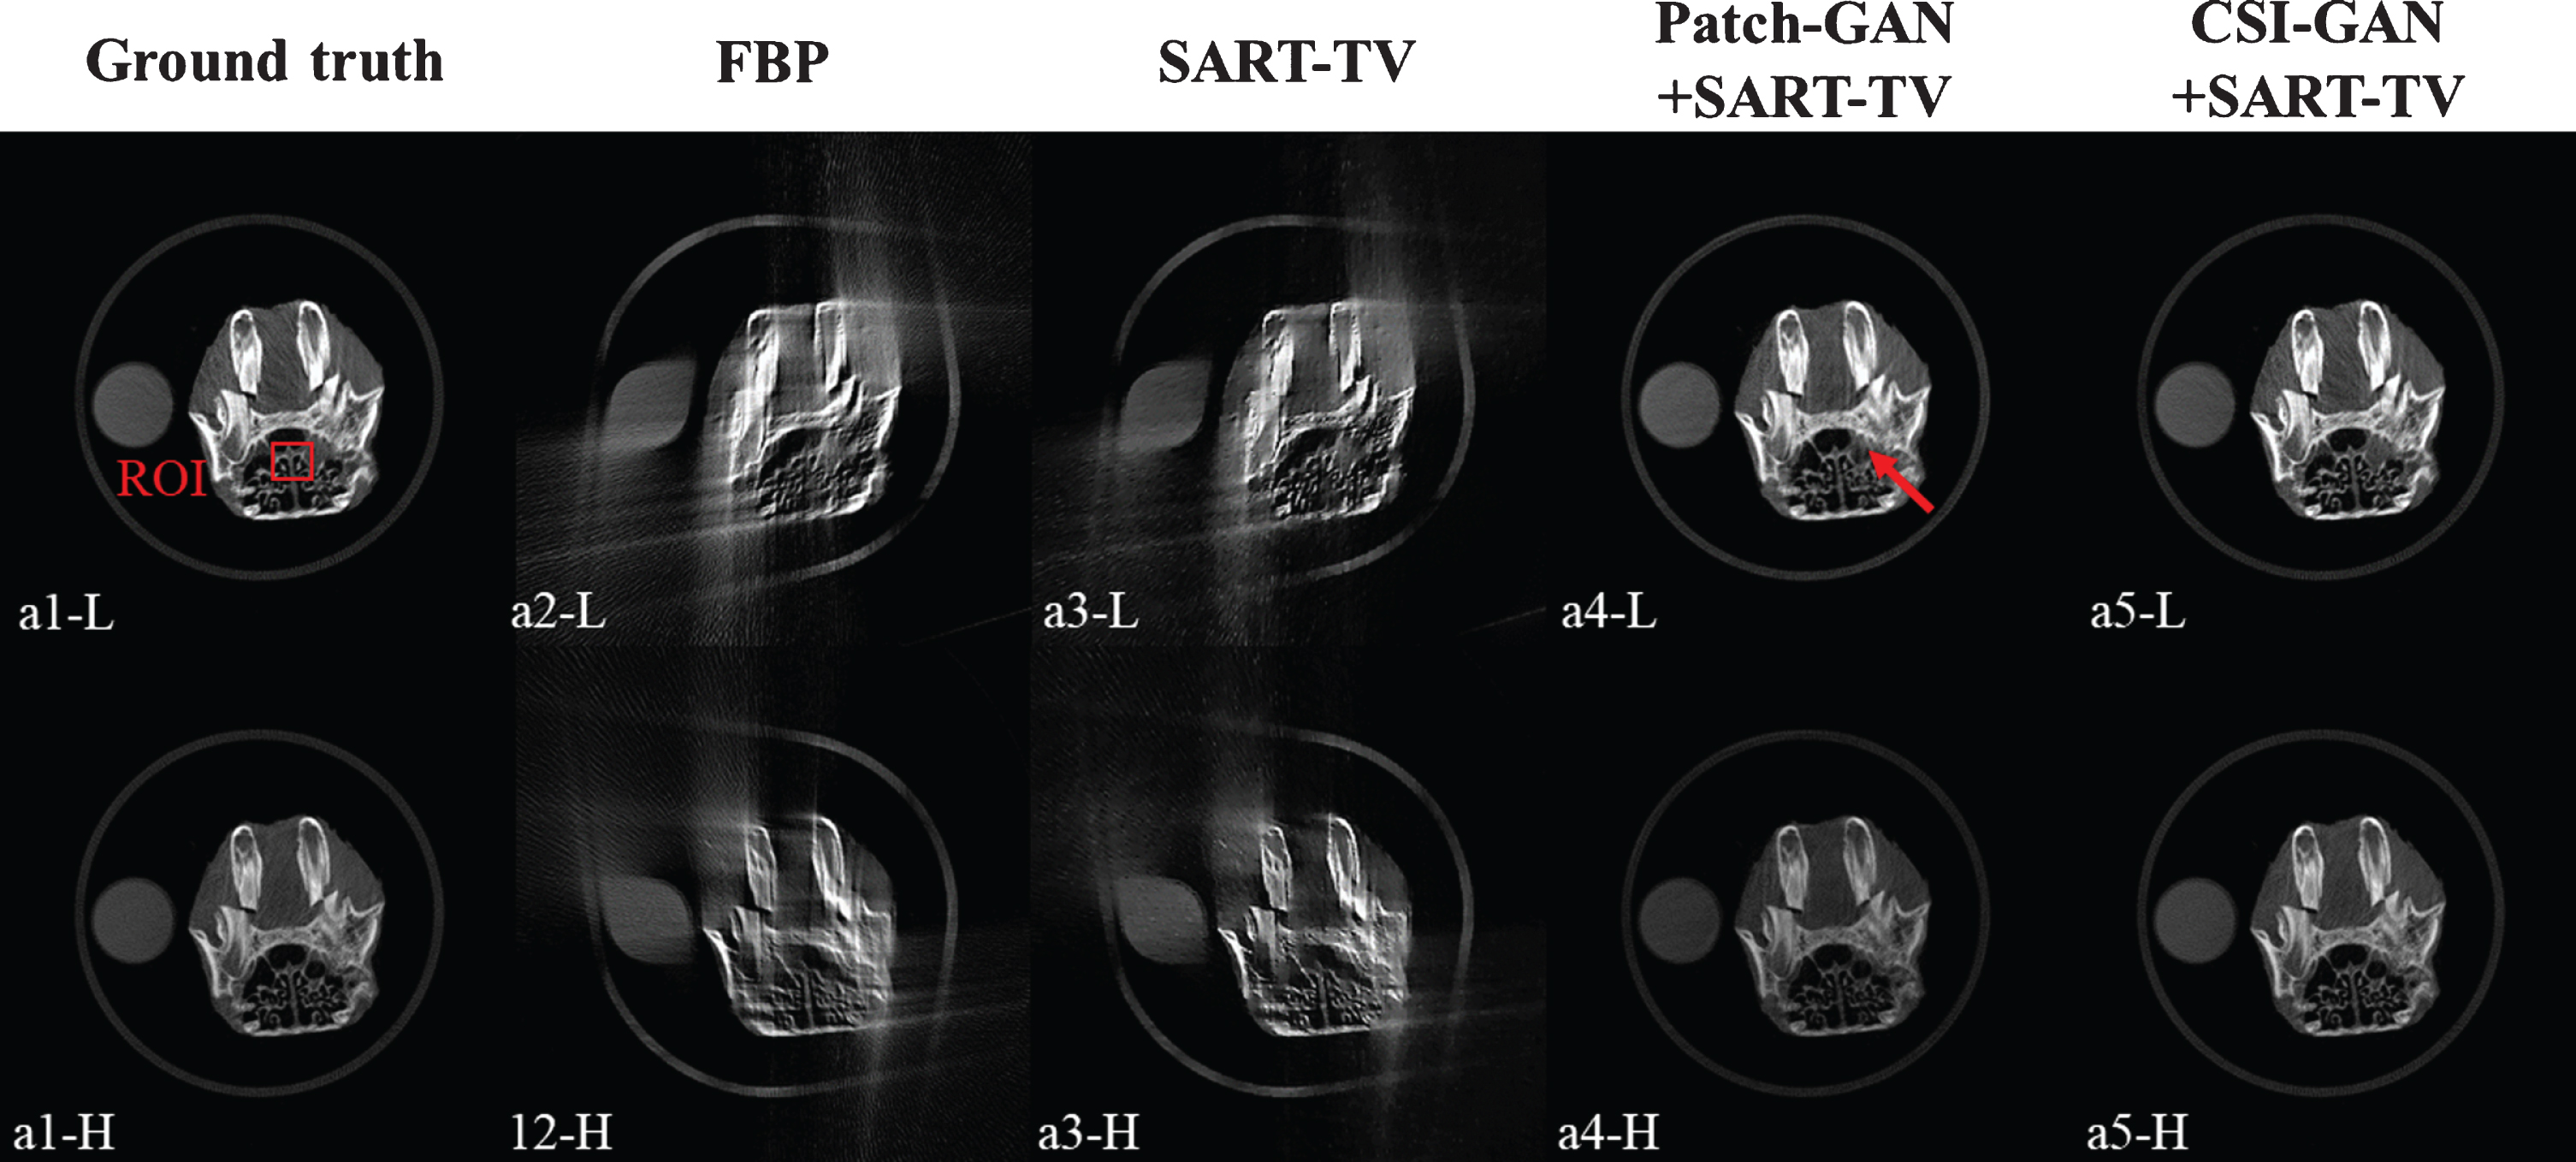
Figures 16 and 20 show the results of the QRM phantom and the dead rabbit head reconstruction under different methods. The numbers in the columns from left to right represent the ground truth, reconstruction based on FBP, a repair based on SART-TV, and after inpainting projection data with the network to reconstruct the results of SART-TV. The upper and lower rows represent the low- and high-energy image, respectively. As shown in Figs. 16 and 20, the result of FBP contains noise, and the artifacts got the image distorted severely. The SART-TV method can obtain higher image quality than FBP, but the reconstructed image is still blurry. However, the quality of the reconstructed image is significantly improved after the network complements the sinogram. The Patch-GAN + SART-TV method achieves higher image quality than the traditional method because of this method inpainting sinogram in the projection domain. As indicated by the red arrow in Fig. 16, there are still problems with loss of edge information and non-smooth surface. In addition, in the area indicated by the red arrow in Fig. 20, some tissues of the rabbit are lost due to the poor quality of the network-completed projection data. But the method proposed in this paper can effectively reduce the decomposition noise and intuitively provide results with clear edges.
Figures 17 and 21 respectively show the ROI represented by the red rectangles in Figs. 16 and 20 for further evaluation. The reconstruction results of the FBP and SART-TV have severe directional artifacts, and SART-TV also has linear artifacts (as indicated by the yellow arrow in the Fig. 17). Compared with the traditional algorithms, the effect of improving image quality through neural network inpainting sinogram is particularly obvious. The method based on the Patch-GAN + SART-TV can effectively suppress the reconstruction noise of texture maps. As shown by the area indicated by the red arrow in the Fig. 17, the effect of retaining edges within the image is poor, and there is a phenomenon of blurred edges. In addition, at the position indicated by the red arrow in Fig. 21, the results obtained by the Patch-GAN + SART-TV are significantly different from the ground truth, and the effect of partial restoration of details is poor. However, the proposed method shows encouraging performance in terms of noise suppression and can recover the image edges with higher accuracy.
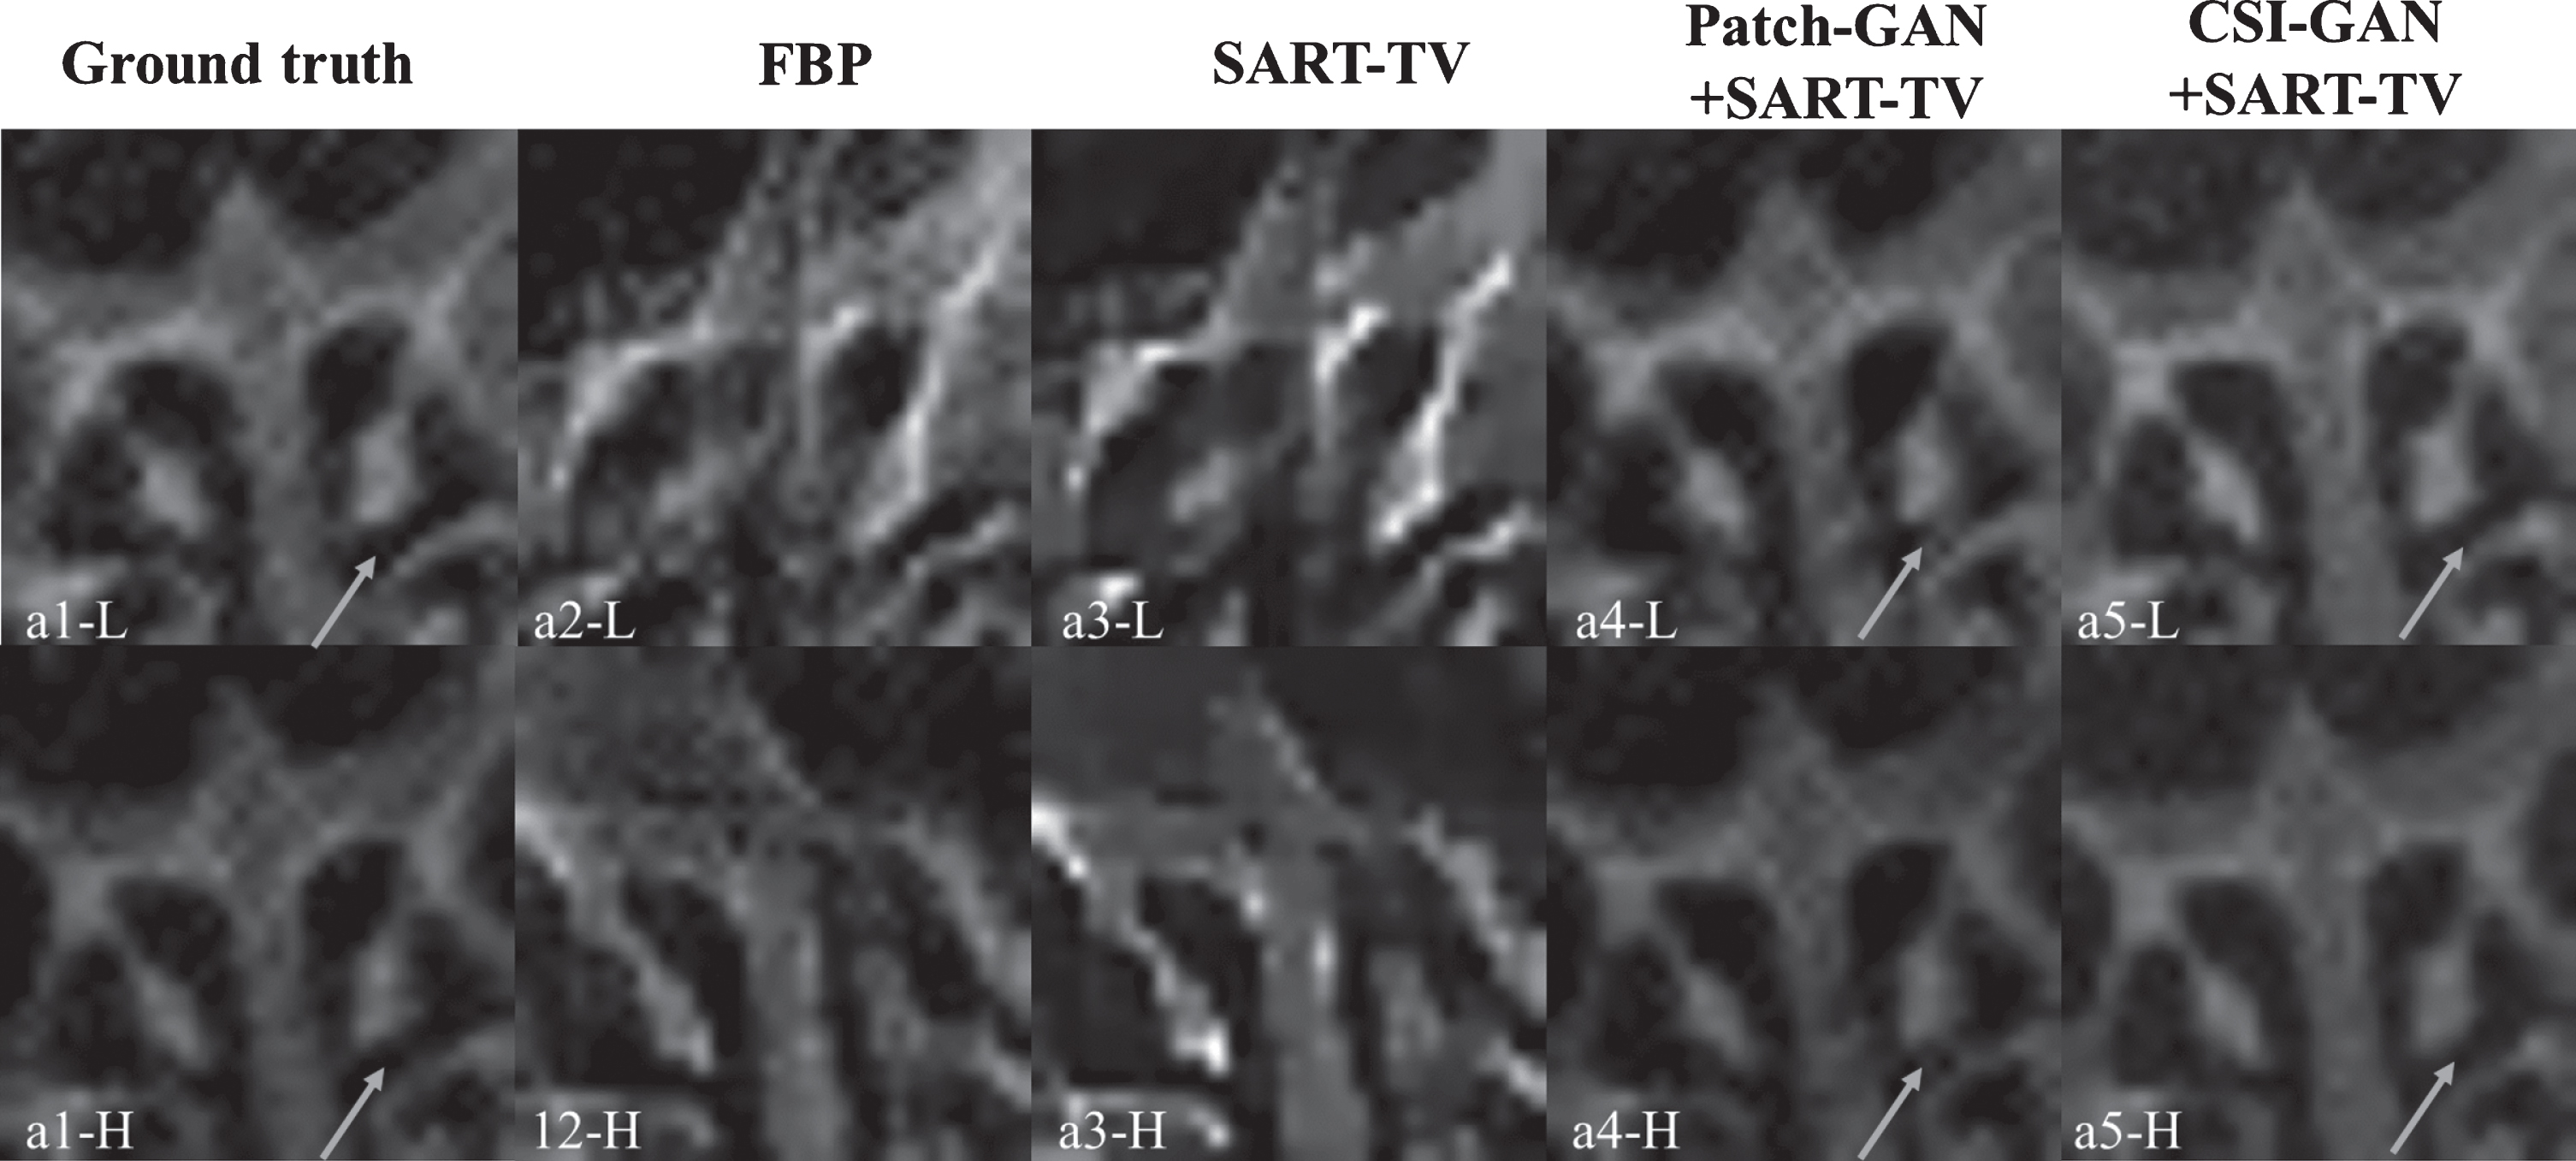
The magnified ROIs of reconstruction results (denoted by a solid red line in Fig. 20). The left to right columns represents the ROIs of the reference images and the reconstruction results of FBP, SART-TV, Patch-GAN + SART-TV and CSI-GAN + SART-TV, respectively. The two rows represent the dual-energy ROI of the reconstructed image. The display windows is [0.2 0.8].
To further verify the practicability of the proposed method, we decompose the obtained reconstructed image with two materials. Figures 18 and 22 show the results of material decomposition. The left to right columns represents the decomposition results of reference images, Patch-GAN + SART-TV and CSI-GAN + SART-TV. Top to bottom represent bones and tissues. As shown in Fig. 18, Patch-GAN + SART-TV has some tissue information in the bone decomposition result, and the result of tissue decomposition has the problem of insufficient image smoothness and loss of detailed information. Similarly, the areas shown by the red arrows and yellow boxes in Fig. 22 represent the inaccurate decomposition results of Patch-GAN + SART-TV and the loss of part of the tissue information, respectively. However, the proposed method can obviously provide more accurate decomposition results and ensure that the decomposition results of the two materials are basically without loss.
Decomposition results of bone and tissue basis materials based on reconstructed images. The left to right columns represents the decomposition results of reference images, Patch-GAN + SART-TV and CSI-GAN + SART-TV. Top to bottom represent bones and tissues. The display window is [0.2,0.8].
Tables 4 and 5 list the PSNR, SSIM and RMSE of Figs. 16 and 20, respectively. The PSNR and SSIM values of the image obtained by the proposed method are the highest, and the RMSE is at the lowest level. This shows that the proposed method can reconstruct high-quality and low-noise images, showing excellent performance in terms of accuracy and resolution. The experimental results show that the proposed CSI-GAN + SART-TV method can provide a new way to solve the complementary limited-angle problem in practical applications.
Quantitative results related to different methods in Fig. 16
Quantitative results related to different methods in Fig. 16
Quantitative results related to different methods in Fig. 20
We also study the sinogram loss of two networks. As shown in Fig. 23, the loss curve of the Patch-GAN is higher compared to CSI-GAN from the beginning, and the amplitude of the fluctuation is also significant. This may also be because the Patch-GAN is extremely interfered by noise in the process of inpainting sinogram and is more sensitive to some irrelevant information. Furthermore, after 250 epochs, the loss curve of the CSI-GAN gradually stabilizes. As shown in the enlarged area of the black box in the figure, the loss curve of the CSI-GAN stabilizes below 0.7, while Patch-GAN still has large fluctuations, and most of the values are above 0.7. Therefore, the sinogram completed by the CSI-GAN is closer to the real 180° sinogram, and the reconstructed image is almost the same as the actual image.
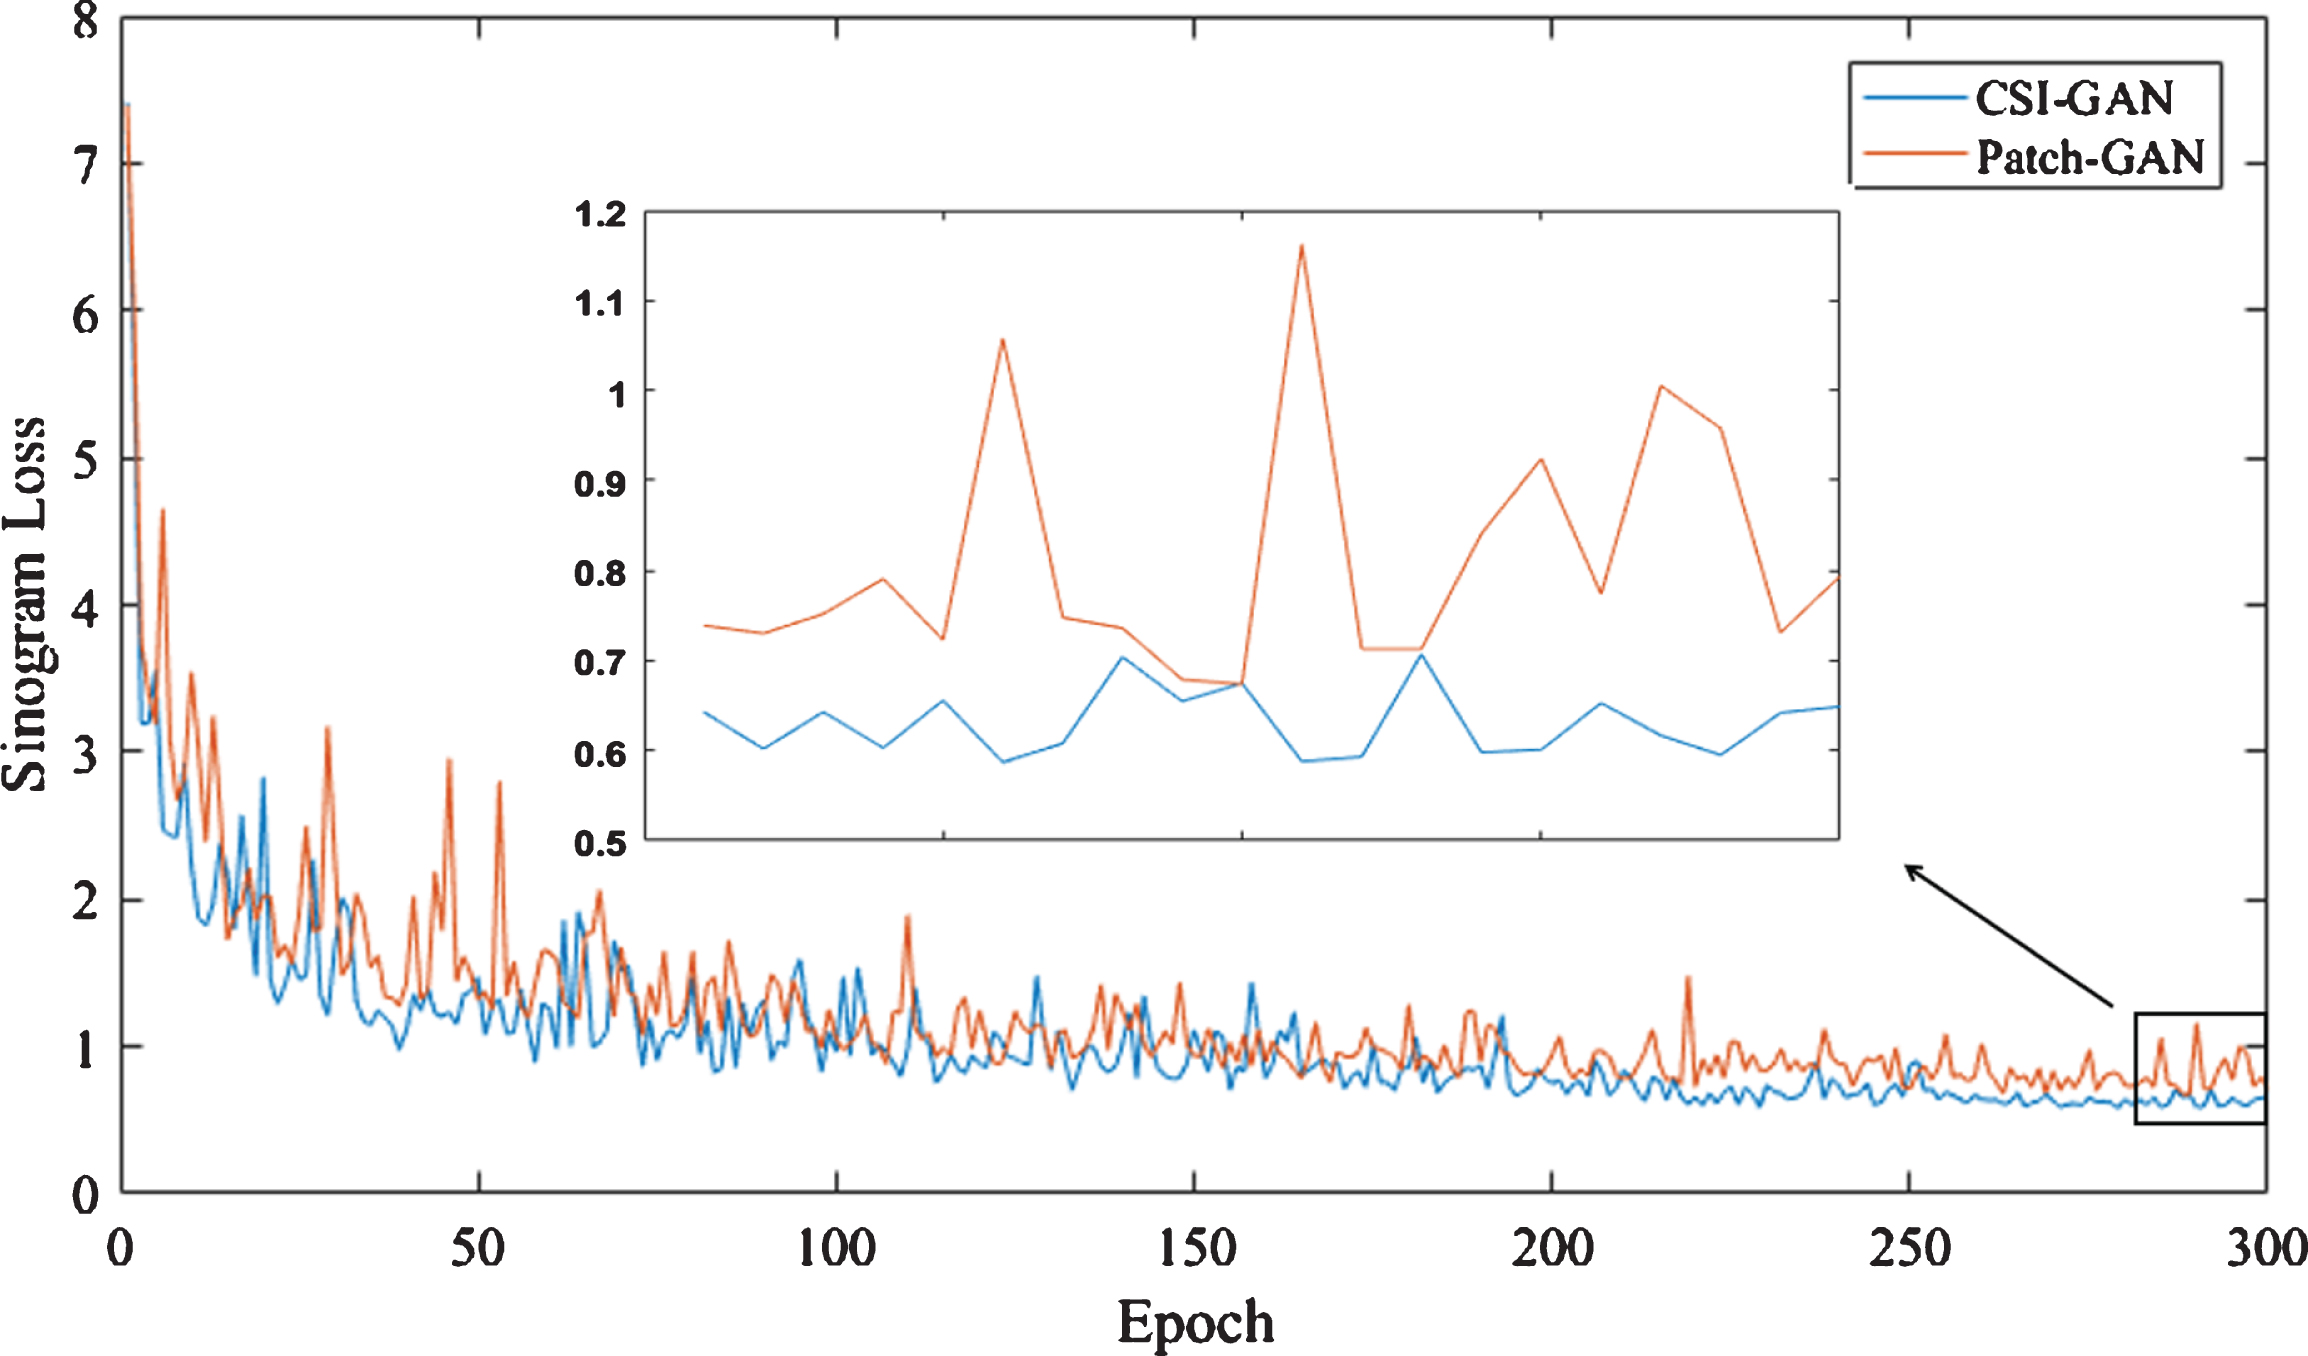
Sinogram loss curve of two networks. The blue line represents the CSI-GAN curve; the red line represents the Patch-GAN curve. The value on the y-axis is the result of multiplying by 10-2.
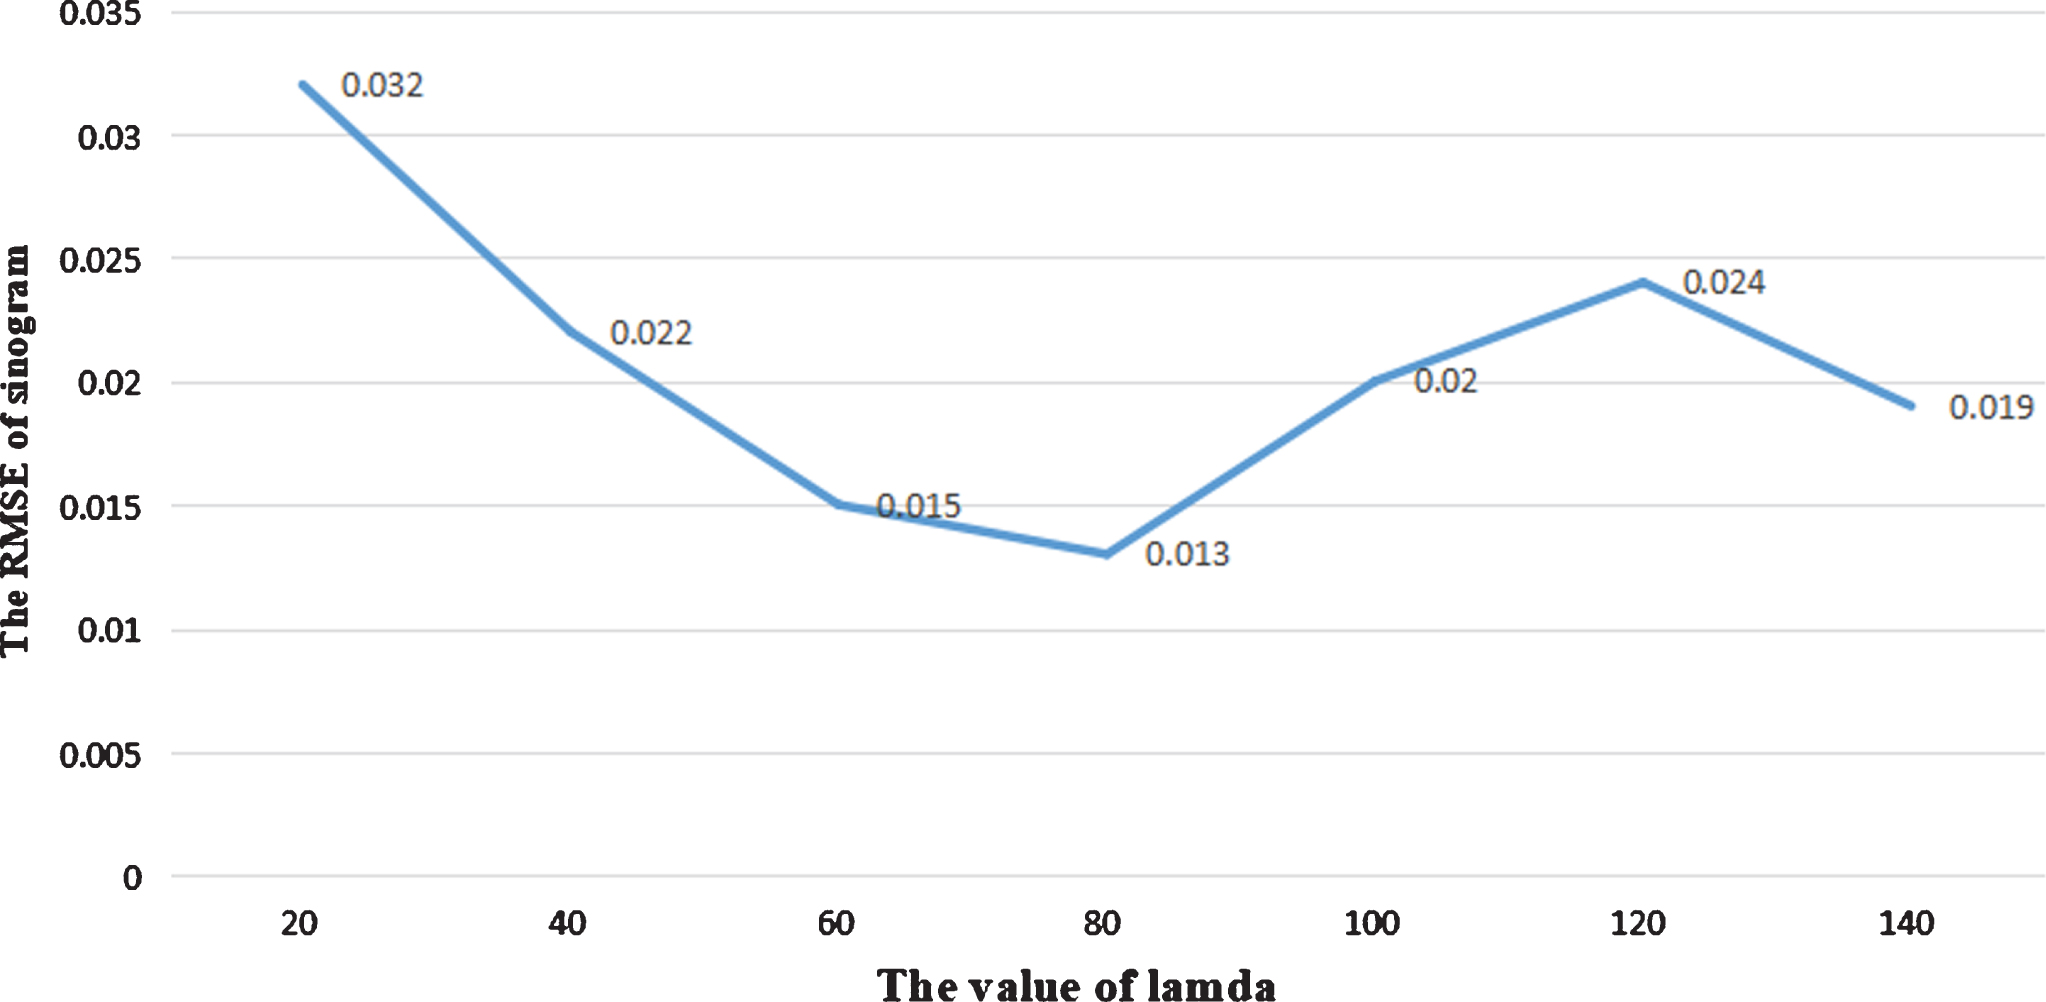
The RMSE of sinogram under different λ values. We take different λ each time for the experiment and calculate the RMSE of the sinogram when epoch = 300 and the real sinogram in each experiment.
In this study, we investigate and analyze the problem of dual-energy complementary limited angles. The study is suitable to improving the image quality of linear trajectory imaging systems and developing new DECT imaging systems. However, the traditional reconstruction method cannot meet the requirements of high-quality dual-energy images under the problem of complementary limited angles. In this case, a feasible method is to complete the missing information in the projection domain using the DNN. We found that in the sinogram domain, the missing information with complementary limited angles is the unscanned area of the system, and the GAN can learn the data distribution in the sinogram domain to inpainting the unscanned projection information.
During the experiments, we found that for specific types of scanned objects, additional training is needed, which may be caused by significant differences in the internal structure between different objects. In clinical medical practice, we can train multiple models for a specific CT system to apply to different types of scanned objects. And we also found that as the dataset and network model expand, the generalization of the network will also enhance. However, at present, the data we obtain from the hospital and the computing power of the computer are limited. Therefore, increasing the dataset and network scale will be our next step.
In the analysis of the experimental results, we observe that the CSI-GAN proposed in this paper is more suitable than the Patch-GAN in terms of inpainting sinogram based on two reasons. (1) since the selection of parameters λ is more based on the results of experience and experimental verification, we have done a lot of work on the selection of parameters. First, we set the parameter λ to 0, 0.1, 0.01, 0.005, 0.001, 10, 100, 250, 500 and 1000 for experiments, and then found that when λ is set to 100, the sinogram completed by the network works best. Then we experimented with the parameters around 100, and set the parameter λ to 20, 40, 60, 80, 100, 120 and 140 respectively (Fig. 24). Finally, we found that when the parameter λ is 80, the CSI-GAN can achieve the task of sinogram inpainting faster and closer to the true value. (2) the CSI-GAN network structure is more abundant than the Patch-GAN. The CSI-GAN has nine convolutional layers Compared to the Patch-GAN encoder that includes five convolutional layers. It implies that the higher the degree of abstraction of the features, the more information can be proposed from the existing data, so the effect achieved on the task of sinogram completion is better.
Conclusion
In this study, we propose and test a GAN-based complementary limited-angle DECT imaging method, which implements a dual-energy complementary 90° completion task using a GAN network and adds a sinogram loss function to improve the quality of image reconstruction. Compared with the previous DECT imaging system, DECT-CL is designed to be more flexible. Moreover, in terms of the pleural and cranial cavity, we observe that compared with the traditional method and the Patch-GAN method, the proposed method can effectively suppress image artifacts, which is closest to the fidelity and sharpness of real images. Furthermore, in the real data experiment of QRM phantom, the CSI-GAN demonstrate the effect of proper sinogram completion. Therefore, the proposed method can solve the problem of complementary limited angles better, including practical clinical applications.
In the future, we hope to improve our research in the following directions. First, considering the structure of the object or the imaging system, sometimes fewer projection data can be collected in the actual system scan. Therefore, we will study the problem of DECT imaging with a DECT scan angle of less than 90°. Secondly, we hope to obtain higher quality CT image reconstruction results and perform more tests and applications on the actual CT systems.
Footnotes
Acknowledgments
This work was supported by the National Natural Science Foundation of China (Grant No. 61601518) and the National Science Foundation for Post-doctoral Scientists of China (Grant No. 2019M663996).