
Abstract
OBJECTIVE:
To investigate efficiency of radiomics signature to preoperatively predict histological features of aggressive extrathyroidal extension (ETE) in papillary thyroid carcinoma (PTC) with biparametric magnetic resonance imaging findings.
MATERIALS AND METHODS:
Sixty PTC patients with preoperative MR including T2WI and T2WI-fat-suppression (T2WI-FS) were retrospectively analyzed. Among them, 35 had ETE and 25 did not. Pre-contrast T2WI and T2WI-FS images depicting the largest section of tumor were selected. Tumor regions were manually segmented using ITK-SNAP software and 107 radiomics features were computed from the segmented regions using the open Pyradiomics package. Then, a random forest model was built to do classification in which the datasets were partitioned randomly 10 times to do training and testing with ratio of 1:1. Furthermore, forward greedy feature selection based on feature importance was adopted to reduce model overfitting. Classification accuracy was estimated on the test set using area under ROC curve (AUC).
RESULTS:
The model using T2WI-FS image features yields much higher performance than the model using T2WI features (AUC = 0.906 vs. 0.760 using 107 features). Among the top 10 important features of T2WI and T2WI-FS, there are 5 common features. After feature selection, the models trained using top 2 features of T2WI and the top 6 features of T2WI-FS achieve AUC 0.845 and 0.928, respectively. Combining features computed from T2WI and T2WI-FS, model performance decreases slightly (AUC = 0.882 based on all features and AUC = 0.913 based on top features after feature selection). Adjusting hyper parameters of the random forest model have negligible influence on the model performance with mean AUC = 0.907 for T2WI-FS images.
CONCLUSIONS:
Radiomics features based on pre-contrast T2WI and T2WI-FS is helpful to predict aggressive ETE in PTC. Particularly, the model trained using the optimally selected T2WI-FS image features yields the best classification performance. The most important features relate to lesion size and the texture heterogeneity of the tumor region.
Introduction
Papillary thyroid cancer (PTC) is the most common type of well-differentiated thyroid cancer, accounting for 90% of all thyroid carcinomas(1–3). PTCs are indolent differentiated cancers, which are associated with low mortality and morbidity [1–5]. However, some PTCs show aggressive behavior and recurrence [1, 4–7]. Extrathyroidal extension (ETE) is accepted as an important factor influencing the prognosis and recurrence of PTCs [4–6, 9]. ETE is mainly defined as infiltration beyond the thyroid capsule, which has been a risk factor for poor prognosis of thyroid cancer. According to the seventh edition of the AJCC, the TNM classification for thyroid carcinomas divides ETE into minimal ETE (extension to sternothyroid muscle or perithyroid soft tissues) and extensive ETE (extension to subcutaneous soft tissue, larynx, trachea, esophagus, recurrent laryngeal nerve, or the prevertebral fascia or encases the carotid artery or mediastinal vessels) [7].
Preoperative detection of ETE is very important, not only for adequate nodal staging but also for surgical planning [2, 9]. Several studies have demonstrated the superiority of various imaging tools, including US, CT, and MRI, in ETE assessments [10–13]. Currently, US is the accepted method for the first diagnostic evaluation of ETE of PTCs. Previous studies on the diagnostic performance of preoperative US for the determination of ETE of PTCs reported many advantages, such as high-resolution imaging capability and ease of accessibility. However, US also has several limitations, the most important of which is operator dependency. US, CT and MRI have limited accuracy and sensitivity in the detection of ETE [10–13]. Due to lack of objective parameters and indicators for quantitative analysis, it is not very accurate to apply these observation findings to predict ETE. Therefore, avoiding unnecessary biopsy procedures and finding more objective assessment methods is the key to clinical work.
The diagnosis of the pathological diseases such as PTC by doctors is still subjective problem, some image information that cannot be recognized by human visual system will make the doctor’s diagnosis inaccurate. During the past decades, medical imaging innovations with the development of computer hardware and the establishment of large databases, radiomics is emerged and expected to move towards quantitative imaging [14–20]. Being different from the traditional megascopic analysis based on experiences, radiomics is a machine learning based technique that detects pathological changes that cannot be perceived by the human eye, using an automated high-throughput extraction of large amounts of quantitative features of medical images and to draw statistical information [14–19, 22]. Previous studies have shown that radiomics features can characterize the texture and morphology of tumors regions from grayscale medical images [22–25]. The current study presents a non-invasive method to predict ETE in patients with PTCs with quantitative features extracted from MRI imaging.
Materials & method
Study population
This retrospective study was approved by the institutional review board, and written informed consent was waived. A search performed on the hospital’s database identified 68 consecutive patients with surgically confirmed PTCs who underwent preoperative thyroid MRI at our institute between January 2015 and December 2018 for the evaluation of PTCs. Eight of the 68 patients were excluded for the following reasons: poor-quality MRI (n = 2), small-sized masses (i.e., too small to be identified on MRI, n = 3), and severe susceptibility artifacts and patient motion artifacts (n = 3). Finally, 60 patients (15 males and 45 females) with an average age of 46.5 years (vary from 24 to 74 years old), were included in this study. All patients underwent thyroid MRI within 2 weeks before a thyroidectomy.
MRI examinations
All examinations were performed on 1.5 Tesla MR Scanners (GE Signa HD 1.5 T MR scanner; GE Healthcare Systems, Milwaukee, WI, USA) with an eight-channel high-resolution receiver synergy-head/neck phased-array coil. All MRI protocols consisted of T1WI, T2WI-FS, DWI, and contrast-enhanced MRI. Conventional MRI sequences including axial T1WI spin echo (TR/TE=520/14ms), T2WI fast spin echo (TR/TE=3500/95ms) with and without fat suppression and coronal T2WI (TR/TE=3500/95). DWI was acquired in three orthogonal directions with two different b values (0 and 500 s/mm2) using STIR fat suppressed single-shot echo planar imaging spin echo sequences. Of all patients, contrast enhanced T1WI (TR/TE=520/14 ms) were obtained with or without fat-suppression immediately after the intravenous injection of 0.1 mmol/kg Gd-DTPA (Magnevist, Schering AG, Germany). The parameters were as follows: section thickness 3 mm, with a 1 mm intersection gap, FOV = 40×28 cm; matrix = 256×256, number of excitation (NEX)=4. The whole examination was completed within 30 minutes.
Overview
The proposed architecture of our study is illustrated in Fig. 1. The first step of our process is image acquisition, in which T2WI and T2WI-FS images of 60 PTCs were collected. Secondly, it is time-consuming for the radiologists to annotate the tumor contour slice by slice, and the contour of the tumor in this study was annotated on the slice with largest tumor area for each patient. Tumor segmentation was manually performed on a slice with the largest section of tumor by a radiologist (W.X, with 15 years’ experience) using ITK-SNAP software (an open software www.itksnap.org). The region of interest (ROI) covered the entire section of the tumor. To evaluate the reproducibility of features among the different segmentations, 20 cases were selected randomly and their images were re-segmentation by W.X two week after initial segmentation, and another radiologist (H.S.D with >20 years’ experience) also performed the same images. The class correlation coefficient (CCC) was used to measure the agreement of Inter- and intra-observer, and a CCC above 0.7 indicated excellent reliability. Finally, we found that all the segmentations met the acquirement. Then, the radiomics features were extracted by the open-source automatic feature analysis algorithm which provides a comprehensive characterization of thyroid nodules. Afterward, wavelet and LoGfilter were applied for extracting more specific features of the tumors for the purpose of studying whether it is useful for classification task. Finally, we make feature selection on the extracted features to select the most important features for classification, while reducing features dimensionality to avoid overfitting. We report the performance of the most important features for classification, and make statistical data analysis (p-values) on the models to show the differences.

Overall workflow of the study.
For each patient, two image modalities (T2WI and T2WI-FS) are available. We first analyze the two modalities separately, and then analyze the combined modalities by simply concatenating the radiomics features of the two modalities. We denote the combined modalities as T2WI-combined.
The radiomics features [26] are extracted using the open Pyradiomics packages implemented in python [16, 27], so that the results could be easily reproduced, and we totally extract 107 radiomics features from segmented region of interest on each MRI image slice. In our study, the radiomics features compose of First Order Statistics, Shape-based, Gray Level Co-occurrence Matrix (GLCM), Gray Level Run Length Matrix (GLRLM), Gray Level Size Zone Matrix (GLSZM), Gray Level Dependence Matrix (GLDM), Neighboring Gray Tone Difference Matrix (NGTDM).
First Order statistics features describe how voxel intensities within the region of interest (ROI) are distributed. Such features include entropy, mean, minimum and maximum intensity values, energy, skewness, etc. Shape-based features describe the size of the tumor area and the similarity of the tumor area to the sphere. The size characteristics of tumor area include volume, surface area, maximum diameter and effective diameter; and similarity characteristics include surface area ratio, density, eccentricity, sphericity, etc.
The Gray Level Co-occurrence Matrix (GLCM) [28] is a matrix that represents the intensity relationship of discrete gray levels of adjacent pixels or voxels in a 3D volume. GLCM features are extracted based on the probability distribution for the elements of the GLCM, including contrast, correlation, difference variance, etc. The gray level run length matrix (GLRLM) defines various texture features. Compared to GLCM, GLRLM also assesses the distribution of intensities of image, but mainly focus on run lengths, which reflects the comprehensive information of the image gray scale with respect to direction, adjacent interval and variation amplitude. GLRLM features include short run emphasis, long run emphasis, etc. The gray level size zone matrix (GLSZM) quantify the gray level regions in the image. The gray level regions refer to the number of connected voxels with the same gray level intensity. If the distance between the voxels is 1 according to the infinity norm, then we consider the voxel as a neighbor. GLSZM features include small area emphasis, gray level non-uniformity, etc. The Gray Level Dependence Matrix (GLDM) is designed to capture the coarseness of the image texture. GLDM counts the number of neighbor voxel around a central voxel within Chebyshev distance δ. GLDM features include small dependency emphasis, dependency non-uniformity, etc. The Neighboring Gray Tone Difference Matrix (NGTDM) quantifies the sum of gray level intensity differences between a certain voxel and the average gray level intensity of neighboring voxels within a Chebyshev distance δ. NGTDM features include busyness, complexity, etc. Table 1 list the general descriptions of radiomics features and the corresponding classified category.
Radiomics feature characteristics
Radiomics feature characteristics
Aside from original radiomics features, there are also some built-in optional filters in Pyradiomics, such as Laplacian of Gaussian (LoG), Wavelet, Square, Logarithm, Local Binary Pattern and so on, and adding filters can generate more specific features of the lesions. For studying whether it is useful for classification, in this paper, we select Laplacian of Gaussian (LoG) and Wavelet filters to obtain additional radiomics features. For LoG filters, we use five LoG filters with 5 sigma levels, 1.0–5.0, respectively. Since each LoG filter can yield 93 features, which consist of GLCM, GLRLM, GLSZM, GLDM, NGTDM and First Order Statistics, we can get totally 465 (93×5) features. For wavelet, as 1 level Wavelet decomposition yields 8 derived images, we can get totally 744 (93×8) features.
Random forest classification model
First, we select random forest as the classification method [29–31]. Random forest ensembles a number of decision tree to vote for the most popular class and search for the best feature in a random subset of features at the same time, which reduces the overfitting problem. Because the tree partition algorithm used by random forest sets cutoffs for each feature independently, feature standardization is not necessary.
Next, to combine the two modalities T2WI and T2WI-FS, we concatenate the radiomics features for each patient, and we denote the combined modality as T2WI-combined. Therefore, for T2WI, T2WI-FS and T2WI-combined modality, each patient has 107, 107 and 214 features, respectively.
Then, since random forest model assigns a feature importance score for each feature, for each partition of the training and testing dataset and each feature, there is a feature importance. We calculate the average score for each feature across 10 partitions as the final feature importance score.
Feature selection and model training
Feature selection [32] is the process of selecting some of the most effective features from the original features to reduce the dimension of the dataset (especially important in small sample problems), and improve the performance of the learning algorithm. We adopt the SelectKBest algorithm of the open source sklearn feature selection in Python to search a minimally sized subset that maximizes the model performance. This approach greedily selects features according to the feature importance.
To train and test the classification models, the dataset is randomly partitioned into training and testing datasets with ratio 1:1. To reduce the influence of the randomness, the dataset is randomly shuffled and evaluated 10 times. Performance of the classifier was measured using receiver operating characteristic curve. All training and evaluation procedures are implemented on Python 2.7 and Pyradiomics 2.2. All model performance levels are evaluated using receiver operating characteristic (ROC) method. Areas under ROC curves the corresponding standard deviations are then computed and compared.
Result
Clinical features and surgicopathological diagnosis of ETE
The demographic and clinicopathological characteristics of the 60 patients in this study are delineated in Table 2. All the included patients have been performed the total or near-total thyroidectomy. This study included data from 15 males and 45 females, with an average age of 46.5 years (vary from 24 to 74 years old). Except for lymph node metastasis and primary tumor size, no significant statistical difference was observed between the clinicopathological features in terms of patient age, sex, location and surgical procedure in the PTC cases with and without ETE. The patients were divided into two groups based on the surgical pathology reports and surgeons’ operative reports. Among these patients, 25 patients were diagnosed as PTCs without ETE, and 35 patients were diagnosed as PTCs with ETE.
Clinicopathological features of 2 groups according to ETE & without ETE in patients with PTC
Clinicopathological features of 2 groups according to ETE & without ETE in patients with PTC
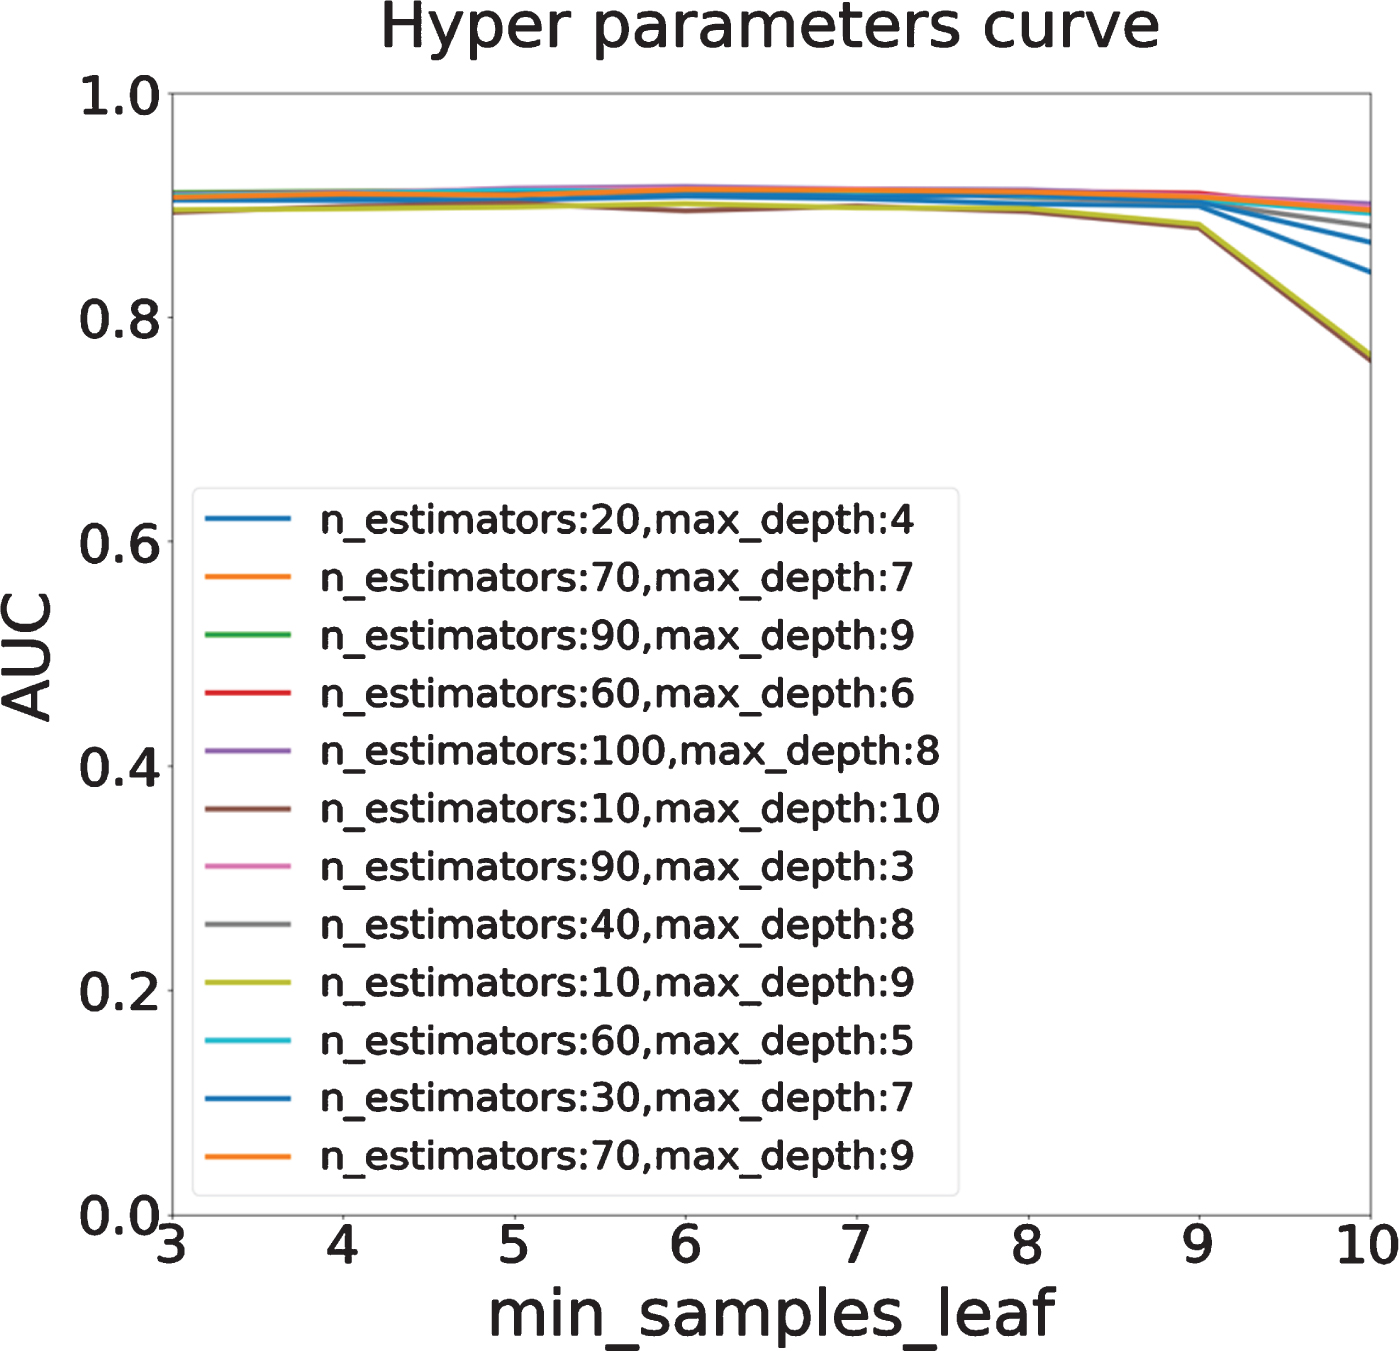
To analyze the influence of the hyper parameters on the random forest model, we do grid searching and compare the performance of different models under different hyper parameters. Specifically, we tune three most important parameters in random forest model (other parameters are set as default value): the number of trees in the forest (n_estimators, we set this value ranging from 10 to 100 with step 10), the minimum number of samples in a leaf node (min_samples_leaf, we set this value ranging from 3 to 10 with step 1), and the maximum depth of the tree (max_depth, we set this value ranging from 3 to 10 with step 1). In this section, we analyze these parameters on the T2WI-FS dataset by using the open source ‘GridSearchCV’ algorithm in python, and the AUC score is used as evaluation measurement.
Through the combination of different hyper parameter values, we can get a total of 640 (8×8×10) AUC scores, it is not possible to drawn all AUC scores in a figure, so we randomly selected 10 of them and drew the AUC scores in Fig. 3. As shown in Fig. 3, theses curves illustrate that when min_samples_leaf is too large, the AUC will decrease regardless of how the n_estimators and max_depth change. Too many samples in one leaf generally lead to feature aggregation, resulting in the discriminative features weakened by other non-discriminative features. We also explore the effect of different max_depth values and n_estimators values, and as we can see from Fig. 3, both of them can barely impact the AUC score of model. Most of the AUC scores under different hyper parameters are around 0.9, which indicates that random forest model is a robust classifier and is not sensitive to hyper parameters.
For statistical data analysis, we computed the p-values of the AUC score sets under different hyper parameters in Fig. 3. The p-values between any two AUC sets are much bigger than 0.05 (the smallest p-value is 0.684, which is computed between the AUC sets from n_estimators=10, max_depth=10 parameter and n_extimator=90, max_depth=3 parameter), which indicates that the differences between different hyper parameter combinations are not significant. This result also verified the conclusion that random forest model is not sensitive to hyper parameters.
For further verification, we also use T2WI and T2WI-combined dataset to complete the above experiments, and the same conclusions are achieved. Therefore, we use the best parameters (max_depth = 5, n_estimators = 20, min_samples_leaf = 2) provided by GridSearchCV algorithm on T2WI-FS dataset to do the following experiments.
T2WI-FS is more informative than T2WI
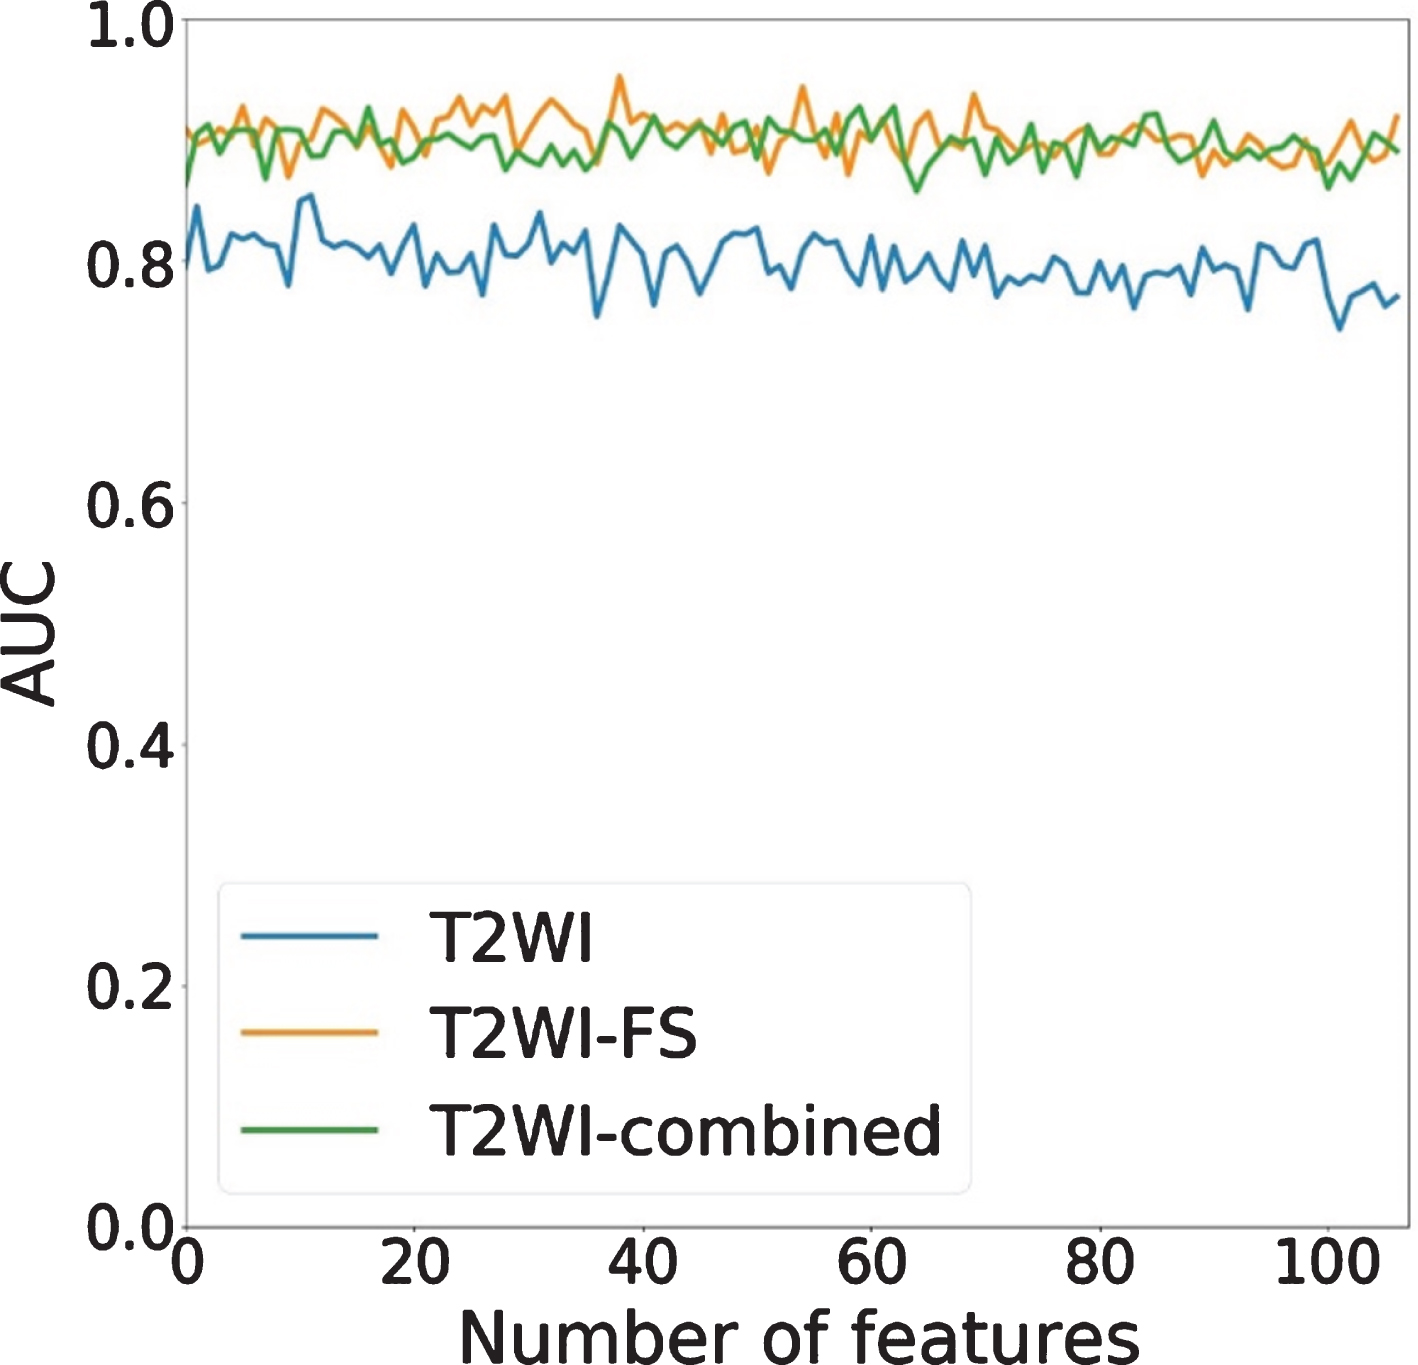
We first use max_depth = 5, n_estimators = 20, and min_sample_leaf = 2 as the hyper parameters of random forest to evaluate the performance of different feature sets. When all features of T2WI, T2WI-FS and T2WI-combined (107, 107 and 214 features, respectively) were used, the performance of these models is shown as Fig. 2. Three feature sets (T2WI, T2WI-FS and T2WI-combined) achieve average AUC 0.760, 0.906 and 0.882, with standard deviation 0.082, 0.038 and 0.060, respectively. Since the performance of T2WI-FS is better than the other two, we can infer that T2WI-FS is more informative than T2WI. And we speculate that the more severe feature redundancy (limited number of patients (60) compared with the number of features (214)) caused by combination of T2WI and T2WI-FS result in the unsatisfactory performance of T2WI-combined.
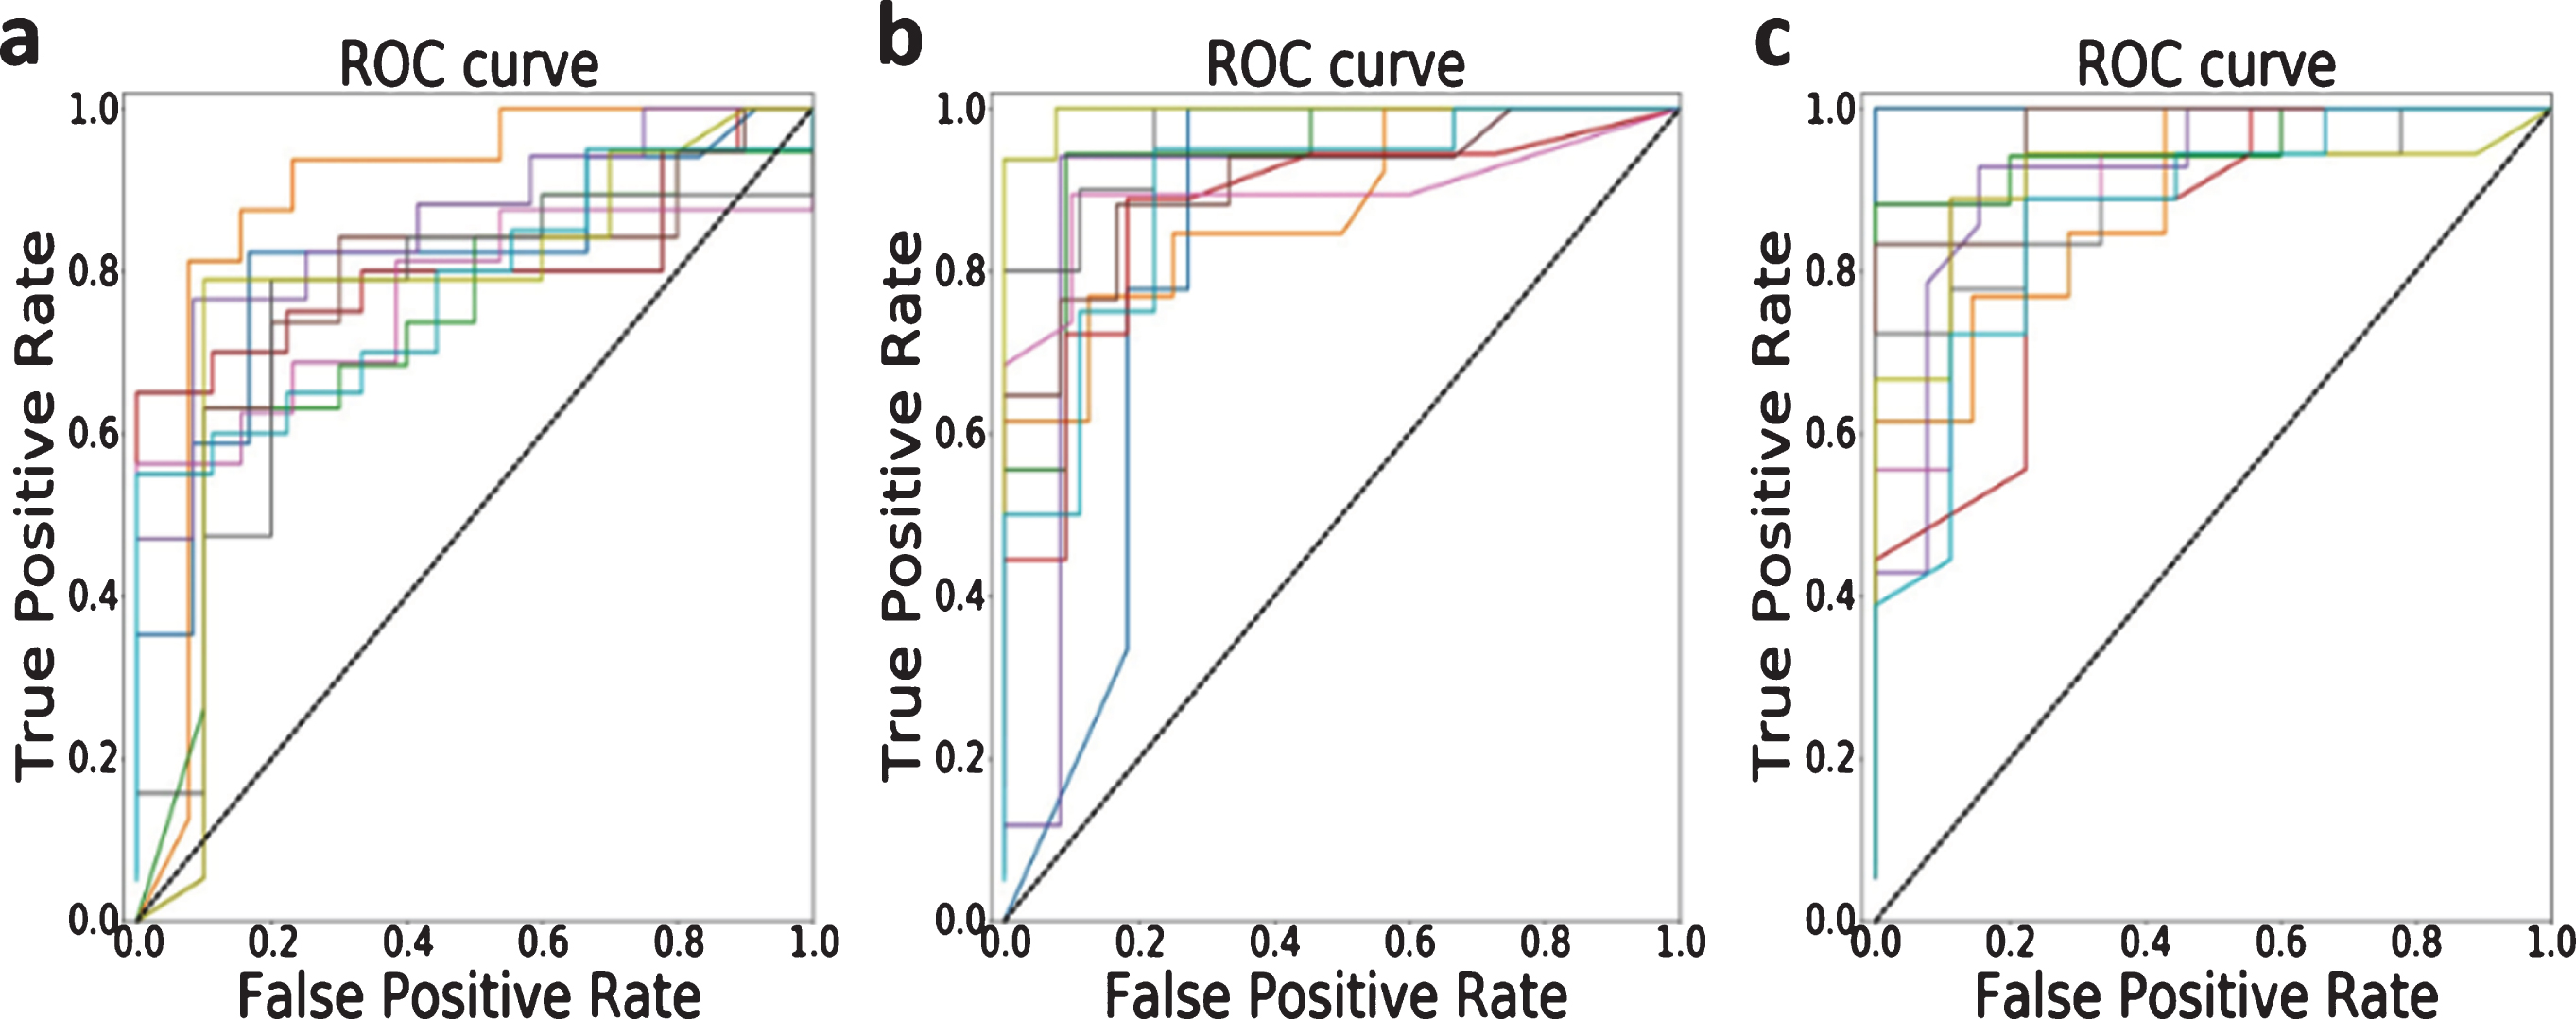
ROC curves of the random forest model using all features. (a) T2WI; (b) T2WI-FS; (c) T2WI-combined. For each feature set, training and testing dataset has been randomly partitioned 10 times.
For statistical data analysis, we made t-test on the 10 test sets shown in Fig. 2 for each dataset. For each dataset (T2WI, T2WI-FS and T2WI-combined), all the p-values of their 10 test sets are greater than 0.05 (where the smallest p-values of the three datasets are 0.1034, 0.6660 and 0.2734, respectively). The p-values show 10 sets are not statistically different, which indicates that the classifier using all features are reliable.
Figure 4 shows the AUC scores with different min_samples_leaf values on different feature sets (107 features for original, 465 features for LoG, 744 features for wavelet, 1209 features for LoG+wavelet). The average AUCs on these four feature sets are 0.906, 0.889, 0.894 and 0.889on the T2WI-FS datasets, respectively. Similarly, we also computed the p-values of the AUC scores between the three feature sets, and all the p-values are bigger than 0.05 (the smallest p-value is 0.845, which is computed between original AUC set and wavelet AUC set).
The relation between performance and min_sampels_leaf with different n_estimators and max_depth.

The relation between performance and min_sampels_leaf with different filters.
Therefore, we can conclude that although various kinds of filters can supply hundreds of new radiomics features of papillary thyroid carcinoma, the classifier cannot benefit from the new features and the curves of various kinds of filters have the similar tendency.
To get better classification performance, we do feature selection based on the feature importance. We use the open source SelectKBest algorithms in sklearn model selection in Python to do forward greedy feature selection based on feature importance. The number of features we select ranges from 1 to 107 for all the three original feature sets (T2WI, T2WI-FS, T2WI-combined).We randomly shuffle the datasets 10 times, and split the training and testing set at ratio 1:1. For each selected subset of features, we recorded the AUC scores (each subset 10 AUC scores) on the 10 test sets, the average AUC scores of each selected feature performance on three datasets are shown in Fig. 5.
AUC of the random forest model after selecting different feature set. The features are ranked by feature importance. For T2WI-combined, only the top 107 features are considered for a better visualization.
We computed the p-values between the AUC scores on different feature subsets of the three datasets, and all the 107 p-values between T2WI-FS and T2WI are smaller than 0.05 (where the highest p-value is 0.006), which means the differences between T2WI-FS and T2WI are significant. In other words, the features extracted from T2WI-FS are statistically significant than T2WI, and thus T2WI-FS performs better in classification. However, no p-value between T2WI-FS and T2WI-combined is smaller than 0.05 (where the smallest p-value is 0.119), which means the differences between T2WI-FS and T2WI-combined are not significant. We studied the features that we selected from T2WI-combined in each feature subset and find that most selected are from T2WI-FS. We suppose this is the reason for the unsignificant differences of p-values between T2WI-FS and T2WI-combined, and this result can further indicate that T2WI-FS performs better thanT2WI.
In the10 feature subsets which selected features ranging from 1 to 10, the best performances for T2WI, T2WI-FS and T2WI-combined are 0.845, 0.928 and 0.913 AUC score and standard deviation 0.184, 0.082 and 0.091 with 2, 6, 2 features selected, respectively. Specifically, for T2WI-FS, when39 features are selected, we can get highest AUC of 0.953. For statistical data analysis, we computed the p-values between different selected features to study the difference by using different number of features. The p-value results we got (only 5% of the p-values are less than 0.05) show that not all AUC scores of the selected features are significantly different. Specifically, for T2WI-FS, p-values between 6 features and 39 features, 6 features and 107 features, 39 features and 107 features are 0.049, 0.056 and 0.016, respectively. We speculate that this is because the random forest model is robust, and it is not sensitive to the number of features.
We further check the top ranked features of T2WI, T2WI-FS and T2WI-combined in Table 3. The AUC of the top 10 selected features are 0.778, 0.865 and 0.904 for T2WI, T2WI-FS and T2WI-combined, respectively. We found that for T2WI-combined, the majority of the features are coming from T2WI-FS. It is reasonable, because T2WI-FS achieves better AUC than T2WI, the features from T2WI-FS are more informative. We also found some top ranked features are shared by T2WI and T2WI-FS. Such features are likely to be the most important features. We look into the details of 5 of them appearing in top 10 ranked features. The MajorAxisLength and MinorAxisLength reflects the size of the ROI. ZoneEntropy measures the distribution uncertainty/randomness of the region sizes and gray levels. A higher value indicates more heterogeneity in the texture patterns. Coarseness measures the average difference between the center voxel and its neighborhood and indicates the rate of spatial change. Higher values represent lower spatial change rate and more uniform local texture. The last common feature, RunLengthNonUniformity, measures the similarity of run lengths across the image, with lower values indicating higher homogeneity between run lengths in the image. Roughly speaking, these three features (ZoneEntropy, Coarseness and RunLengthNonUniformity) measure the heterogeneity of the texture of ROI. Such features are in line with intuitive of a doctor.
Top ranked radiomics features on T2WI, T2WI-FS and T2WI-combined. Common features appearing in top 10 features in T2WI and T2WI-FS are highlighted
Top ranked radiomics features on T2WI, T2WI-FS and T2WI-combined. Common features appearing in top 10 features in T2WI and T2WI-FS are highlighted
For redundancy analysis of these top 10 features, we calculated the correlation coefficients for the three datasets respectively. For T2WI, the features can be divided into two groups according to their correlation coefficients, one group contains “original_glszm_ZoneEntropy” and “original_shape_Sphericity” (in which each feature’s correlation coefficients with other features are less than 0, ranges from – 0.924 to – 0.560), and the rest 8 features combine into another group (in which each feature’s correlation coefficients with other features ranges from 0.732 to 1). For T2WI-FS, the features can also be divided to two groups, one group is made up with “original_gldm_GrayLevelNonUniformity” (this feature’s correlation coefficients with others are all less than 0, ranging from – 0.520 to – 0.786), another group is made up with the rest 9 features (the correlation coefficients ranging from 0.570 to 0.996). Similarly, for T2WI-combined, one group contains “original_glszm_GrayLevelNonUniformityNormalized-T2FS”and “original_gldm_DependenceEntropy-T2FS” (the correlation coefficients ranging from – 0.83 to – 0.533), another group contains the rest 8 features (the correlation coefficients ranging from 0.744 to 1). Therefore, the selected 10 features for the three datasets are all redundant.
ETE is considered to be an important factor that affects the prognosis and recurrence of PTCs(4–6, 9), but current methods that used to predict ETE status is extremely unbalanced in specificity and sensitivity, such as US, CT and MRI(10–13). In this study, the proposed method achieves average AUC 0.760, 0.906 and 0.882 respectively on the three original feature sets: T2WI, T2WI-FS and T2WI-combined. After feature selection, the model can achieve 0.845, 0.928 and 0.913AUC within 10 selected features for T2WI, T2WI-FS and T2WI-combined. The best 0.953 AUC is achieved by selected top 39 features on T2WI-FS dataset. The AUCs showed good predictive ability of ETE status on both training and independent validation cohorts. The high AUC signified that the radiomics feature was a potential marker to discriminate ETE. Therefore, the accurate prediction of ETE preoperatively would be very important in avoiding unnecessary surgical resection in PTC patients.
The application of radiomics in medicine is still in its infancy, and additional studies are needed to examine the radiomics signatures that could predict patient aggressive behavior and outcomes [14, 25]. Compared to the conventional image analysis, radiomics don’t rely on the subjective factors and level of expertise, and can provide objective information of the lesion image [14–16, 26]. It may help radiologists avoid subjective bias related to experience. In our study, the pyradiomics software was used to extract radiomics features of each PTC. This method is generally used in radiomics, which allows the high-throughput extraction of informative imaging features to quantify the heterogeneity and phenotypic differences within tumors. Radiomics analysis in cancer studies has been proved to be reliable information that can increase the precision in diagnosis, evaluate the prognosis and predict treatment response. To our knowledge, there are few radiomics related studies on PTC, and most of them are based on US texture analysis [22, 24]. Compared with the number of cases, the radiomics features extracted in our study were much larger, therefore, to avoid overfitting, we performed feature selection to reduce the dimension of features before building the model. The present study suggested that radiomics features based on pre-contrast T2WI and T2WI-FS is helpful to predict aggressiveness histological feature ETE in PTC. T2WI-FS image features outperformed T2WI and T2WI-combined features in the classification. In the experiments, we also found that feature selection can improve the performance of the model and the most significant two features of the radiomics features are the heterogeneity of ROI texture and the size of the lesions.
We developed random forest models to predict the ETE status of PTC. The main advantage of random forests is that each tree in the forest is randomly different, and each tree is highly irrelevant. In theory, the more trees that make up a random forest, the less likely it is to overfit. Random forests can process data with small sample size, which is suitable for the study of small samples of two classifications, and is also robust to outliers.
There are several limitations in our study. Firstly, our study is a retrospective study, since the primary tumor area was selected as the region of interest in this study, there are inevitably some deviations that may affect the analysis. Secondly, the sample size of the study is small, more samples would be needed to avoid overfitting and build a robust model. Thirdly, our samples were all from the same batch and we used to leave one out cross validation method to validate the model. Cross validation was the best method to avoid overfit and decrease the false positive rate. Finally, the MR images we used in this study were acquired on the same scanner machine, so the imaging parameters are the same. Due to the fact that texture features can be affected by different imaging parameters, multi-center data should also be introduced to increase the robustness of the model.
In conclusion, in this paper, we proposed a novel method based on radiomics and preoperative MRI to predict the ETE status in PTCs. The experimental results show that radiomics features are helpful in improving the preoperative prediction of ETE in PTC patients.
Footnotes
Acknowledgments
This study was supported in part by a grant-in-aid for scientific research from the Technology Plan of Jiangsu (Project No. H2019087), the Technology Plan of Wuxi (Project No. MS201901) and the Science and Technology Development Plan of Wuxi (Project No. N20192027).