
Abstract
BACKGROUND:
Thyroid ultrasonography is widely used to diagnose thyroid nodules in clinics. Automatic localization of nodules can promote the development of intelligent thyroid diagnosis and reduce workload of radiologists. However, besides the ultrasound image has low contrast and high noise, the thyroid nodules are diverse in shape and vary greatly in size. Thus, thyroid nodule detection in ultrasound images is still a challenging task.
OBJECTIVE:
This study proposes an automatic detection algorithm to locate nodules in B ultrasound images and Doppler ultrasound images. This method can be used to screen thyroid nodules and provide a basis for subsequent automatic segmentation and intelligent diagnosis.
METHODS:
We develop and optimize an improved YOLOV3 model for detecting thyroid nodules in ultrasound images with B-mode and Doppler mode. Improvements include (1) using the high-resolution network (HRNet) as the basic network for gradually extracting high-level semantic features to reduce the missed detection and misdetection, (2) optimizing the loss function for single target detection like nodules, and (3) obtaining the anchor boxes by clustering the candidate frames of real nodules in the dataset.
RESULTS:
The experimental results of applying to 8000 clinical ultrasound images show that the new method developed and tested in this study can effectively detect thyroid nodules. The method achieves 94.53% mean precision and 95.00% mean recall.
CONCLUTIONS:
The study demonstrates a new automated method that enables to achieve high detection accuracy and effectively locate thyroid nodules in various ultrasound images without any user interaction, which indicates its potential clinical application value for the thyroid nodule screening.
Introduction
Thyroid nodules are very common lesions in clinical. The ultrasonography has been a very important tool towards the diagnosis of thyroid nodules because of its low cost, high sensitivity and safety [1]. However, with the increasing incidence of thyroid nodules and the improvement of people’s health awareness, more and more physical examinations are performed, coupled with the use of high-resolution ultrasound equipment, a large number of thyroid nodules are found [2, 3]. The increasing number of nodule detection has led to extensive researches on automatic ultrasound image analysis system. For the automatic analysis system, the automated location of nodules is the basis of the follow-up tasks, such as the segmentation and classification of nodules. Thus, it is of great significance to locate nodules effectively and accurately. However, it is very difficult to detect thyroid nodules effectively in ultrasound images, mainly due to the following challenges. Firstly, the ultrasound images have low contrast and high noise. Secondly, the thyroid nodules have diverse appearance and unclear boundary, as shown in Fig. 1(c), the iso-echoic nodules are very similar to the background of ultrasound images. Thirdly, the size of the nodules varies greatly, some nodules are very small as shown in Fig. 1(b). Fourthly, besides thyroid nodules, there are blood vessels, weasand, and some glandular tissues in the background of thyroid images, as shown in Fig. 1(a), which bring some interference for the nodule detection. In addition, as shown in Fig. 1(d), the pseudo color information in the Doppler ultrasound images is covered inside or around the nodules, which interferes with the gray information.
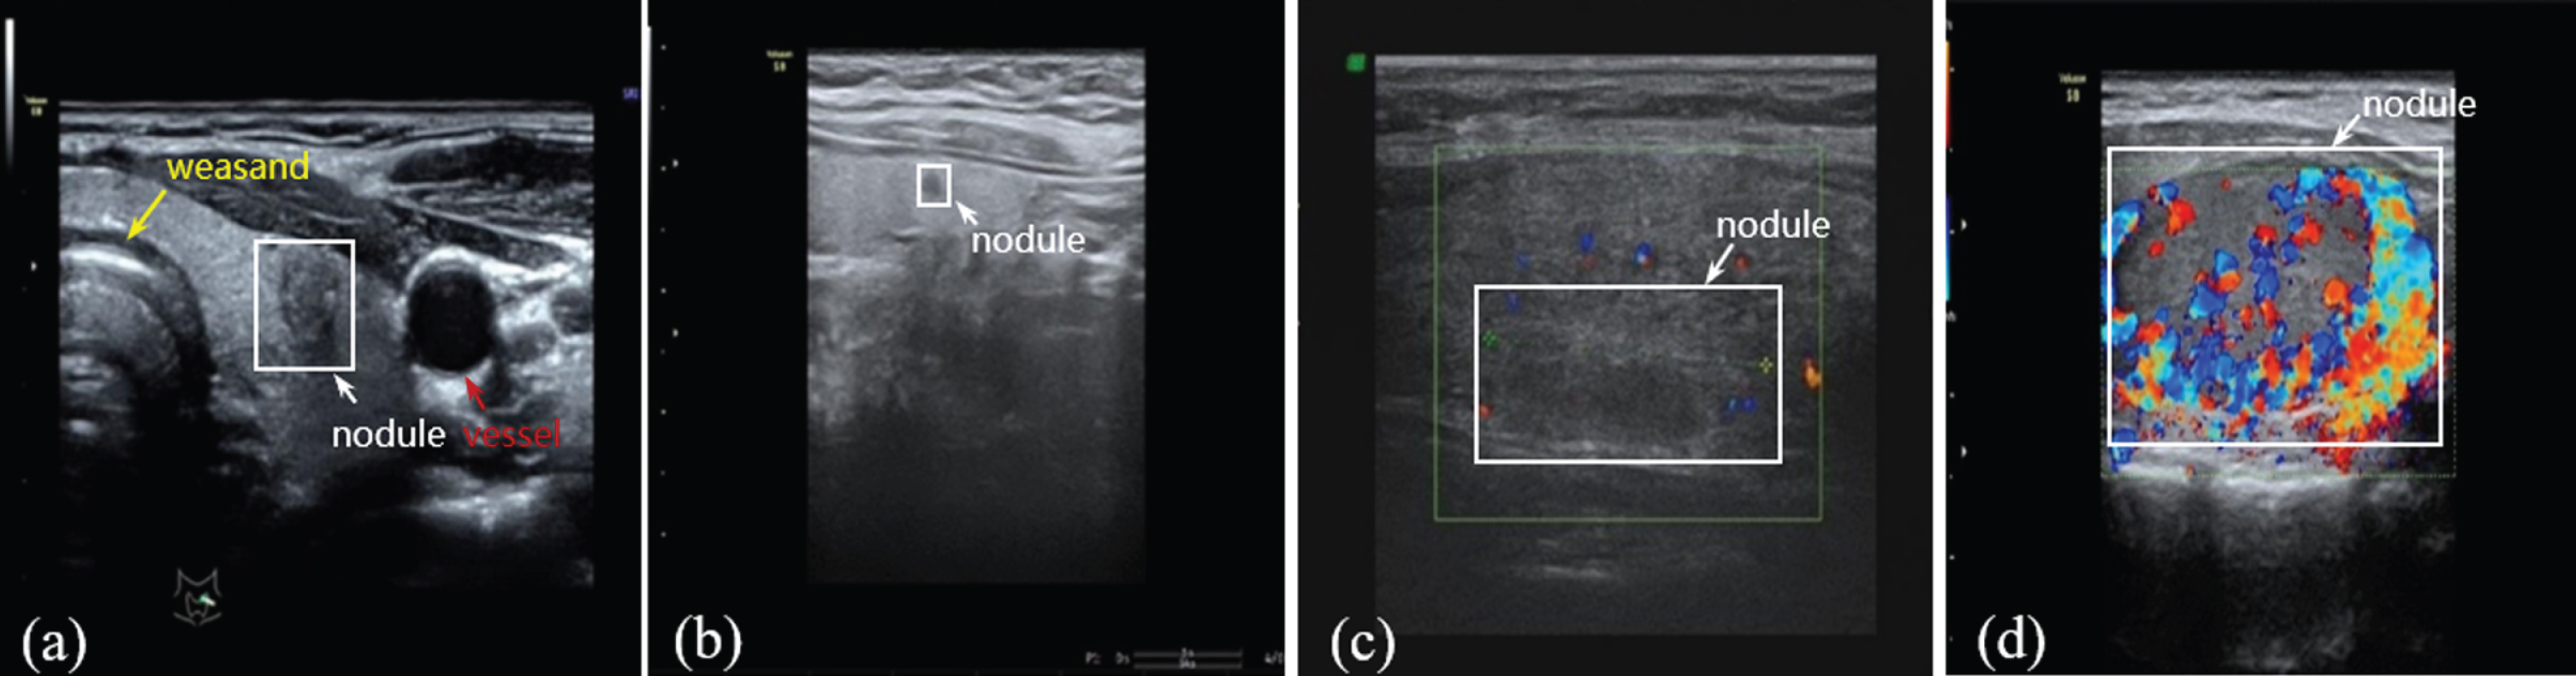
The display of thyroid nodules in ultrasound images.
In recent years, many convolutional neural networks (CNNs) of ultrasound images have been developed and applied to detect thyroid nodules. These CNNs can be roughly divided into two categories. One is based on segmentation algorithm, and the other is based on object detection algorithm.
The segmentation algorithms mainly include CNN, U-Net and FCN. For example, Ma et al. [4] designed a cascade CNN structure to classify the patches of thyroid nodules, and one was to learn segmentation probability map and the other was to extract the patch from the probability map. Zhou et al. [5] proposed an interactive segmentation method based on U-Net and the guidance of annotation marks. Ying et al. [6] used a segmentation model in form of cascaded CNN based on U-Net and FCN. Sun et al. [7] used the FCN-AlexNet of deep learning method to segment images to locate the thyroid nodules. Li et al. [8] developed an 8-layer fully CNNs. Although most of the above methods can achieve automatic detection of thyroid nodules, the training data requires manual labeling in pixel-level by doctors.
The object detection algorithms mainly include Faster RCNN, SSD and YOLO. The methods based on Faster RCNN were used to detect thyroid nodules in [9, 10]. However, the methods based on Faster RCNN are two-stage detectors, which consist of region proposal networks (RPN) and classification networks. Thus, the detection speed is slow, which limits its clinical application for screening with about 24 frames per second. The methods based on SSD and YOLOV2 are one-stage detectors, which lack the RPN. They directly predict the category and position of nodules based on anchor boxes, providing much faster detection speed. Song et al. [11] used a multi-scale SSD network to detect thyroid nodules coarsely, then the potential regions of interest were further into the spatial pyramid CNN for fine-grained thyroid nodule recognition. Xie et al. [12] proposed an algorithm based on SSD for nodule detection, and the performance for nodule detection was improved by multi-scale prediction structure, loss function and post-processing method. Wang et al. [13] established an automatic image recognition system with the YOLOV2 neural network, which was used for thyroid detection and diagnosis. Although the above three detection methods have a fast detection speed, their ability to detect small nodules is relatively weak. In the SSD network, predictions are made on multiple scales. The small nodules are predicted on low-resolution representations, but the semantics of low-resolution representations are less abundant, which leads to a low detection accuracy of small nodules. In the YOLOV2 network, the predictions of nodules are made on a single scale, so the ability to detect small nodules is relatively weak. The YOLOV3 network [14] make predictions at 3 different scales. The feature maps of two adjacent scales are merged to get more meaningful semantic information, which makes the network is good at detecting small objects. However, the detection accuracy for thyroid nodules in ultrasound images is still not high enough only using YOLOV3 model, because the high-resolution representations are needed for target detection.
Considering the High-Resolution Net (HRNet) [15] can connects multi-resolution sub-networks in parallel to maintain high-resolution through the whole process, we proposed a CNN model combining HRNet and YOLOV3 for thyroid nodule detection. The HRNet [15] are used to extract multi-level features form ultrasound images, then nodules are predicted at different scales of feature maps. And according to the YOLOV3 network [14], we framed object detection as a regression problem to design the loss function. The labels for training the network are the bounding boxes of nodules that drawn by an experienced radiologist manually. The ultrasound images in B-mode and Doppler mode were collected and used as input data for training the CNN model. The trained CNN model was used for detecting detect thyroid nodules in ultrasound images.
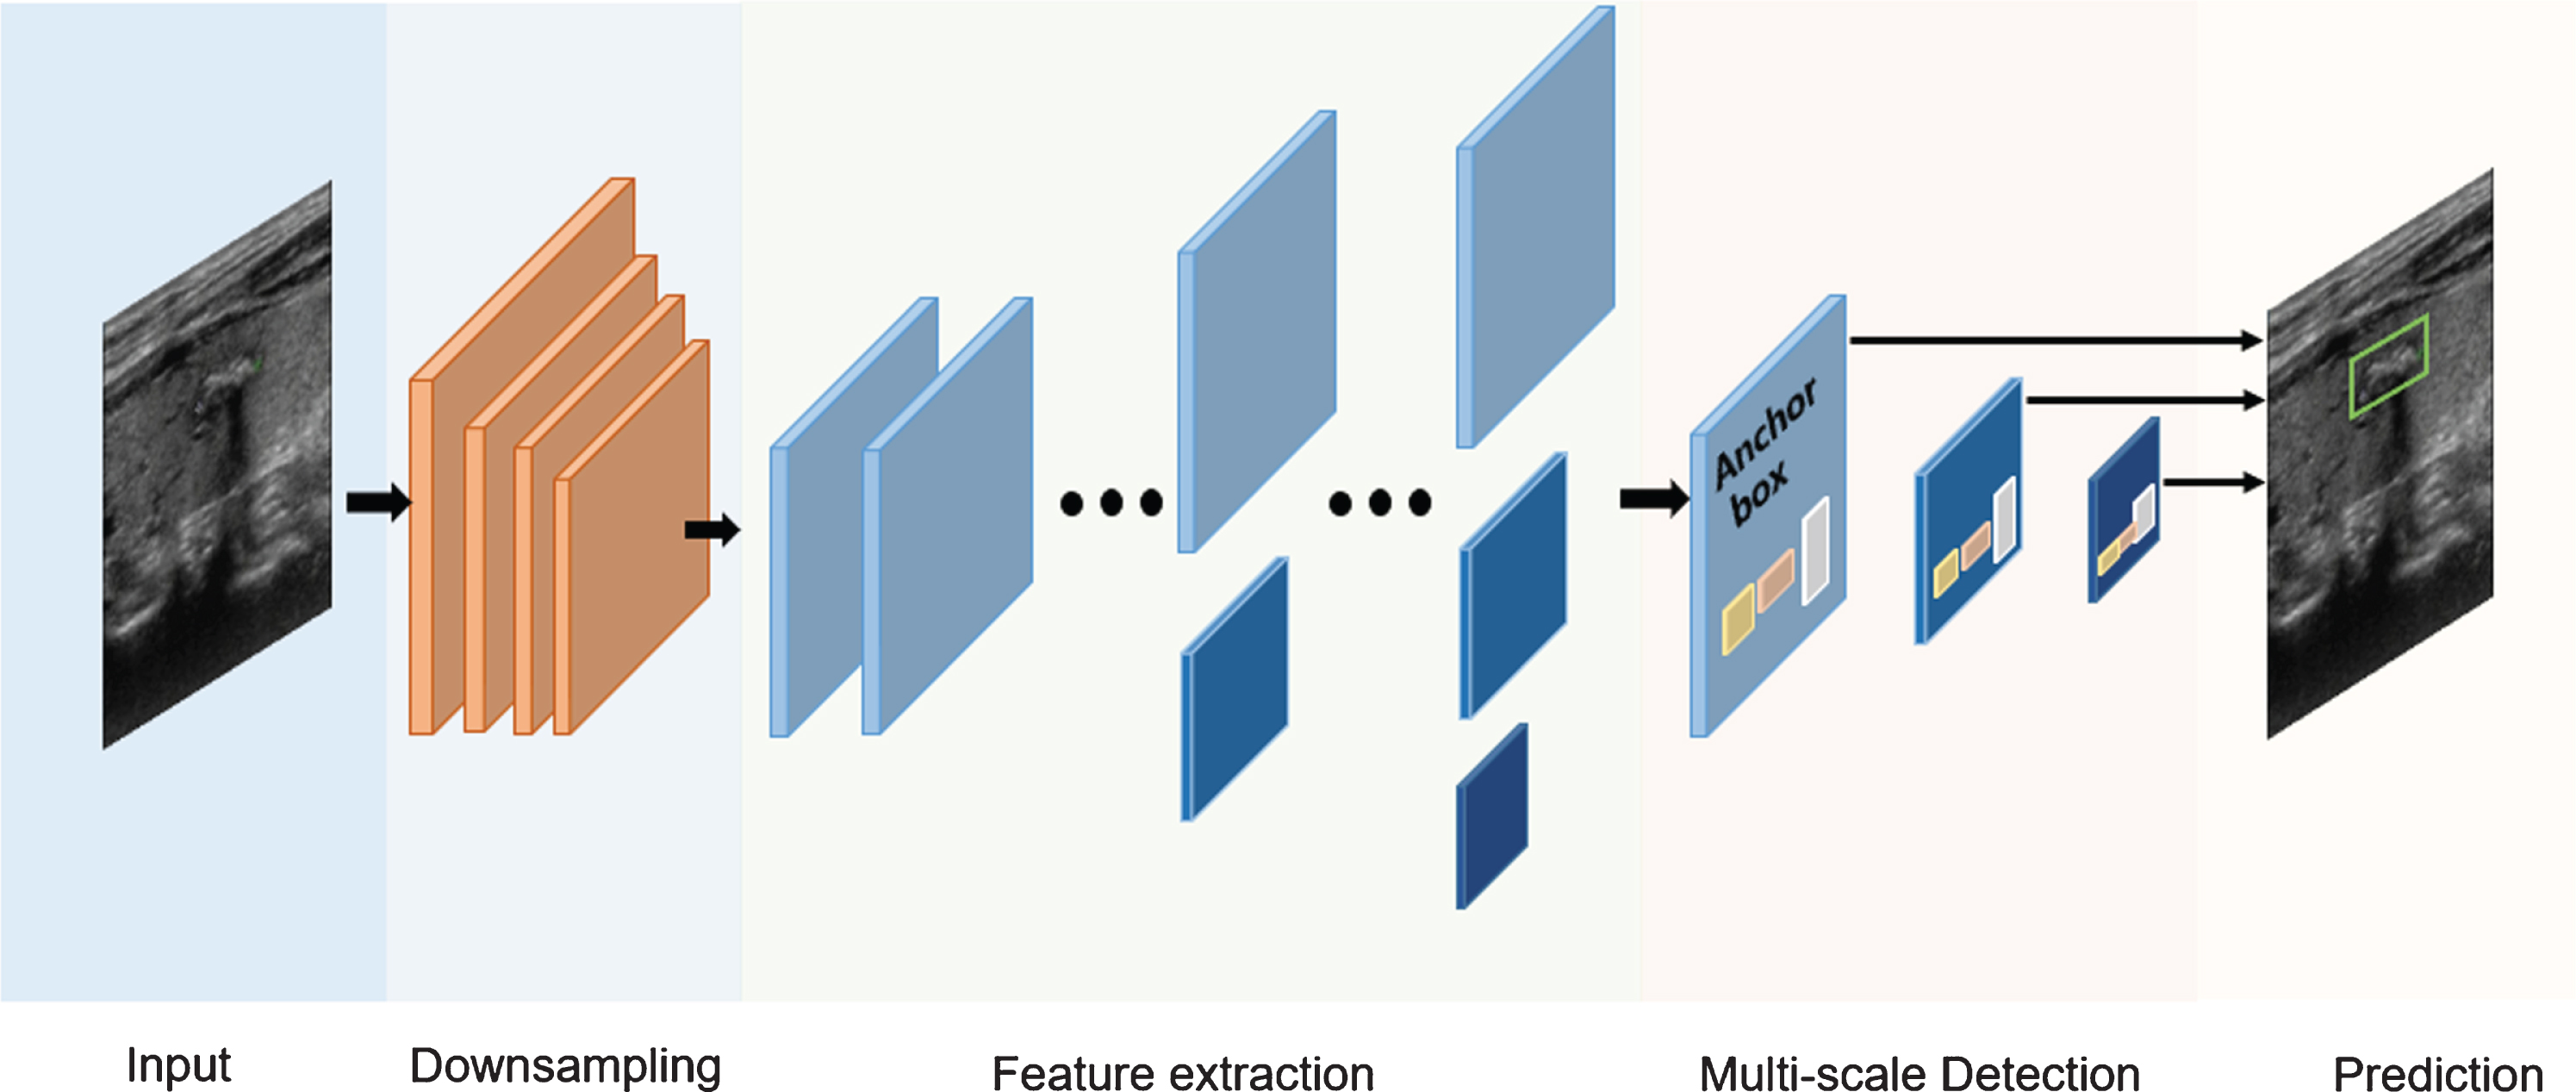
The YOLOV3
The YOLOV3 detection model is shown in Fig. 2. The YOLOV3 network firstly zooms the original images were firstly zoomed to 416×416, then the images are divided into S*S(S = 13) grids according to the scale of the feature map. The YOLOV3 network detects the targets on three scales of 13×13, 26×26 and 52×52. And Fig. 2 shows an illustration of detection on S×S grids. If the center of the target ground truth falls in a grid, then the grid is responsible for detecting the target. Each grid predicts 3 bounding boxes by 3 anchor boxes, as well as their confidence scores and C class conditional probabilities. The network predicts 4 values for each bounding box in each cell, which are the target’s coordinate (x, y), the width w and the height h. They are recorded as t x , t y , t w , t h respectively, where t x , t y represents the offset from the current grid, and t w , t h represents the transformation scale relative to the anchor boxes. If the grid has an offset (c x , c y ) from the upper left corner of the image and the anchor box has a height p h and a width p w , the modified bounding box is calculated as follows:

YOLOV3 detection.
We proposed the network which named YOLO-HRNet, as shown in Fig. 3, which was divided into five modules: input, down sampling, feature extraction, detection and prediction. The input was the ultrasound images with thyroid nodules. The down sampling module aimed to reduce the scale and parameters of the network. The feature extraction module was a HRNet [15], which was used to gradually extract higher-level semantic features. We used the multi-scale detection as the detect module, and we perform regression on the prior anchor boxes on the feature maps of different resolutions to detect nodules. The outputs of the network were the location and probability of the predicted nodules. The detailed structures of feature extraction module and multi-scale detection module are introduced in detail in sections 2.2.1 and 2.2.2.
Architecture of our YOLO-HRNet framework.
The detailed structure of HRNet [15] for gradually extracting high-level semantic features is shown in Fig. 4, which mainly consists of two components: parallel multi-resolution convolutions and repeated multi-resolution fusions. In the multi-resolution parallel convolution units, the convolution streams are conventional convolutions at different spatial resolutions. In the multi-resolution fusion unit, the input and output channels are connected in a fully-connected fashion, and each output channel is the sum of all the input channels. There are three stages of the network. The stage1 is a high-resolution convolution stream. We gradually add the high-to-low resolution streams one by one, and perform a regular convolution over each resolution stream, then fuse the multi-resolution streams in a full-connection form. The stage2 consists of two parallel convolutions and the stage 3 consists of three parallel convolutions.
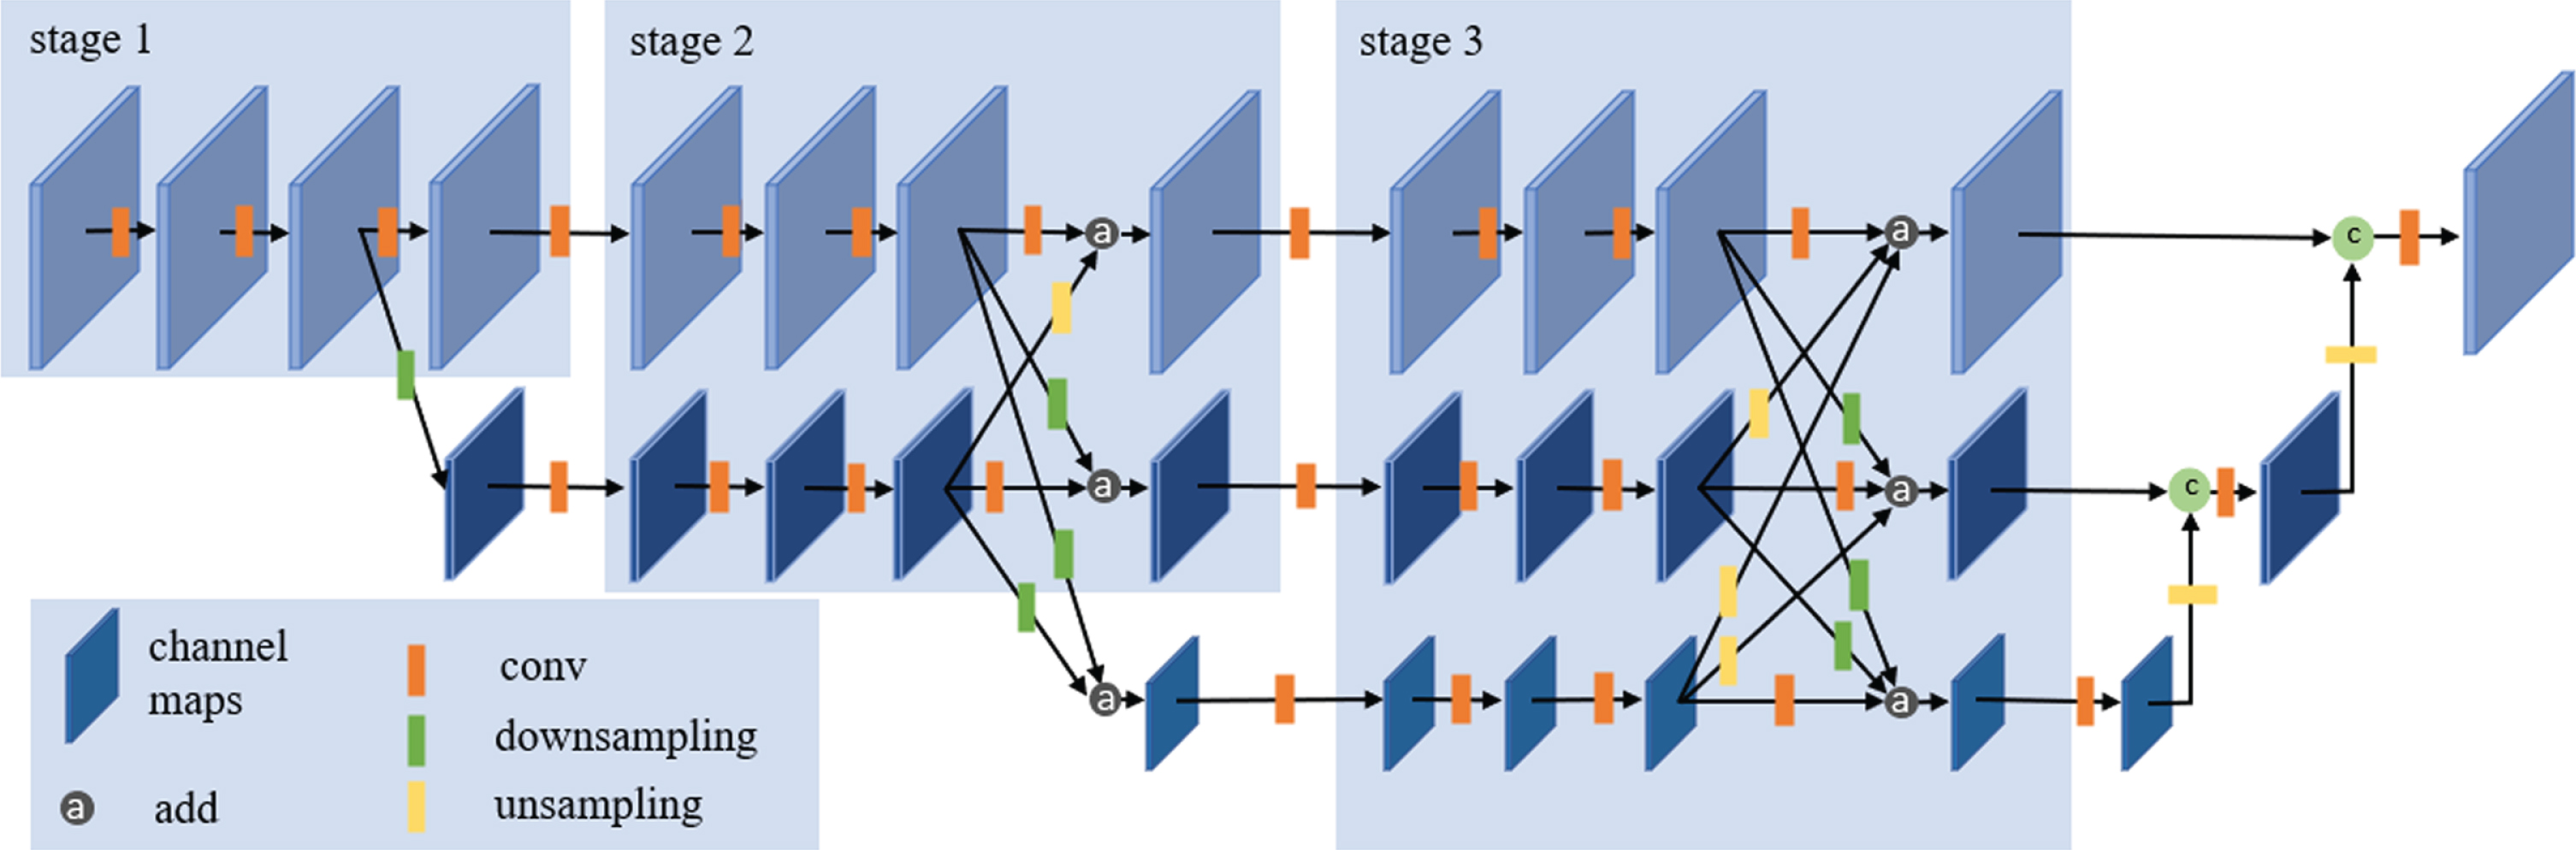
The detailed structure of HRNet. There are three stages. Each stage consists of a corresponding number of parallel convolution streams.
The small orange rectangle in Fig. 4 represents one 3×3 convolution, and each convolution is followed by a batch normalization function and a ‘Leaky Relu’ activation function to accelerate the training of deep CNN network. The small green rectangle represents the down sampling, which is completed by convolution. One stride-2 3×3 convolution for 2× down sampling, and two consecutive stride-2 3×3 convolutions for 4×down sampling. The small yellow rectangle represents up sampling, which consists of a bilinear up sampling followed by a 1×1 convolution. The 1×1 convolution is used to make representations of different resolutions have the same channel numbers, so they can be fused by addition.
Three representations of different resolutions are outputted from the HRNet. We unsampled the low-resolution representation and merged it with the medium-resolution representation using concatenation. And we continued to upsample the result, and merged it with the high-resolution representation using concatenation. Then the combined representation was inputted to the detection module for nodule detection.
The nodule detection module is shown in Fig. 5. The output of the feature extraction network is the input of multiscale fusion network. Followed by the input are two consecutive stride-2 3×3 convolutions, through which we can get a series of representations from large to small. According to this, we can predict nodules on multiple scales. We used the smallest representation to detect the relatively large nodules. Then we unsampled the smallest representation and merged it with the middle representation using concatenation, followed by it is a 1×1 convolution to further fuse the representations, and the nodules with medium size would be detected using the fused representations. We continued to upsample the fused representation and merged it with the largest representation to detect the relatively small nodules. This method allows us to get more abundant semantic information from the combined representations, and the predictions from the three scales allow us to detect nodules with different sizes.

Multi-scale detection network. The anchor boxes were set based on the scales and aspect ratio of real nodules.
We also predicted the location of nodules using anchors with designed sizes and aspect ratios. Generally, anchors are a set of initial candidate boxes defined on feature maps with fixed width and height. After shifting and resizing, these anchors are mapped back to the original image to get proposals, so the settings of these anchors will influence the quality of the prediction. In the paper, we set anchors based on the statistics of tumor size and shape in our dataset. The k-means clustering on the bounding boxes in training set was used to determine the anchor boxes, the distance metric in k-means was the Intersection-over-Union(IOU) of rectangular boxes, which was the same as that in YOLOV3 [14]. Considering the relationship between the distance metric and the number of anchors, we chose 9 clusters in our dataset, the 9 clusters were: (20,31), (24,21), (27,34), (39,40), (47,59), (65,52), (73,77), (117,101), (179,150).
The detailed structure of YOLO-HRNet is shown in Fig. 6. The down sampling module consists of three consecutive stride- 2 3×3 convolutions for 8×down sampling, decreasing the resolution to 1 / 8 of the original. In order to retain the low-level features of the images, in the first two convolutions, we only added the batch normalization layer but no activation layer, which was equivalent to the linear transformation of the original images. The detailed structure of HRNet is shown in Fig. 4, and the convolution in Fig. 4 is the same as the DBL module in Fig. 6, which consists of a 3×3 convolution connected by a batch normalization layer and a ‘Leaky Relu’ activation layer. And the down sampling in Fig. 4 is the same as Downsampling2 module in Fig. 6.
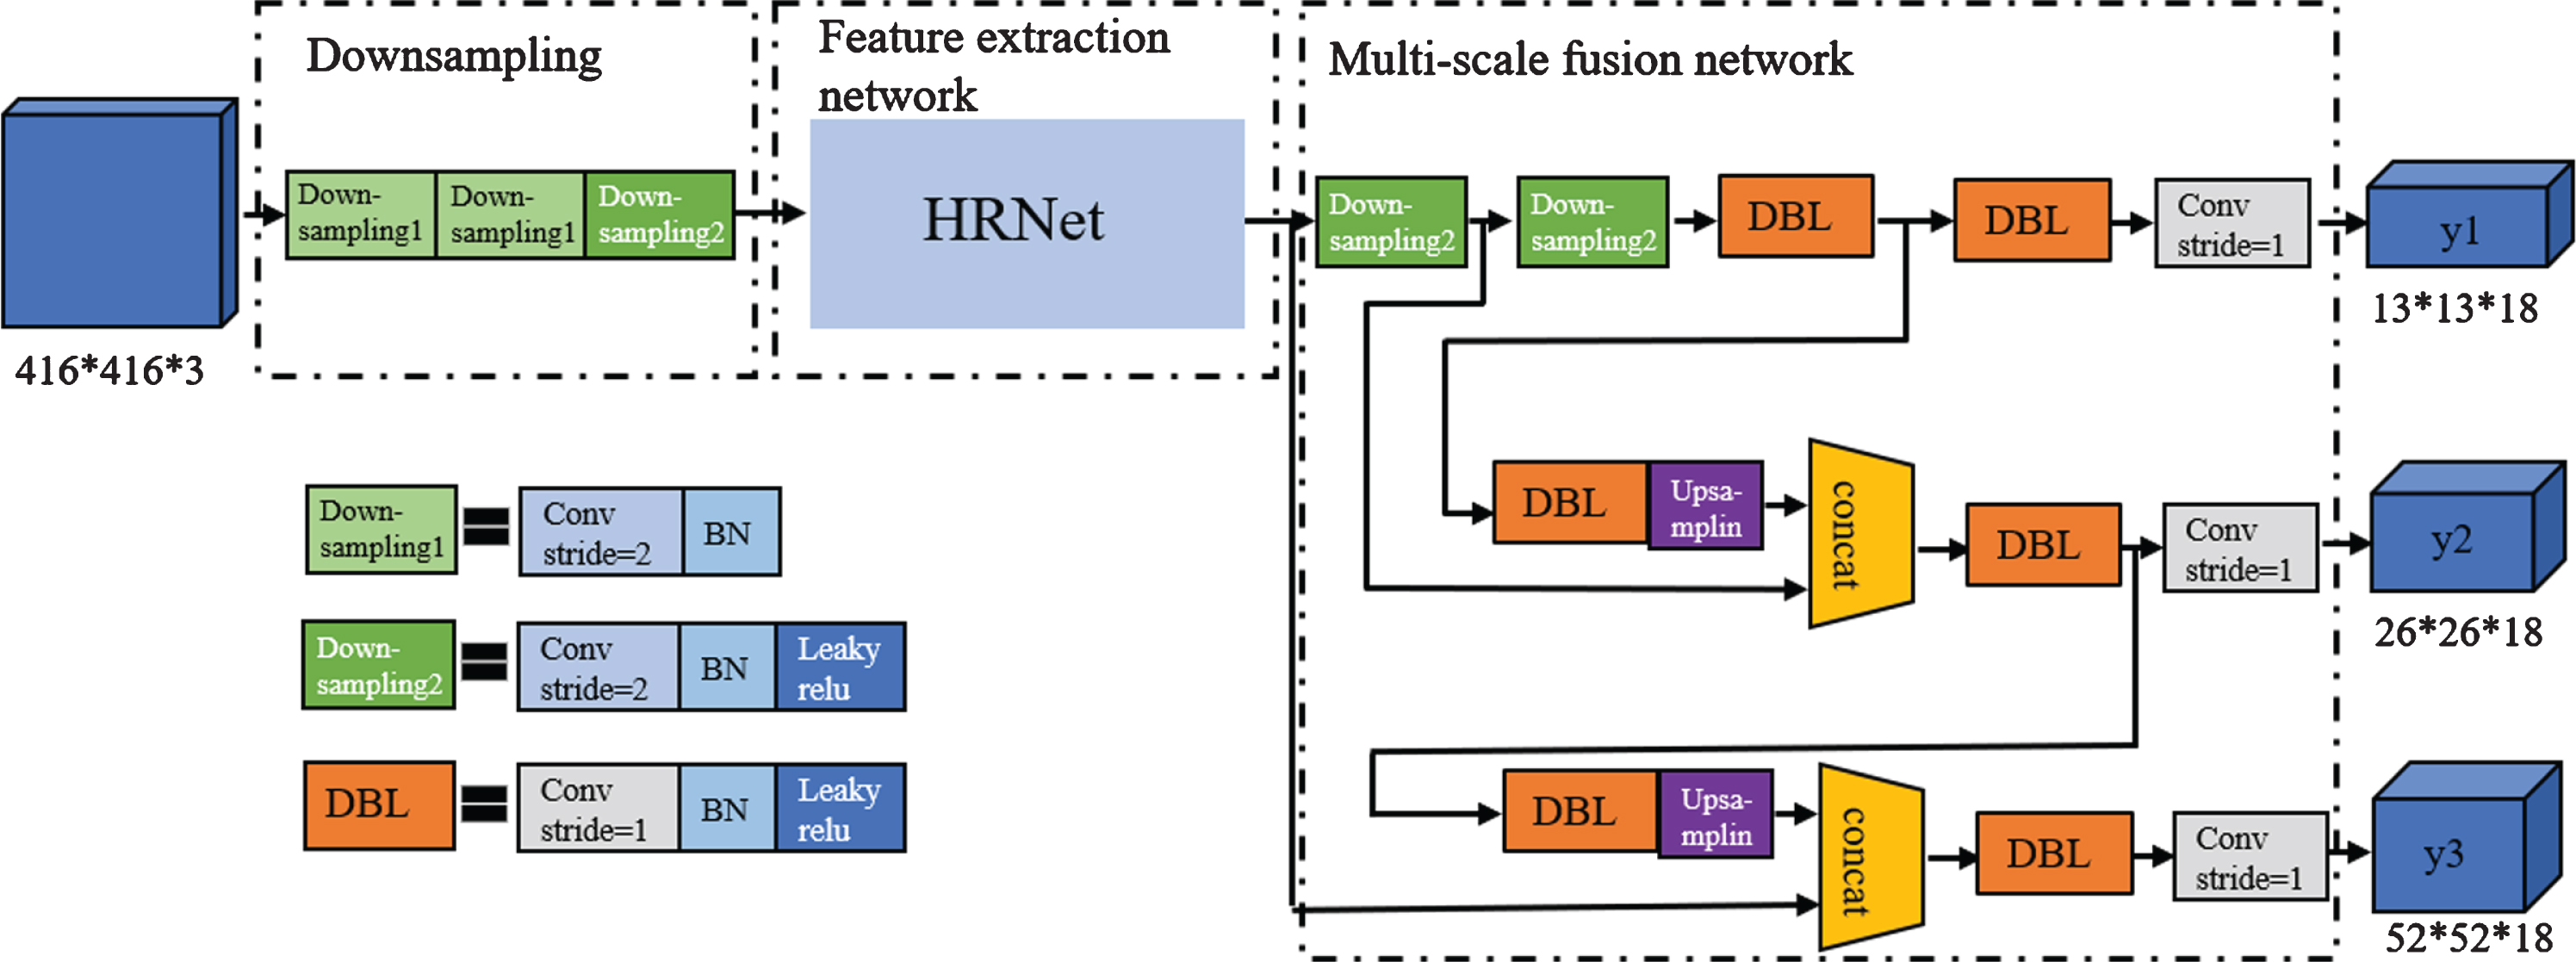
The detailed structure of YOLO-HRNet.
We transformed the detection into a regression problem like the YOLOV3 [13]. The loss function was improved on the loss function of YOLOV3, which is defined as follows:
The coordinate prediction error L coord is defined as follows:
The confidence score error L
conf
is defined as follows:
The classification error L
cls
is defined as follows:
Data set
The dataset was provided by the Department of Ultrasound of China-Japan Friendship Hospital in China, which consists of 8000 thyroid nodule images that were collected by various kinds of ultrasonic equipment, and all the sensitive information had been removed. The images were acquired from patients whose age range from 18 to 88, with a mean image size of 768×576 pixels. There was one thyroid nodule in each image, and the bounding box of each nodule was manually drawn by an experienced radiologist. There are two types of ultrasound images in the dataset: B-mode ultrasound images and Doppler ultrasound images. The size and location of nodules in each image were different, and we did not deliberately choose nodules with a specific size or position. There were different echo types of the nodules, such as hyperechoic, isoechoic and hypoechoic. The dataset would be randomly divided into training and test sets by a ratio of 9:1, so the training set contained 7,200 ultrasound images, and the test set contained 800 ultrasound images. The proportion of training set and test set is relatively balanced, as shown in Table 1. The size of the nodules was calculated according to the square root of the pixels. The size distribution of thyroid nodules in our study was summarized in Fig. 7(a). We can see that some nodules may be very small compared to the whole picture (as shown in Fig. 7(b)), while others may be very large (as shown in Fig. 7(c)). And the types of nodules were divided into isoechoic and non-isoechoic (include hyperechoic and hypoechoic).
Summary of ultrasonic image features
Summary of ultrasonic image features
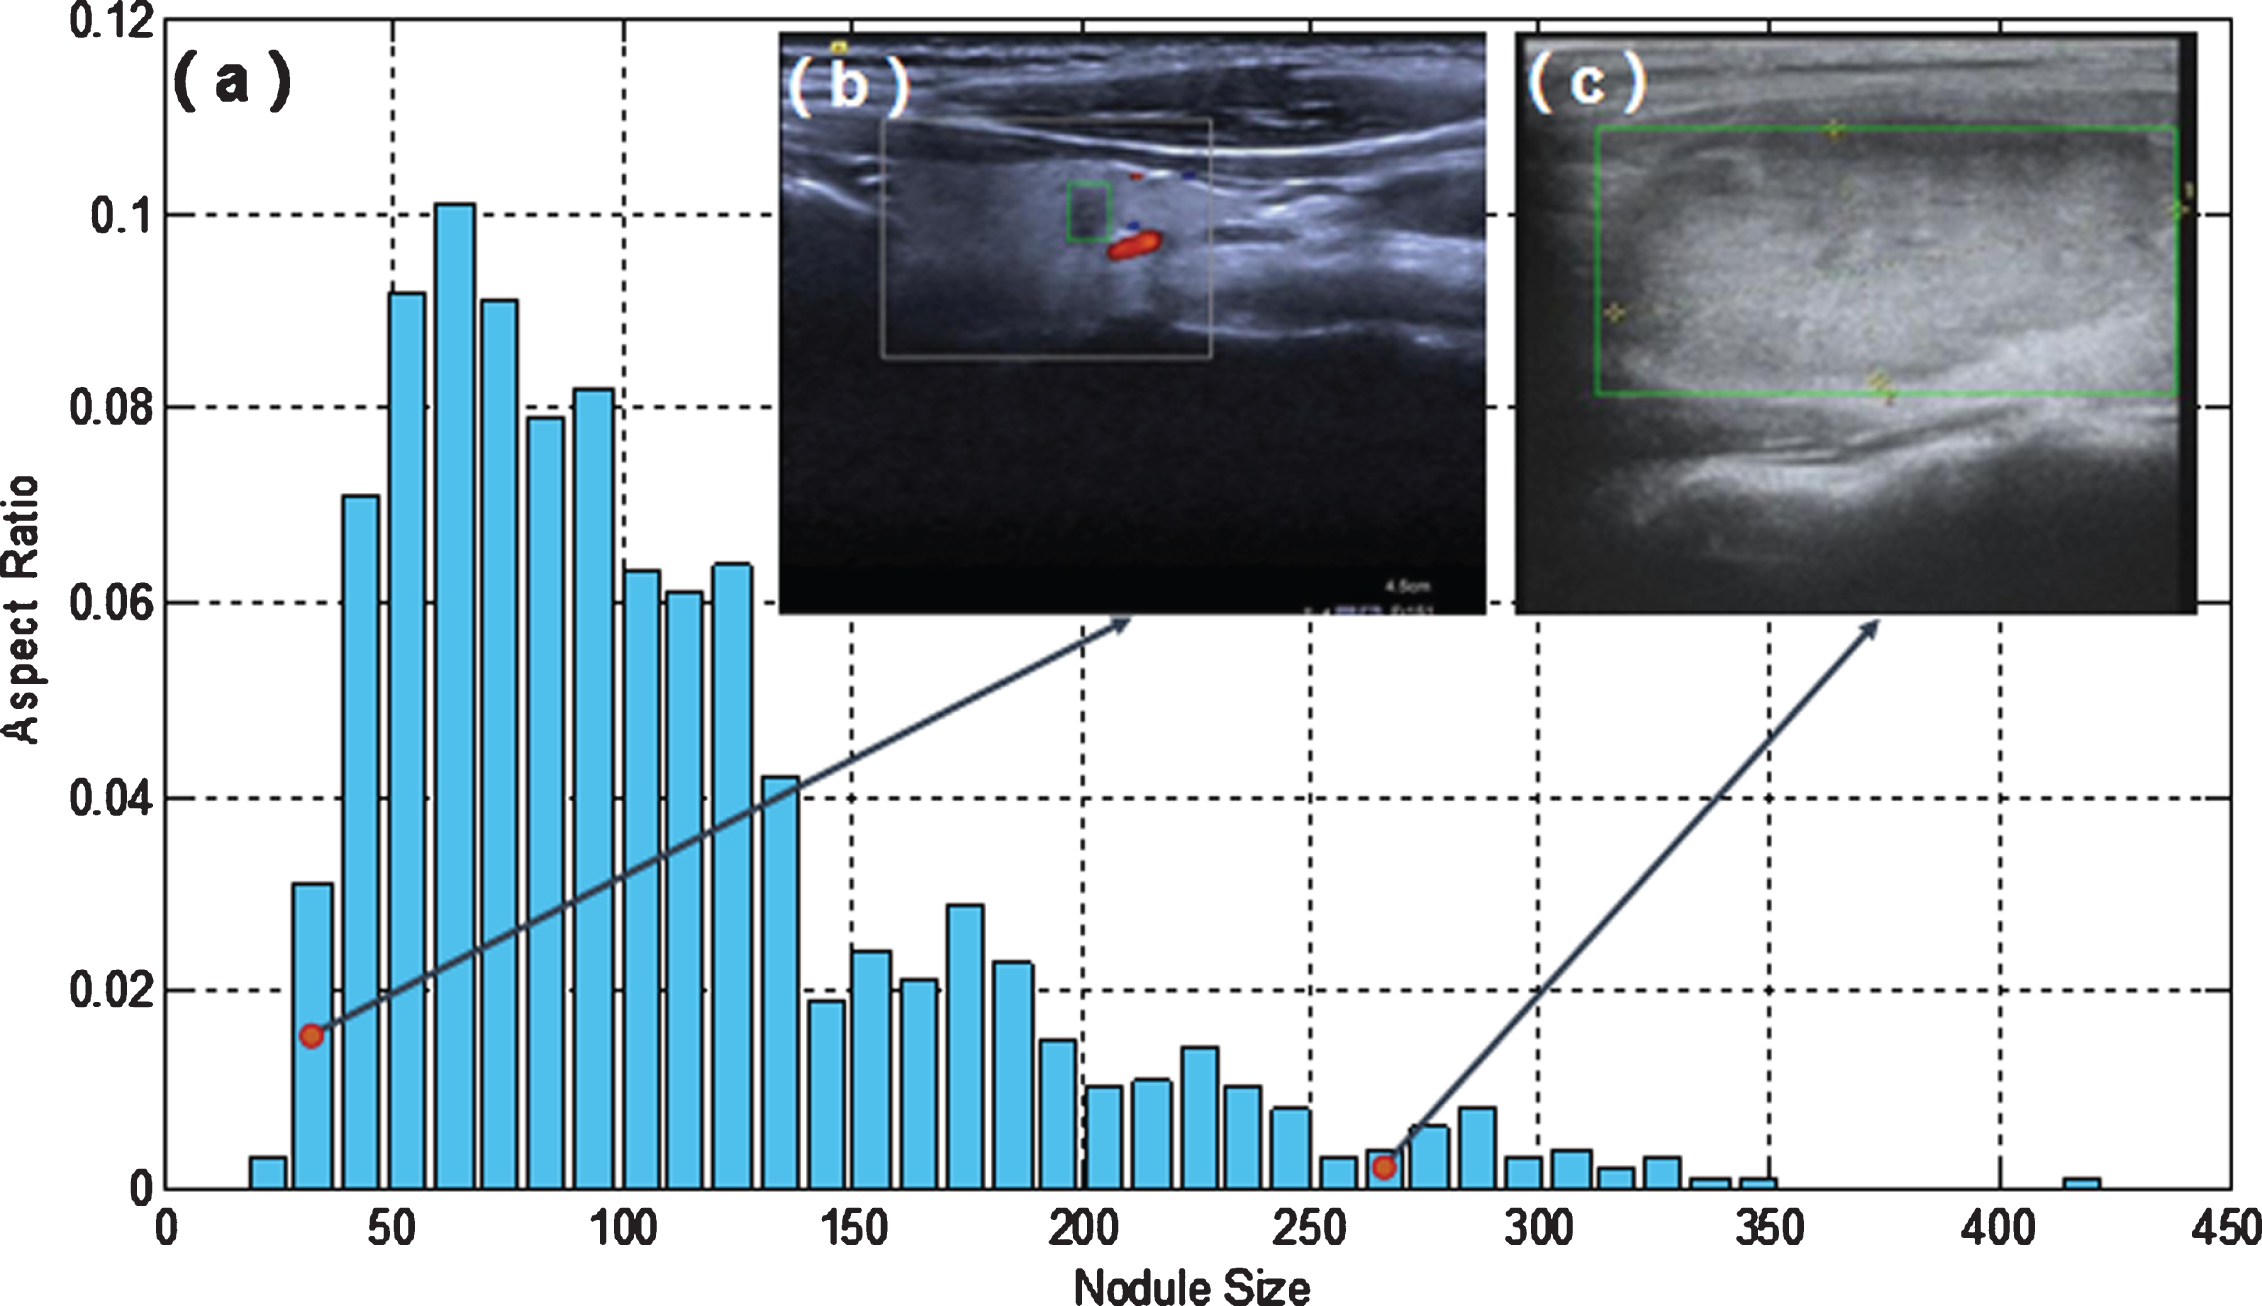
(a) The scale histogram of thyroid nodules (pixels); (b) A small nodule; (c) A large nodule. The red dots in (a) indicate the position of the nodules in (b) and (c) in the scale histogram.
The configuration of hardware and software used in this experiment is shown in Table 2. The input images were 416×416 pixels. Considering the memory constraints of the server, the batch size was set to 4 in this paper. Nadam was used for optimization during training. And Nadam is an optimization algorithm can be approximately regarded as Adam algorithm with nesterov momentum term. It has stronger constraints on learning rate and can affect the update of gradient. Generally, the effect of Nadam optimization algorithm is better than that of rmsprop or Adam. And the approaches such as translation, scale, flip, rotation were used on our training samples for data augmentation.
Experiment platform configuration
Experiment platform configuration
The related indicators for evaluating the results of thyroid nodules detection are as follows:
A. IOU
IOU is defined as follows:
B. Precision, Recall, and F1 Score
Precision(P) and recall(R) and F1 score are defined as follows:
C. Detection Time
We use the time taken to test a single image to evaluate the real-time performance of the method.
Quantitative assessment
The performance of YOLO-HRNet proposed in this paper was compared with that of YOLOV3 with the same parameter settings. Detections with confidence scores above 0.08 will be considered positive. The experimental data results of the models were shown in Table 3. We can see from the results that our proposed YOLO-HRNet was superior to the YOLOV3. The precision, recall, F1 score of YOLO-HRNet proposed in this paper on the test set were 94.53%, 95.00%, 94.76%, which have improved by 2.61%, 3.95%, 3.28% compared to that of YOLOV3. This indicates that the performance of the YOLOV3-HRNet is better than that of YOLOV3. The IOU value of YOLOV3-HRNet is 75.20%, which is higher than that of YOLOV3(3.29%). This result shows that YOLOV3-HRNet had higher accuracy in detecting nodules than YOLOV3. The average detection time of YOLO-HRNet was 0.038s, which was less than 0.049s of YOLOV3. It could provide real-time detection of thyroid nodules. And the P-R curves for several models during testing were shown in Fig. 8, from which we can see that the P-R curve of YOLO-HRNet is located above the PR curve of YOLOV3. It shows that YOLO-HRNet has higher precision and recall.
Detection performance with different network architectures
Detection performance with different network architectures

P-R curves for the detection models.
From different categories, we can see that the F1 and IOU scores of the two networks in B-mode ultrasound images were higher than that in Doppler ultrasound images, which indicated that the pseudo color information in Doppler ultrasound images does increase the difficulty of nodule detection. In the same way, compared to non-echoic nodules and large nodules, it is more difficult to detect isoechoic nodules and small nodules for the networks.
Figure 9 shows some detection results of thyroid nodules with different sizes in B-mode ultrasound images. The iso-echoic nodules in the Fig. 9(c) and (i) are very similar to the background, and the nodule in Fig. 9(f) has irregular shape and blurred boundary. These nodules failed to be recognized by the YOLOV3, while our YOLO-HRNet could identify these nodules and predict accurate bounding boxes. In Fig. 9(b), although YOLOV3 detects the real nodule, it also mistakenly detects a false region, while YOLO-HRNet has no false positives. And from the other detection results in Fig. 9, the bounding boxes predicted YOLO-HRNet have higher IOU with the true nodules than those predicted by YOLOV3, which are more accurate.
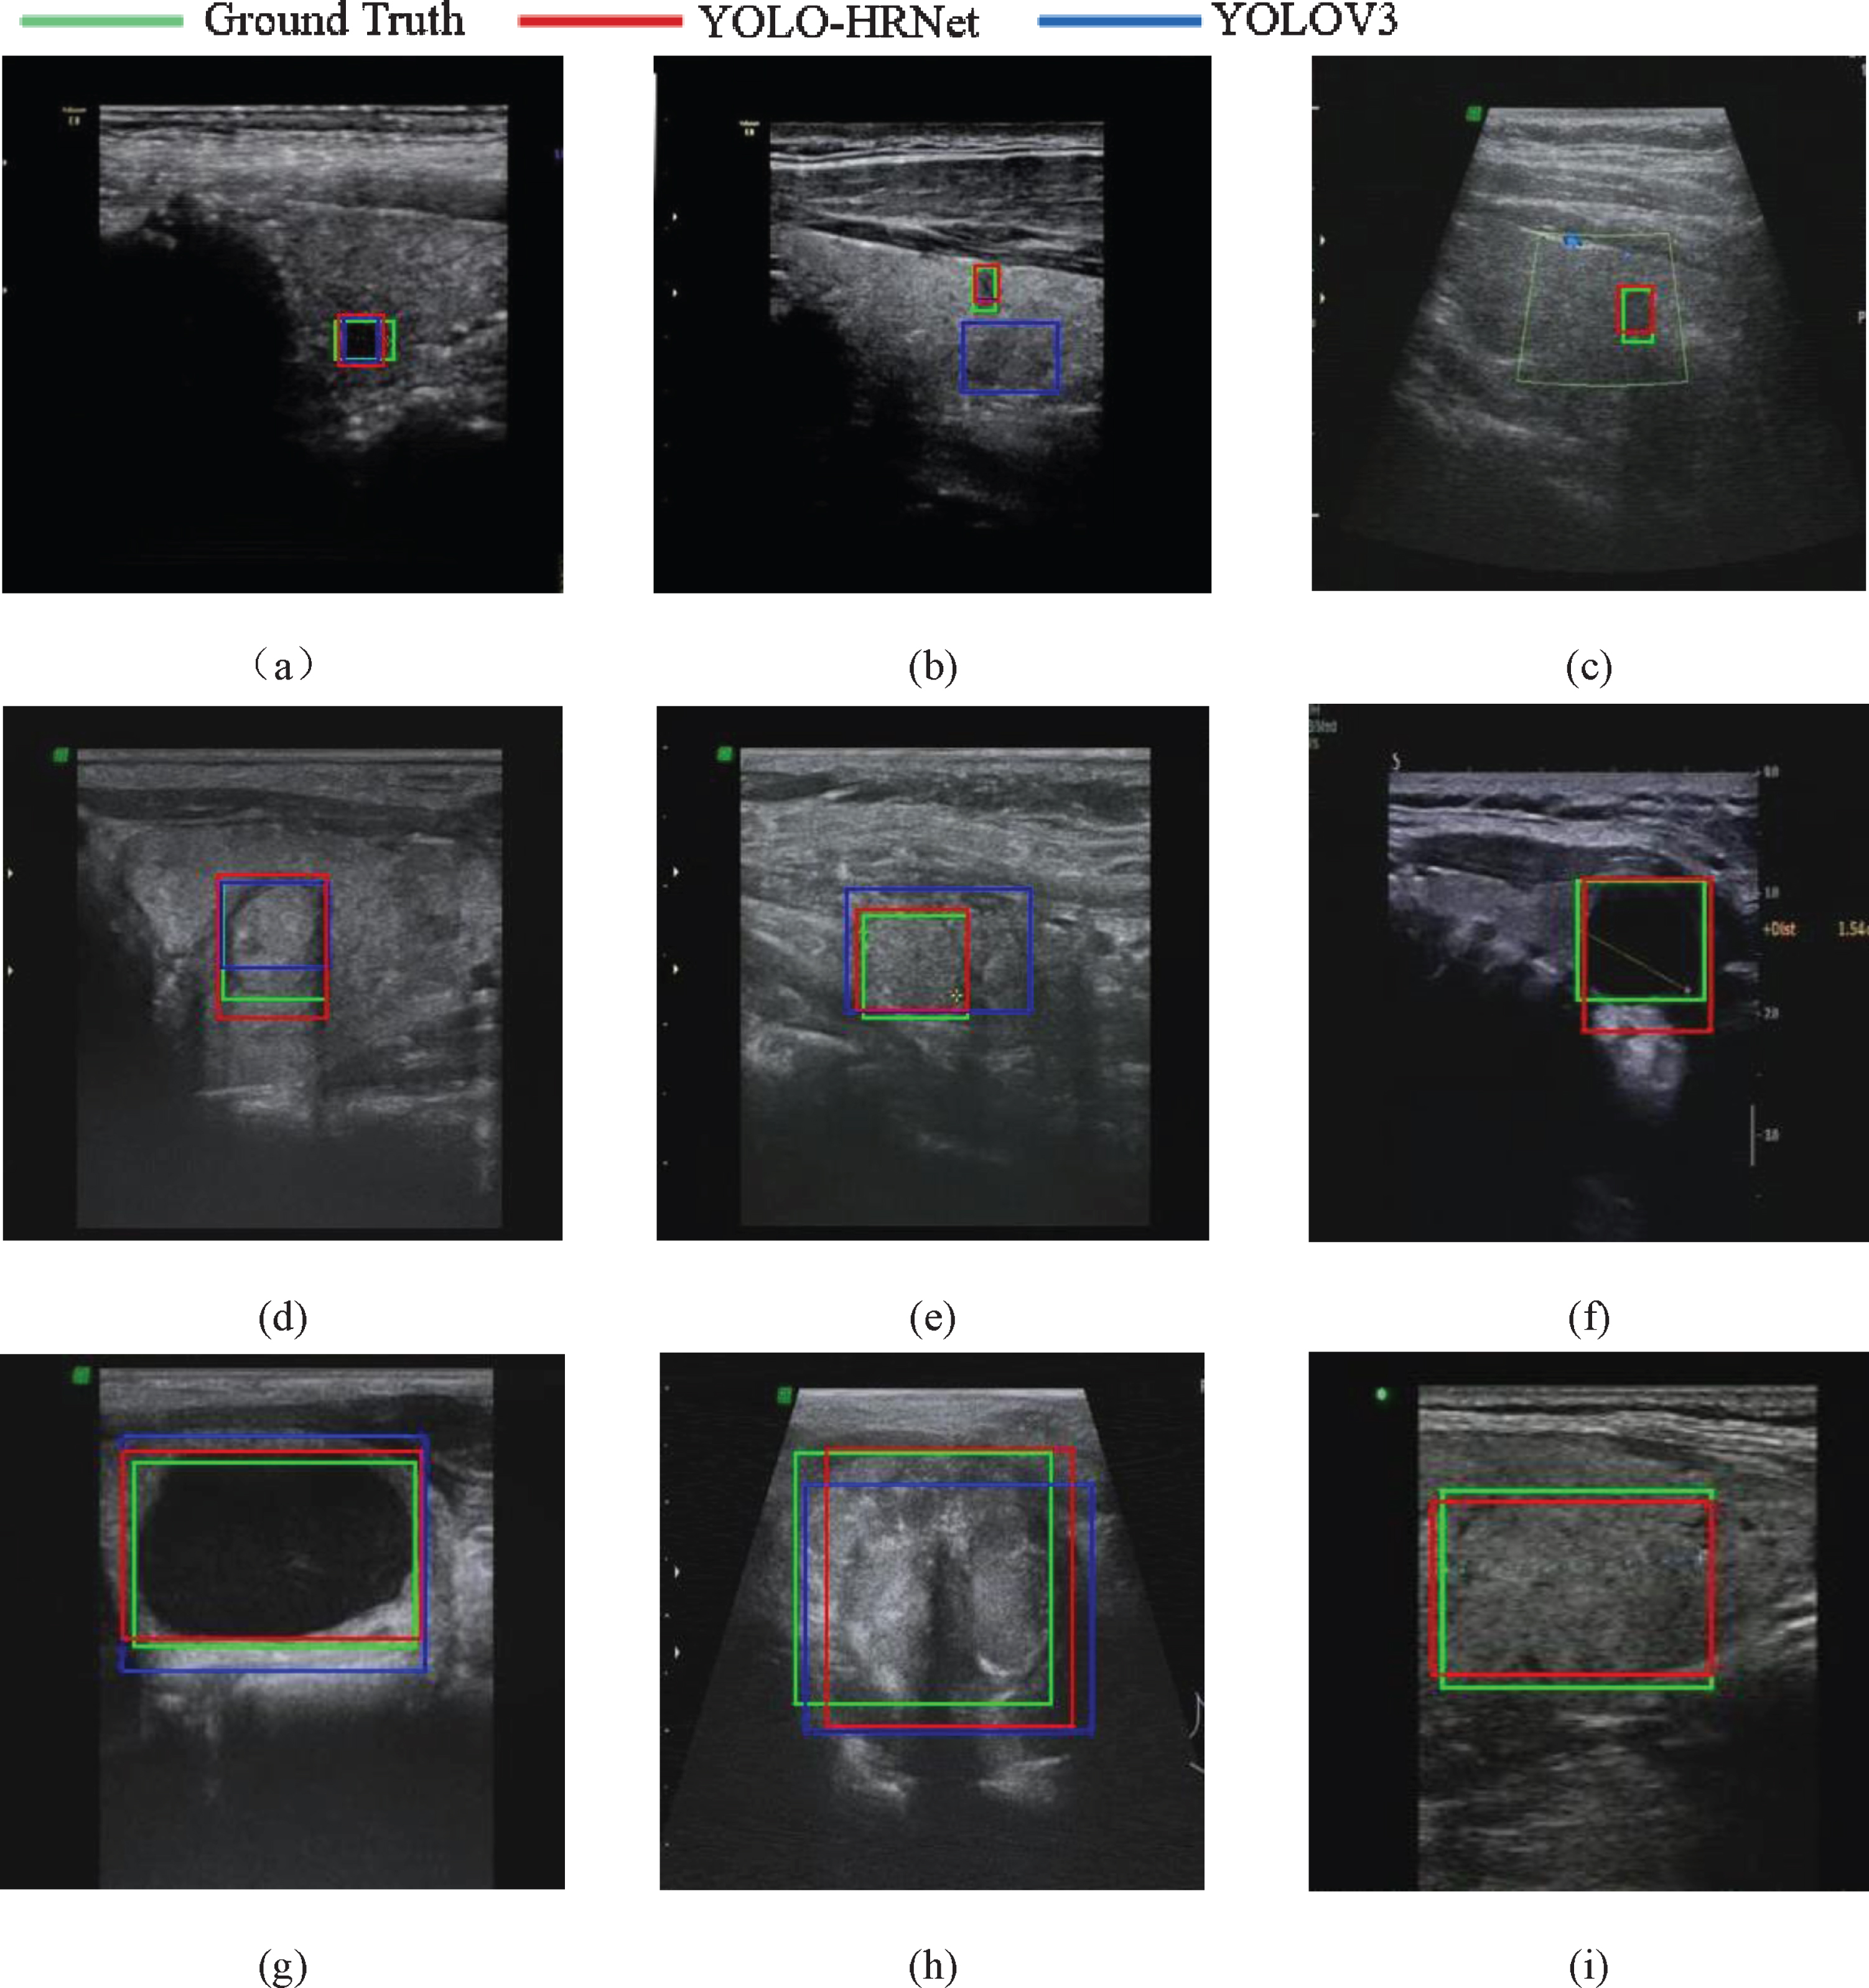
Detection results of B-mode ultrasound images. The first line showed the detection results of small nodules, the second line showed the detection results of medium nodules, the third line showed the detection results of large nodules.
Figure 10 shows the detection results of thyroid nodules with different sizes in color Doppler images. There are some guiding value of color Doppler images in distinguishing thyroid cancer and benign thyroid disease. With the widespread use of color Doppler images in clinic, the detection of thyroid nodules in color Doppler image is also worth studying. Especially, we are the first to use the deep learning method for nodule detection in color Doppler images, as shown in Fig. 10. The bounding box predicted by YOLOV3 in Fig. 10(c) was obviously interfered by false color and blood vessels, while YOLO-HRNet was not. In Fig. 10(b), YOLOV3 mistook hyperechoic artifacts as nodules, and in Fig. 10(f), YOLOV3 mistook blood vessels as nodules, all of which increased the false positive. And the iso-echoic nodule in Fig. 10(i) has uneven internal structure and fuzzy boundaries, so the bounding box predicted by YOLOV3 only contains part of the nodule, while YOLO-HRNet predicts a more accurate boundary box. And in the other examples shown in Fig. 10, we can see that the bounding box predicted by YOLO-HRNet has higher precision than that predicted by YOLOV3.
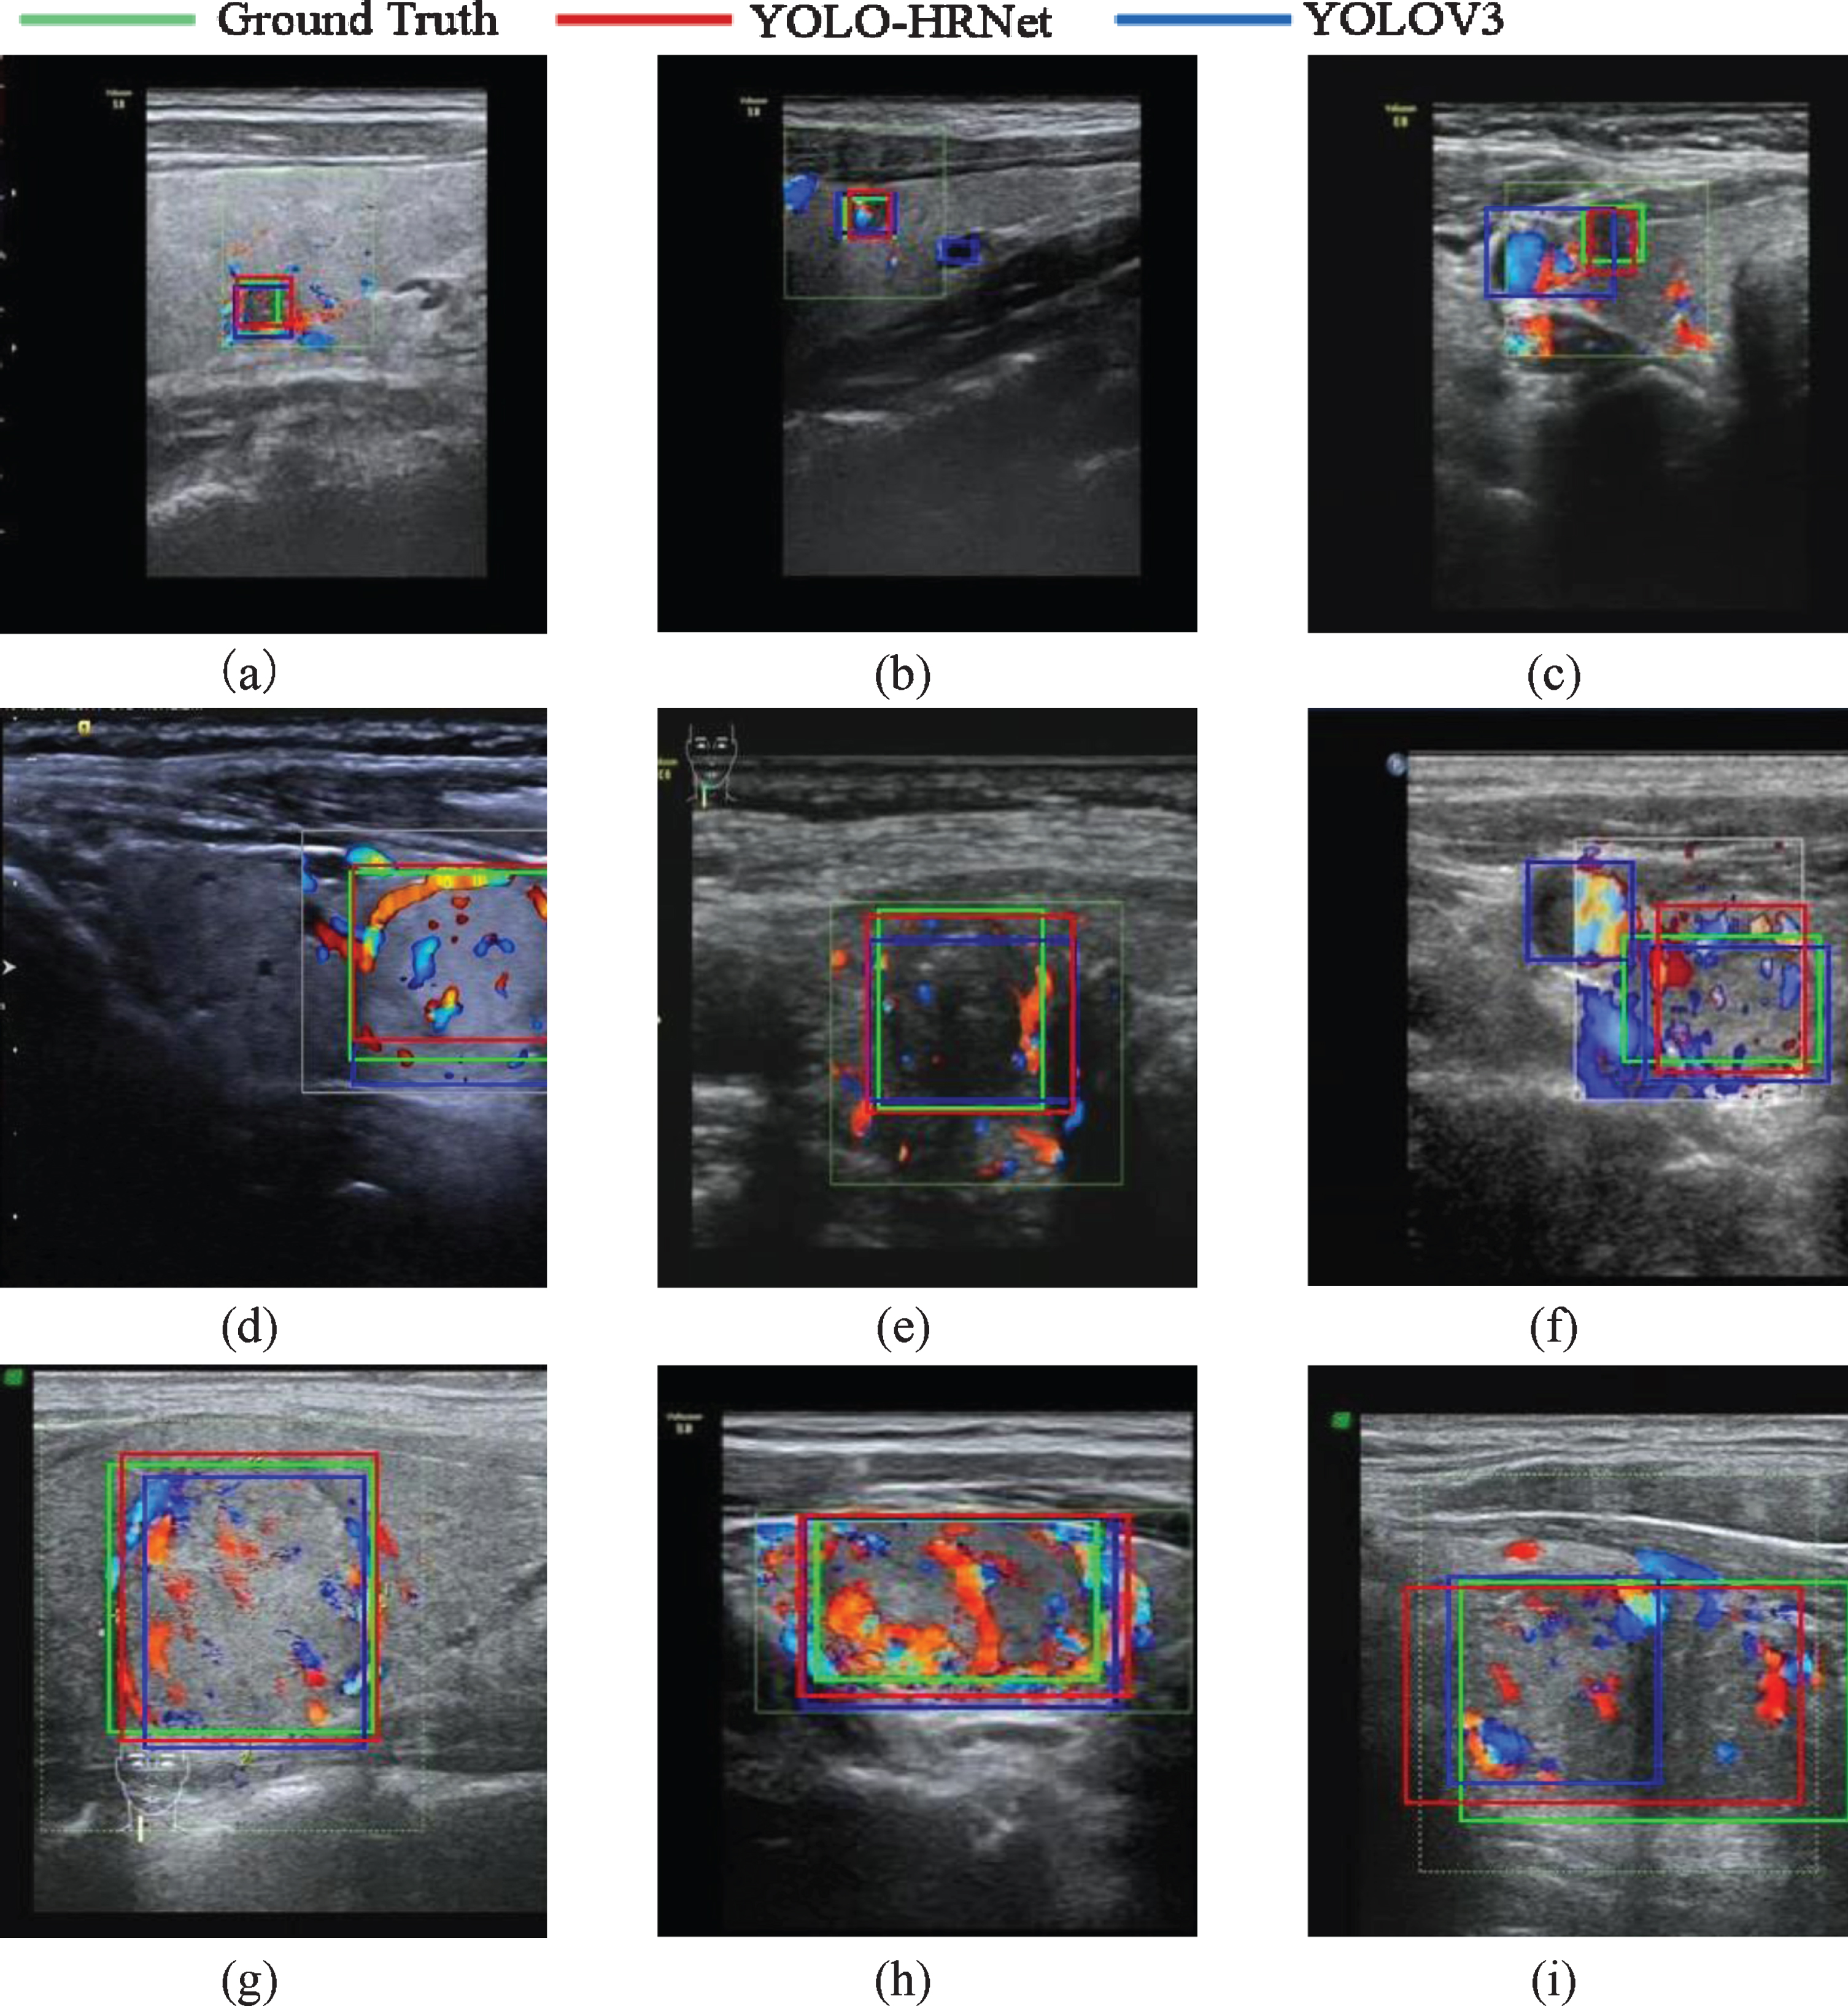
Detection results of Doppler ultrasound images. The first line showed the detection results of small nodules, the second line showed the detection results of medium nodules, the third line showed the detection results of large nodules.
In summary, the two networks have good performance in thyroid nodule detection, and can successfully detect thyroid nodules in most ultrasound images. However, when the appearance of nodules changed greatly or the background get complicated, the YOLO-HRNet perform better than YOLOV3. On the one hand, YOLO-HRNet has relatively few parameters, so the network has stronger generalization ability and can identify more complex nodules. On the other hand, YOLO-HRNet uses HRNet as the feature extraction network. The HRNet can maintains high resolution through the whole process of feature extraction, so it can get richer semantic information. The location predicted by this network is also more accurate.
The comparison with other nodule detection algorithms
Deep learning methods have been widely investigated and tested in medical image segmentation and diagnosis with the promising results (i.e., [17, 18]). In this study, we also compared the performance of YOLO-HRNet with several existing methods [10, 13]. These methods were tested with our own data set and evaluated using the same evaluation metrics used to evaluate our new YOLO-HRNet. The comparison results are shown in Table 4.
Detection performance with different detection algorithms
Detection performance with different detection algorithms
Table 4 shows that YOLO-HRNet has higher precision, recall and IOU among all the location methods. Although the Faster RCNN + ResNet50 has a slightly higher precision than YOLO-HRNet, its recall is only 60.4%, which is much lower than YOLO-HRNet. In addition, the YOLO-HRNet is one-stage detector, so that it could achieve fast detection speed as the SSD300. The Fast RCNN + ResNet50 is a two-stage detector, and the average time to detect a single image is 0.682s, which is too long to meet the requirements of real-time detection. The YOLO-HRNet has a better detection result mainly because it can get more abundant semantic information in both feature extraction module and nodule detection module. In the feature extraction module, we use HRNet that can maintain high resolution through the whole process to extract features. In the detection module, the method based on YOLOV3 make predictions at 3 different scales, and the feature maps of two adjacent scales are merged, so the predictions are accurate.
There were also some limitations of the method proposed in this paper. As shown in Fig. 11, there are some samples of failed nodule detection with our method. In Fig. 11(c), the boundary of nodule is blurred, and in Fig. 11(b), the isoechoic nodule has irregular shape, both of the two true nodules are failed to detected by YOLOV3 and YOLO-HRNet. And YOLO-HRNet mistakenly recognized the ultrasound background as nodules. In Fig. 11(a), affected by the artifacts around the small hypoechoic nodule, the two networks predict a much larger bounding box than the real nodule. And the nodules in Fig. 11(d, f) were covered by pseudo color, so the two methods are failed to detect the true nodules. The isoechoic nodule in Fig. 11(e) has unclear boundary, which leads to inaccurate boundary box predicted by the two networks.
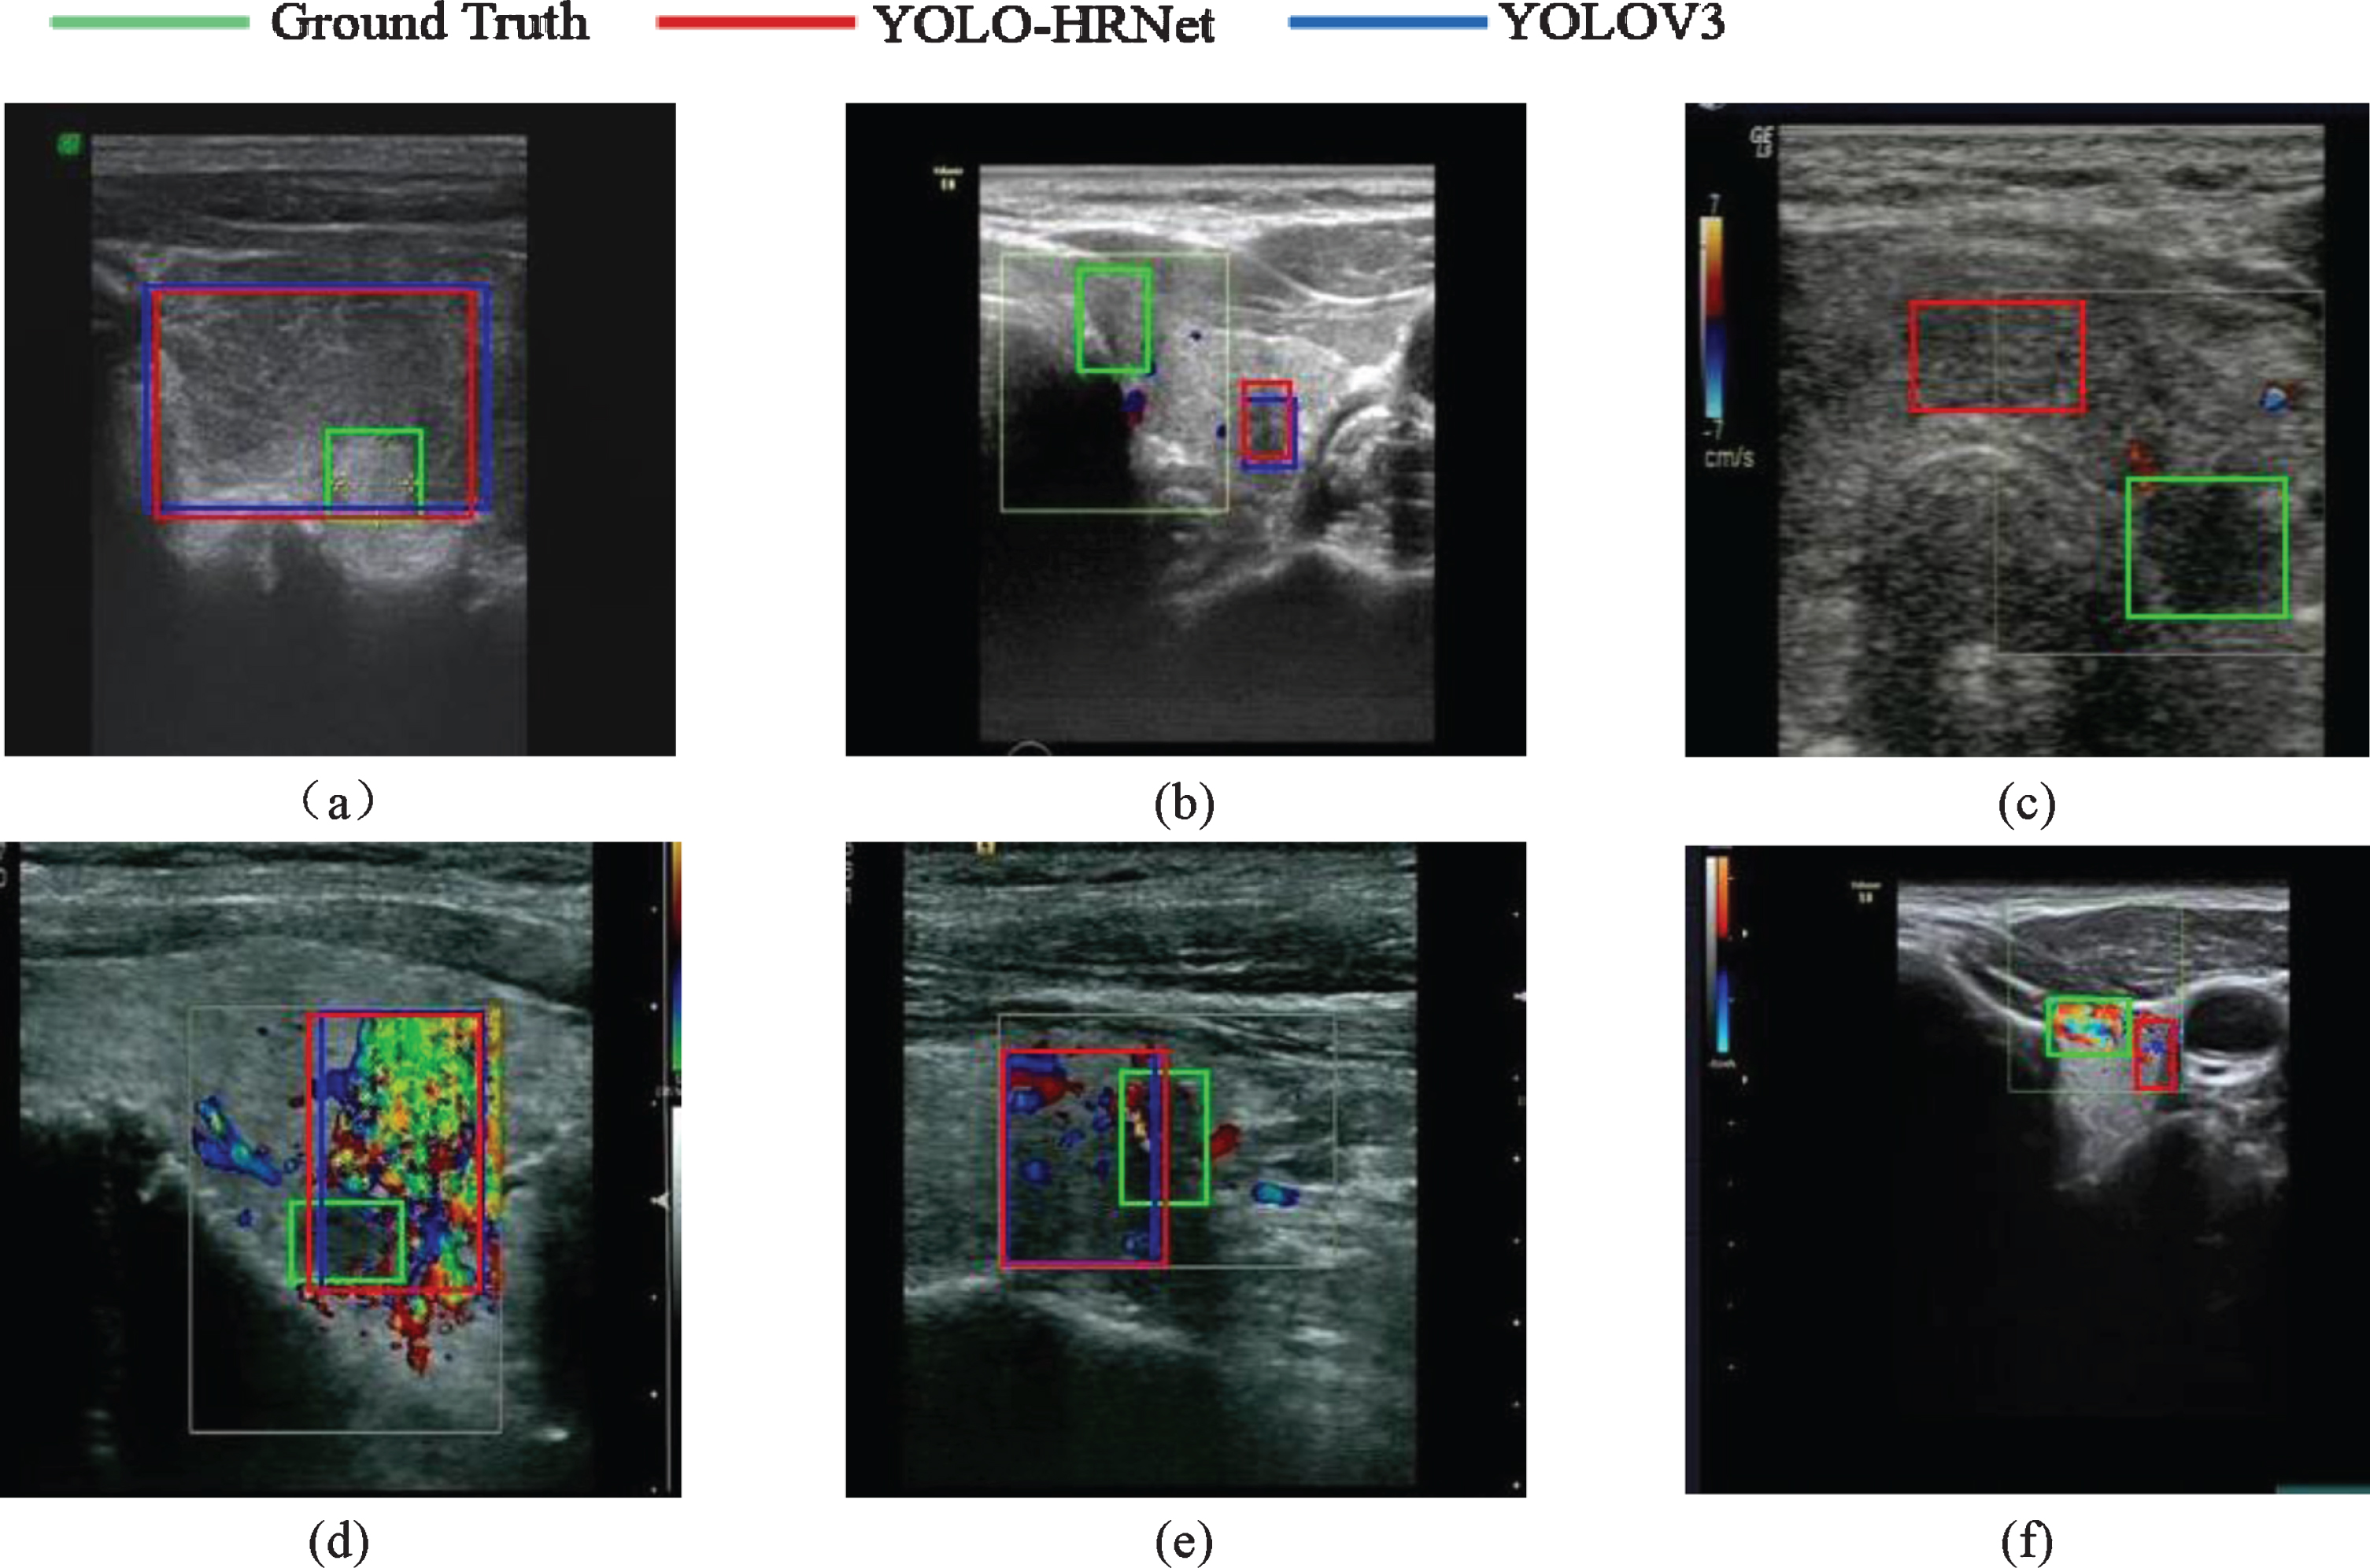
Some samples of failed detection.
In this paper, we proposed a new model which combined YOLOV3 and HRNet to automatically detect of thyroid nodules in ultrasound images. The model mainly included two modules of feature extraction and multi-scale detection. We used HRNet as the backbone to gradually extract the features of ultrasound images, and detection method used in YOLOV3 was adopted for multi-scale detection. The experiment results showed that our method was superior to YOLOV3 network in precision, recall, F1 scores, IOU and detection time. And the contribution can be summarized as follows: First, the model could effectively identify nodules and predict accurate bounding boxes for nodules in real time. Second, we were the first to apply the HRNet in medical ultrasound images for clinical use and got better results in the detection of nodules, which indicated that HRNet was a stronger backbone and was suitable for the task of medical ultrasound images. Third, we challenged the detection of thyroid nodules in Doppler ultrasound for the first time. Although the pseudo color information in the Doppler ultrasound images posed a challenge to nodule detection, the method proposed in this paper could effectively detect the nodules in the Doppler ultrasound images.
There are two promising future directions, the one is to explore its use as part of the ultrasound system to detect or track thyroid nodules in the ultrasound video, and to screen thyroid nodules. The other one is to acquire more medical labels and carry out follow-up diagnosis research after the location of nodules, such as research on calcification, central blood flow information and other medical characteristics needed for diagnosis.
Footnotes
Acknowledgments
This paper is supported by the Application and Basic Research project of Sichuan Province (No.2019YJ0055), the Enterprise Commissioned Technology Development Project of Sichuan University (No.18H0832), and the Achievement Conversion and Guidance Project of Chengdu Science and Technology Bureau (No.2017-CY02-00027-GX). Our images are supported by China-Japan Friendship Hospital (Beijing 100029) and Highong Intellimage Medical Technology (Tianjin) Co., Ltd.