
Abstract
OBJECTIVE:
To explore the potential value of quantitative parameters derived from dual-energy spectral computed tomography (DESCT) as comparing to the parameters derived from magnetic resonance imaging (MRI) in detecting bone marrow (BM) infiltration and distinguishing different patterns of BM infiltration in patients diagnosed with Multiple myeloma (MM).
METHODS:
This study involved 35MM patients and 15 healthy control subjects who had undergone spinal DESCT and MRI. Pattern assignment was based on visual assessment of MR images, and the regions of interest were defined on both DESCT and apparent diffusion coefficient maps. Quantitative values of DESCT parameters were measured and compared between infiltrated and healthy bone marrow. Receiver operating characteristic (ROC) analysis was performed to determine potential utility of DESCT parameters in identifying BM infiltration and different patterns defined by MRI. Sensitivity and specificity under the optimal thresholds determined by the Youden Index were also calculated.
RSULTS:
Statistical differences were observed between the DESCT parameters including Ca(Water), Water(Ca), HAP(Fat), Fat(HAP) and Effective atomic number (Eff-Z) but not for the 70-keV CT value between the infiltrated and healthy BM (all P < 0.001). The 70keV CT value and Ca(Water), HAP(Fat) and Eff-Z values were also found to be statistically different in comparing different infiltration patterns (all P < 0.05). Performance of the model-based parameter Ca/Water was superior in differentiating between infiltrated and healthy BM in which the area under ROC curve, AUC = 0.856 [95% CI, 81.4–89.1%] with sensitivity = 0.841 and specificity = 0.768, as well as between MM patients and control subjects (AUC = 0.910 [95% CI, 79.5–97.3%], sensitivity = 0.829 and specificity = 1.000).
CONCLUSIONS:
Analysis of DESCT offers potential as a quantitative method to detect infiltrated BM and evaluate infiltration patterns of BM in patients diagnosed with MM.
Introduction
Multiple myeloma (MM) is the second most common hematological malignancy, characterized by infiltration and proliferation of monoclonal plasma cells in the bone marrow (BM), located predominantly in the spine and pelvis [1]. The treatment for patients with MM is indicated by end-organ damage (hypercalcemia, renal impairment, anemia, bone lesions) and is dependent on a comprehensive consideration of factors including age, comorbidities and previous treatment [2–7]. Although MM remains incurable, the prognosis of MM differs from patient to patient [8, 9]. One of the predictors of the response to treatment is the magnetic resonance imaging (MRI) infiltration pattern of bone marrow involvement, which signifies the tumor burden for patients with MM [10–13]. Bone marrow aspiration is the standard procedure for diagnosis of MM [14], but this is an invasive examination. Moreover, the inhomogeneity and random distribution of myeloma lead to unreliable results with different puncture locations. Hence, bone marrow aspiration findings do not accurately reflect the level of bone marrow involvement of patients [15]. MRI is the most sensitive imaging modality in terms of its ability to reflect the degree of tumor infiltration in bone marrow [10]. Different MRI patterns of marrow involvement in MM—including normal, focal, diffuse and ‘salt and pepper’ pattern—have been recognized and shown to have prognostic value in untreated patients with MM [11, 16–18].
In 2014, the International Myeloma Working Group (IMWG) recommended whole-body imaging examination for the pre-treatment evaluation of MM [19]. However, MRI has its own limitations, including MRI contraindications and long acquisition times; most importantly, it cannot distinguish the normal appearance of marrow infiltration in MM patients, which is shared by 30% of MM patients [18, 20], from that of patients with healthy bone marrow.
Whole-body low-dose CT is now routinely used to display bone structures of patients with MM, overcoming some of the limitations associated with MRI [21]. Recently, several studies have shown that dual-energy spectral CT (DESCT) with the virtual non-calcium (VNCa) technique has high sensitivity in terms of evaluating infiltration patterns of MM in bone [22–24]. However, these studies discussed the use of a single CT attenuation value in VNCa images obtained from the dual-source, dual-energy technique. As another way of realizing dual-energy CT, the single tube, fast kilovoltage peak (kVp) switching spectral CT technique provides many quantitative parameters [25]. Studies have proven that the use of these parameters represents a more objective way of differentiating between malignant and benign vertebral tumors, and in diagnosing the pathological grades of clear-cell renal cell carcinoma, than the use of conventional CT attenuation values [26, 27]. However, the single tube, fast kVp switching spectral CT technique and multi-parameters obtained using this scanning technique have not been explored in regarding to the differentiation in multiple myeloma. The aim of this study was to explore the potential value of quantitative parameters derived from the fast-kVp switching dual-energy spectral computed tomography (DESCT) in detecting BM infiltration and differentiation of different BM infiltration patterns.
Methods
Patients
This retrospective study was approved by the Ethics Committee of the First Affiliated Hospital of Soochow University, with waiver of informed consent. Forty-one consecutive patients with newly diagnosed MM between March 2019 and September 2019 were enrolled in this analysis. They underwent whole-body DESCT and MRI examination (median time between DESCT and MRI [range], 0 [0–2] days). The following patients were excluded from our study: (1) MM patients with additional malignancies; (2) MM patients who underwent either CT or MRI after treatment; (3) patients who received granulocyte colony-stimulating factor; (4) patients who received radiation therapy; (5) patients with Schmorl’s nodes or hemangioma; (6) patients with fracture; and (7) MM patients with contraindications to MRI (Fig. 1).
Flowchart demonstrating selection of the study population.
Fifteen control subjects (mean age, 61.6±9.8 years), including 10 women (mean age, 60.6±8.1 years) and 5 men (mean age, 63.6±13.5 years). were examined using the same CT imaging protocol. The control group comprised patients who had undergone CT examination for clinically suspected lumbar disc herniation. The following were excluded: (1) patients with malignancies; (2) patients with an acute injury; (3) patients with Schmorl’s nodes or hemangioma of the vertebrae; and (4) patients with vertebral fracture.
All examinations were performed on a multi-detector CT scanner (Discovery 750 HD, GE Healthcare, USA) using the following spectral scanning and reconstruction parameters: tube voltage, 80/140kVp; tube current, 260 mA; collimation, 40 mm; pitch, 1.375; rotation time, 0.7 s; slice thickness, 1.25 mm; slice increment, 0.625 mm; reconstruction matrix, 512×512; reconstruction algorithm, 80% adaptive statistical iterative reconstruction; reconstruction kernel, standard. All MM patients underwent imaging craniocaudally in the supine position with their arms elevated above the head, and the scanning ranged from the head to upper femur. The mean volume CT dose index was 6.48 mGy. The patients in the control group were imaged using the same scan protocol, and the scan range was from T11 to S1.
Image post-processing was performed on an Advantage Workstation (AW4.6, GE Healthcare) using a gemstone spectral imaging (GSI) viewer for DESCT images. Four sets of images were observed on the GSI viewer: 70-keV images, Eff-Z images, material decomposition (MD) images using Calcium and Water as the base material pair, and MD images using hydroxyapatite (HAP) and Fat as the base material pair. CT attenuation values were measured on the 70-keV images; Eff-Z values were measured on the Eff-Z images; Calcium densities (Ca(Water)) and Water densities (Water(Ca)) were measured on the Calcium-based MD images and Water-based MD images, respectively, using Calcium and Water as the base material pair; and finally, HAP densities (HAP(Fat)) and Fat densities (Fat(HAP)) were measured on HAP-based MD images and Fat-based MD images, respectively, using HAP and Fat as the base material pair.
MRI scanning protocol
All MM patients underwent MRI examinations on a 3.0T MRI scanner (Magnetic Verio, Siemens Healthcare, Erlangen, Germany) equipped with a Total imaging matrix system. The protocol included sagittal T1-weighted (T1w) fast spin echo (FSE) imaging (repetition time/echo time [ms], 1700/8.6; section thickness, 4 mm; gap, 0.8 mm; turbo factor, 8), as well as sagittal T2-weighted (T2w) fat-saturated (fs)-FSE (repetition time/echo time [ms], 3000/91; section thickness, 4 mm; gap, 0.8 mm; turbo factor, 15) and axial diffusion-weighted imaging (DWI) sequence (repetition time/echo time [ms], 16300/68; section thickness, 5 mm; b value = 50 and 800 s/mm2).
Image analysis
CT and MRI images were viewed in random order by two radiologists with more than 15 years of experience. Differences in evaluation between the two radiologists were resolved by consensus.
Pattern assignment was based on visual assessment of conventional MR images. According to IMWG consensus, the infiltration patterns were divided into four groups: a normal (N) pattern (a normal appearance of the bone marrow), a focal (F) pattern (T1w hypointense lesions with a diameter ≥5 mm), a diffuse (D) pattern (bone marrow on unenhanced T1 imaging generally more hypointense than adjacent intervertebral disc spaces without degenerative changes), and a salt and pepper (SP) pattern (disseminated T1w hypointense lesions in front of an inhomogeneous background of T1w hyperintense normal bone marrow) [18].
On the post-processing workstation, the region of interest (ROI) was marked at the same position on the sagittal lumbar CT image using the sagittal T1w image and TIRM as the reference. At the same time, the corresponding location was automatically displayed on the axial apparent diffusion coefficient (ADC) map. For patients with a focal (F) pattern, only those lesions with major axis greater than 5 mm were included. If more than five lesions met the criteria, only the largest five would be analyzed with an oval ROI of 50 mm2 marked on each lesion. For patients with a D, N or SP pattern, an oval ROI of 100 mm2 was allocated to vertebral bodies based on MRI images. For patients in the control group, an ROI of 100 mm2 was marked on each vertebral body on the central slice of the CT images. Each ROI was measured three times on the same slice. Mean value of the three measurements was calculated and used for further analysis. ADCs were recorded.
Statistical analysis
Statistical analysis was performed using either SPSS 22.0 software (Chicago, IL, USA) or MedCalc statistical software version 16.4.3 (Ostend, Belgium). Continuous variables were presented as mean±standard deviation. The clinical characteristics were first compared between different patterns. The normality of all variables was tested using the Kolmogorov–Smirnov statistic. One-way analysis of variance (ANOVA) was used to compare the differences in distribution between the normal variables, while Kruskal-Wallis one-way ANOVA was used for the non-normal variables. For comparisons between multiple groups, pairwise multiple comparisons were further performed using Bonferroni adjustments. To determine the diagnostic capability of quantitative variables, receiver operating characteristics (ROC) analysis was performed, with MR imaging serving as the reference standard. The diagnostic capability was determined by calculating the area under the ROC curve (AUC). The sensitivity and specificity under the optimal thresholds, determined by the Youden Index, were also calculated. Considering the potential limited ability of a single quantitative variable to diagnose MM, two logistic regression models were fitted with more than one parameter, as independent variables: (1) a Ca/Water model—i.e., Ca(Water) and Water(Ca) combined, and (2) a HAP/Fat model—i.e., HAP(Fat) and Fat(HAP) combined. The predicted probabilities of these models were used as new predictors in the ROC analysis. The ROC curve of the best six predictors—whether this was a single parameter or model-based parameter—was presented. For all statistical analyses, P < 0.05 was considered to be statistically significant.
Results
Patient characteristics
A total of 41 patients were identified based on our inclusion criteria, while six patients were excluded from the present study (one patient with additional malignancy, two patients with only CT or MRI performed after treatment, two patients with radiation therapies, and one patient with contraindications to MRI). Finally, 35 patients (mean age±standard deviation, 59.5±10.9 years), including 16 females (mean age±SD, 61.1±8.6 years) and 19 males (mean age±SD, 58.2±12.6 years), and 15 control subjects (mean age, 61.6±9.8 years), including 10 women (mean age, 60.6±8.1 years) and five men (mean age, 63.6±13.5 years), were enrolled in this study.
Per-lesion analysis
In total, 334 ROIs were selected, with 229 ROIs (41 focal pattern, 146 diffuse pattern, 21 normal pattern and 21 salt and pepper pattern) defined in patients with MM and 105 ROIs defined in control subjects. At the same time, 229 ROIs were automatically displayed at the corresponding location on the axial ADC map (Figs. 2–5).
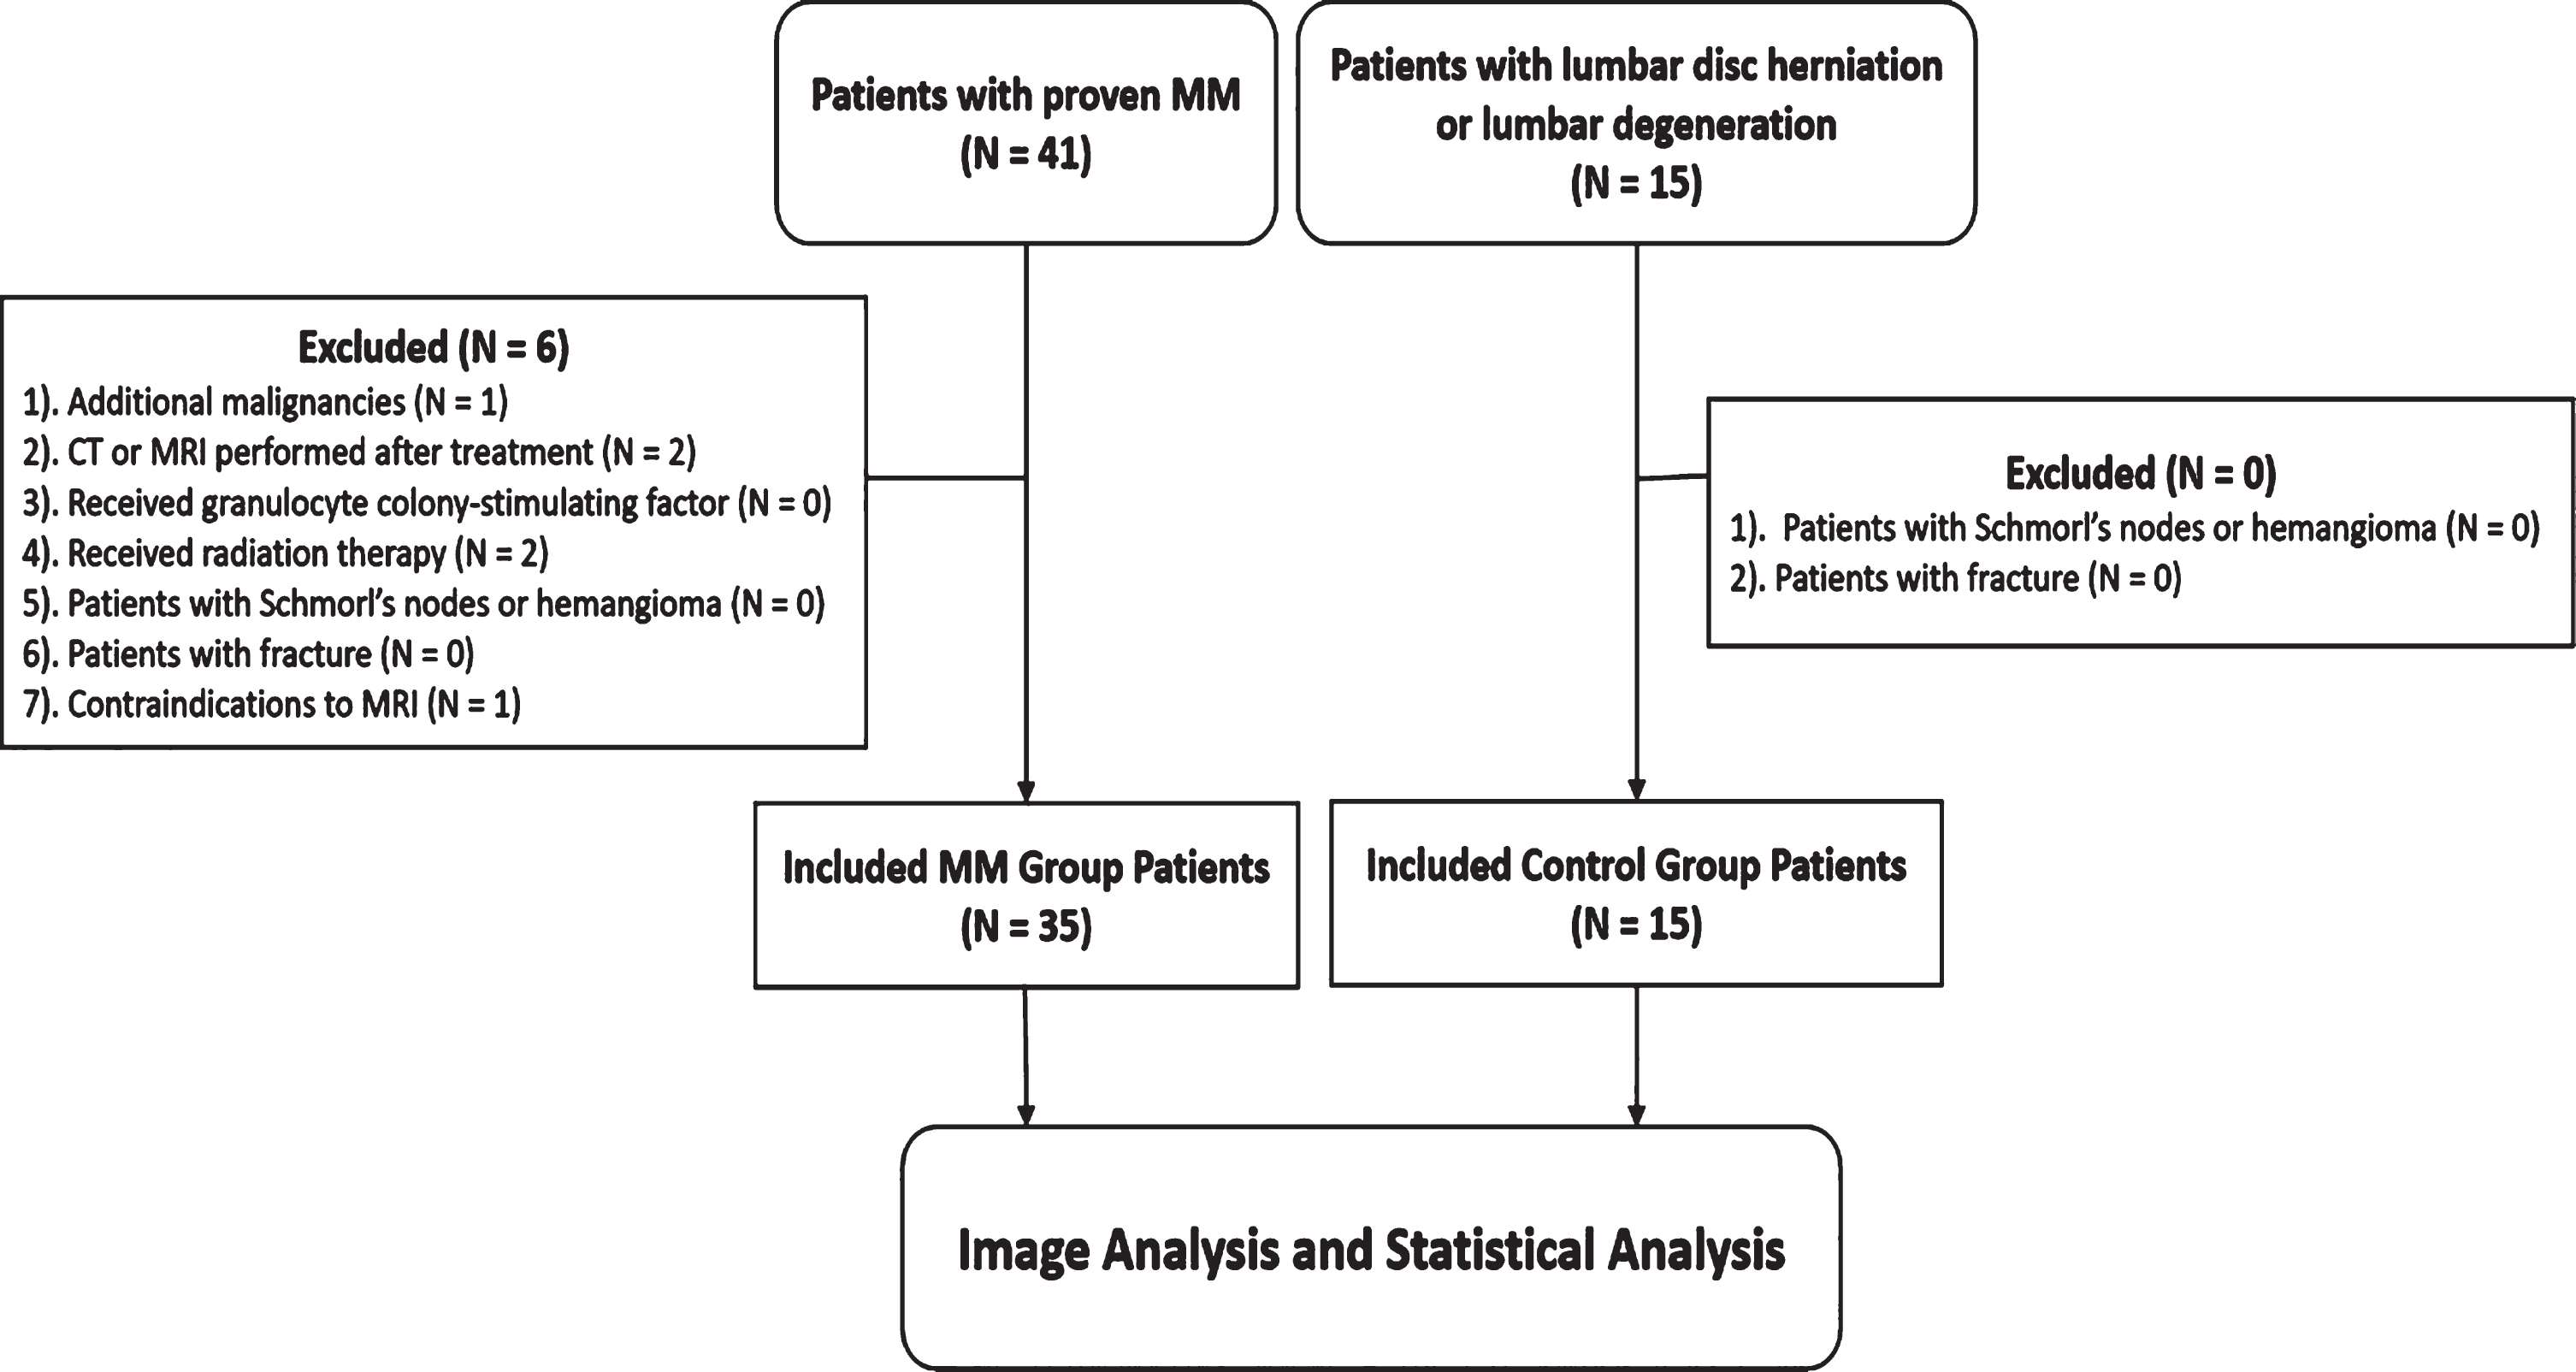
A 37-year-old man with focal pattern. An oval ROI of 50 mm2 was marked on the largest slice of each lesion on the sagittal position and the corresponding location was automatically displayed on the axial ADC (apparent diffusion coefficient) map. A-D: T1-weighted (A), T2-FS (B), dual-energy spectral CT (C), ADC map (D).
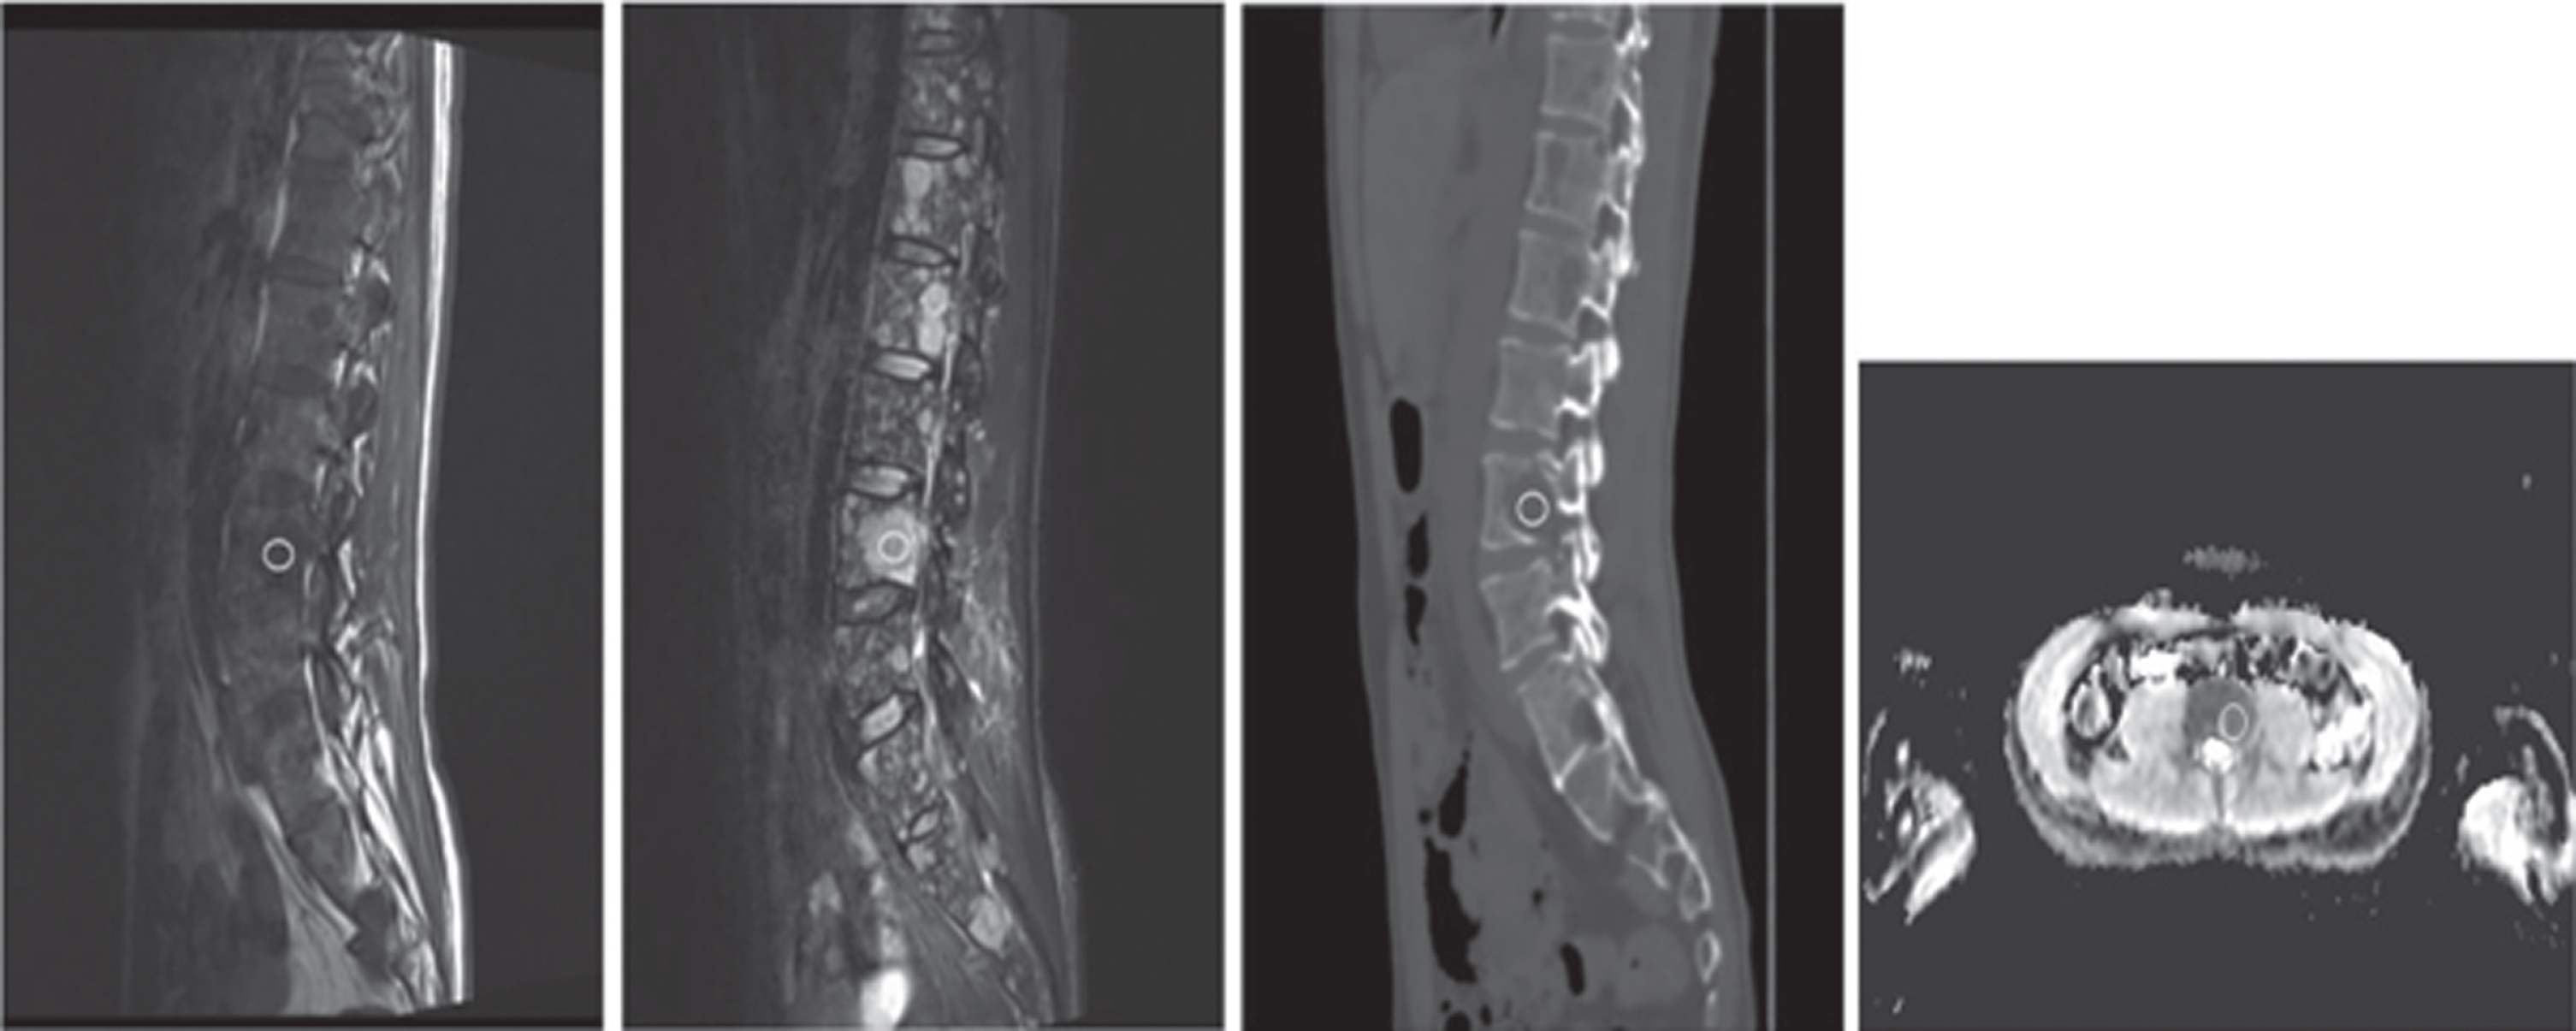
A 70-year-old woman with diffuse pattern. An oval ROI of 100 mm2 was marked on the central slice of CT image of each lesion on the sagittal position and the corresponding location was automatically displayed on the axial ADC (apparent diffusion coefficient) map. A-D: T1-weighted (A), T2-FS (B), dual-energy spectral CT (C), ADC map (D).
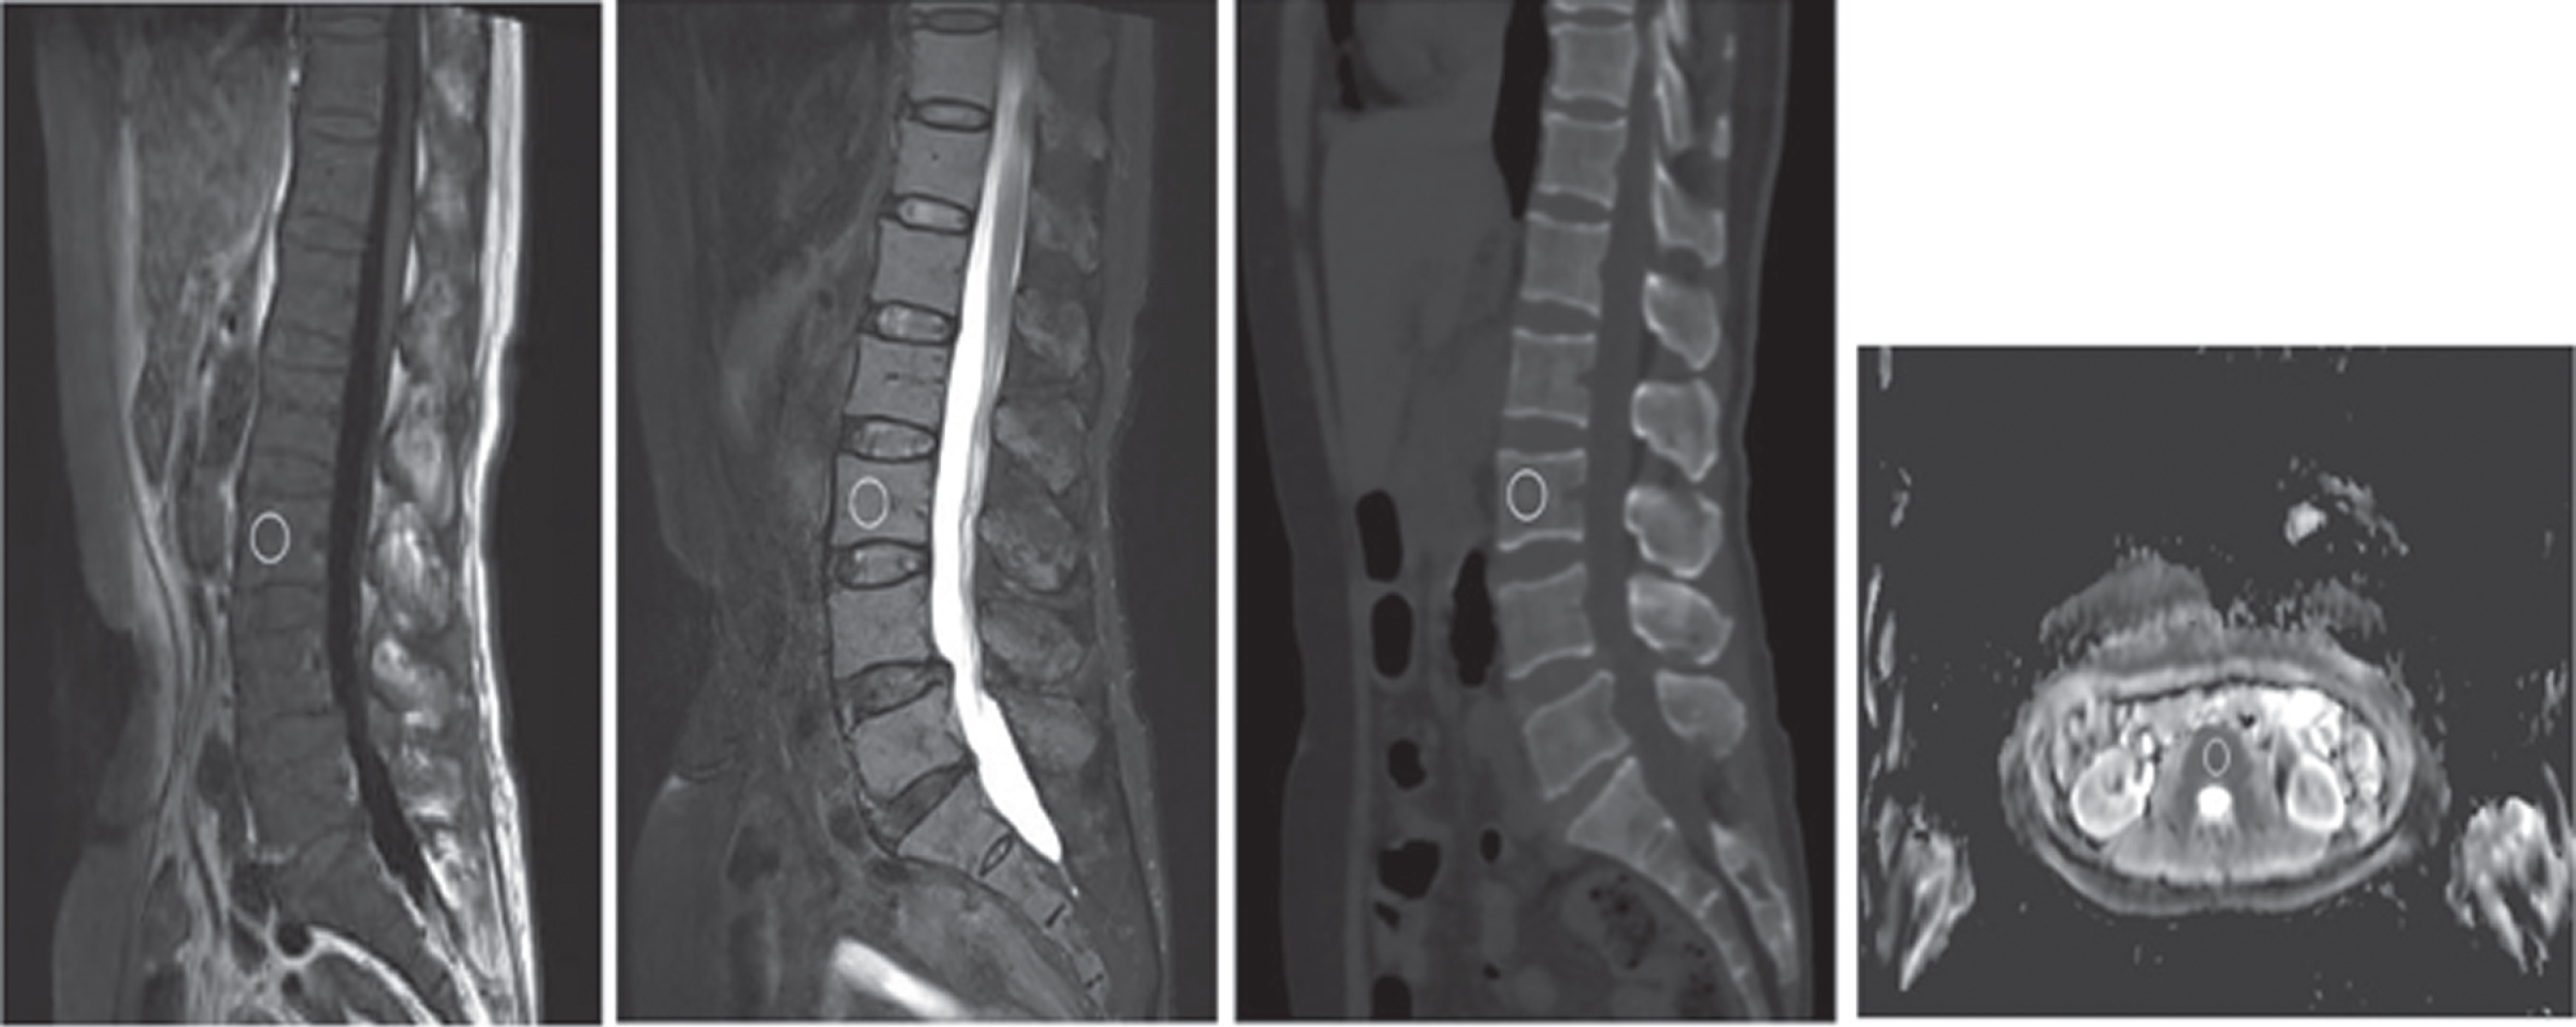
A 52-year-old man with salt and pepper pattern. An oval ROI of 100 mm2 was marked on the central slice of CT image of each lesion on the sagittal position and the corresponding location was automatically displayed on the axial ADC (apparent diffusion coefficient) map. A-D: T1-weighted (A), T2-FS (B), dual-energy spectral CT (C), ADC map (D).
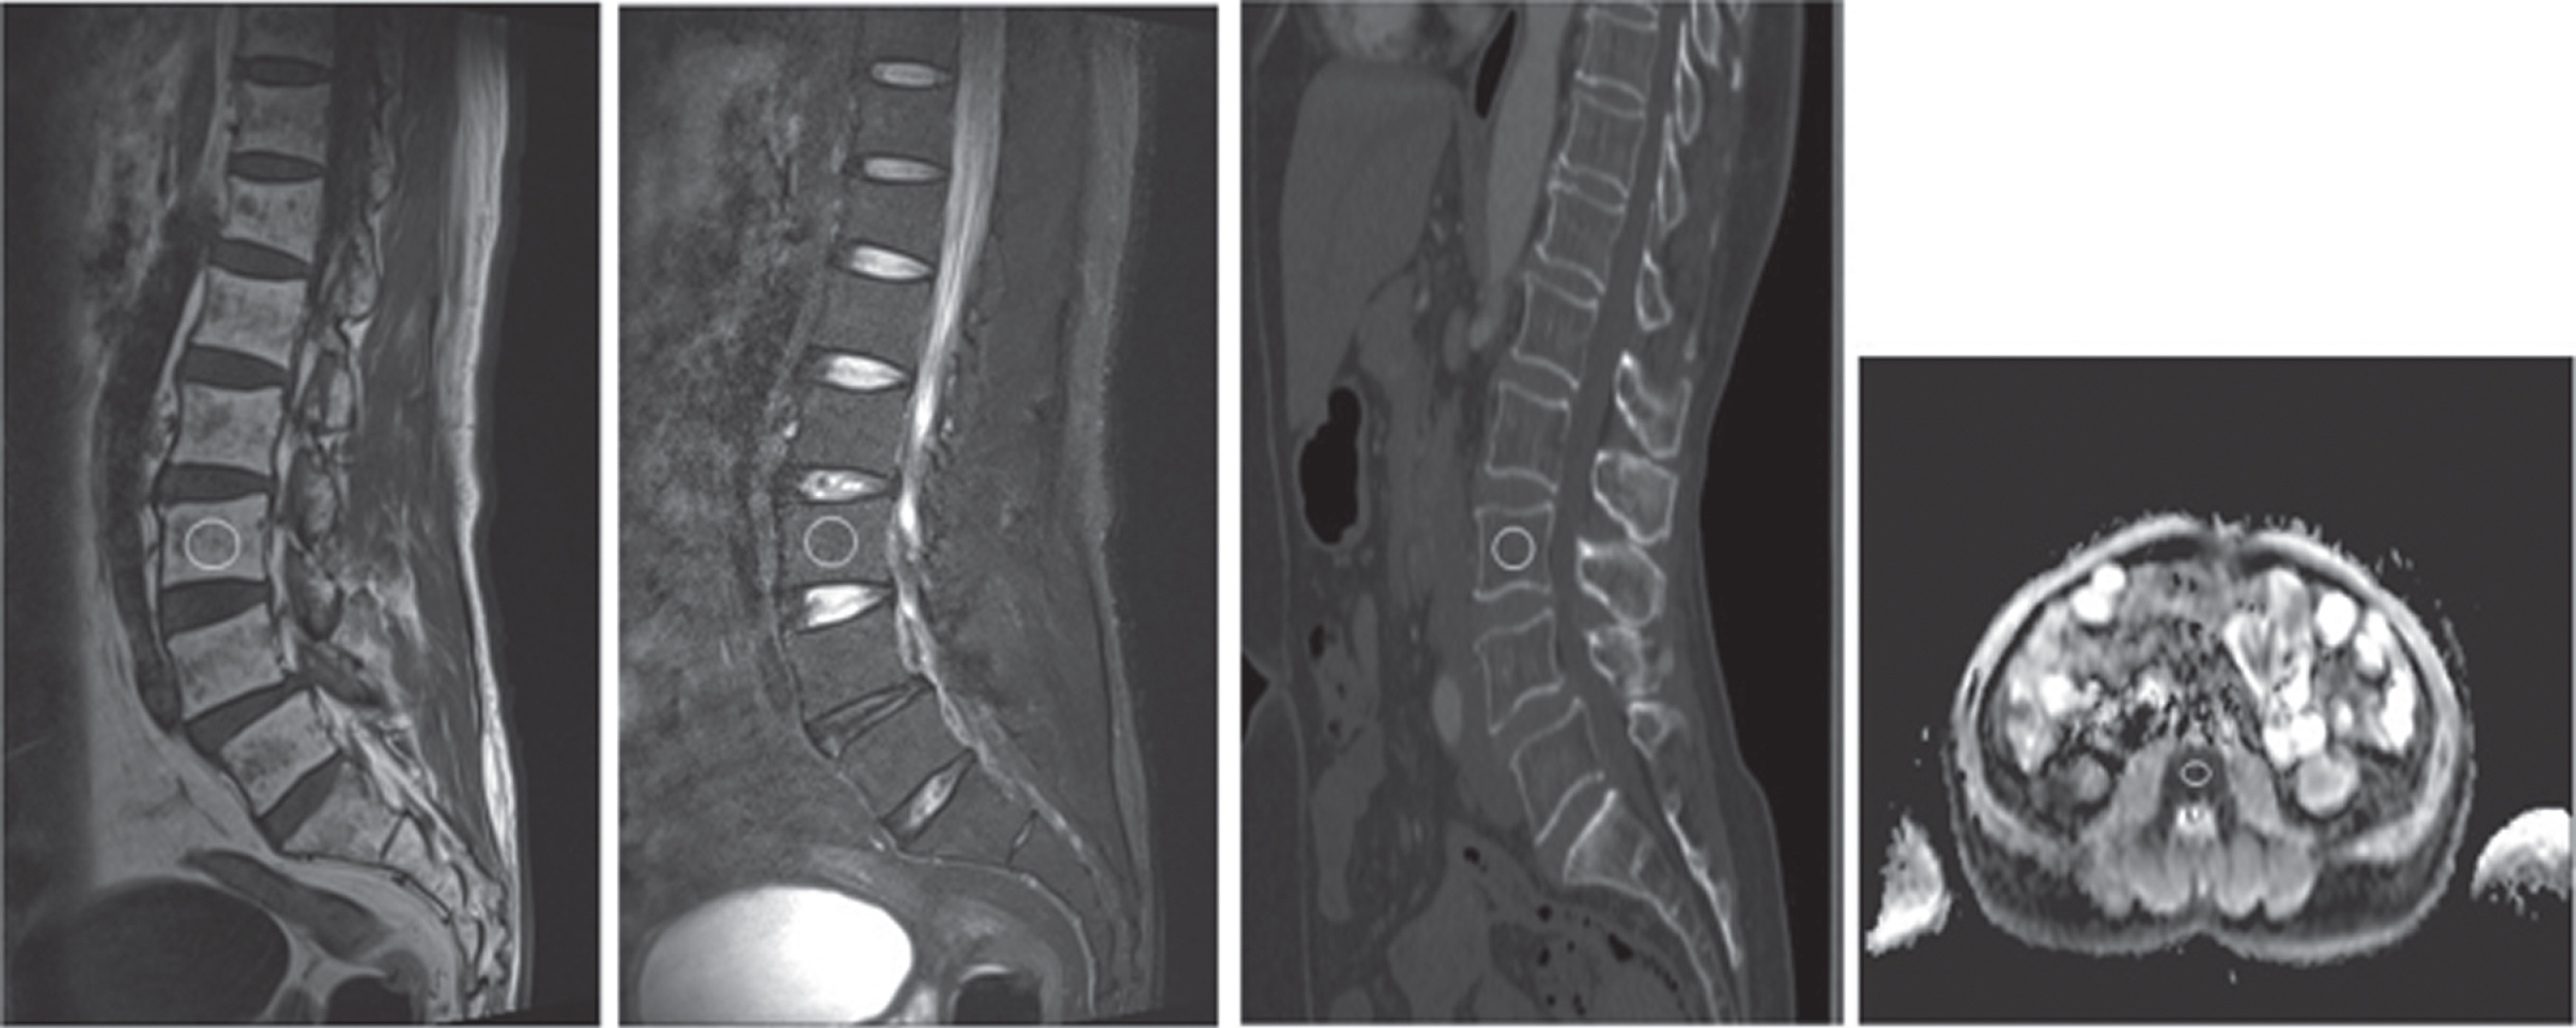
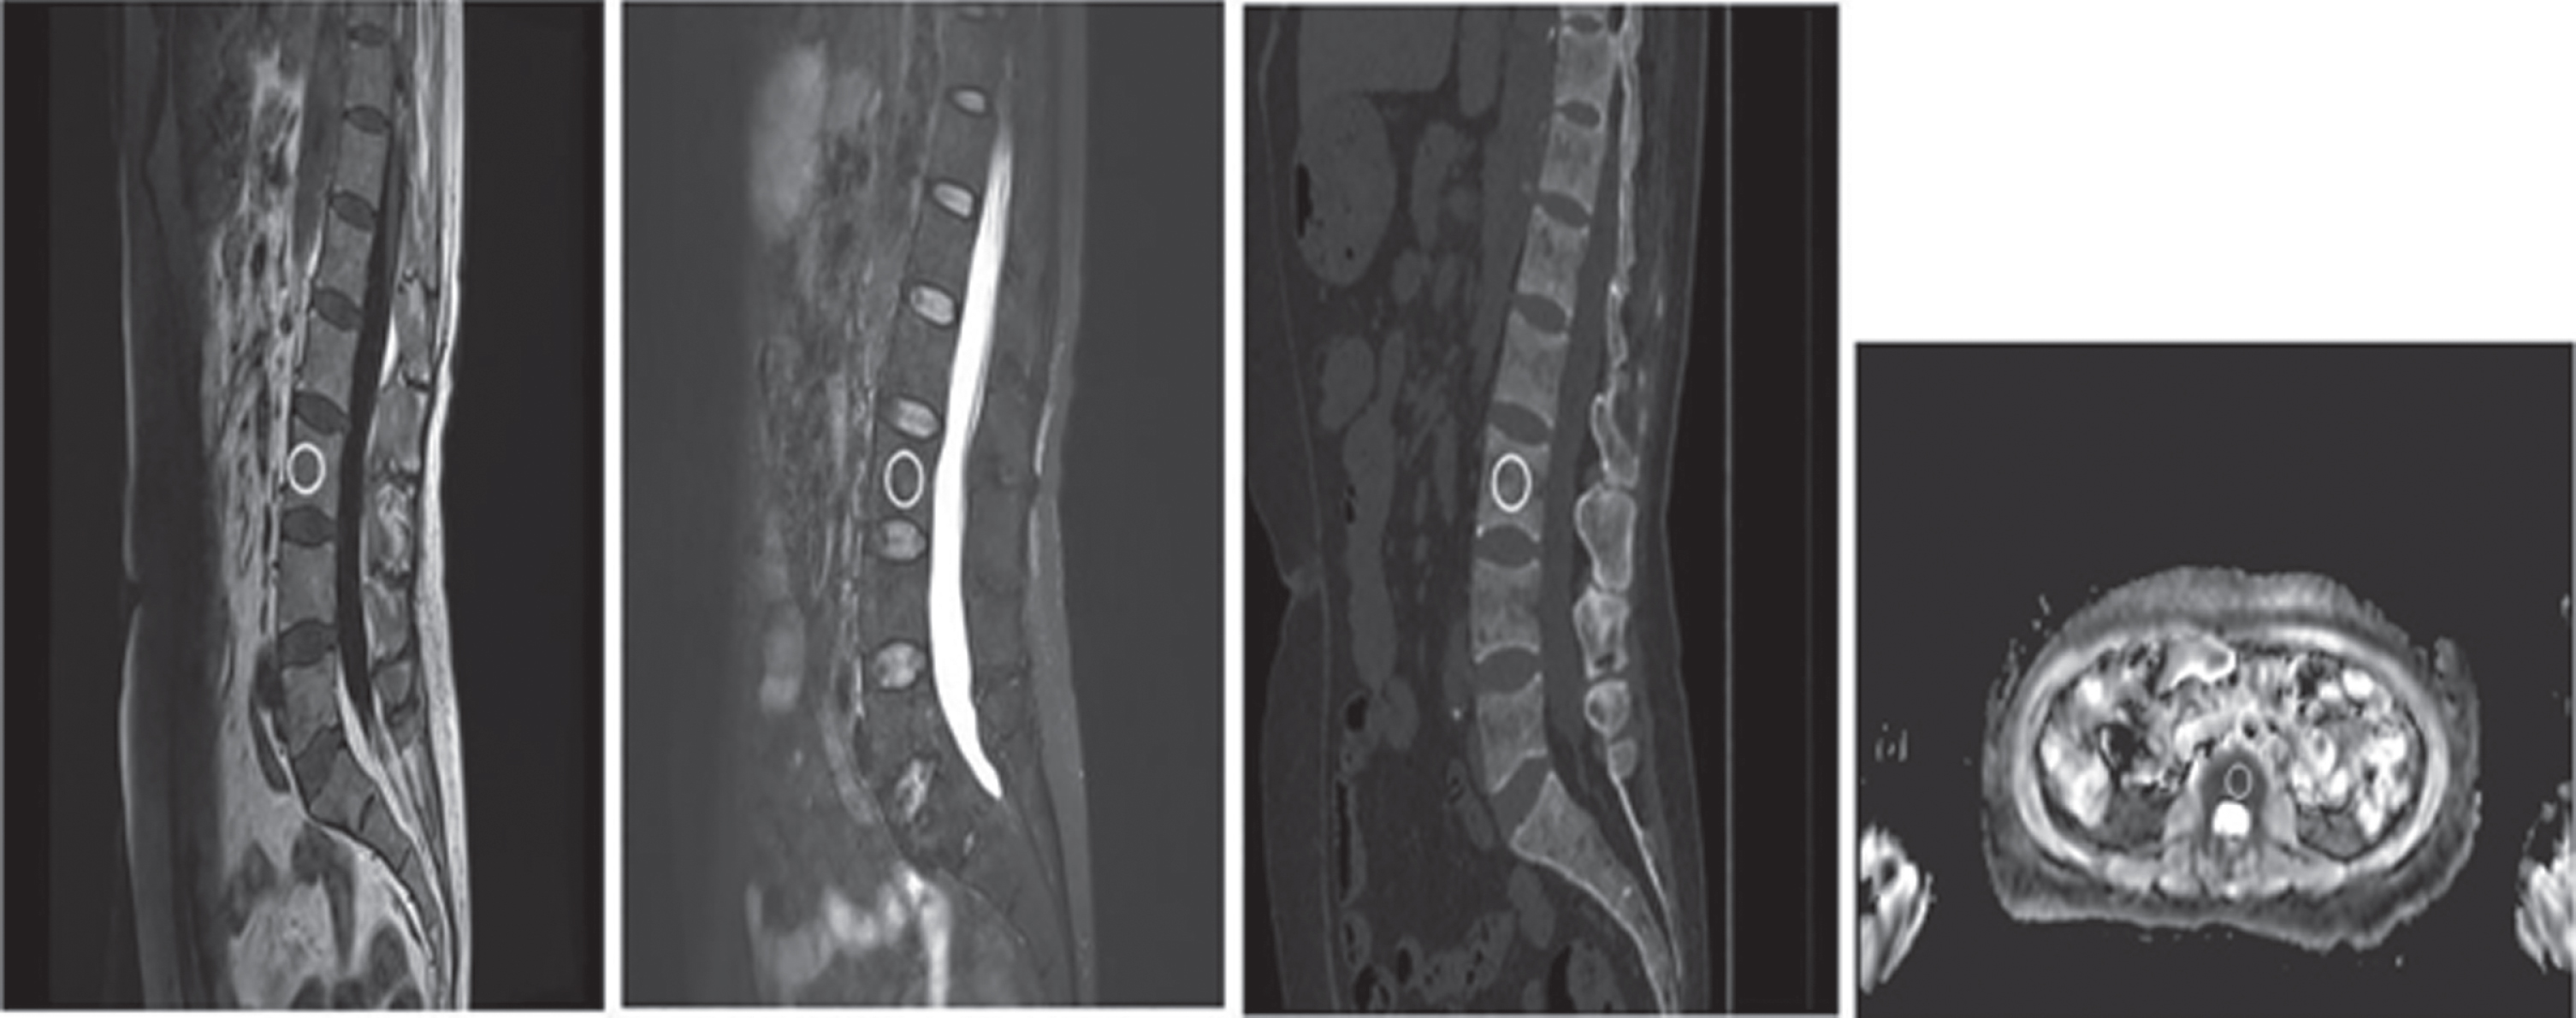
A 56-year-old woman with normal pattern. An oval ROI of 100 mm2 was placed on the central slice of CT image of each lesion on the sagittal position and the corresponding location was automatically displayed on the axial ADC (apparent diffusion coefficient) map. A-D: T1-weighted (A), T2-FS (B), dual-energy spectral CT (C), ADC map (D).
There were significant differences in Ca(Water), Water(Ca), HAP(Fat), Fat(HAP) and Eff-Z (all P < 0.001) between the MM group (F + D + SP + N pattern) and the control group, but no significant differences in the 70-keV CT value (P = 0.427) (Table 1).
Diagnostic Performance of Spectral CT Quantitative Parameters between MM Group and Control Group per Lesion Analysis
a. The mean values of spectral CT quantitative parameters were presented. Data in parenthesis were standard deviations. b. The Sensitivity and Specificity under the best Youden Index were presented. c. *Statistically significant.
In the ROC analysis, the use of a single quantitative parameter showed limited diagnostic ability (as shown in Table 1 and Fig. 6) except for the Fat(HAP) value (AUC = 0.846 [95% CI, 80.4–88.3%], sensitivity = 0.624 and specificity = 0.929). The performance of the model-based parameter was better (Ca/Water model: AUC = 0.856 [95% CI, 81.4–89.1%], sensitivity = 0.841 and specificity = 0.768; HAP/Fat model: AUC = 0.850 [95% CI, 80.7–88.6%], sensitivity = 0.790 and specificity = 0.805).

ROC curve per lesion between the MM group and control group for various quantitative parameters. The curve for the best six predictors—whether this was a single parameter or modeled parameter—was presented.
The normal infiltration pattern for MM was compared with other infiltration patterns and the control group. In the one-way ANOVA analysis, statistical differences were found for all patterns (P < 0.001 for all). Bonferroni-adjusted multiple comparisons showed significant differences in 70-keV CT value and Ca(Water) value between the N pattern and control group (P = 0.031 and 0.031, respectively). When comparing the N pattern and other MM patterns, the 70-keV CT value, and the values of Ca(Water), HAP(Fat), Fat(HAP) and Eff-Z, were found to be statistically different (all P < 0.01, Table 2). ROC analysis revealed an AUC of 0.951 (95% CI, 90.5–93.2%) when using a model-based parameter with Ca/Water to distinguish the normal pattern from the other three patterns, with a sensitivity of 90.5% and a specificity of 93.3%, which was similar to the results for the ADC value (AUC, 0.954 [95% CI, 84.2–88.4%]; sensitivity, 90.5%; specificity, 95.2%). In the ROC analysis of the N pattern group and control group, the ROC curve was very similar among different parameters and the diagnostic accuracy was unsatisfactory regardless of which single parameter or model-based parameters were used. The best among all the parameters was Eff-Z (AUC = 0.735 [95% CI, 64.8–80.5%]; sensitivity = 0.667 and specificity = 0.867 under cutoff value of 9.89).
Multiple comparison results among N Pattern, Other Pattern and Control Group per Lesion Analysis
Data were presented as Mean (Sd) Other Pattern included F Pattern, D Pattern and SP Pattern. *Statistically different.
In terms of the comparisons among different patterns (F, D and SP), the differences in all parameters were statistically significant in the one-way ANOVA analysis (P < 0.001 for all), except for Fat (HAP) (P = 0.139). The multiple comparison indicated that these parameters were significantly different when comparing F pattern vs. D pattern and D pattern vs. SP pattern, but there was no statistically significant difference using Water (Ca) value and 70-keV CT value between F pattern and SP pattern (Table 3).
Multiple Comparison Among F Pattern, D Pattern and SP Pattern
a. Data were presented as Mean (Sd) * Statistically different.
ROC curve per patient between the MM and control group for various quantitative parameters. The curve for the best six predictors—whether this was a single parameter or modeled parameter—was presented.
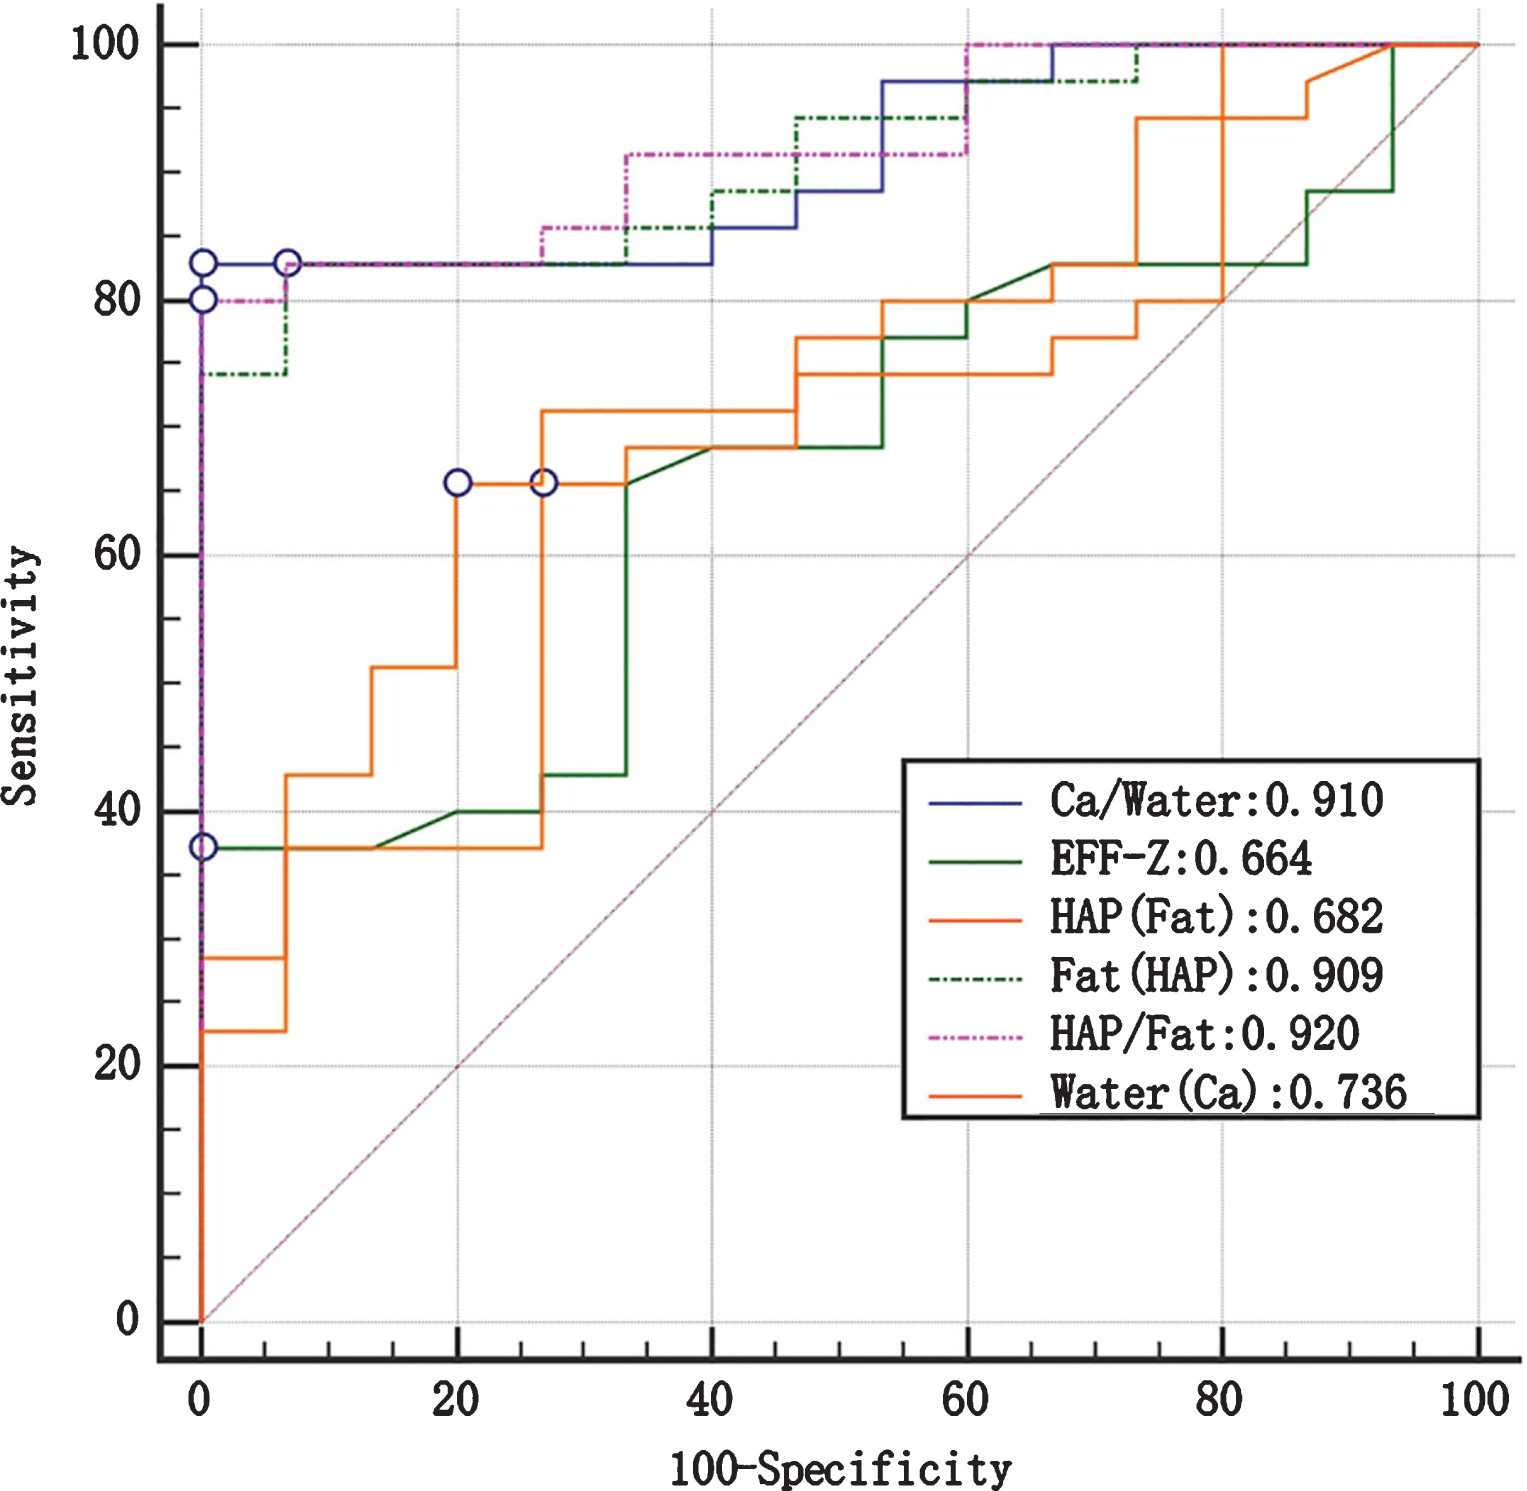
When the MM patients (n = 35) and control patients (n = 15) were compared, no differences were found for the age and sex distribution between these two groups (P = 0.882 and 0.399, respectively), while the values for HAP(Fat) and Eff-Z were found to be statistically different (P = 0.014 and 0.04, respectively). The ROC analysis showed that these two parameters could not be used to satisfactorily distinguish BM infiltration from healthy BM (AUC = 0.682 [95% CI, 53.5–80.6%] and 0.664 [95% CI, 51.6–79.1%], respectively). On the other hand, although the values for Fat (HAP) were not significantly different between the MM patients and the control subjects, its classification ability was satisfactory (AUC = 0.909 [95% CI, 79.3–97.2%], sensitivity = 0.829 and specificity = 0.933). The following model-based parameters also showed satisfactory AUC in their capacity to differentiate between MM patients and control subjects: Ca/Water (AUC = 0.910 [95% CI 79.5–97.3%], sensitivity = 0.829 and specificity = 1.000) and HAP/Fat (AUC = 0.920 [95% CI 80.8–97.8%], sensitivity = 0.800 and specificity = 1.000) (DeLong test, P > 0.05) (as shown in Fig. 7 and Table 4).
Diagnostic Performance of Spectral CT Quantitative Parameters between MM Group and Control Group Patients per Patient analysis
Diagnostic Performance of Spectral CT Quantitative Parameters between MM Group and Control Group Patients per Patient analysis
a The mean values of spectral CT quantitative parameters were presented. Data in parenthesis were standard deviations b The Sensitivity and Specificity under the best Youden Index were presented. *Statistically different.
To the best of our knowledge, this was the first study to evaluate MM using dual-energy spectral CT with fast kV switching technology and the first attempt to identify different patterns of infiltration in patients with MM. We demonstrated that the model-based parameter Ca/Water can differentiate not only between infiltrated and healthy BM (AUC = 0.856 [95% CI, 81.4–89.1%], sensitivity = 0.841 and specificity = 0.768), but also between MM patients and control subjects (AUC = 0.910 [95% CI, 79.5–97.3%], sensitivity = 0.829 and specificity = 1.000).
Conventional CT uses only one parameter: the CT value. The intrinsically high CT value and high CT-value variation in trabecular structures with osseous calcium—regardless of bone marrow infiltration status—makes it problematic to use CT values alone to accurately reflect the degree of bone marrow involvement. The existence of beam-hardening artifacts in CT value measurement further complicates the differentiation. One study involving 34 patients showed that conventional CT value was not a good parameter in the characteristic analysis between MM and non-infiltrated patients, with a sensitivity of 52.0% and a specificity of 84.7% [23]. Dual-energy spectral CT explores more X-ray spectral information derived from two-energy data, allowing for characterization and differentiation of substances with different atomic numbers. As a result, the fast kV switching DESCT technology provides more quantitative parameters than the single parameter—CT value—used in conventional CT. In the current study, the added parameters were material-specific. This would potentially allow us to overcome obstacles caused by the highly overlapped CT value measurements in conventional CT. Our study showed that the values of Ca(Water) and HAP(Fat) in MM lesions were statistically lower than those in the control group, while no differences in 70-keV CT values were found between the two groups. The results were consistent with the interpretation of pathological changes that occur in MM—that is, accumulation of clonal plasma cells that destroy trabecular bone and yellow or red marrow results in a loss of calcium within lesions [28, 29].
Various parameters offer more possibilities for quantitatively solving the classification problem, either with a single threshold or model-based thresholds. In our study, the use of a single quantitative parameter showed limited diagnostic ability, while the model-based parameter, Ca/Water (AUC = 0.856 [95% CI, 81.4–89.1%], sensitivity = 0.841 and specificity = 0.768), had better diagnostic ability in terms of differentiating MM from healthy BM than the use of any single parameter. Although previous studies using single parameter from dual-energy CT with VNCa technology reported better sensitivity (from 80% to 93.3%) and specificity (from 71.4% to 92.4%) for differentiating MM from healthy BM [22, 23]. DESCT has more potential in bone infiltration classification with multiple parameters, comparing to single parameter-CT value.
Our study also considered the normal MRI pattern for marrow involvement in MM. Although the patients with a normal MRI pattern had a better prognosis than patients with other patterns, due to the occasional potential to be progressive, these patients should continue to be carefully observed [30]. The differentiation of normal pattern was not good enough in the previous study. Kosmala et al found that normal pattern could not be quantitively differentiated from healthy bone marrow [24]. On the contrary, our study revealed that the normal pattern for BM infiltration could be distinguished from the pattern for healthy bone marrow with the values of 70-keV CT, Ca(Water), Water(Fat) and Fat(Water), though the ROC curve showed that the diagnosis ability of the aforementioned parameters was not sufficiently adequate (all AUCs < 0.75). The sample size of normal pattern and salt and pepper pattern was relatively small with only 21 ROIs in each group, which may devalue our findings. Although the value of spectral CT parameters regarding MM patients with normal pattern should be further explored using a larger sample size, such parameters could still represent a potentially useful tool for distinguishing between MM patients with normal pattern and healthy subjects in the future.
The identification of MM imaging patterns is essential for the development of a prognostic prediction and treatment strategy. Several studies have shown that in patients with MM, the medium overall survival time associated with diffuse pattern was less than that associated with focal and normal patterns [31, 32]. Furthermore, diffuse pattern and the number of focal lesions were found to be linked to a negative prognostic effect [33, 34]. Traditionally, MRI is used to visually determine the infiltration pattern, and the CT values in conventional CT are inadequate for the task. In a study conducted by Thomas et al. [22], dual-energy CT (DECT) with VNCa technology was shown to improve the diagnostic detection of high-grade diffuse infiltration with a sensitivity of 75.0% and a specificity of 82.4%. Recently, in a study of 53 patients with MM [24], DECT with VNCa technology facilitated the discrimination of diffuse pattern from normal pattern (sensitivity, 100%; specificity, 97%), focal pattern from normal pattern (sensitivity, 97%; specificity, 99%) and diffuse pattern from focal pattern (sensitivity, 33%; specificity, 25%). Thus, in our study, we not only distinguished different patterns of BM infiltration in patients with MM, but also detected the occurrence of BM infiltration in MM patients. Also, we showed that, except for Fat(HAP) and Water(Ca), all other parameters derived from fast kVp switching DESCT could be used to differentiate any two of the three patterns (F, D and SP). These findings may provide quantitative parameters to define MM imaging patterns more precisely.
Our study has several limitations. First, although the number of ROIs for all subgroups was adequate for the statistical analysis, the sample size of this study was rather small, involving only 35 patients with MM. Second, we utilized MRI as a reference for MM imaging patterns to draw ROI locations on CT images which could not be visualized. Third, we did not measure all focal lesions larger than 5 mm, which could result in selection bias. Fourth, the control subjects did not undergo an MRI examination. Even when applying strict inclusion and exclusion criteria, bone marrow edema could not be entirely precluded. Fifth, in this study only 70-keV monoenergetic images were selected for analysis; further analysis of different kilo-electron-volt monoenergetic images will be performed in the future. Lastly, a biopsy—to correlate histopathologic findings and MRI findings—was not performed for each lesion. In future studies, it might be helpful to assess all lesions in the axial skeleton and include a higher number of MM patients.
In conclusion, this study demonstrates that the fast kVp switching DEDCT offers promise for quantitatively detecting MM infiltration lesions and differentiating various MM infiltration patterns.
Conflicts of interest
All authors have read the journal’s policy on disclosure of potential Conflicts of interest and have none to declare.
Footnotes
Acknowledgments
The research was supported by the Project of State Key Laboratory of Radiation Medicine and Protection, Soochow University (No. GZK1201916), National Key Research and Development Program of China (No. 2017YFC0114300) and National Natural Science Foundation of China (No. 81771885).