
Abstract
BACKGROUND:
Acute ischemic stroke (AIS) results in high morbidity, disability, and mortality. Early and automatic diagnosis of AIS can help clinicians administer the appropriate interventions.
OBJECTIVE:
To develop a deep symmetric 3D convolutional neural network (DeepSym-3D-CNN) for automated AIS diagnosis via diffusion-weighted imaging (DWI) images.
METHODS:
This study includes 190 study subjects (97 AIS and 93 Non-AIS) by collecting both DWI and Apparent Diffusion Coefficient (ADC) images. 3D DWI brain images are split into left and right hemispheres and input into two paths. A map with 125×253×14×12 features is extracted by each path of Inception Modules. After the features computed from two paths are subtracted through L-2 normalization, four multi-scale convolution layers produce the final predation. Three comparative models using DWI images including MedicalNet with transfer learning, Simple DeepSym-3D-CNN (each 3D Inception Module is replaced by a simple 3D-CNN layer), and L-1 DeepSym-3D-CNN (L-2 normalization is replaced by L-1 normalization) are constructed. Moreover, using ADC images and the combination of DWI and ADC images as inputs, the performance of DeepSym-3D-CNN is also investigated. Performance levels of all three models are evaluated by 5-fold cross-validation and the values of area under ROC curve (AUC) are compared by DeLong’s test.
RESULTS:
DeepSym-3D-CNN achieves an accuracy of 0.850 and an AUC of 0.864. DeLong’s test of AUC values demonstrates that DeepSym-3D-CNN significantly outperforms other comparative models (p < 0.05). The highlighted regions in the feature maps of DeepSym-3D-CNN spatially match with AIS lesions. Meanwhile, DeepSym-3D-CNN using DWI images presents the significant higher AUC than that either using ADC images or using DWI-ADC images based on DeLong’s test (p < 0.05).
CONCLUSIONS:
DeepSym-3D-CNN is a potential method for automatically identifying AIS via DWI images and can be extended to other diseases with asymmetric lesions.
Keywords
Introduction
Recently, there has been a rise in the incidence of acute ischemic stroke (AIS), resulting in numerous disabilities [1]. AIS is characterized as brain cell necrosis caused by the obstruction of the cerebral arteries supplying blood. Typical symptoms of AIS include movement disorders, stuttering, and loss of sensation, and it can also lead to sequelae such as dementia and paralysis [2]. The outcome of AIS directly depends on timely medical intervention [3]. Therefore, quick identification of lesions, accurate diagnosis, and early treatment are crucial for stroke management [4].
Neuroimaging including brain Computed Tomography (CT) and magnetic resonance imaging (MRI) has been the backbone of stroke management [5]. CT owns the great features of the widespread availability, low cost, and fast scanning speed and the last feature makes CT suitable for acutely unstable stroke patients [6]. Non-contrast CT can help characterize the progression of infarction and edema after stroke [7, 8]. CT perfusion imaging has higher sensitivity and specificity for detecting fresh ischemia than non-contrast CT and is able to detect the penumbra [9]. However, the high radiation dose is one concern.
Multiple-modality magnetic resonance imaging (MRI) examinations show the higher accuracy, sensitivity, and specificity for AIS diagnosis than non-contrast CT. According to one study on the emergency diagnosis of any acute stroke, MRI has achieved a sensitivity of 83%, much higher than that by using CT (26%) [10]. Moreover, MRI has presented significantly better performance than CT in the diagnosis of early lacunar infarction and the detection of ischemic lesions within 3 hours of onset [11, 12]. Within 24 h of AIS onset, brain lesions are not noticeable and are challenging to identify at the bottom of the brain and posterior fossa resulting from artifacts [13]. MRI can accurately show early ischemic infarction and has a high detection rate in cerebella and brainstem infarctions [14]. Diffusion-weighted imaging (DWI) is an MRI technique that provides information on the brain’s pathological state and the signal ratio of water molecules. AIS lesions demonstrate high intensity in DWI images and low intensity in Apparent Diffusion Coefficient (ADC) images simultaneously (Fig. 1). Many researchers have recognized the diagnostic value of using DWI and ADC images for AIS diagnosis within 6–24 h.
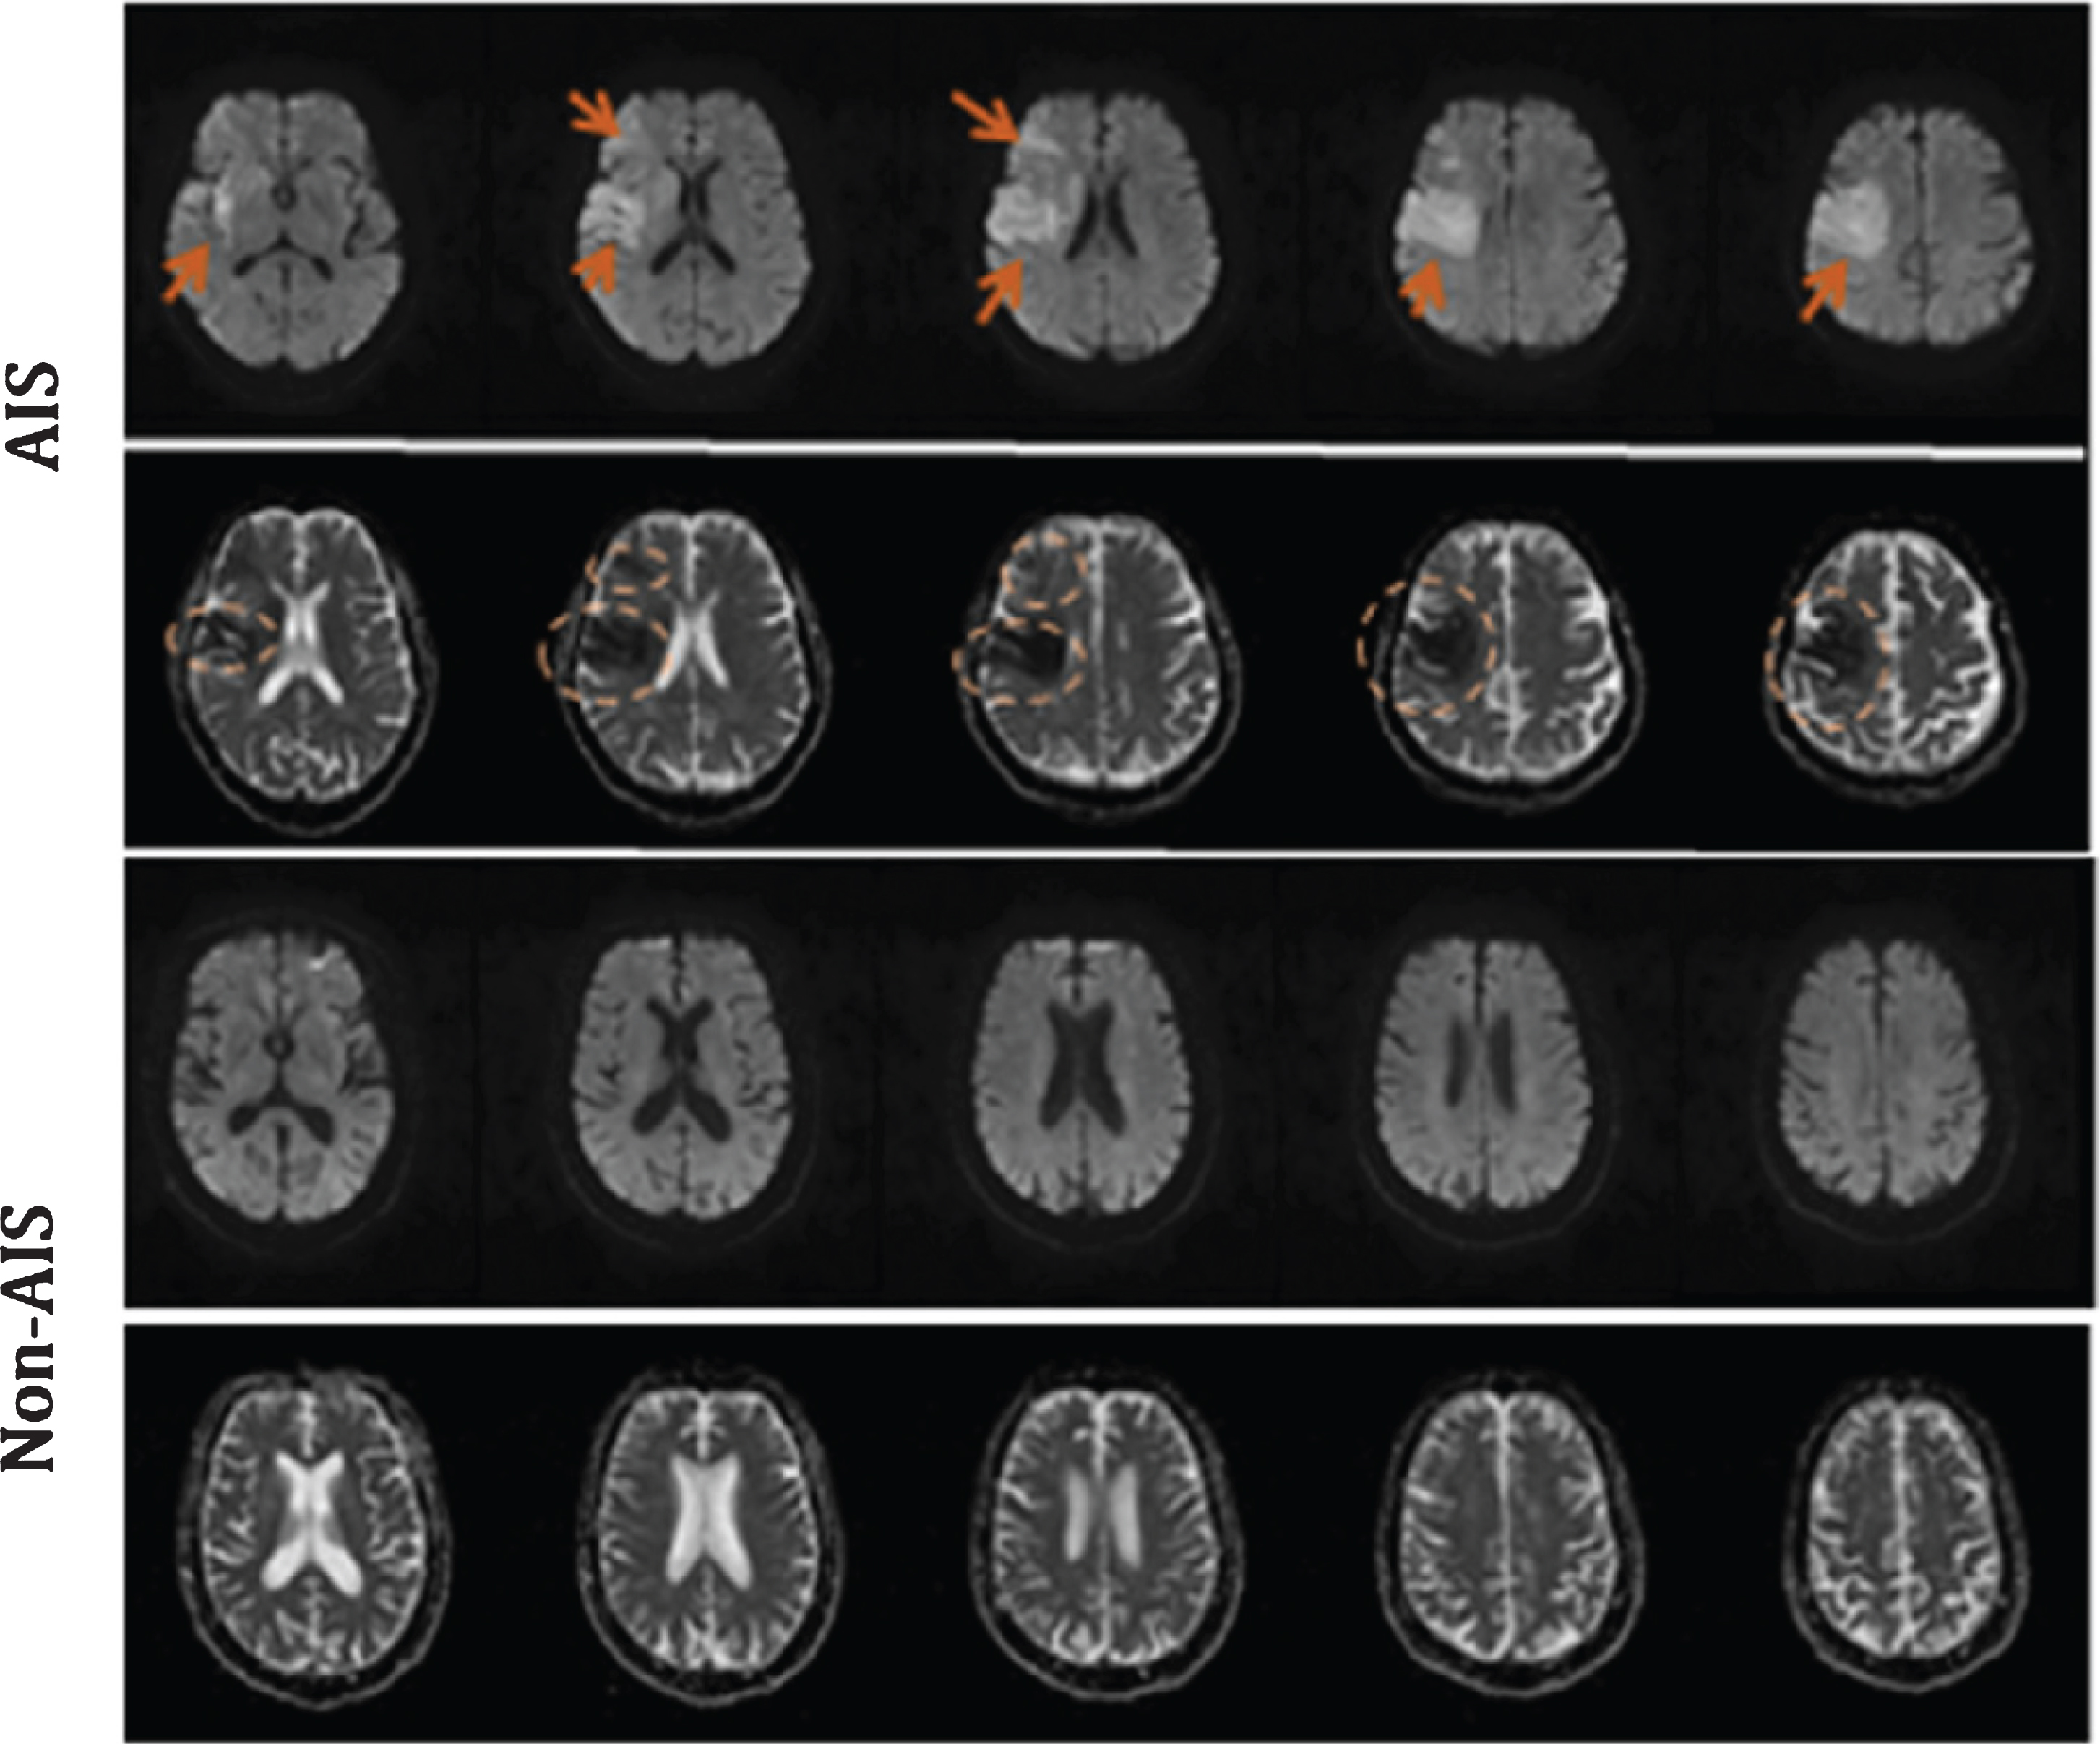
Examples of DWI and ADC images of AIS and Non-AIS patients (The first row is for the DWI images with AIS lesions indicated by the arrows, the second row is for the ADC images with AIS lesions indicated by the ellipses, and the third and fourth rows are for the DWI and ADC images from one Non-AIS patient, respectively.).
There are still some challenges associated with DWI-based diagnosis [15]. First, the number of images and the workload is often large, which may reduce the accuracy. Second, small blood vessels or ischemic penumbra (IP) may not be detected [16, 17]. Lastly, artifacts in DWI scans may produce stroke mimics with similar intensity and shape to stroke lesions [18, 19]. We believe that new computer-aided diagnosis methods might help conquer these limitations.
Artificial intelligence (especially deep learning) has allowed for significant progress recently [20]. Deep learning enables end-to-end learning and assists in providing more precise medical treatment of AIS [21]. Recently, Qiu et al. have developed an automatic approach (which combines machine learning (ML) and deep learning) to detect and quantitate infarction using non-contrast-enhanced CT scans in patients with AIS [22]. The 3D fully convolutional neural network (CNN) has been proposed for segmenting AIS lesions from DWI images [23]. The requirement for large amounts of data, which is unusually not available in the medical field, and difficulty of visual interpretation are the main limitations of deep learning in stroke neuroimaging [24].
Inception Module is a deep learning structure proposed by Szegedy et al. in 2014 and used to construct GoogLeNet which wins the champion of the ImageNet Large-Scale Visual Recognition Challenge 2014 [25]. The basic structure of Inception Module has four channels using the convolution kernels with different sizes and the outputs of each channel are concatenated. Inception Module at least has two main contributions. First, the use 1×1×1 convolution can reduce the computational complexity. Second, the multi-scale information extracted by different kernels can be aggregated through the filter concatenation. Up to now, Inception Module has been considered as one typical module for constructing effective deep CNNs and used in the classification and segmentation in the medical images [26, 27].
Inspired by the Siamese Network, Barman et al. and Sheth et al. have proposed a symmetric network model (DeepSymNet) to automatically diagnose an ischemic stroke using CT angiography (CTA) images [28, 29]. DeepSymNet achieved an AUC of 0.899 using a cohort of 217 subjects (94 with stroke with CTA performed within 24 h of onset). Using symmetry-based analysis of ischemic lesions in non-contrast CT images, Peter et al. designed a classifier to achieve an AUC of 0.82 for a cohort of hyper acute stroke patients (< 8 h from the stroke onset) [30]. Pena et al. have implemented a novel pipeline based on a DeepSymNet architecture to detect the Alzheimer’s disease (AD) progression pattern by learning from structural differences of inter-subject MRI scans at two-time points with an End-to-End Data-Driven approach [31]. Recently, Barman et al. have combined symmetry-aware, symmetry-naïve features to detect brain hemorrhage from CT images [32]. These previous studies demonstrate the feasibility of the proposed approach.
It is noted that previous studies mainly focus on the deep learning in the diagnosis and characterization of ischemic stroke via CT images (non-contrast CT, CTA). Utilizing the asymmetry of ischemic infarction to identify AIS is feasible; however, it has not been done by using DWI images.
The motivation of current study is to develop a deep learning model which can detect AIS from DWI images and help the neuro-radiologists to fulfill the diagnosis of AIS. We hypothesize that a deep CNN can detected AIS automatically through comparing the left and right hemispheres of 3D DWI images. Therefore, a deep symmetric 3D CNN (DeepSym-3D-CNN) with two paths taking the inputs of two hemispheres of 3D DWI images is proposed. The features generated from the two paths of Inception Modules are subtracted to highlight the asymmetric lesion information. Subsequently, multi-scale convolutional layers produce the final prediction. For one new application of identifying AIS via DWI images, the methodological novelty of this study lies in the architecture of DeepSym-3D-CNN, the use of Inception Modules, and the subtraction of two paths by L-2 normalization.
Participants and MRI image acquisition
All 190 participants in our study have been recruited from Shanghai Fourth People’s Hospital Affiliated to Tongji University School of Medicine from October 2014 to October 2019. DWI, ADC, T1-weighted, perfusion-weighted imaging (PWI) images are collected for each subject. Clinicians used PWI to label images as AIS (n = 97) or Non-AIS (n = 93). This study has been approved by the review board of the Shanghai Fourth People’s Hospital Affiliated to Tongji University School of Medicine. The informed consent is waived after the review of the committee.
The characteristics of the above patients are listed in Table 1. Among them, 97 are AIS (38 females, 39.2%), 93 are Non-AIS (66 females, 71.0%), the average age is (69±1.5) years, and the onset time is within 24 h.
Characteristics of patients
Characteristics of patients
aTwo-sample t-test; bChi-squared test.
All MRI images were collected using an Avanto 1.5 Tesla MRI scanner (Siemens) with a 12-channel phased-array head coil. During the scan, the subject was requested to lie on their back, close their eyes, keep their head still, and stay awake, with their head entering the scanner first. DWI images were acquired using the following settings: matrix size of 92×192, slice thickness of 5.0 mm, slice spacing of 6.5 mm, repetition time (TR) of 3600 milliseconds, echo time (TE) of 102 milliseconds, flip angle (FA) of 90°, the field of view (FOV) of 229×229 mm, and b value of 0 and 1000 s/mm2. ADC mappings (or images) are calculated from DWI images using an algorithm embedded in the workstation provided by the manufacturer of the MIR scanner. For PWI, the settings were: matrix (256×256), slice thickness (5.0 mm), slice spacing (6.5 mm), TR (1520 milliseconds), TE (32 milliseconds), FA (90°), and FOV (230×230 mm). T1-weighted images were acquired using a 3D magnetization-prepared rapid gradient-echo (MP-RAGE) sequence with the settings: matrix (256×232), slice thickness (5.5 mm), slice spacing (7.15 mm), TR (450 milliseconds), TE (8.7 milliseconds), FA of 90°, and FOV (208×230 mm).
Image preprocessing in this study included four main steps: normalization, registration, removal of the skull, and augmentation. First, the intensity of each pixel of the images is linearly transformed to the range of 0–1 [33]. Given the intensity of DWI images may vary with MRI scanners, the image normalization is done by the linear standardization [34]. The equation is presented as
where xNormalization and x are the intensity of each pixel in the images before and after conversion, respectively. Min and Max are the minimum and maximum values in the 3D DWI images, respectively. It is noted that to linearly transform MRI pixel values to the range of 0-1 does not solve normalizing issue of AIS regions in MRI. The aim is to reduce the variance of the absolute intensities of different DWI images. How to normalize the intensities of AIS regions in DWI images is still for further study.
Second, the registration is done to unify the image size and orientations to ensure that the left and right brain hemispheres are symmetrical. The ITK toolbox and the template of (256×256×14) are used in the registration (https://itk.org/). Third, Brain Extraction Tool (BET) in FMRIB Software Library v6.0 is used to remove the skull [35]. The fractional intensity threshold is set as the default value of 0.5.
Finally, we have augmented the data three times using brightness enhancement, contrast enhancement, and horizontal flipping. In total, 14 slices are selected and used from the 3D images of each subject, and the other slices are deleted to reduce data redundancy. Usually 20 MRI slices are obtained in the brain of each patient. According to the visual inspection of neuro-radiologists, no AIS lesion presents at the slices 1–3 and 17–20.
We have proposed one DeepSym-3D-CNN with the architecture of two paths, a subtraction layer with L-2 normalization, convolutional layers, and fully connected layers (Fig. 2). First, because of the symmetry of the human brain and the fact that AIS mainly occurs on one side of the human brain, we divided the 3D images (256×256×14) into two subparts of 256×128×14. The left was defined as Subpart 1, and the right was mirrored horizontally and defined as Subpart 2. Subpart 1 and Subpart 2 were input into two paths of the DeepSym-3D-CNN.
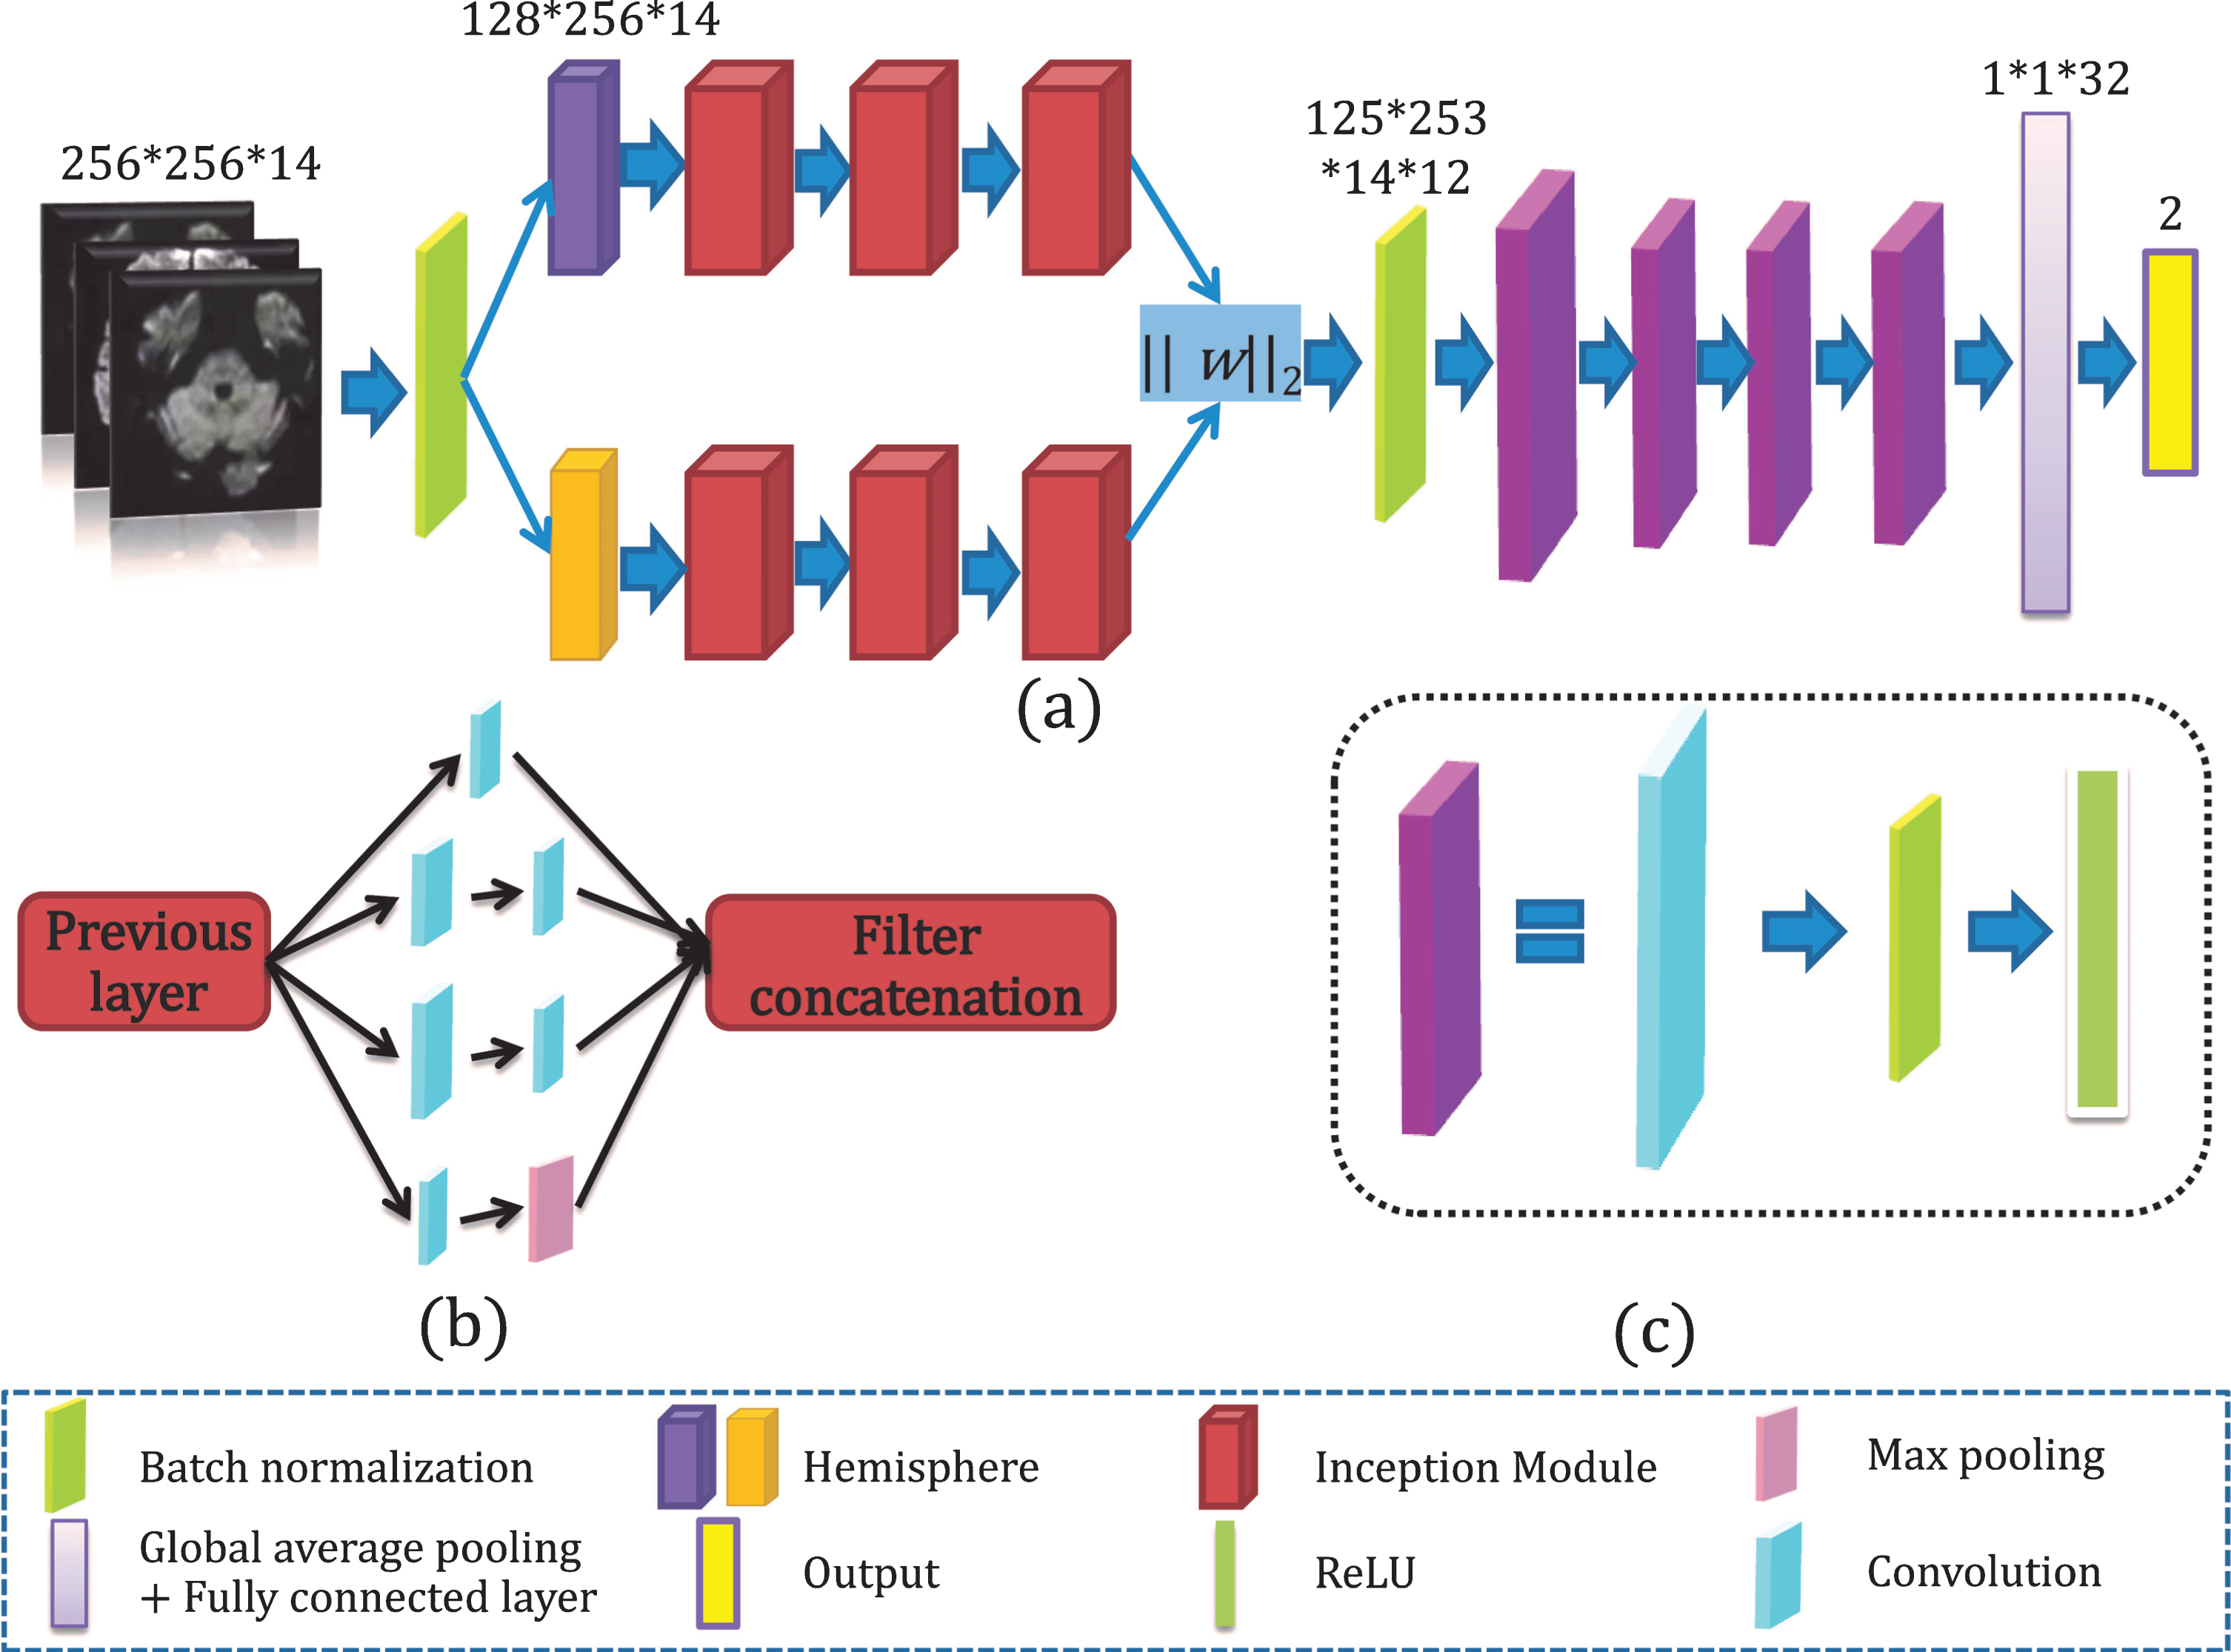
The architecture of the proposed DeepSym-3D-CNN model. (a) DeepSym-3D-CNN integrates the two paths with Inception Modules, subtraction layer by L-2 normalization, and multi-scale convolutional layers; (b) Inception Module with four branches; (c) The convolution module with convolutional layers, ReLU, and batch normalization layer.
The two paths have the same architecture, but their weights are not shared. As shown in Fig. 2(a), each path consisted of three sequentially connected Inception Modules with the same size and parameters. For the first Inception Module, the previous layer is the DWI images of the left or right hemisphere after batch normalization. For the two following Inception Modules, the previous layer is the output of the previous Inception Module.
Figure 2(b) gives the internal architecture of Inception Module. It consisted of four branches: (1) 3D kernel of 1×1×1, strides of 1×1×1, padding of 0×0×0; (2) kernel of 1×1×1, strides of 1×1×1, padding of 0×0×0 and kernel of 3×3×3, strides of 1×1×1, padding of 1×1×1; (3) kernels of 1×1×1 and 5×5×5, strides of 1×1×1, padding of 2×2×2; and (4) kernel of 1×1×1 and maximum pooling layer of 3×3×3 with strides of 1×1×1, padding of 1×1×1. All outputs of branches are concatenated and transmitted to the next module. Four branches can ensure that the output is the same size as the input image, reducing the loss of effective information and the calculation’s complexity. The non-linear function (ReLU) is used as the activation function. ReLU gradient is constant in most cases and can solve the convergence problem.
Features generated from two paths are subtracted to highlight the asymmetric lesion information by one subtraction layer with L-2 normalization.
The highlighted asymmetric lesion information is further input to four multi-scale 3D-CNN modules. In Fig. 2(c), each module comprises a convolutional layer, a BN layer, and a ReLU. The kernels in the first module are 5×5×5, and the others are 3×3×3.
A global average pooling layer and a fully connected layer are connected to the sigmoid classifier to get the final classification. The global average pooling has been shown to enable the entire network structure’s regularization to prevent overfitting [36].
A binary cross-entropy loss function is employed to calculate the loss between prediction and ground truth.
Meanwhile, we use the stochastic gradient descent method to optimize the parameters, and its weight is updated as follows:
where l is the number of layers of the convolutional neural network, i is the number of weight iterations, η is the learning rate is set to 0.001. When the learning rate is reduced to a certain level, it will be automatically increased until the training stops. The weights are initialized before training with a mean value of 0, a Gaussian distribution (standard deviation of 0.001, and an initial bias value of 0). The batch size is 4, the epoch number is 100, and thus the iteration number is 456×100/4. Here 456 is the number of image cases in the training dataset.
We have implemented three comparative models. The first one is the 3D MedicalNet with transfer learning. The original MedicalNet is modified into a classification model with two categories [37]. The aim of choosing MedicalNet is to compare our DeepSym-3D-CNN with the state-of-the-art CNN model without symmetrical architecture. Since our dataset has a small sample size, the transfer learning strategy is adopted. The pre-trained parameters in the layers before the fully connected layer are frozen, and only parameters in the fully connected layer are trained using our data.
The second model has the same architecture as DeepSym-3D-CNN, but the simple 3D-CNN replaces the 3D Inception Module (named Simple DeepSym-3D-CNN). The aim is to clarify the role of Inception Module. To know the subtraction layer’s effect with L-2 normalization, we have investigated the third model where the L-2 normalization is replaced by L-1 normalization (named L-1 DeepSym-3D-CNN).
Additionally, we have conducted two comparative experiments in which ADC and the combination of DWI and ADC images are used as the input of DeepSym-3D-CNN. The resulting two models are named DeepSym-3D-CNNADC and DeepSym-3D-CNNDWI - ADC, respectively. The combination of DWI and ADC images has a dimension of 512×256×14 and is obtained by splicing DWI images (256×256×14) and ADC images (256×256×14). DeepSym-3D-CNNDWI - ADC has the same network architecture and the training process as DeepSym-3D-CNNDWI. Only the inputs of these two models are different. The aim is to determine whether ADC and the combination of DWI and ADC images improve the performance of DeepSym-3D-CNN.
Model train, test, and evaluation
The five-fold cross-validation evaluates the performance of DeepSym-3D-CNN and the other five comparative models. The data are split into five subsets: three subsets are used for the training, one subset is for validation, and the final one is for the test.
The ROC curves and confusion matrix are plotted to quantitatively evaluate the predictive performance. The measures of precision, recall, F1-score, and accuracy are also calculated.
All experiments are implemented with one computer with the following setting: processor, Inter (R) Core (TM) i7-8700K@3.70GHZ; memory (RAM) 32.0GB; discrete graphics card, GeForce GTX 1080 Ti; system type, Windows 10 Home Edition; development tools, Python and MXNET framework.
Performance of the DeepSym-3D-CNN
With the gradual increase of epoch, the value of training loss gradually decreases from the initial 1.4 to 0.1, proving that the model is gradually converging (Fig. 3(a)). We set the maximum batch size as 4 to reduce the oscillation amplitude of the loss. When the epoch was equal to 60, the loss tended to 0, and the training was completed. The loss of validation could drop to 0.3 while the epoch number was 60 and kept constant with a further increase in epoch number.
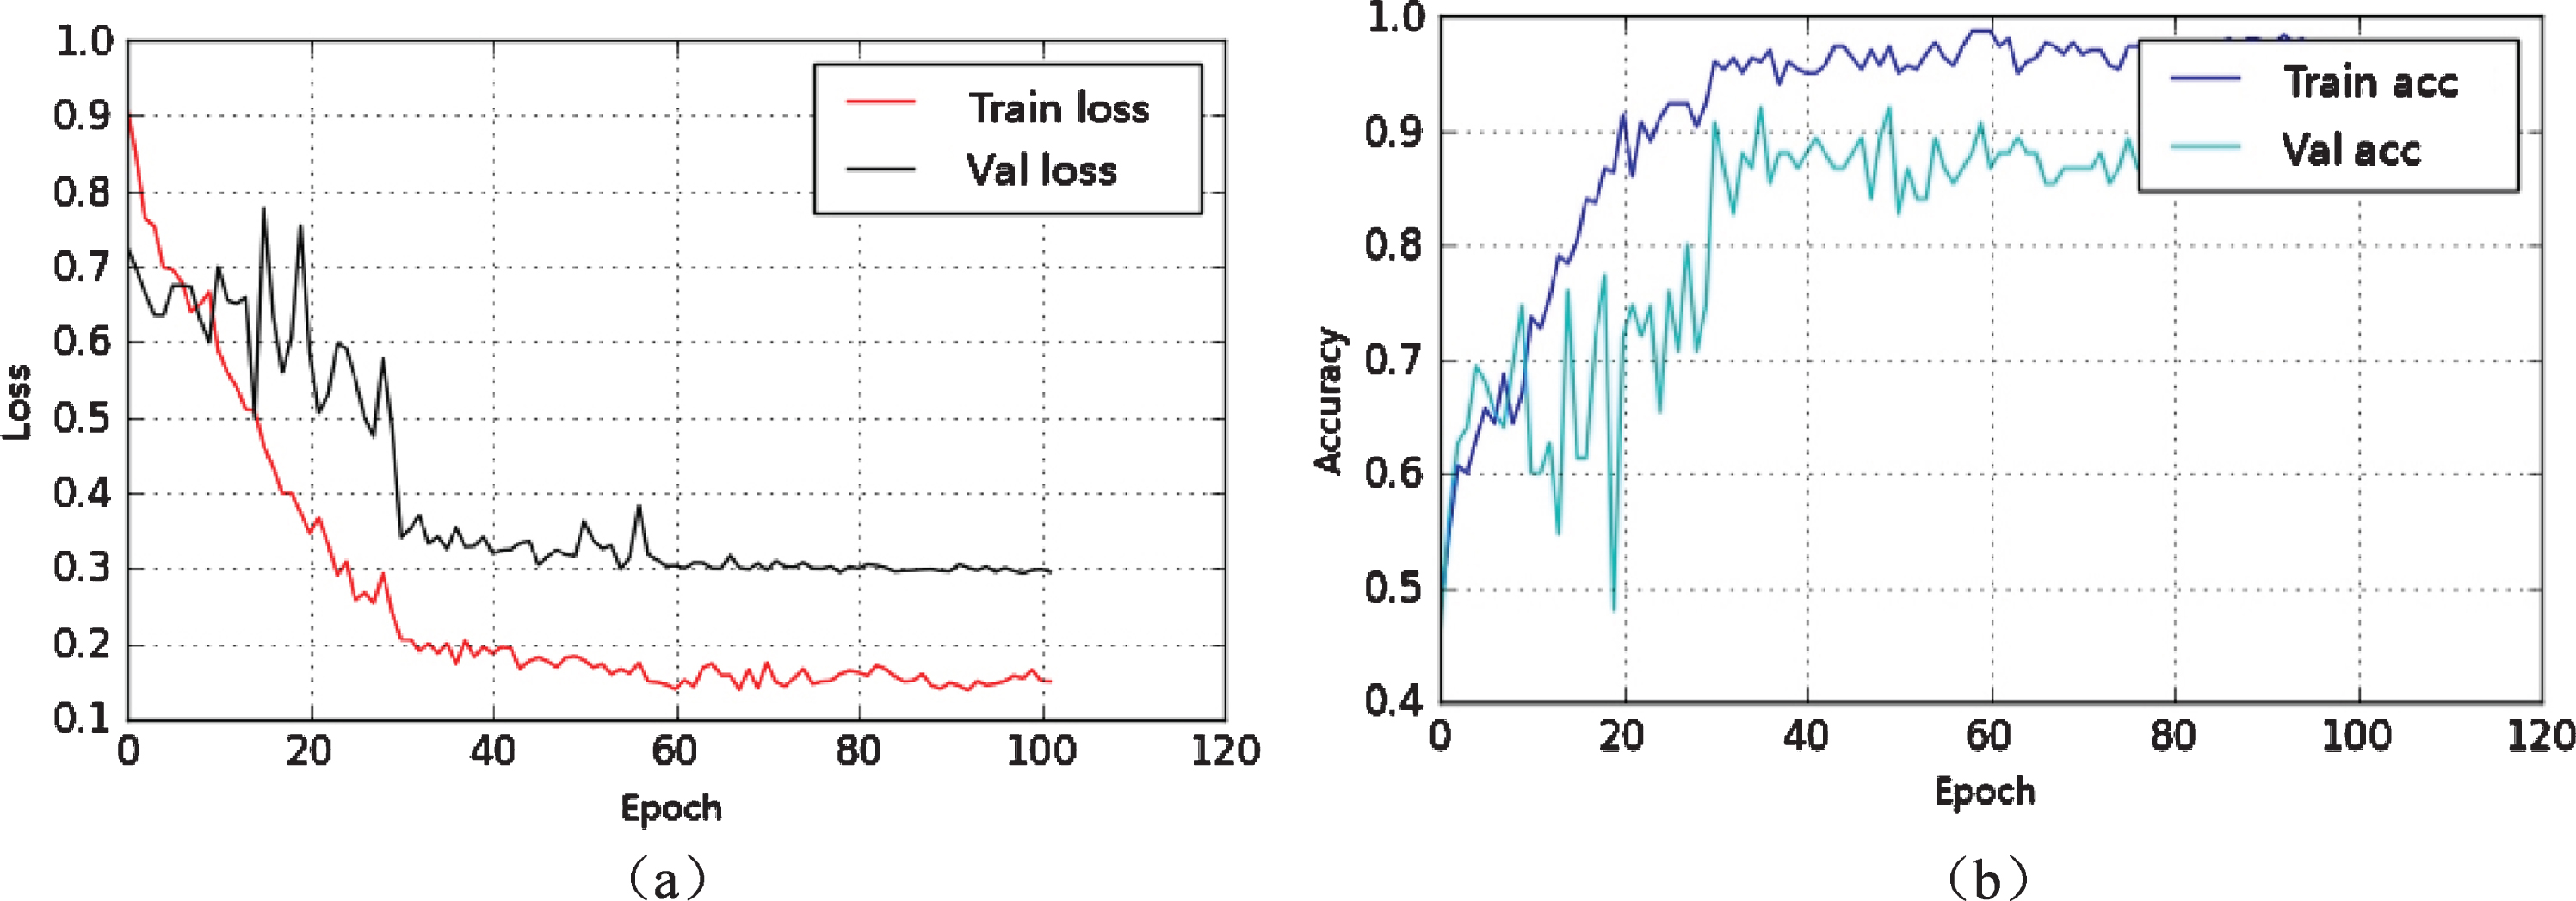
The loss and accuracy curves with epoch for the training and validation. (a) The loss curves; (b) The accuracy curves.
Figure 3(b) represents the curve of the training and validation accuracy of one-fold with the epoch. The training accuracy rose from 0.5 to 1 at 40 epochs, while the validation accuracy rose from 0.5 to 0.9, where finally, the curve stabilized. The over-fitting and under-fitting were not significant.
In Fig. 4(a) and Table 2, we found that our DeepSym-3D-CNN achieved an accuracy of 0.850, a sensitivity of 0.854, a specificity of 0.842, an F1-score of 0.864, and an AUC of 0.863. In Fig. 4(b), 84 AIS patients are correctly identified by the DeepSym-3D-CNN model, but 13 are misidentified. Among 93 Non-AIS patients, 78 are correctly diagnosed, but 15 are wrongly diagnosed as AIS. It is also noted that DeepSym-3D-CNN can recognize the subjects with or without AIS from DWI images. However, it cannot segment AIS regions currently.
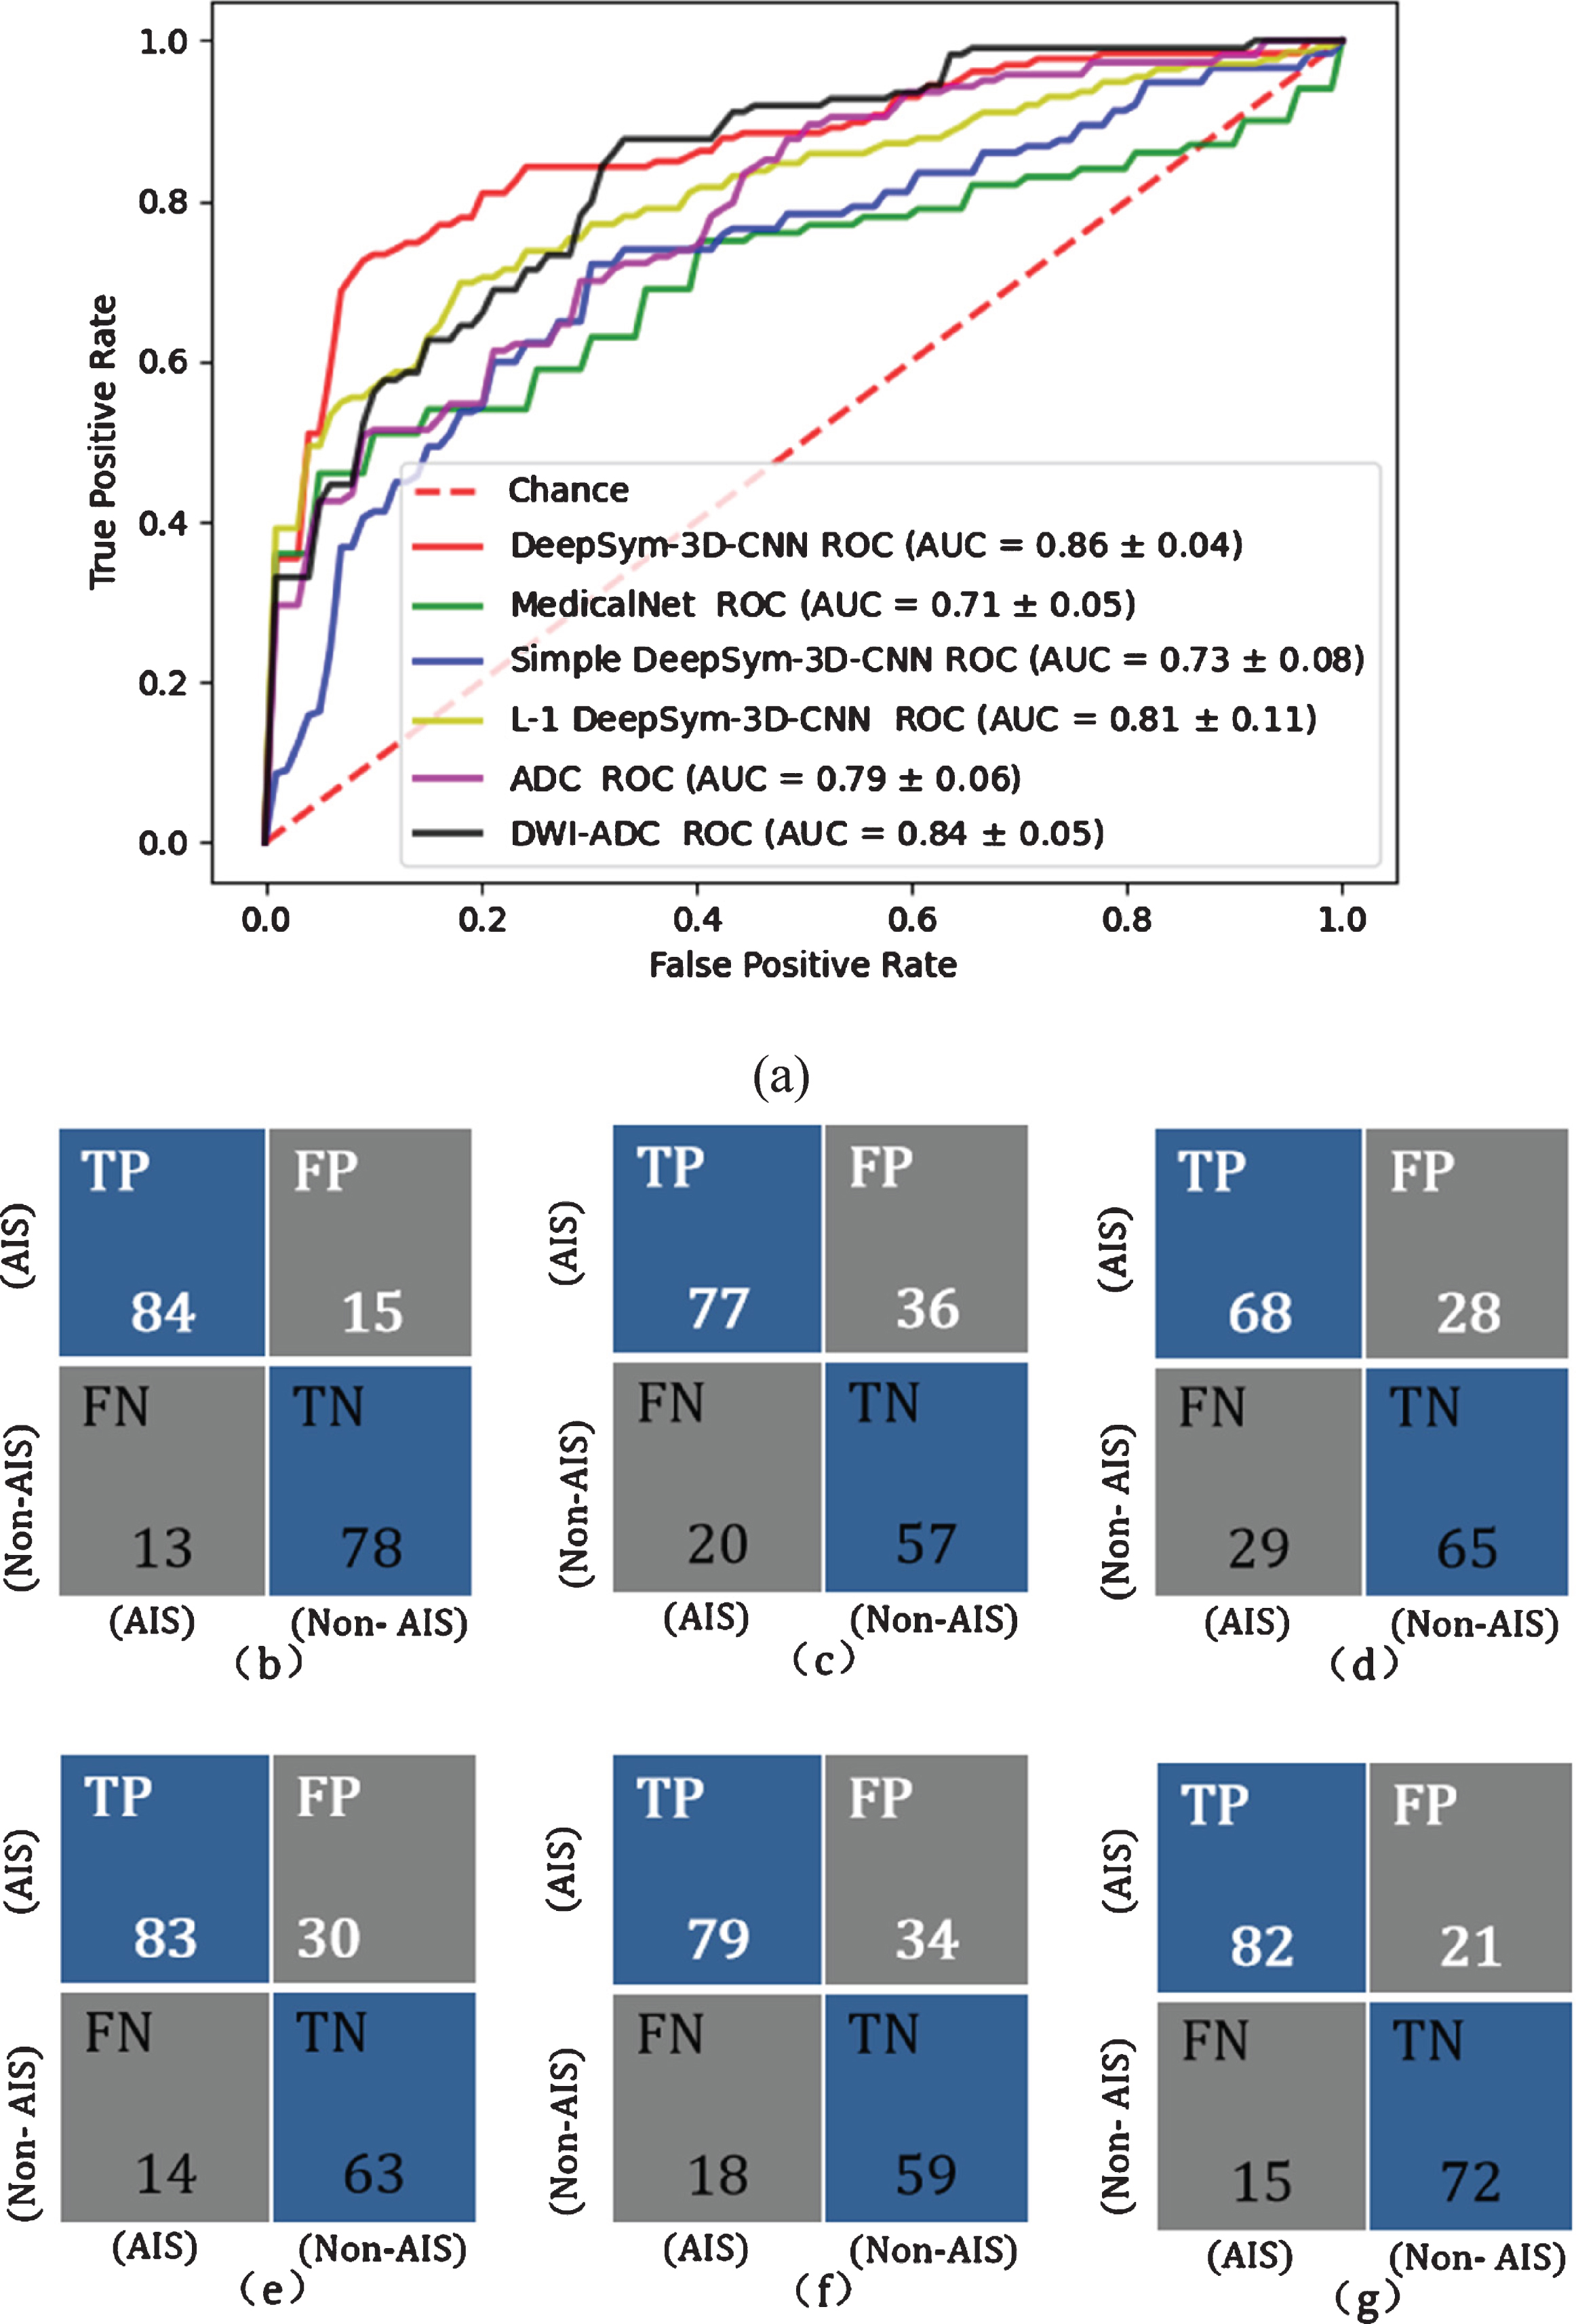
The performance of DeepSym-3D-CNN and five comparative models. (a) The ROC curves and AUC; (b) The confusion matrix of DeepSym-3D-CNN; (c) The confusion matrix of MedicalNet with transfer learning; (d) The confusion matrix of Simple DeepSym-3D-CNN; (e) The confusion matrix of L-1 DeepSym-3D-CNN; (f) The confusion matrix of DeepSym-3D-CNN using ADC images; (g) The confusion matrix of DeepSym-3D-CNN using DWI-ADC images.
As shown in Table 2 and Fig. 4, our DeepSym-3D-CNN model outperforms the three comparative models using DWI images: MedicalNet with transfer learning, Simple DeepSym-3D-CNN (each 3D Inception Module is replaced by a simple 3D-CNN layer), and L-1 DeepSym-3D-CNN (L-2 normalization is replaced by L-1 normalization). DeLong’s test of AUC values demonstrates that DeepSym-3D-CNN significantly outperforms the three comparative models (p < 0.05).
The performance of different models on the same data set
The performance of different models on the same data set
*p value of comparing AUC values between DeepSym-3D-CNN and the comparative model (DeLong’s test, p < 0.05 indicates the significant difference). The Bold indicates that DeepSym-3D-CNN has the highest AUC.
MedicalNet with transfer learning, Simple DeepSym-3D-CNN, and L-1 DeepSym-3D-CNN have an AUC of 0.714, 0.731, and 0.824, respectively. MedicalNet with transfer learning has an accuracy of 0.710, a sensitivity of 0.690, a specificity of 0.761, and an F1-score of 0.738 (Table 2). All the performance parameters are lower than DeepSym-3D-CNN. There are two possible reasons for this; first, DeepSym-3D-CNN can highlight the asymmetric lesion information; however, MedicalNet treats the brain as a whole volume. Second, our dataset might be too small to train the MedicalNet fully though the transfer learning is adopted.
Simple DeepSym-3D-CNN can have an accuracy of 0.732, a sensitivity of 0.794, a specificity of 0.662, and an F1-score of 0.710. It is superior to MedicalNet but inferior to DeepSym-3D-CNN and further indicates that Inception Module has the advantage of gathering information on a multi-scale.
L-1 DeepSym-3D-CNN can have an accuracy of 0.810, a sensitivity of 0.783, a specificity of 0.834, and an F1-score of 0.826. It is superior to Simple DeepSym-3D-CNN but inferior to DeepSym-3D-CNN. This result demonstrates that the subtraction layer with L-2 normalization is better than that with L-1 normalization.
As given in Table 2, DeepSym-3D-CNN using DWI images presents the significant higher AUC than that either using ADC images or using DWI-ADC images (DeLong’s test, p < 0.05). DeepSym-3D-CNNADC achieves an accuracy of 0.730, a sensitivity of 0.709, specificity of 0.756, and an F1-score of 0.701 (Table 2). DeepSym-3D-CNNDWI - ADC has an accuracy of 0.811, a sensitivity of 0.845, a specificity of 0.774, and an F1-score of 0.820. DeepSym-3D-CNNDWI - ADC is superior to DeepSym-3D-CNNADC but inferior DeepSym-3D-CNN using DWI images. The AUC of DeepSym-3D-CNNADC and DeepSym-3D-CNNDWI - ADC is 0.796 and 0.843 (Fig. 4(a)).
Discussion
In this article, we have proposedDeepSym-3D-CNN to identify acute ischemic stroke via DWI. DeepSym-3D-CNN consists of two paths of Inception Modules, subtraction layer with L-2 normalization, convolutional layers, and fully connected layers. The model can finally achieve an AUC of 0.86 and outperform the five comparative models. Finally, the feature maps before and after the subtraction layer with L-2 normalization are visualized.
The main contributions of our work include the design of a DeepSym-3D-CNN that outperforms the three comparative models. This is a potential method for automatic or computer-aided AIS diagnosis using DWI images. DeepSym-3D-CNN can provide the second option to the neuro-radiologist and help improve the diagnostic performance of AIS [5, 39]. This method might be extended to other diseases using small imaging datasets and asymmetric lesions. Second, the feature maps from two paths and their subtraction have been drawn, and the match between the highlighted regions in feature maps and stroke lesions in DWI images is presented, making an end-to-end deep learning model of reasonable visual interpretations.
Key modules of DeepSym-3D-CNN - origins of exceptional performance
DeepSym-3D-CNN outperforms MedicalNet with transfer learning, Simple DeepSym-3D-CNN, and L-1 DeepSym-3D-CNN for AIS prediction in our dataset. Three comparative experiments demonstrated the advantages of three critical modules of DeepSym-3D-CNN, which are considered to be the origin of exceptional performance. The comparison of DeepSym-3D-CNN with MedicalNet indicates the importance of the subtraction of two paths. The possible reasons for the greater performance of DeepSym-3D-CNN are two aspects. First, DeepSym-3D-CNN can highlight the asymmetric lesion information; however, MedicalNet treats the brain as a whole volume. Second, our dataset might be too small to fully train the MedicalNet though transfer learning is adopted.
The second comparative experiment has shown the advantages of Inception Modules. Compared with the traditional convolutional modules, Inception Module has the advantage of gathering multi-scale information, and these findings are similar to previous studies.
The last comparative experiment has shown that L-2 normalization is more suitable for our network. Compared with L-1 normalization, it accelerates the DeepSym-3D-CNN network gradient descent speed to find the optimal solution.
In our study, a small dataset of 456 image cases (including augmented data) is used to train DeepSym-3D-CNN. As shown in Fig. 3, the difference of loss and accuracy between the training and validation is available but not so big, indicating that the overfitting might be acceptable. The reason why 456 images cases are good enough to train DeepSym-3D-CNN with so many weights might be the special architecture. DeepSym-3D-CNN is a variant of Siamese neural network [40]. Unlike the traditional deep CNN models which learn to classify its inputs, Siamese neural network aims to learn the dissimilarity between two inputs. Siamese neural network has been used for one-shot learning and few-shot learning [40, 41]. In two examples using Siamese neural network, the number of image cases is 217 for the study of automated detection of ischemic stroke from CT Angiography and 632 for the three-category classification of neurodegenerative progression [28, 31].
Visualization of feature maps
To observe the characteristics of AIS lesions more intuitively, we have visualized the feature maps before and after the subtraction layer with L-2 normalization. In Fig. 5(a), as one example of the tenth layer of one AIS patient, the first row is the set of DWI images of the left and right hemispheres and their difference. The first and second images in the second row are the feature maps of the left and right hemispheres before the subtraction layer. The third one in the second row indicates the feature map after the subtraction layer.
It can also see that the AIS lesion indicated by the arrow has been highlighted. On the right side of Fig. 5(b), there are the feature maps from all 12 different channels (after 12 different kernels), which extract different features. The asymmetric AIS lesion has been highlighted by 6 convolutional kernels (e.g., the kernels in the 1st row and 3rd column, the kernels in the 2nd row and 2nd to 4th columns, the kernels in the 3rd row and 1st and 4th columns). These highlights may help the neuro-radiologists do the detection and diagnosis of AIS.
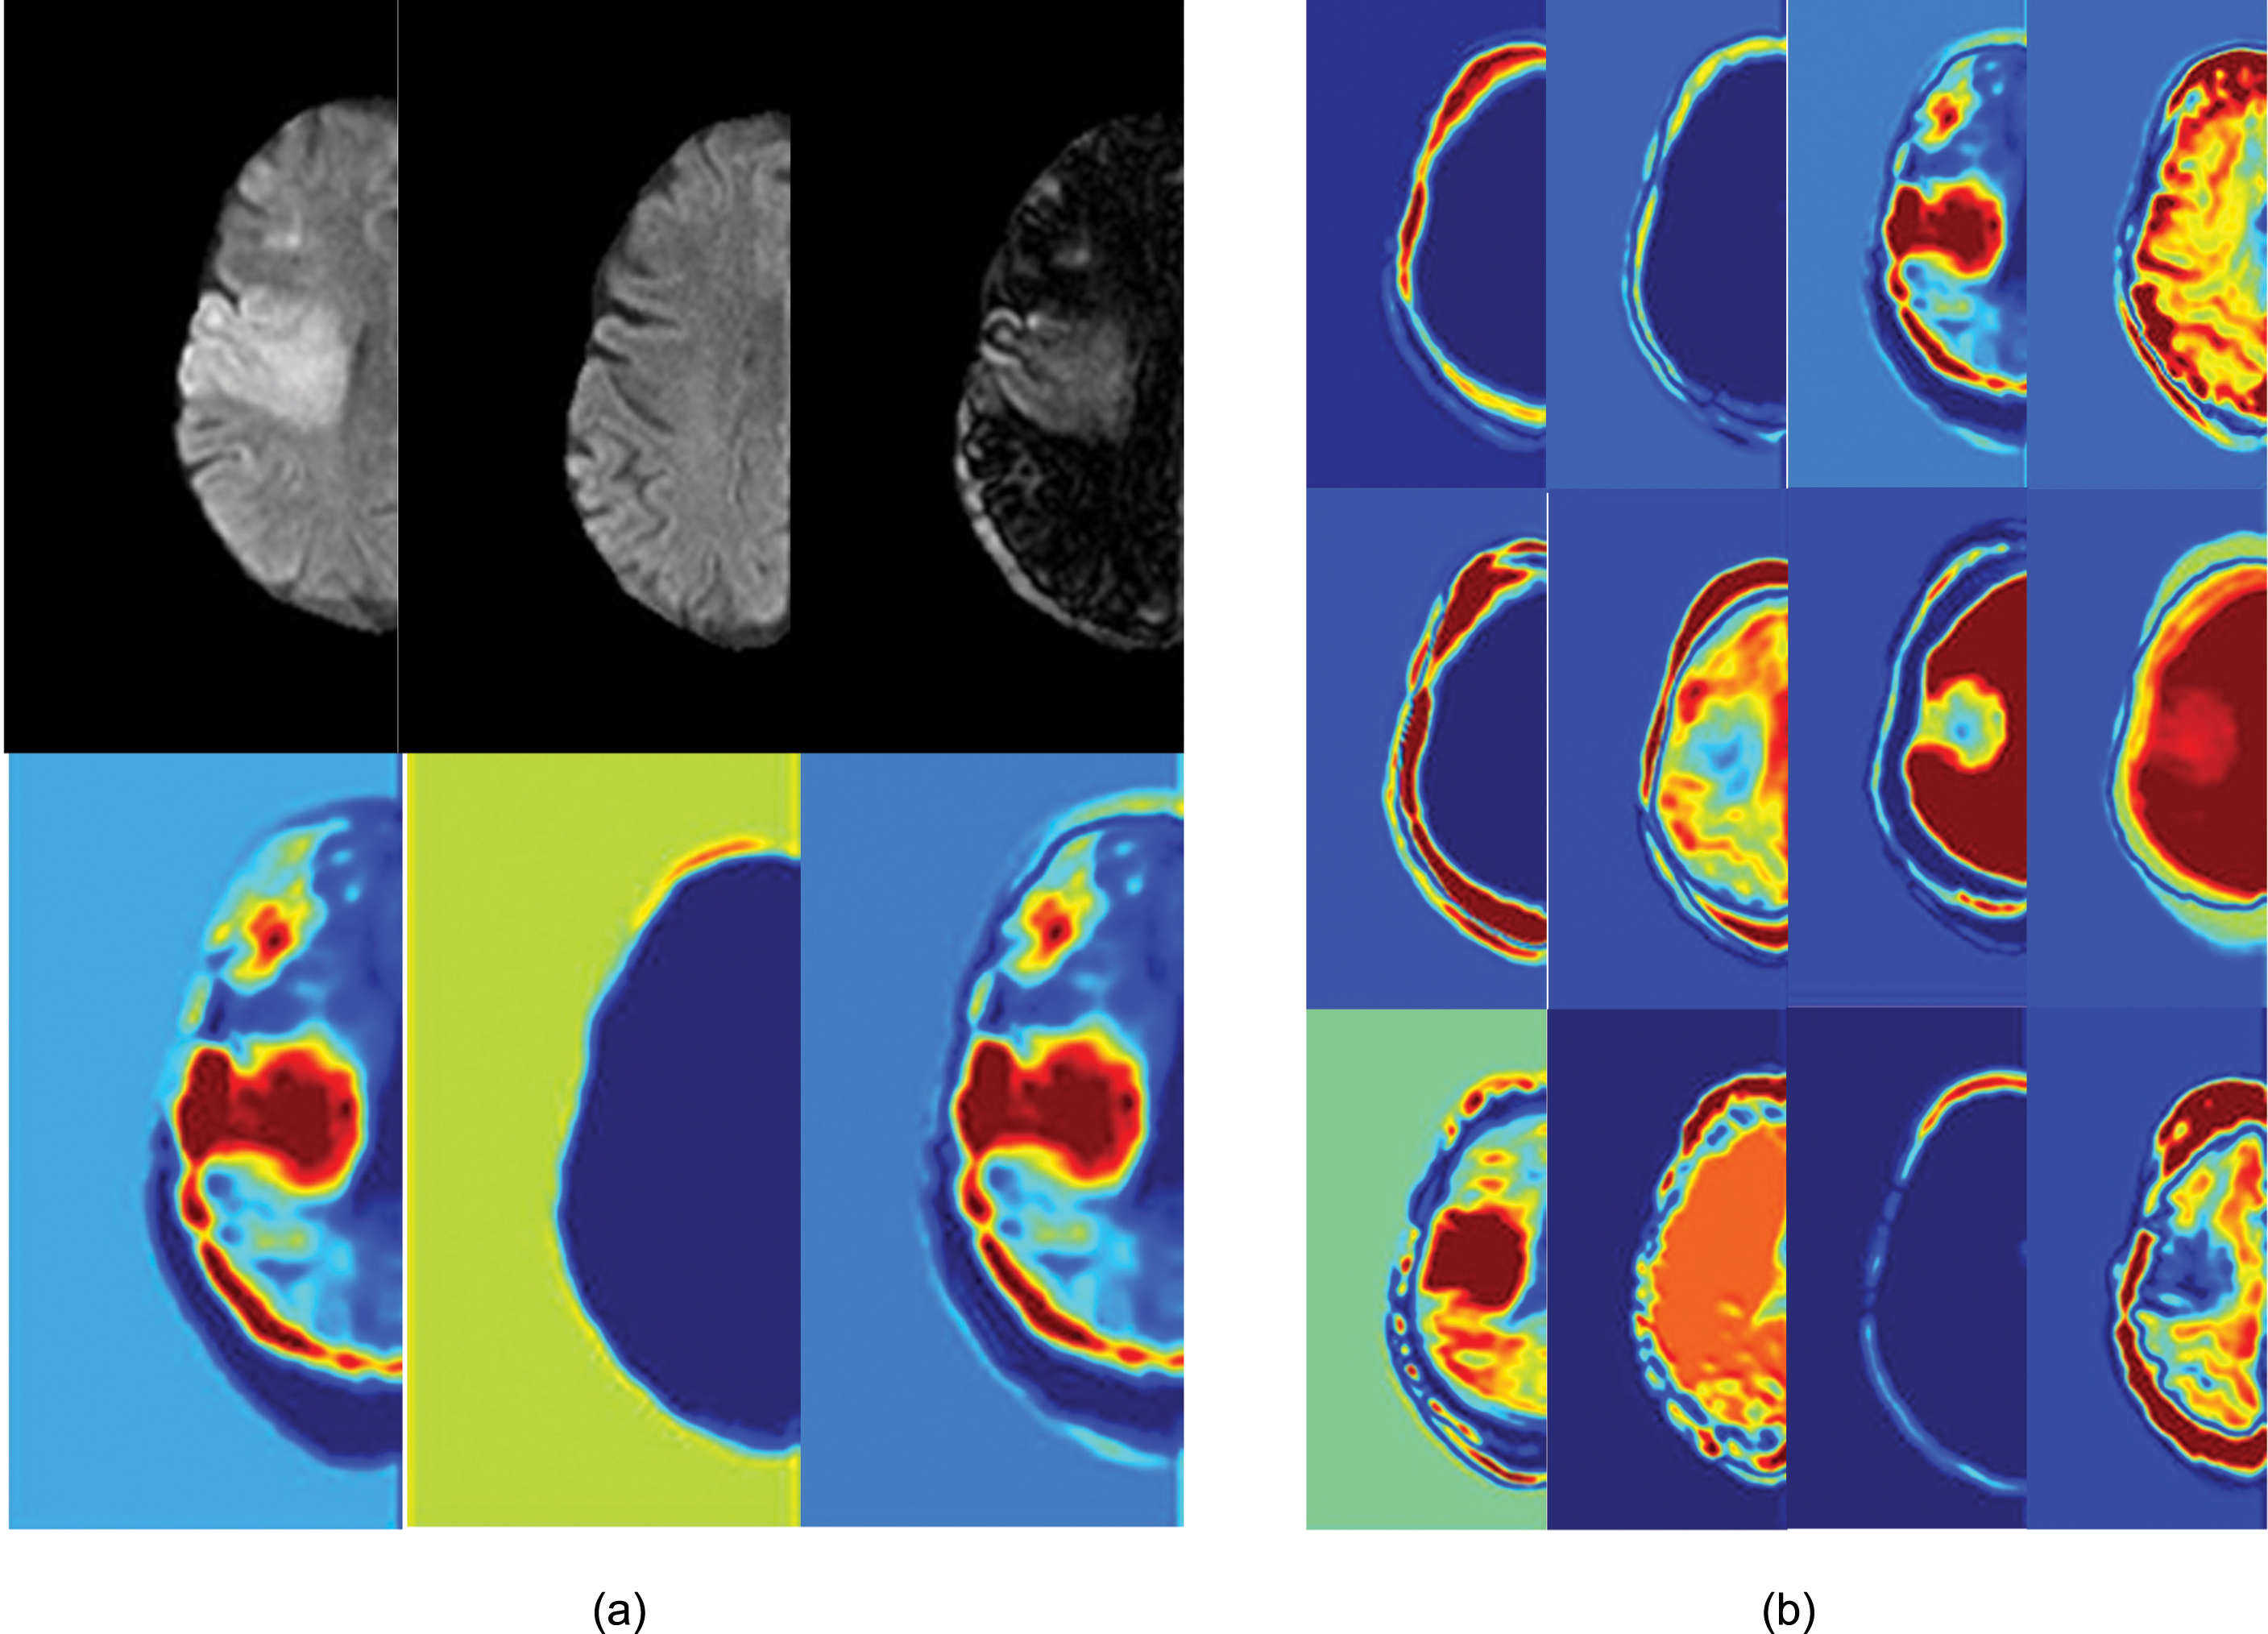
Visualization of feature maps before and after subtraction layer. (a) The original images and the feature maps of one convolutional channel highlight the asymmetric AIS lesion; (b) The feature maps after subtraction layer for all 12 channels.
Clinically, some AIS patients with tiny ischemic lesions cannot be identified using DWI images because of the limit of contrast mechanism or challenges in perception associated with visual inspection by radiologists or neurologists. However, after injection of MRI contrast agent (gadolinium chelates), MRP can show small ischemic lesions. Local cerebral blood volume (CBF), regional cerebral blood flow (CBV), and mean transit time (MTT) can be calculated by analyzing MRP sequences.
Images of a patient with a suspected cerebral infarction are presented in Fig. 6. Using visual inspection of DWI, it is hard for neurologists to judge whether there is a lesion, but our model can determine whether it is an AIS. Using tissue images with a maximum residual function (Tmax) deduced from PWI, the regions with risk of infarction can be detected [42]. Specifically, tissues with Tmax greater than 6 s are considered to be at risk of infarction. In Fig. 6(b), the tissue volume (Tmax > 6 s) is 3.04 ml, and these tissues are considered as the ischemic penumbra, indicating the infarcted regions exist [43, 44]. For this case, our DeepSym-3D-CNN gives the right prediction. MRP analysis labels can give cues for ischemic lesions in DWI, and our DeepSym-3D-CNN can potentially learn these cues.

An example of one patient with a suspected cerebral infarction. (a) DWI and ADC images where the lesion is not obvious; (b) Perfusion-weighted images indicating this patient has the Tmax > 6s tissue of 3.04 ml.
The performance of neuro-radiologists in detection and diagnosis of AIS depends on the neuroimaging modality, the location of AIS, and the duration time between the stroke onset and the imaging acquisition. According to a single-centre, prospective study on the emergency cases of suspected stroke, the sensitivity of MRI (DWI and susceptibility weighted images) is 83% and much higher than that of CT (26%) [10]. For example, the detection rate of ischemic stroke within 3 hours of onset is about 76.9% for DWI and 30.0% for CT [11]. One study has reported that the sensitivity of DWI and PWI for diagnosing AIS can reach 97.5% [14]. Via DWI images, our DeepSym-3D-CNN has achieved an accuracy of 85.0% for the diagnosis of AIS in the collected dataset. The performance of neuro-radiologists is not evaluated in our dataset and will be studied in the future.
There are some similarities between DeepSym-3D-CNN and the Siamese network. The Siamese network also has two paths and a merged layer with the aim of comparing the similarity between the features extracted from the two paths [45]. Usually, the two paths of the Siamese network have identical or shared weights. If the weights in two paths are independent, it is named the pseudo-Siamese network. The pseudo-Siamese network has to learn more parameters and is more flexible than the Siamese network. In our case, the DeepSym-3D-CNN has two paths without shared weights.
Recently Zagoruyko et al. developed a Siamese network for the comparison of image patches [46]. The explicit two-path architecture was replaced by two channels, and the results have demonstrated that information from both patches should be used from the first layer. Therefore, there is a trend that no explicit two-path or comparison (L-1 or L-2) is required, and this prior knowledge can be learned through adjusting the weights. However, there is a prerequisite that there are enough data to train these weights fully. Given that our dataset is relatively small and there are only 190 participants, the two-channel strategy is not considered.
DWI, ADC, or DWI-ADC images
We have found that DeepSym-3D-CNNDWI - ADC is superior to DeepSym-3D-CNNADC but inferior to DeepSym-3D-CNN using DWI images alone. A possible reason for this is that AIS lesions in ADC images present lower intensity than the normal brain parenchyma (such as negative contrast), and DeepSym-3D-CNN is not very sensitive to this decreased voxel intensity. Adding this type of information into the inputs increases the difficulty and decreases the performance when identifying AIS using DeepSym-3D-CNN.
This observation does not agree with the clinical situation. The combination of DWI and ADC images is usually exploited in current clinical diagnosis by radiologists or neuro-radiologists and outperforms methods only using DWI or ADC. This disagreement may arise from the difference between “computer vision” and “human vision”, as well as the small size of the training dataset in our current study.
Limitations and future works
The first limitation of our study is that the dataset is relatively small and derived from one hospital. The small dataset makes the training of networks with larger depth unfeasible, and the model’s generalization ability has not been verified with data from other hospitals. Second, an accuracy of 0.850 for DeepSym-3D-CNN is still not high enough, and more advanced CNN architectures and dedicated preprocessing should be added. Third, the lesion location and volumes cannot be given in our study. Future work will include realizing accurate diagnosis prediction, detecting lesions, automatic segmentation, and further prognosis prediction by different deep learning methods [26, 48].
Conclusions
Our specially designed DeepSym-3D-CNN can be a possible way of automating AIS diagnosis via DWI images. The prediction power may be rooted in the architecture integrating the two paths with Inception Modules, subtraction layer by L-2 normalization, and multi-scale convolutional layers. Visualization of feature maps before and after the subtraction layer has demonstrated that the asymmetric AIS lesion has been highlighted by some convolutional kernels. The developed DeepSym-3D-CNN might be extended to other diseases with the small imaging dataset and asymmetric lesions.
Footnotes
Acknowledgments
This work was financially supported by the National Natural Science Foundation of China under Grant (82072008 to SQ, 81971590 to YL) and the Fundamental Research Funds for the Central Universities (N2024005-2 to SQ), and the Science and Technology Program of Shenyang (20-205-4-044 to YD).
Conflict of interest disclosure
The authors have declared no competing interest.