
Abstract
PURPOSE:
To investigate feasibility of predicting Lauren type of gastric cancer based on CT radiomics nomogram before operation.
MATERIALS AND METHODS:
The clinical data and pre-treatment CT images of 300 gastric cancer patients with Lauren intestinal or diffuse type confirmed by postoperative pathology were retrospectively analyzed, who were randomly divided into training set and testing set with a ratio of 2:1. Clinical features were compared between the two Lauren types in the training set and testing set, respectively. Gastric tumors on CT images were manually segmented using ITK-SNAP software, and radiomic features of the segmented tumors were extracted, filtered and minimized using the least absolute shrinkage and selection operator (LASSO) regression to select optimal features and develop radiomics signature. A nomogram was constructed with radiomic features and clinical characteristics to predict Lauren type of gastric cancer. Clinical model, radiomics signature model, and the nomogram model were compared using the receiver operating characteristic (ROC) curve analysis with area under the curve (AUC). The calibration curve was used to test the agreement between prediction probability and actual clinical findings, and the decision curve was performed to assess the clinical usage of the nomogram model.
RESULTS:
In clinical features, Lauren type of gastric cancer relate to age and CT-N stage of patients (all p < 0.05). Radiomics signature was developed with the retained 10 radiomic features. The nomogram was constructed with the 2 clinical features and radiomics signature. Among 3 prediction models, performance of the nomogram was the best in predicting Lauren type of gastric cancer, with the respective AUC, accuracy, sensitivity and specificity of 0.864, 78.0%, 90.0%, 70.0%in the testing set. In addition, the calibration curve showed a good agreement between prediction probability and actual clinical findings (p > 0.05).
CONCLUSION:
The nomogram combining radiomics signature and clinical features is a useful tool with the increased value to predict Lauren type of gastric cancer.
Introduction
Gastric cancer (GC) is the fifth most common cancer and the third leading cause of cancer-related deaths worldwide [1]. The incidence and mortality rate of gastric cancer have been steadily declining in western countries in recent decades. However, it is still ranked first among malignant tumors of the digestive tract in China [2]. The prognosis of gastric cancer depends on cancer cell differentiation degree, TNM (tumor-node-metastasis) staging, Lauren type and so on. For early GC, radical surgical resection is still recommended as the sole method; for advanced gastric cancer (AGC), the postoperative recurrent rate is as high as 40–50%, the five-year survival rate is still not optimistic because of unreasonable treatment options [3].
Lauren type is one of clinicopathological classification methods in gastric cancer. According to the histomorphology and cell characteristics, Lauren type is classified into intestinal type, diffuse type, and mixed type [4]. A study has shown that the prognosis of GC patients with diffuse type is worse than that of intestinal type, and the postoperative recurrence rate of diffuse type GC is higher than that of intestinal type patients [5]. Another study has also demonstrated that the resection range of diffuse type GC is larger than that of intestinal GC, and the scope of incision for diffuse type is about 8∼10 cm away from the edge of gastric tumor, and these patients often need adjuvant chemotherapy after surgery [6]. Therefore, predicting Lauren type of GC patients accurately before operation is of great significance for clinicians to make proper treatment options and evaluate the prognosis. However, the Lauren type cannot be accurately diagnosed until surgery of the tumor is performed. Although preoperative gastroscopy biopsy can also be performed, its diagnostic accuracy is not satisfactory because of the small number of tissue samples collected by gastroscopy [7].
With the development of computer hardware and the set-up of big database, the newly emerged study on “radiomics” is expected to be the milestone in the development of imaging field [8]. Being different from the traditional megascopic analysis based on experiences, “radiomics” is to extract plenty of quantitative features from images, and to construct signature to characterize the lesion [9, 10]. Currently, the radiomics has been widely used in research of lung cancer [11], liver cancer [12], breast cancer [13], and others. However, because of the impact on the anatomical structure and physiological characteristics of the stomach, research on radiomics of the stomach is still in the exploratory stage and few studies have been published [14–16]. A research of texture analysis based on CT images [17] showed that the entropy in arterial phase and the average attenuation in portal phase could provide important help for the prediction of Lauren type in gastric cancer. However, they didn’t consider clinical factors and didn’t construct the nomogram. Therefore, our aim in this study was to establish a nomogram with visualization and interpretability and quantitatively in predicting Lauren type of gastric cancer before operation.
Materials and methods
Patients
This study was approved by the Institutional Review Board of our hospital, and the informed consent requirement was waved because of retrospective nature. 520 patients with gastric cancer confirmed by postoperative pathology from May 2016 to July 2020 were retrospectively collected. Inclusion criteria: (1) Lauren type of gastric cancer was confirmed by postoperative pathology; (2) Standard abdominal contrast-enhanced CT was performed within one week before operation. Exclusion criteria: (1) Having received any treatment before operation (n = 78); (2) Complicated with other abdominal tumors (n = 25); (3) Incomplete clinical data (n = 20); (4) Severe artifacts on CT images (n = 22), and (5) Lauren mixed type (n = 75). Finally, a total of 300 patients were enrolled in this study and randomly divided into training set and testing set according to the ratio of 2:1. Clinical data of patients were recorded, including age, sex, tumor location, Lauren type, CT-T stage and CT-N stage. CT-T stage and CT-N stage were determined according to the 8th edition of the International Union Against Cancer/American Joint Committee on Cancer (UICC/AJCC) TNM (tumor-node-metastasis) staging system [18].
Image acquisition and segmentation
All patients should fast 8 hours and drink 800∼1000 ml water before CT scanning. Patients were in supine position with the scanning range from the diaphragm to the inferior poles of both kidneys. First, the CT plain scanning was performed by utilizing 64 multi-slice spiral CT machine (Germany, Siemens) with slice thickness and spacing of 5 mm, tube voltage of 120 kV, tube current of 200 mA, matrix of 512×512, and pitch of 0.984:1. Second, 100 ml contract agent ioversol (320 mgI/ml) was injected via an automatic high-pressure syringe with injection speed of 3.0 ml/s. Finally, the arterial and venous-phase enhanced CT images with slice thickness and spacing of 5 mm were obtained when delaying 35 s and 65 s after the injection.
The contrast-enhanced CT images on vein phase including the largest gastric tumor slice were loaded to personal laptop from the picture archiving and communication system (PACS) (Carestream, Canada) and imported into ITK-SNAP software, and gastric tumors were manually segmented by drawing a 2D region of interest (ROI) along the tumor edge (Fig. 1) by two senior radiologists (Reader 1 and Reader 2) with 10 years and 15 years experiences in abdominal CT diagnosis, respectively, who did not know the clinicopathological results. One month later, 40 cases of gastric cancer were randomly selected from 300 cases, and the above segmentation process was repeated by Reader 1 to test the reliability and reproducibility of the segmentation. The segmented images with tumor ROI were exported and stored as DICOM format.

The maps in a 41-year-old man patient with Lauren diffuse type gastric cancer. An axial CT image on the venous phase (a), an irregular mass (arrow) is presented inner the gastric antrum, CT-T stage is T3, and CT-N stage is N2. A pathological image (HE staining, 50×) shows the poorly differentiated adenocarcinoma cells with severe pleomorphism (b). The manual segmentation of gastric tumor in red on the same image as shown in (a) is extracted via ITK-SNAP software (c). HE means hematoxylin and eosin.
These segmented images were resampled with a pixel spacing of 3.0 mm×3.0 mm×3.0 mm before features extraction to ensure the accuracy of pixel size and slice thickness. Subsequently, radiomic features, such as shape and size features, first-order features, texture and wavelet features, were extracted from the segmented image with tumor ROI by the software written using Matlab 2014 (Mathworks, Nafick, MA, USA).
First, the extracted features were preprocessed by replacing the missing values and outliers with the average values. Second, the z-score method was used to standardize large number of radiomic features according to the average and standard deviation parameters of patients in the training set [19]. Intra-class correlation coefficient (ICC) was used to evaluate the agreement of radiomic features for inter-observer and intra-observer. An ICC greater than 0.75 represented a good agreement [20]. Final, the most useful radiomic features were selected by the least absolute shrinkage and selection operator (LASSO) regression with 10-fold cross-validation [21].
Radiomics signature and model building
The linearity combination of radiomic features selected by LASSO and the corresponding weighted coefficient product constructed the radiomics signature. Clinical model for predicting Lauren type of gastric cancer was constructed by univariable logistic regression analysis with the following clinical candidate predictors: age, gender, tumor location, CT-T stage, and CT-N stage. As well, the radiomics signature model was developed with radiomic features with significantly statistical difference, and the nomogram model combining clinical factors and radiomic features was established by using multivariable logistic regression analysis.
Comparison and testing of models
The receiver operating characteristic (ROC) curve was used and the corresponding area under the curve (AUC) was reckoned for the three prediction models in the training set and testing set, respectively. The AUCs were compared by using Delong test between models [22]. The calibration curve was used to verify the agreement between the prediction results of the nomogram and the actual clinical findings, and the decision curve was used to validate the value of the nomogram in clinical practice.
Statistical analysis
All statistical analyses were performed on SPSS 26.0 (SPSS Inc., Chicago, IL, USA), MedCalc version 15.11.4 (MedCalc software, Mariakerke, Belgium), and R software (version 3.5.1; http//www.R-projetc.org). A P-value < 0.05 was set, indicating a statistically significant difference.
Chi-Squared tests were used to compare the difference in categorical variables (age, sex, tumor location, CT-T stage, and CT-N stage), and the statistical analysis of non-parametric test was performed to assess the differences in radiomic features between intestinal and diffuse type patients with gastric cancer. Lasso binary logistic regression was conducted using the “glmnet” package (version 2.0–13) in R software, and the nomogram, calibration curve, and decision curve were made using the “rms” package (version 5.1-2). Diagnosis efficacy was assessed using the receiver operating characteristic (ROC) curve with area under the curve (AUC).
Results
Clinical characteristics
Baseline clinical characteristics for gastric cancer patients in both the training and testing sets were summarized in Table 1. There were no significantly statistical differences in Lauren type, age, sex, tumor location, CT-T stage and CT-N stage between training and testing sets (all P > 0.05). In the univariate analysis based on the training set and testing set, Lauren type of gastric cancer had significant associations with age and CT-N stage (both P < 0.05); While no significant differences were found between intestinal and diffuse type patients in both sets in terms of other clinical characteristics (all P > 0.05) (Table 2). Clinical model was constructed by binary logic regression method based on age and CT-N stage to predict the Lauren type of gastric cancer.
Comparisons of clinical characteristics between training set and testing set in 300 gastric cancer patients
Comparisons of clinical characteristics between training set and testing set in 300 gastric cancer patients
NOTE. Values are numbers of patients with percentages in parentheses. Pearson Chi-Squared tests were used to compare the differences in categorical variables.
Comparisons of clinical characteristics between intestinal type and diffuse type patients with gastric cancer in training set and validation set
NOTE. Values are numbers of patients with percentages in parentheses. Pearson Chi-Squared tests were used to compare the differences in categorical variables. *p value < 0.05.
The ICC of inter-observers (between Reader 1 and Reader 2) was≥0.75, 0.5–0.74, < 0.5 for 85%, 9%and 6%of the radiomic features, respectively. The ICC of intra-observer (between Reader 1 twice) was≥0.75, 0.5–0.74, < 0.5 for 87%, 10%and 3%of the radiomic features, respectively. The results are displayed in Fig. 2.

ICC histogram of inter-observer (between reader 1 and reader 2) and intra-observer (between reader 1 twice), showing that ICC of inter-observer is≥0.75 for 85%and ICC of intra-observer (between reader 1 twice) is≥0.75 for 87%of the radiomic features. X-axis is ICC value; Y-axis is radiomic feature count. ICC means Intra-class correlation coefficient.
A total of 800 radiomic features were initially extracted from the segmented CT images of all gastric tumors. The extracted features were preprocessed and standardized by z-score method and with ICC≥0. 75 as the reliability standard, subsequently 250 features were retained. To reduce dependency and redundancy, we used LASSO in logistic regression model to reduce dimensions of these features, and 10 features were selected to establish the final radiomics signature model (Fig. 3). The Radscore was defined as a score resulted by the regression coefficients of these 10 features multiplied by the value of corresponding feature. The radiomics signature model was constructed by binary logic regression method based on these 10 features to predict the Lauren type of gastric cancer, as follows.
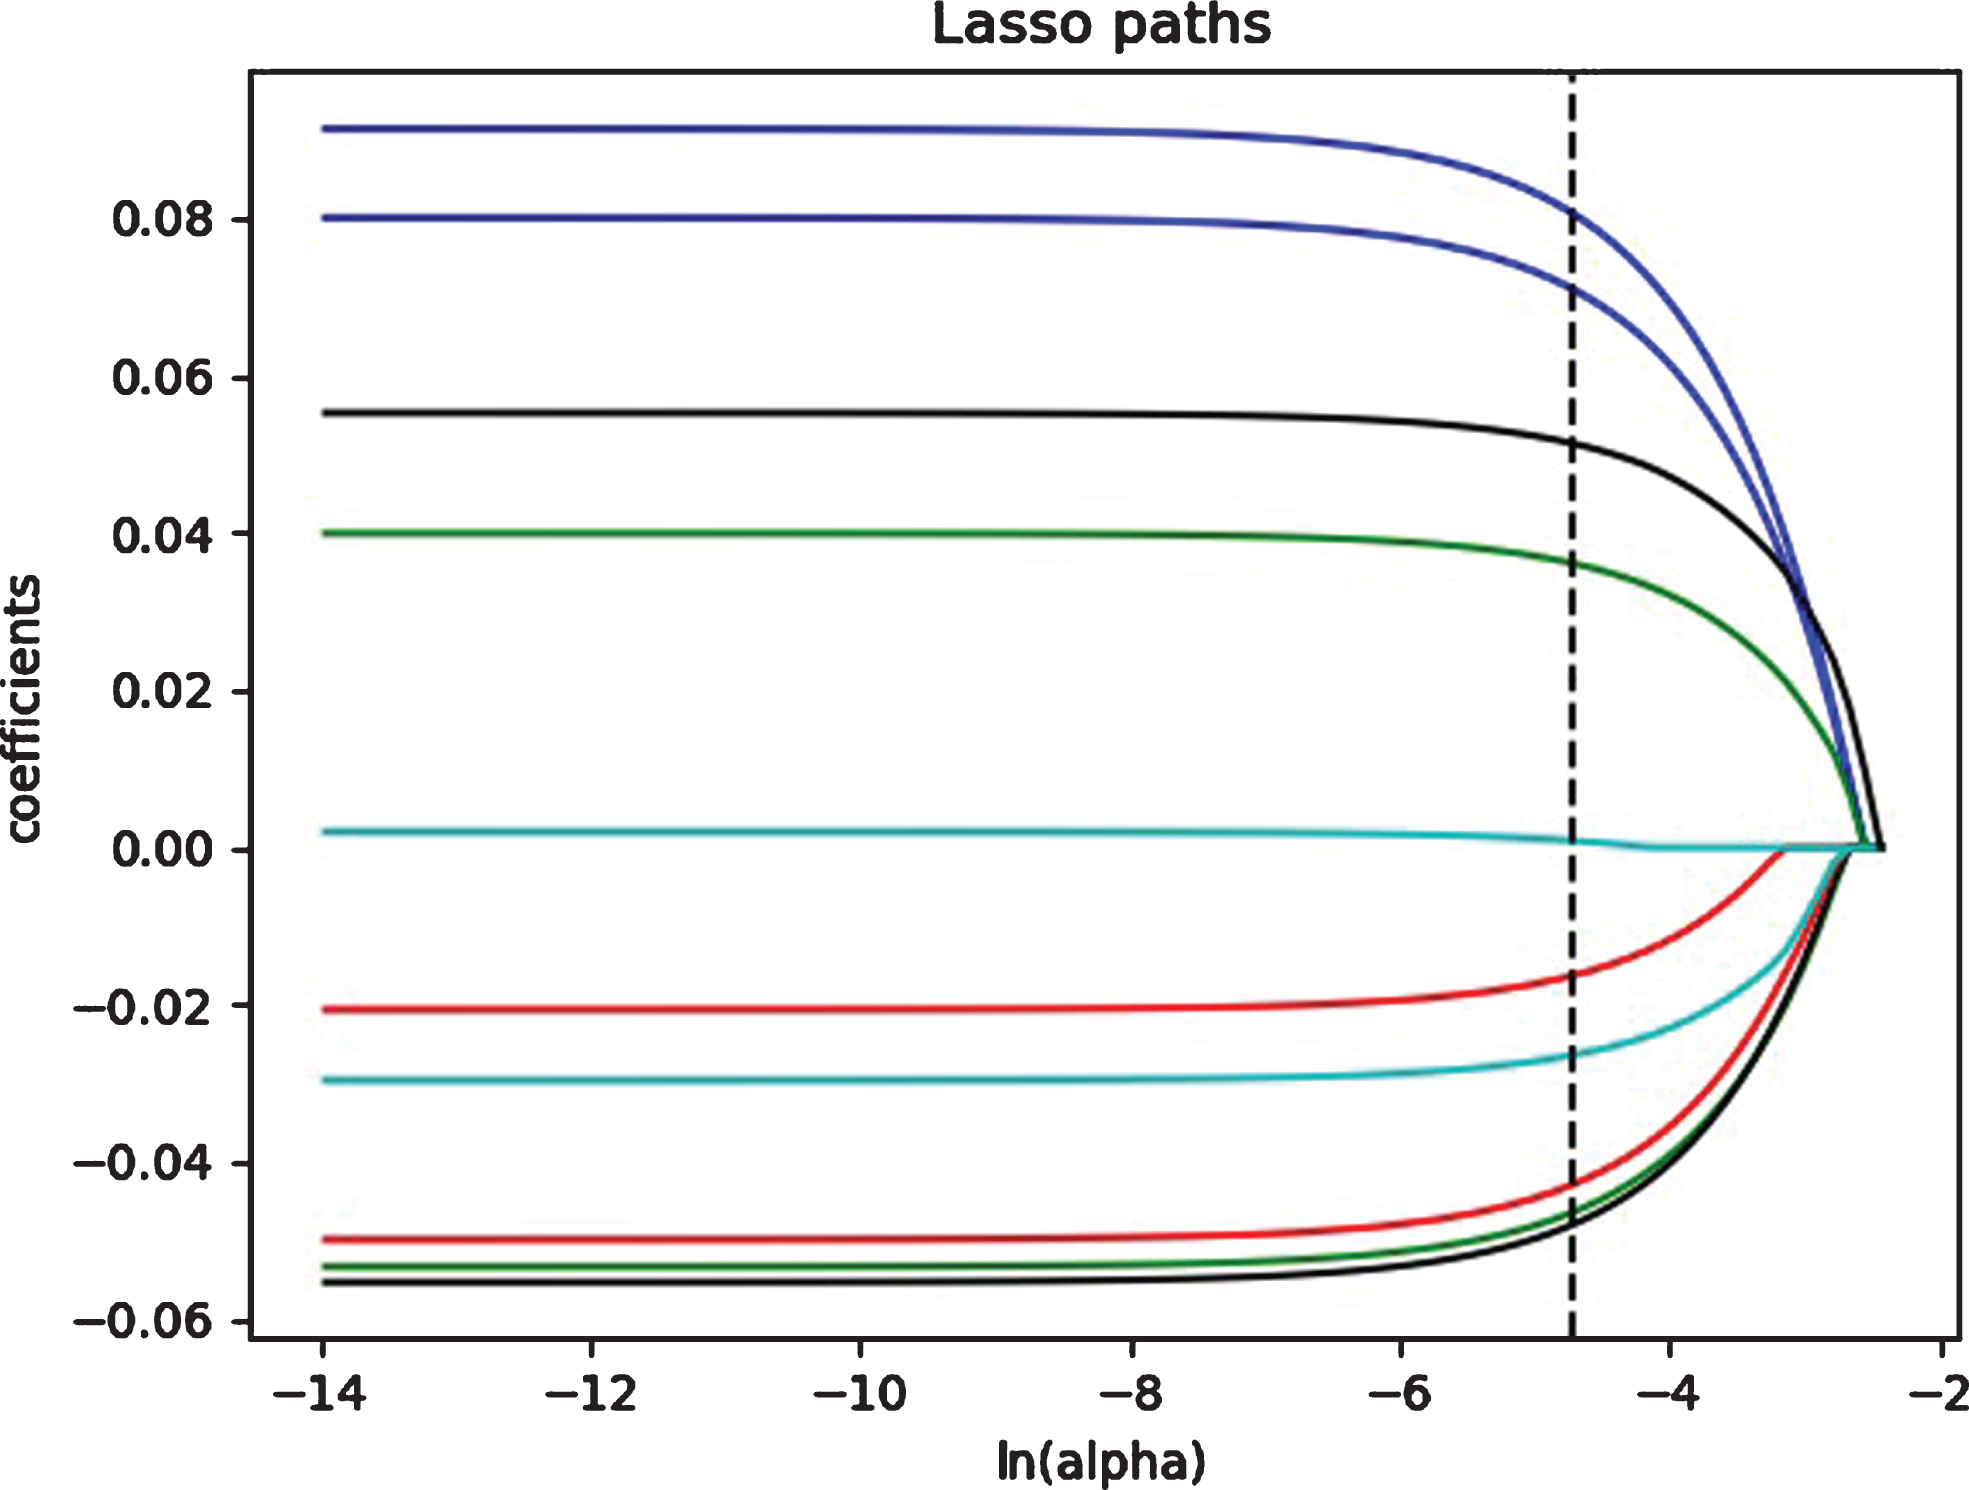
LASSO coefficient profiles of the selected 10 radiomic features with nonzero coefficients. Dotted vertical line is drawn at the value selected using 10-fold cross validation. LASSO means least absolute shrinkage and selection operator.
Rad_score = –0.104 – 0.021×kurtosis 2.5 + 0.002×mean 100 2.5 – 0.027×SD 25 0 + 0.041×homogenity 0 0 + 0.056×contrast 90 1.5 + 0.081×correlation 90 0 + 0.092×energy 135 2 – 0.044×correlation 0 1.5 – 0.051×SD 10 2.5 – 0.053×GLCM.
The nomogram with visualization and interpretability was constructed by using a binary logistic regression analysis to predict the Lauren type of gastric cancer, including two clinical factors (age and CT-N stage) identified by univariate analysis and the radiomics signature (namely radscore) (Fig. 4).
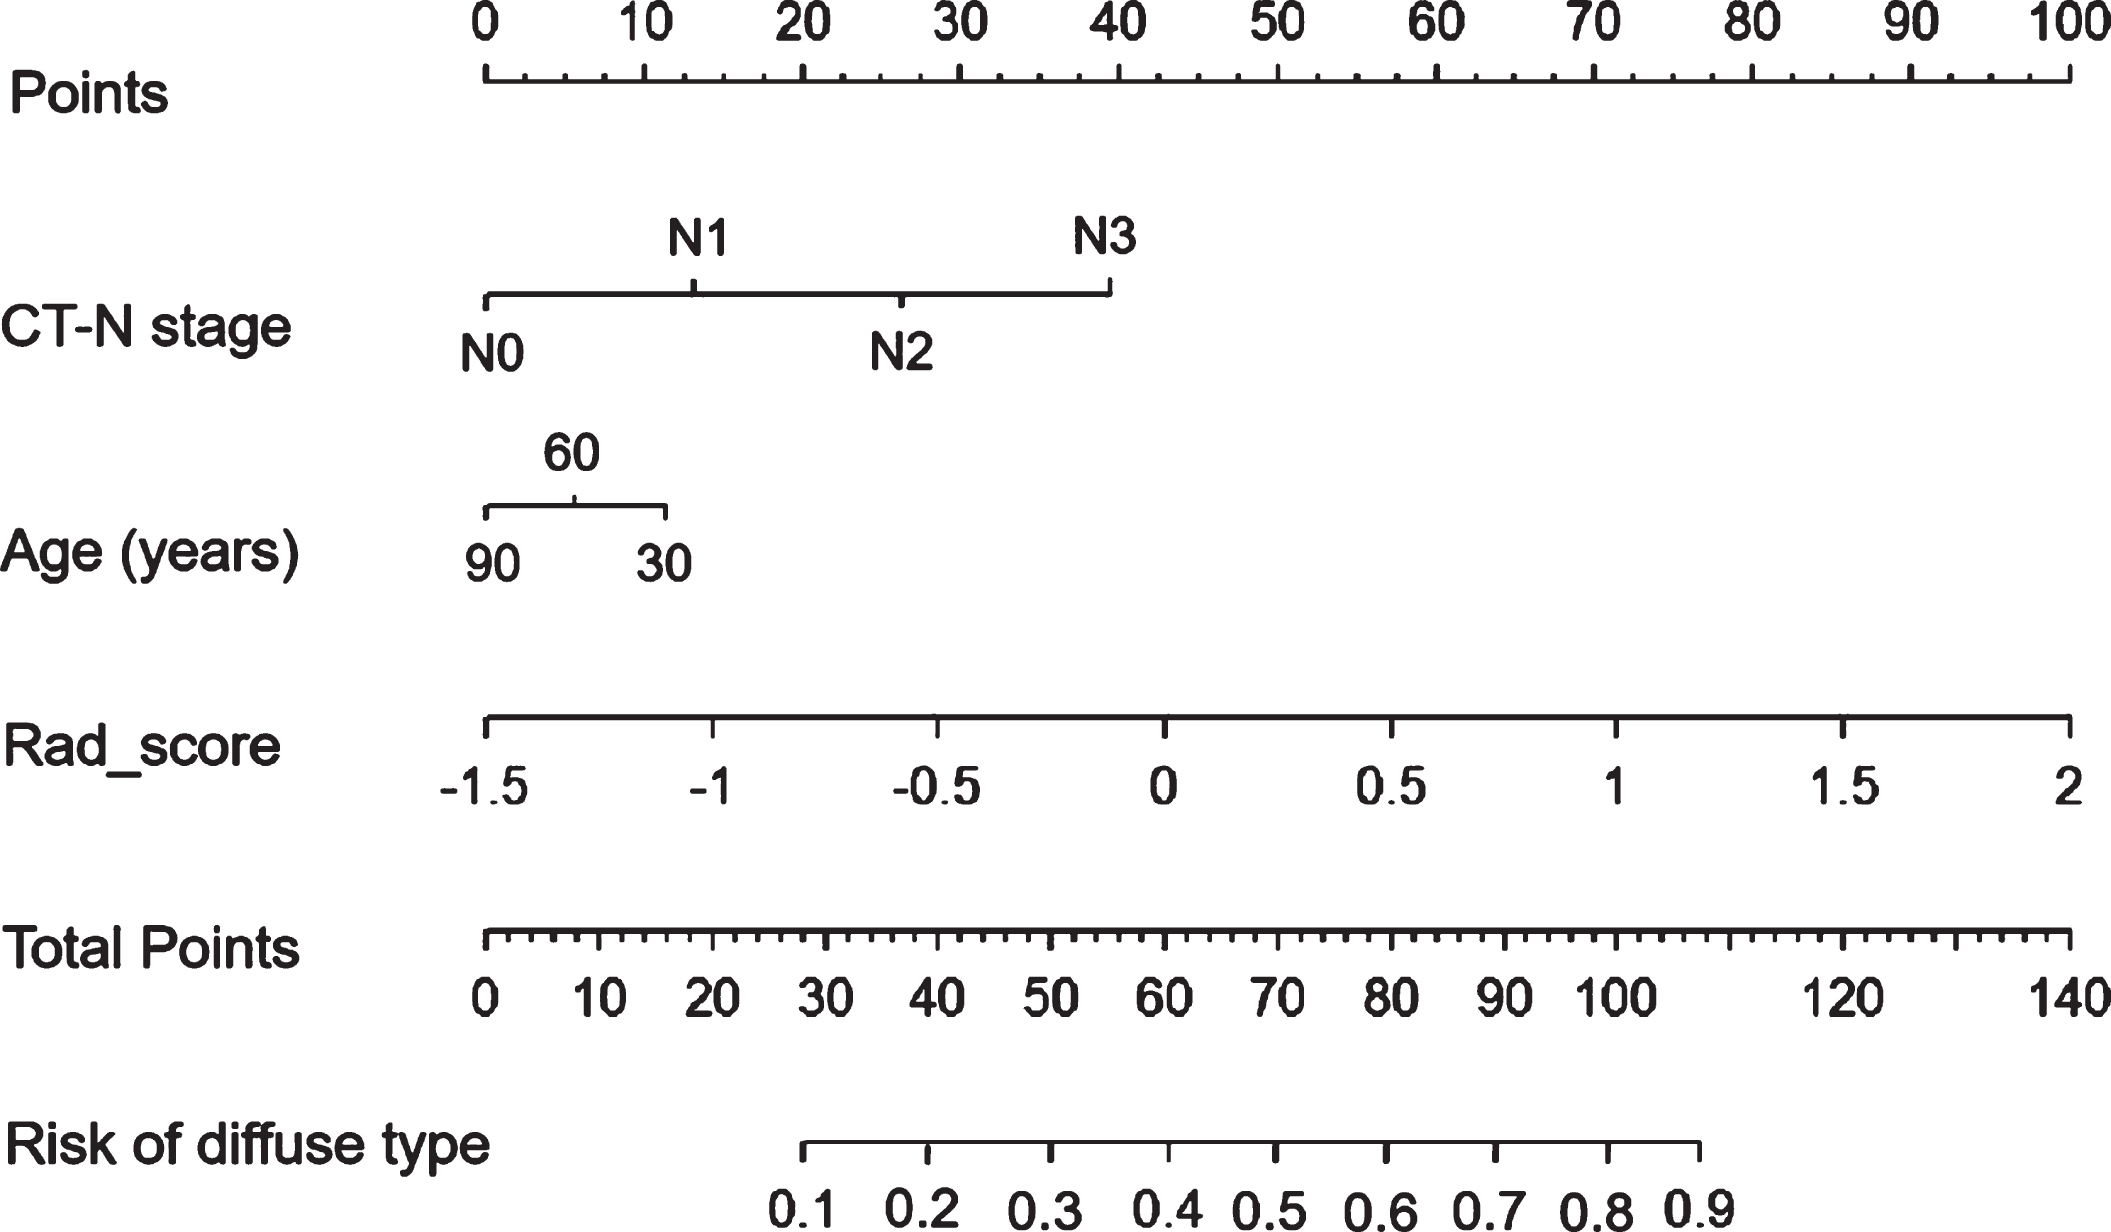
The nomogram with visualization and interpretability, indicating that gastric cancer patients with younger age, advanced CT-N stage, and greater radscore are tended to be predicted as Lauren diffuse type. CT means computed tomography.
The ROC curve was used to evaluate and compare the performance of three predictive models including clinical model, radiomics signature model, and the nomogram model, and the results showed that the nomogram model generated a better performance with an AUC of 0.846 (95%confidence interval [CI], 0.793–0.898) in the training set and 0.864 (95%CI, 0.794–0.934) in the testing set than clinical model or radiomics signature model (Table 3 and Fig. 5).
Performance of three predictive models
Performance of three predictive models
NOTE. Abbreviations: AUC, Area under the curve; CI, Confidence interval; ACC, Accuracy; SEN, Sensitivity; SPE, Specificity.
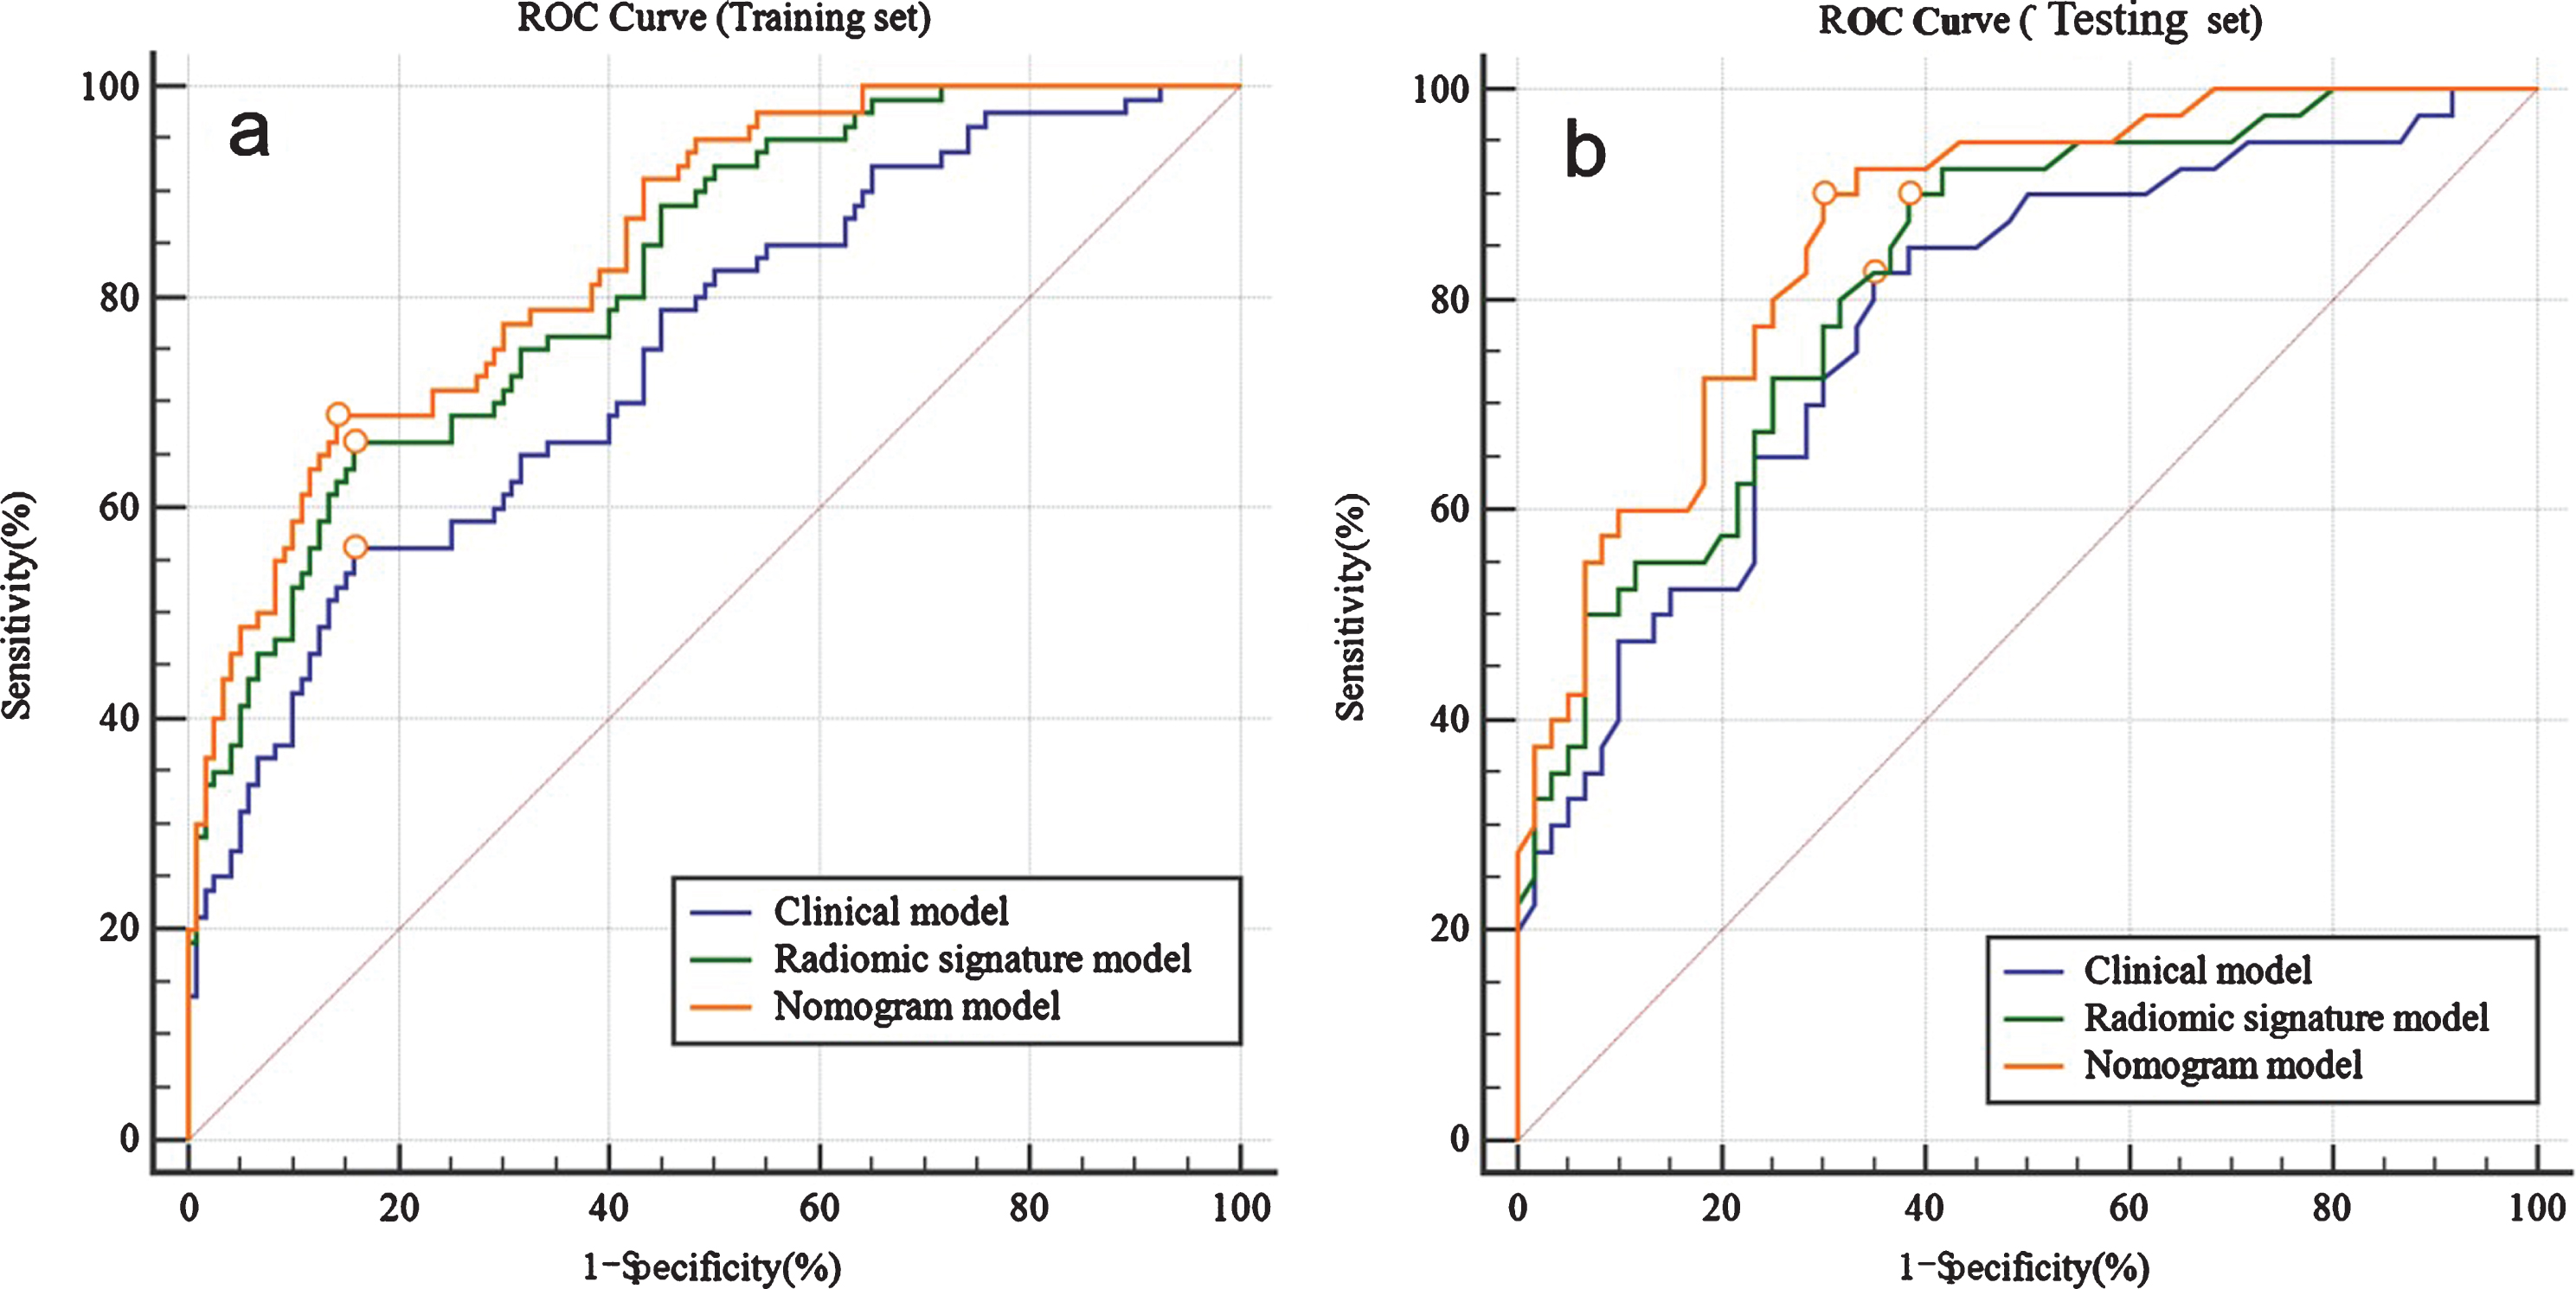
ROC curves in the training set (a) and testing set (b), indicating that classifiers’ performance of nomogram model in predicting Lauren diffuse type of gastric cancer is the best among three models (clinical model, radiomics signature model, and nomogram model). ROC means receiver operating characteristic.
Delong-test results indicated that there were significant differences between predictive performance of clinical model and that of radiomics signature model (AUC = 0.745 vs. 0.819, p = 0.004), and the nomogram model (AUC = 0.745 vs. 0.846, p < 0.001) in the training set. As well, there were significant differences between predictive performance of the nomogram model and that of clinical model (AUC = 0.864 vs. 0.780, p = 0.011), and radiomics signature model (AUC = 0. 864 vs. 0.822, p = 0.020) in the testing set.
The calibration curve of the nomogram model showed a good agreement between prediction probability and actual clinical findings (p > 0.05) (Fig. 6a). The decision curve in the testing set proved that the nomogram model was an useful tool, and indicated that if the threshold probability of a patient was within the whole range of 0.0-1.0, using the nomogram to predict the Lauren type added more net benefit to make the decision of whether to undergo treatment (Fig. 6b).
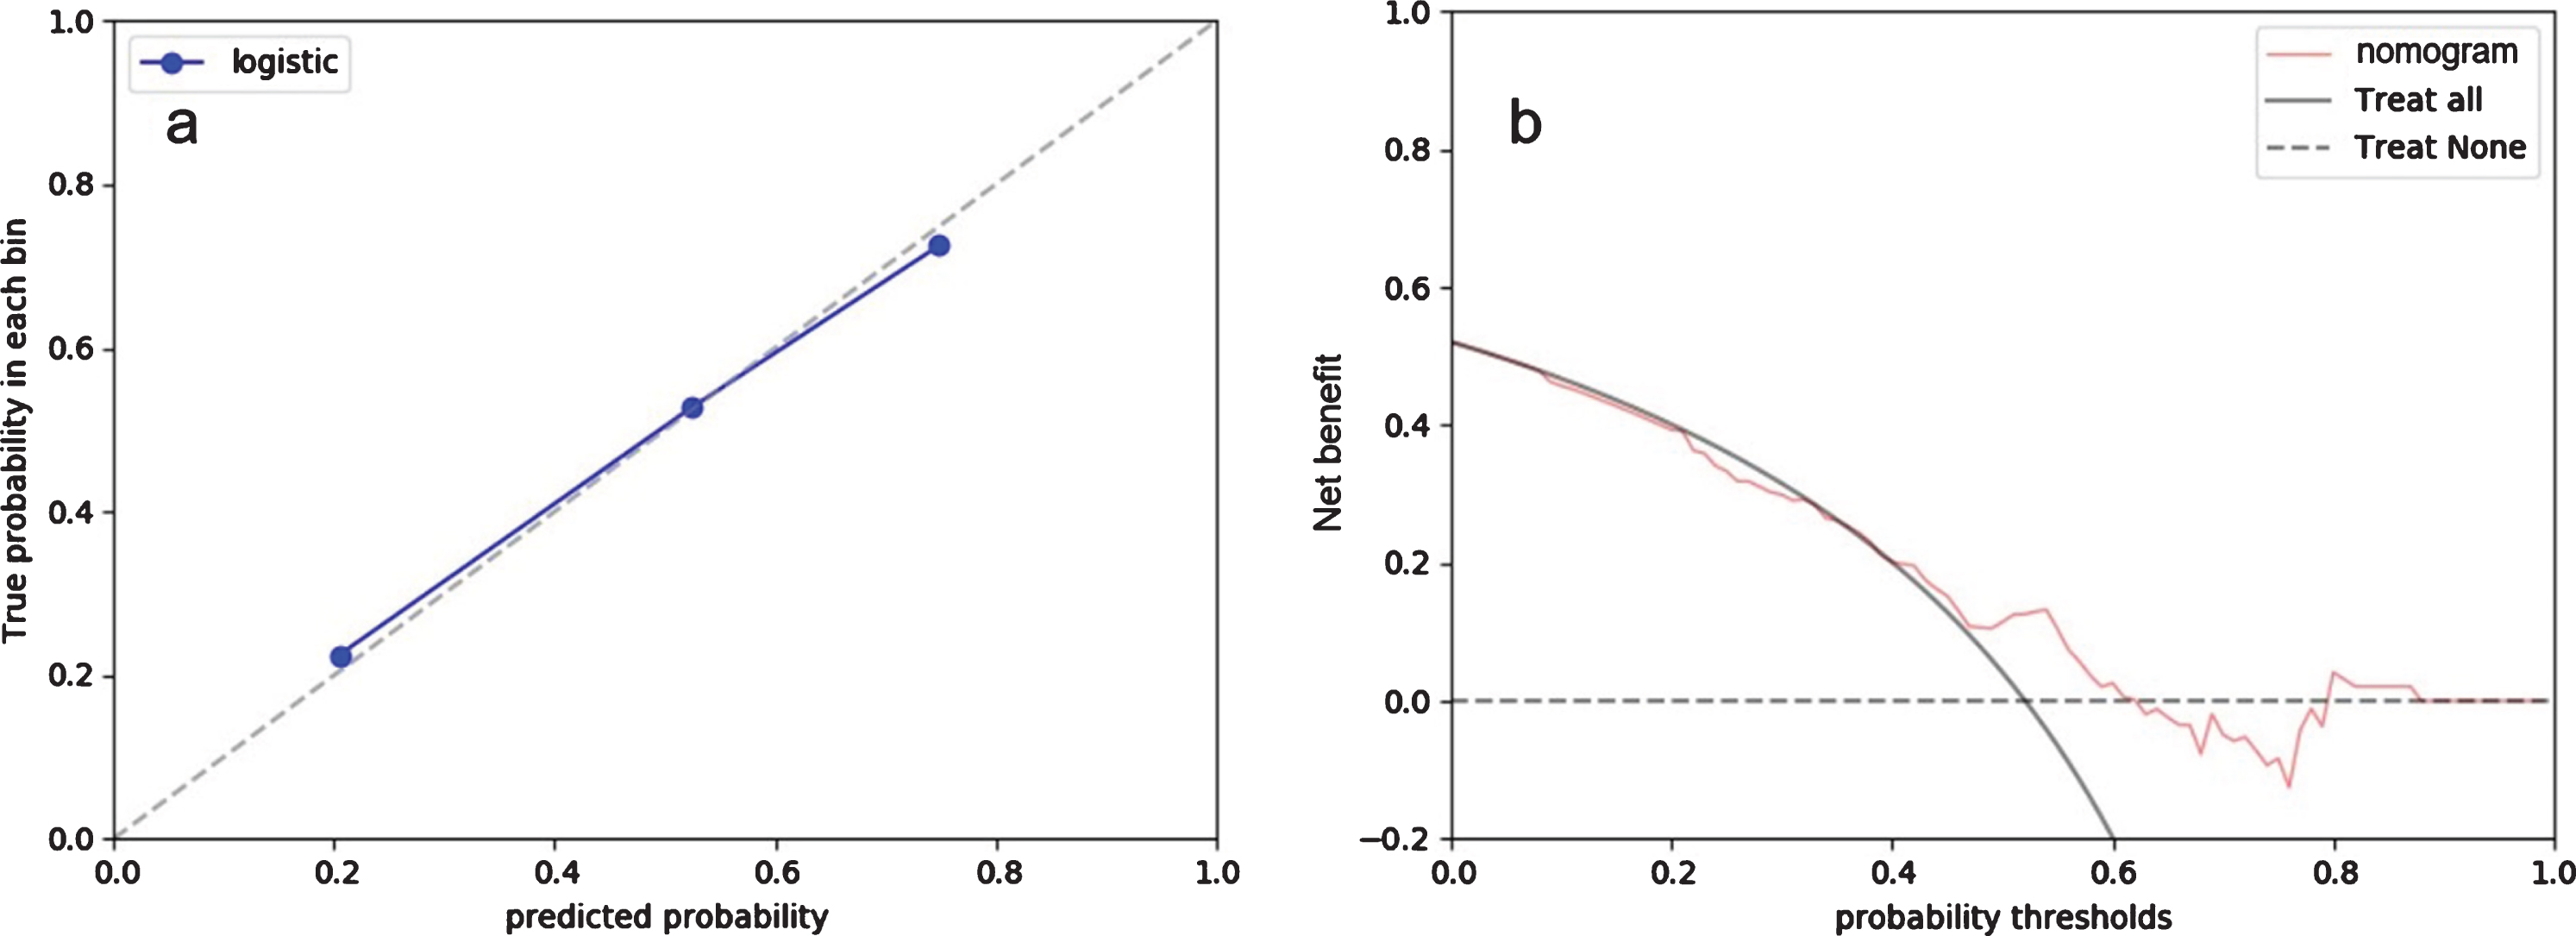
Calibration curve (a) and decision curve analysis (b) for the nomogram in the testing set. In the calibration plot, X-axis is nomogram-predicted probability of diffuse type gastric cancer. Y-axis is true probability of diffuse type gastric cancer. Dotted diagonal line represents an ideal standard curve; solid line represents the prediction calibration curve of the nomogram. A good agreement is observed between nomogram prediction probability and actual clinical findings in this calibration plot (P > 0.05). In the decision curve plot, line for the nomogram represents that all patients are treated as the results by using the nomogram to predict the Lauren type of gastric cancer, and patients obtain net benefit; line for treat all represent that all patients are treated as diffuse type gastric cancer; line for treat none represent that all patients are treated as intestinal type gastric cancer.
In this study, Lauren type of gastric cancer had significant associations with age and CT-N stage in clinical characteristics, and clinical model was constructed by binary logic regression method based on these two clinical features to predict the Lauren type of gastric cancer. In radiomics analysis, a total of 10 radiomic features were selected to establish the radiomics signature model. Finally, we constructed a CT radiomics-based nomogram that incorporated both the radiomics signature and clinical risk factors to identify the Lauren type of gastric cancer prior to operation, which yielded a better performance with an AUC of 0.846 in the training set and 0.864 in the testing set than clinical or radiomics signature model. As well, this study demonstrated that the nomogram with visualization and interpretability was an easy-to-use tool for individualized decision making by quantifying the prediction model.
In clinic, preoperative and accurate identification of Lauren types in gastric cancer has a great influence on the selection of treatment plan. The infiltration of diffuse type gastric cancer often exceeds several centimeters of the visible boundary of tumors. On the contrary, the infiltration range of intestinal type gastric cancer is usually limited. Therefore, diffuse type gastric cancers have a much larger resection scope than intestinal type, and the margin of incision for diffuse type is about 8–10 centimeters away from the edge of gastric tumor [6]. Moreover, diffuse type gastric cancer usually has a worse prognosis compared with intestinal type and needs an adjuvant chemotherapy after surgery [23]. Therefore, it is particularly important to predict the Lauren type of gastric cancer accurately and preoperatively. In order to facilitate this study by using a binary logic regression method, the Lauren mixed type (n = 75) gastric cancer patients were excluded from the recruitment. A study demonstrated that survival outcomes of Lauren mixed type patients were similar to diffuse type [24].
At present, pathological diagnosis by postoperative samples is still a gold standard in the identification of Lauren types in gastric cancer. However, this diagnosis is somewhat hysteretic to select proper treatment plan before operation. Although preoperative biopsy could be performed by gastroscopy examination, it usually harms the body and obtains few tissue specimens which have a great influence on the diagnostic accuracy of Lauren types [25]. In recent years, with the rapid development of artificial intelligence techniques and the set-up of big database, researchers have tried to break through the traditional megascopic image analysis based on experiences and seek an invasive and objective method to quantitatively characterize the lesion. The newly emerged radiomics could extract plenty of quantitative features from images and construct radiomics signature and nomogram to disclose the heterogeneity of gastric tumor.
Through the interpretation of the nomogram in this study, it could be found that the occurrence of diffuse type gastric cancer patients related to younger age and higher CT-N stage, who had a bad prognosis. These results were consistent with previous studies [26]. In addition, we extracted radiomic features based on single 2D ROI of gastric tumor in CT image slices. A research has suggested that 2D CT annotations might be a preferred choice in gastric cancer radiomics studies than 3D because 3D annotations might bring more noise [27]. The LASSO method confirmed that 10 radiomic features were related to the Lauren type of gastric cancer and were used as independent predictors, including shape and size features, first-order features, texture features, and wavelet features. Then, instead of single factor analysis, we built and verified a nomogram for gastric cancer patients based on the combined radiomics signature with clinical factors including age and CT-N stage. Compared with these 3 models (clinical model, radiomics signature model, and nomogram model) in predicting the Lauren type, the nomogram model achieved the highest predictive AUC (0.846), accuracy (79%), sensitivity (69%), and specificity (86%) in the training set, as well as the highest predictive AUC (0.864), accuracy (78%), sensitivity (90%), and specificity (70%) in the testing set. The predictive accuracy of the nomogram model in our study was higher than the diagnostic accuracy of preoperative gastroscopic biopsy (64.7%) in Qiu et al.’s study [7]. In another study, they differentiated diffuse type from intestinal type gastric cancer by parameters derived from portal venous CT images and achieved an AUC of 0.655–0.674 [17]. Compared with our result, the AUCs of our nomogram model either in the training set or in the testing set were significantly higher than theirs. In a similar study, they analyzed the pharmacokinetic parameters derived from dynamic contrast enhanced (DCE) MRI of 32 gastric cancer patients and found that the diffuse type showed a higher Ktrans (the volume transfer coefficient reverse) and Ve (extracellular extravascular volume fraction) than the intestinal type [28]. However, their sample size was too small to construct a robust predictive model. Up to now, our nomogram combining the radiomics signature with clinical risk factors is the most promising noninvasive and quantitative prediction tool to identify the Lauren type of gastric cancer prior to operation.
There are also some limitations in this study. First, this is a retrospective study in our single-center hospital and external validation of multi-center cases can be required to evaluate the suitability of this nomogram model. Second, only venous phase CT images were used to extract radiomic features as it is difficult to identify tumor margins exactly on unenhanced or arterial phase CT images, although they may contain some useful information. Third, patients with mixed type gastric cancer (n = 75) was excluded from the recruitment, which may cause some statistical bias.
In conclusion, this nomogram merging radiomic features of gastric tumor, age, and CT-N stage showed good performance in predicting Lauren type of gastric cancer before operation, which was a helpful and easy-to-use tool for individualized decision making in clinical treatment strategy management because of its visualization and interpretability.
Footnotes
Acknowledgments
This study was funded by Top Talent Support Program for young and middle-aged people of Wuxi Health Committee in China (grant number: HB2020046).