
Abstract
OBJECTIVES:
To evaluate skin dose differences between TPS (treatment planning system) calculations and TLD (thermo-luminescent dosimeters) measurements along with the dosimetric effect of applicator misplacement for patients diagnosed with gynecological (GYN) cancers undergoing brachytherapy.
METHODS:
The skin doses were measured using TLDs attached in different locations on patients’ skin in pelvic regions (anterior, left, and right) for 20 patients, as well as on a phantom. In addition, the applicator surface dose was calculated with TLDs attached to the applicator. The measured doses were compared with TPS calculations to find TPS accuracy. For the phantom, different applicator shifts were applied to find the effect of applicator misplacement on the surface dose.
RESULTS:
The mean absolute dose differences between the TPS and TLDs results for anterior, left, and right points were 3.14±1.03, 6.25±1.88, and 6.20±1.97 %, respectively. The mean difference on the applicator surface was obtained 1.92±0.46 %. Applicator misplacements of 0.5, 2, and 4 cm (average of three locations) resulted in 9, 36, and 61%, dose errors respectively.
CONCLUSIONS:
The surface/skin differences between the calculations and measurements are higher in the left and right regions, which relate to the higher uncertainty of TPS dose calculation in these regions. Furthermore, applicator misplacements can result in high skin dose variations, therefore it can be an appropriate quality assurance method for future research.
Introduction
Brachytherapy with high dose rate (HDR) sources is one of the main methods for the treatment of gynecological (GYN) cancers in women’s reproductive system which occurs as cervical, ovarian, vaginal, and endometrial cancers [1, 2]. GYN cancer includes up to 19%of new cancers worldwide per year according to the International Agency for Research on cancer reports [2]. The goal of brachytherapy is to protect normal healthy structures from radiation and deliver the highest radiation dose to cancer cells of the tumor using radioactive sources positioned into or very close to the tumor region [3, 4]. The HDR brachytherapy machines with 60Co sources have the ability to produce suitable dose distribution inside the body at the target region by placing the Cobalt source in different positions (dwell positions) at appropriate times (dwell times) [5, 6]. Furthermore, these sources have a longer half-life compared with more conventional sources like 192Ir [7].
High gradient dose distributions resulted from brachytherapy allow the delivery of high doses to the tumor while sparing the neighboring healthy tissues. Possible catheter/applicator shifts, incorrect modeling of catheters, and TPS dose calculation uncertainties lead to potential inaccuracies in delivered dose distribution. In HDR brachytherapy techniques, high dose values are required to successfully treat the target volume, therefore, dosimetry accuracy for TPS calculations and dose delivery are important issues [5]. There are several studies reporting on the accuracy of TPS in GYN brachytherapy using TLDs (thermo-luminescent dosimeters) or other detectors attached to the vaginal cylinder applicator [8, 9], however, the skin dose of patients has rarely been investigated for 60Co brachytherapy of GYN. Skin is relatively far from the brachytherapy source, therefore, it usually considered as a not important region in clinical practice, and skin dose was ignored in most of the cases. However, it seems that obtaining TPS uncertainties for skin dose could be an appropriate method for quality assurance about correct execution of the brachytherapy treatment plans for future TPS software’s assuming tissue inhomogeneities. In addition, for assessing the differences between TPS calculations and TLD measurements for patients, this study hypothesized that different applicator misplacements can be evaluated by measuring surface dose and there must be a relationship between surface dose changes and applicator positions. In this study, the dosimetric differences between TPS calculations and TLD measurements were evaluated at the skin and applicator surface in phantom and patients for 60Co brachytherapy of GYN. In addition, the effect of different shifts in applicator placement on the surface dose was evaluated using a phantom.
Material and methods
Sample selection and treatment procedure
Twenty patients with locally advanced cervical cancer (with an average age of 58 ranging from 37 to 75) with prescribed GYN brachytherapy (after external radiotherapy) treatment were selected randomly. The patients with a history of GYN cancer surgeries were excluded from our study. All patients were aware of the whole procedure including TLDs attached to the applicator and skin, and the consent forms were signed by all patients cooperating in our study. Furthermore, this study was approved by the Ethics Committee and National Research Ethics Board.
The positioning of applicators was performed under ultrasound imaging guidance for each patient. CT examinations (3 mm slice thickness, SOMATOM Confidence, Siemens, Germany) were carried out for the patients after the applicator positioning procedure. The CT images (with the resolution of 512×512) were used for treatment planning and TPS dose calculations. The suitable applicator composition was suggested by a radiation oncologist based on the tumor staging and its margin extension. A combination of tandem and cylinder were applied in this study for 12 patients, while the other patients (8 patients) were treated with tandem and ovoid applicators.
An HDR 60Co remote after-loading brachytherapy unit (BEBIG, Co0.A86 model, Eckert & Ziegler BEBIG GmbH, Germany) along with the dedicated brachytherapy TPS (SagiPlan® version 2.0, Eckert & Ziegler BEBIG, Germany) were used for treatments. The TPS applied the TG-43 algorithm (update1) for dose calculation [10], and source anisotropy along with the line source utilization were modeled for source geometry factors approximation in this software [11]. The inverse planning algorithm of the TPS calculated the dwell positions and weights based on the initial input dose constraints and goals. However, dwell positions and weights in the tandem-cylinder/ovoid were manually modified to achieve the optimal dose distribution for covering the HR-CTV as much as possible and spare the organs at risk (including bladder and rectum) as low as is in the case in the GEC-ESTRO recommendations [11]. The delivered doses to the volume of 0.1 cc (D0.1cc), 1 cc (D1cc) and 2 cc (D2cc) were evaluated for rectum and bladder. D100 and D90, as the minimum dose delivered to 100%and 90%of the HR-CTV, were considered to assess the planning dose distribution in the target.
The prescribed total dose (external radiotherapy + brachytherapy) in terms of EQD2 (equivalent dose in 2-Gy fractions) for HR-CTV were in the range of 80 to 90 Gy, depending on tumor size at the time of brachytherapy. Table 1 presents the treatment planning characteristics including brachytherapy technique, and dosimetric parameters of HR-CTV, rectum, and bladder for each patient.
Treatment planning characteristics for each patient
Treatment planning characteristics for each patient
Abbreviations: BT = brachytherapy; TC = tandem and cylinder; TO = tandem ovoid; HR-CTV = high rate-clinical target volume.
Almost a similar procedure (as applied for the patients) was performed for a pelvic slab phantom including CT simulation, planning, dose calculation, and treatment. For the phantom, only the cylinder applicator was used to deliver 7 Gy at 0.5 cm depth to 4 cm of length (at the middle length of the applicator).
Dose measurements were carried out using TLD-100 (Harshaw Company) dosimeters made of Mg, Cu, and P with the dimensions of 3.2×3.2×0.9 mm3. In summary, a multi-layer 30×30 cm2 Perspex (PMMA) phantom was used for TLDs’ calibration procedure. Twenty square shape holes (3.3×3.3 mm2) in the form of matrices were created in the center region of the Perspex layer with a thickness of 5 mm for insertion of the TLDs. The depth of the holes was 2 mm. A layer with a thickness of 2 cm was positioned on the top of the TLD layer. A thickness of 5 cm was considered for the lower back-scatter slab. Fifteen TLDs were located into the phantom, under the uniform irradiation of a 60Co gamma radiation machine (Teratron 780, Canada). The field size and SSD were equal to 10×10 cm2 and 100 cm, respectively. Subsequently, all irradiated TLDs were read by a TLD reader (LTM reader, Fimel, Velizy, France) after 48 hours. Dose levels of 40, 60, 80, 100, and 120 cGy were used to plot the calibration curve. Furthermore, two TLDs were not irradiated to measure the background dose.
The TLD calibration uncertainty was estimated from the standard error of repeated measurements. The combined relative standard uncertainty (Uc) for the determined dose of TLDs was calculated by Equation 1 which the equation parameters were explained by the Izewska et al. [12].
In Equation 1, N is the calibration coefficient, Ffad is the fading correction factor which is equal to 0.02%for TLD-100 following the Izewska et al. [12] study. Furthermore, Fhol is the TLD holder correction factor which is about 0.3%[12]. Fenergy is the energy correction factor measured as the standard error of the actual corrections used for all patients. For each dose 6 TLD chips were irradiated and the dose-response non-linearity correction factor (Flin) was determined by making a linear fit to the experimental data.
The TLDs were placed on the patients’ skin at the symphysis pubis bone region (anterior), and the left and right sides of their pelvis (with about 12 cm distance between them and anterior TLDs). Notably, the same kind of TLDs in CT imaging was used and their positions were marked by a sharp head marker. Then the CT scan was performed for each patient. The physicist then removed the CT marker and attached TLDs to patients’ skin at the beginning of treatment. All procedures related to TLD positioning were performed by one medical physicist. Furthermore, Hounsfield unit, electron density, and mass density of the TLDs were replaced by the values of water in the TPS software. In addition, two TLDs (TLD-100) were adhered at fixed distances (10 cm from the flat edge of the cylinder) on the opposite sides of the vaginal cylinder (Fig. 1).

Two TLD positions on the vaginal cylinder.
Three TLDs were also attached on the surface of a phantom (Fig. 2a) in a similar position to the patients’ skin. This home-made phantom (total diameter = 19 cm×29 cm) was mainly made of RW3 (PTW, Germany, mass density = 1.045 g/cm3) slabs (attached together) in a semi-cylindrical shape mimicking the shape of human pelvis. Several cylindrical holes with different diameters were designed to simulate the rectum (diameter = 36 mm), bladder (diameter = 52 mm), vagina (diameter = 40 mm), and femurs (two holes with diameter = 28 mm). The holes of the rectum and femurs were filled with air and Teflon cylinders, respectively. The phantom was scanned with CT simulation and the obtained images were imported to TPS for dose calculations. The TG-43 dose calculation algorithm considered the calculation volume as the water equivalent material. For the phantom, a cylinder applicator was used to deliver 7 Gy at 0.5 cm depth to 4 cm of length (at the middle length of the applicator). The rectum and bladder were also contoured covering the cylinder and also their dose constraints were similar to the patient doses.

(a); The phantom with TLD positions (cross marked). (b); A transverse CT image of the phantom.
To enhance the accuracy of TLD dose measurement, one layer of bolus (thermoplastic bolus sheets with a mass density of 1.13 g/cm3, Orfit, Belgium), and thickness of 0.5 cm was attached above the TLD regions to eliminate the uncertainties of dose measurement in the air-phantom interface. A transverse CT image of the phantom is shown in Fig. 2b.
In phantom, the applicator shifts with 5 mm steps in superior-inferior direction (4 cm in superior and 4 cm in inferior directions) were applied and treatment producers were repeated as designed in TPS, to evaluate the effect of applicator displacement on the TLD dose measurements. The differences of surface dose between the measurements of applicator misplacement and correct placement conditions were evaluated for each applicator shift.
The skin dose values (D) using TLDs in each of the patients and the surface dose in the phantom at the point of interest were calculated using equation 2 which was explained in a previous study by Raffi et al. [13].
where R is the corrected TLD reading (in nC), and N is the calibration coefficient (in Gy/nC). The correction factor for intrinsic energy dependency was assumed to equal one because the calibration and brachytherapy treatment radiations were produced by 60Co sources. For skin dose measurements, the point of interest was the basal skin defined at a depth of 0.07 mm beneath the skin surface in accordance with ICRP and ICRU recommendations [11, 13]. G is the geometry correction factor and accounts for the inverse square relationship between the dose at the point of interest and measurement. Since the point of interest in the skin (0.07 mm) is closer to the source than the measured point (center of the TLD; 0.45 mm), the G factor must be calculated for skin dose measurement. The source position during the brachytherapy changes in the planned dwell positions. In large distances between source to the skin (higher than 5 cm), this factor will have values near one. In this study, this factor was assumed equal to one, because we measured and calculated the dose exactly at the same positions of the TLDs (not the basal skin). The correction factor k accounts for the correction related to the lack of electronic equilibrium for skin measurement (without any backscatter material for TLDs). This factor has been obtained in Raffi et al. [14] study by the Monte Carlo simulation, with an average value of 0.98 for skin dosimetry in patients. For phantom measurements, since we used a bolus above the TLD location regions, this factor was assumed to equal to one. This technique can remove the uncertainties of this factor (k).
TPS calculated doses (for one fraction) were compared with TLD measured values using the paired t-test in the SPSS software (Version 16, IBM, USA), i.e. the TLDs and TPS dose differences were calculated separately for each point and patient. The level of statistical significance was set at P < 0.05. It is notable that the normality of data statistical distributions was initially assessed by the Kolmogorov-Smirnov statistical test in the SPSS software with 95%confidence interval.
Results
TLD calibration and uncertainty
The obtained TLDs calibration curves have been drawn in Fig. 3. The calibration coefficient of TLD-100 was obtained at 0.0008. In addition, the R2 value of the fitting line was equal to 0.9581. The estimated uncertainty of the TLDs at different distances was obtained about 1.55 %, which has a good agreement with a previous study [11]. The uncertainty components of the TLDs have been listed in Table 2.
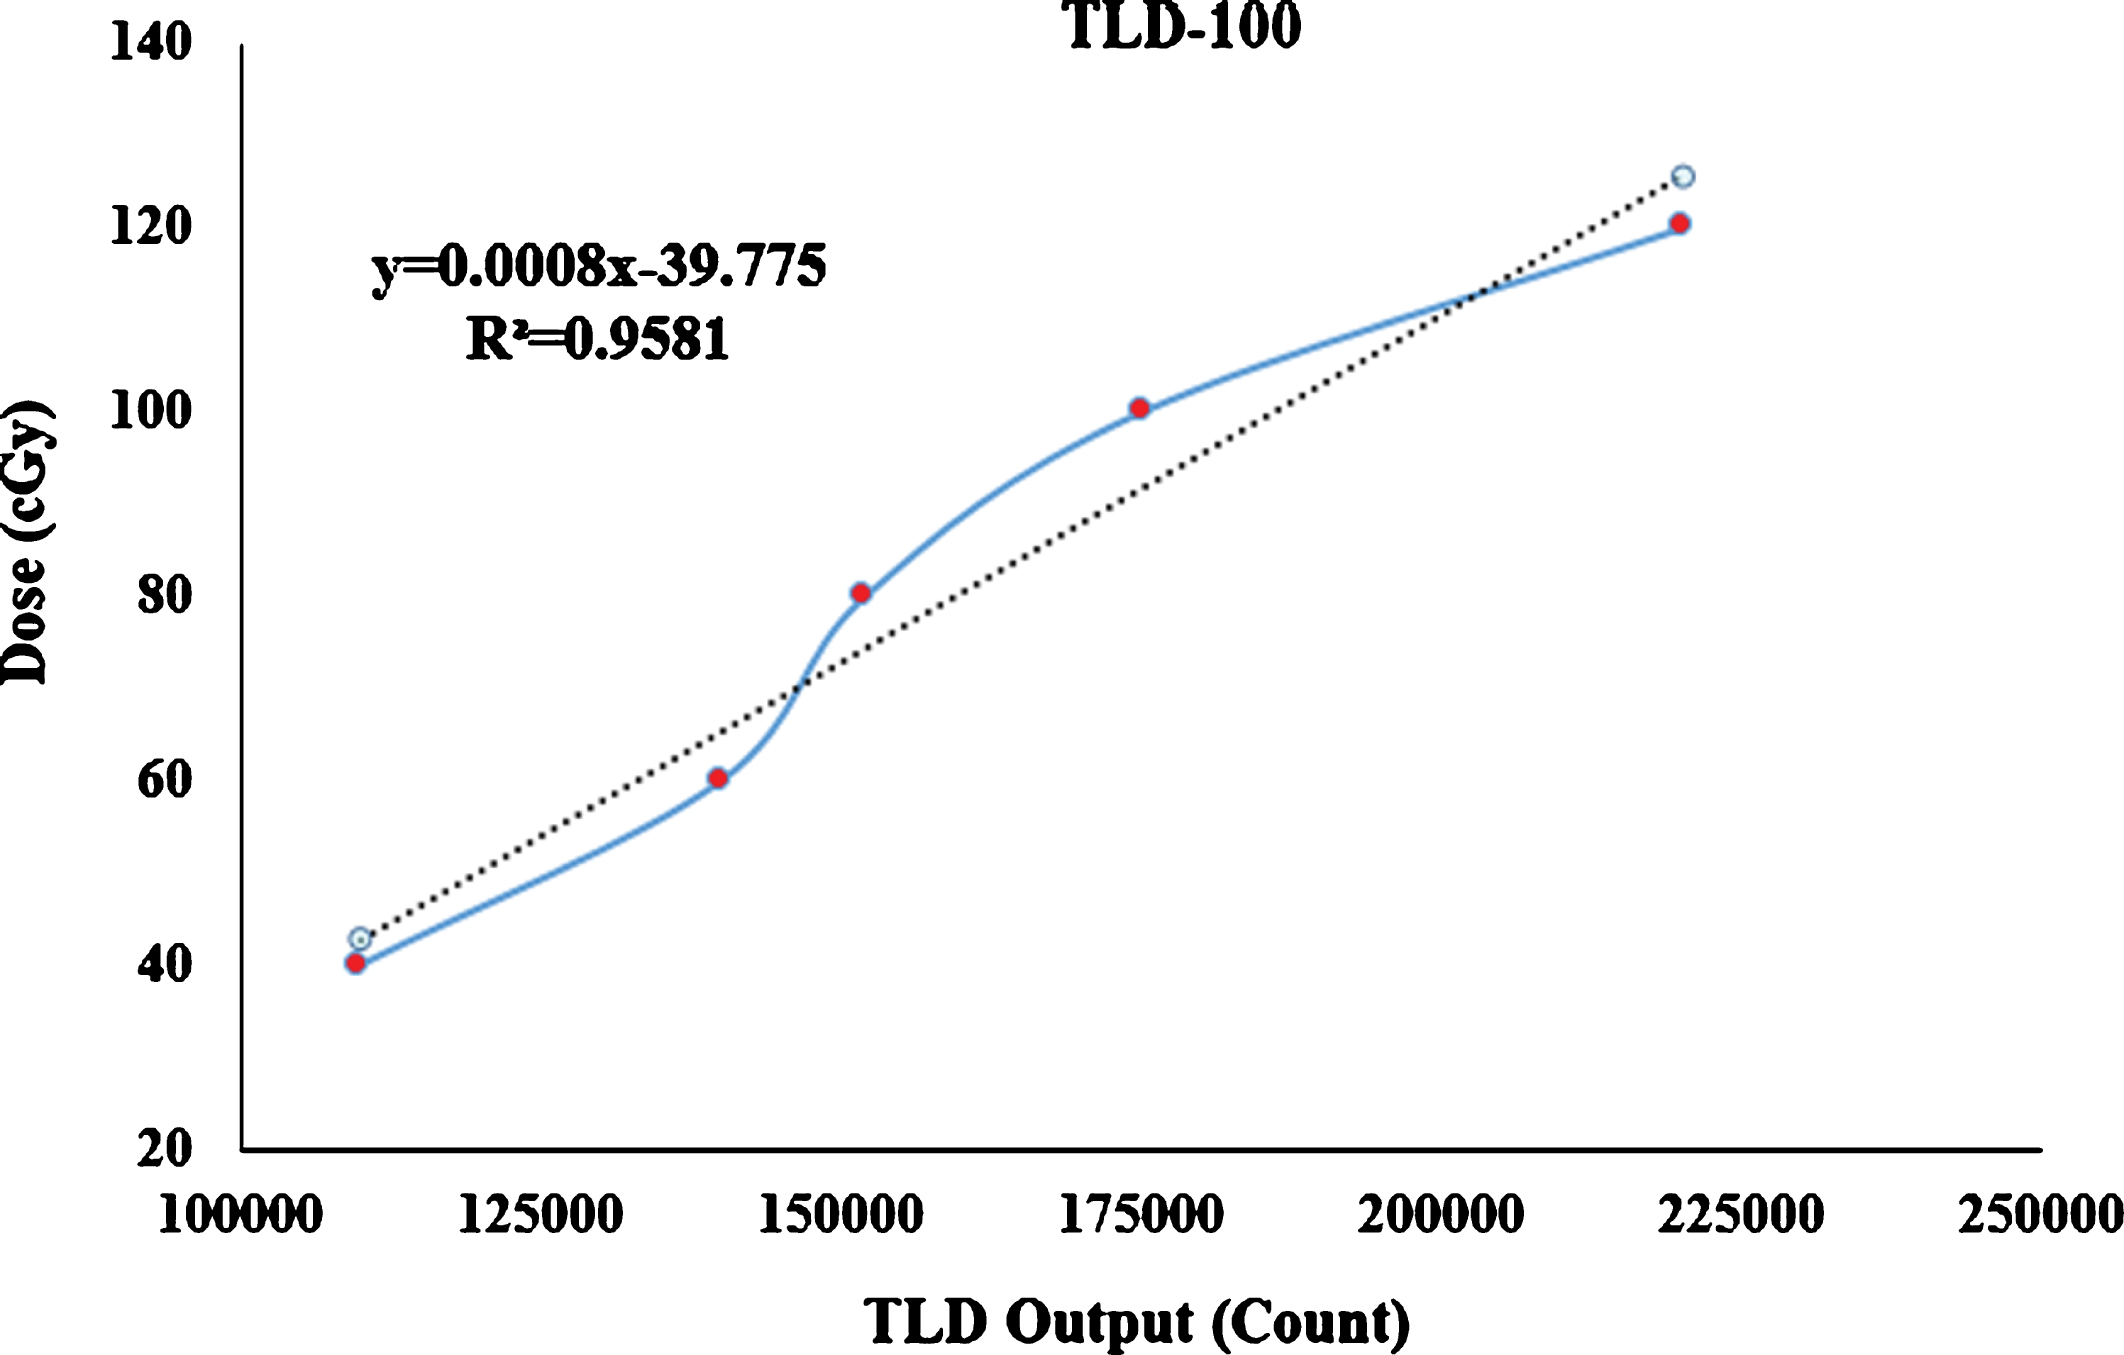
TLDs calibration curves along with calibration coefficient.
Uncertainty components of TLDs
Table 3 describes the TPS skin dose calculations for each of the three different points on the patients’ skin and also the two assessed points on the applicator surface for each patient.
TPS calculated dose at three points on the patients’ skin and two points on the applicator surface for the patients treated with tandem-cylinder method
TPS calculated dose at three points on the patients’ skin and two points on the applicator surface for the patients treated with tandem-cylinder method
The differences (%) between the TLD measurements and TPS calculation for the above-mentioned points have been described in Table 4. According to this table, a positive number shows that the TLD dose measurement was higher than the TPS calculations and a negative number demonstrates that the TLD dose was lower than the TPS calculation. Considering the TLDs uncertainties (1.55%), approximately 85%(or more) of all cases showed good agreements (<3%) between TPS dose calculations and TLDs measurements in the points evaluated on the applicator surface (points 1 and 2). By averaging the dose differences between TLD measurements and TPS calculation in points 1 and 2, for the assessed patients, the results showed that the mean difference on the applicator surface was 1.92±0.46%. Furthermore, there are no statistically significant differences between the TPS and TLD measurements for the points on the applicator surface (points 1 and 2) (P-value > 0.08).
Differences (%) between TLD-100 measurements and TPS calculations in the three points on the patients’ skin and two points on the applicator
The differences between TPS and TLD were more considerable in skin dose compared to the points in the applicator surface. In comparison to the lateral skin points (left and right), the TLDs readouts at the anterior point have less disparity compared to the TPS dose predictions (mean of absolute differences at anterior point = 3.14±1.03%). For the left and right points, the mean of two absolute differences was 6.25±1.88%and 6.20±1.97%, respectively, showing significant differences between measurements and calculations at these points (P-value < 0.01).
The phantom measurements also showed that the variations of surface doses between the TLDs’ readouts and TPS calculations are higher in comparison with the applicator doses (Table 5). All measurements were performed for the condition in which no applicator displacement was applied.
Phantom TLD measurements compared to TPS calculations in the assessed points
Phantom TLD measurements compared to TPS calculations in the assessed points
The differences between the surface TLD readouts (anterior, left, and right points) resulted from applicator displacement and correct placement measurements have been depicted in Fig. 4. Also, the surface dosimetric effects of applicator shifts have been shown in this Figure. It is obvious that increasing the applicator displacement leads to a higher difference between the TLD measurements and TPS calculations in all measured points.
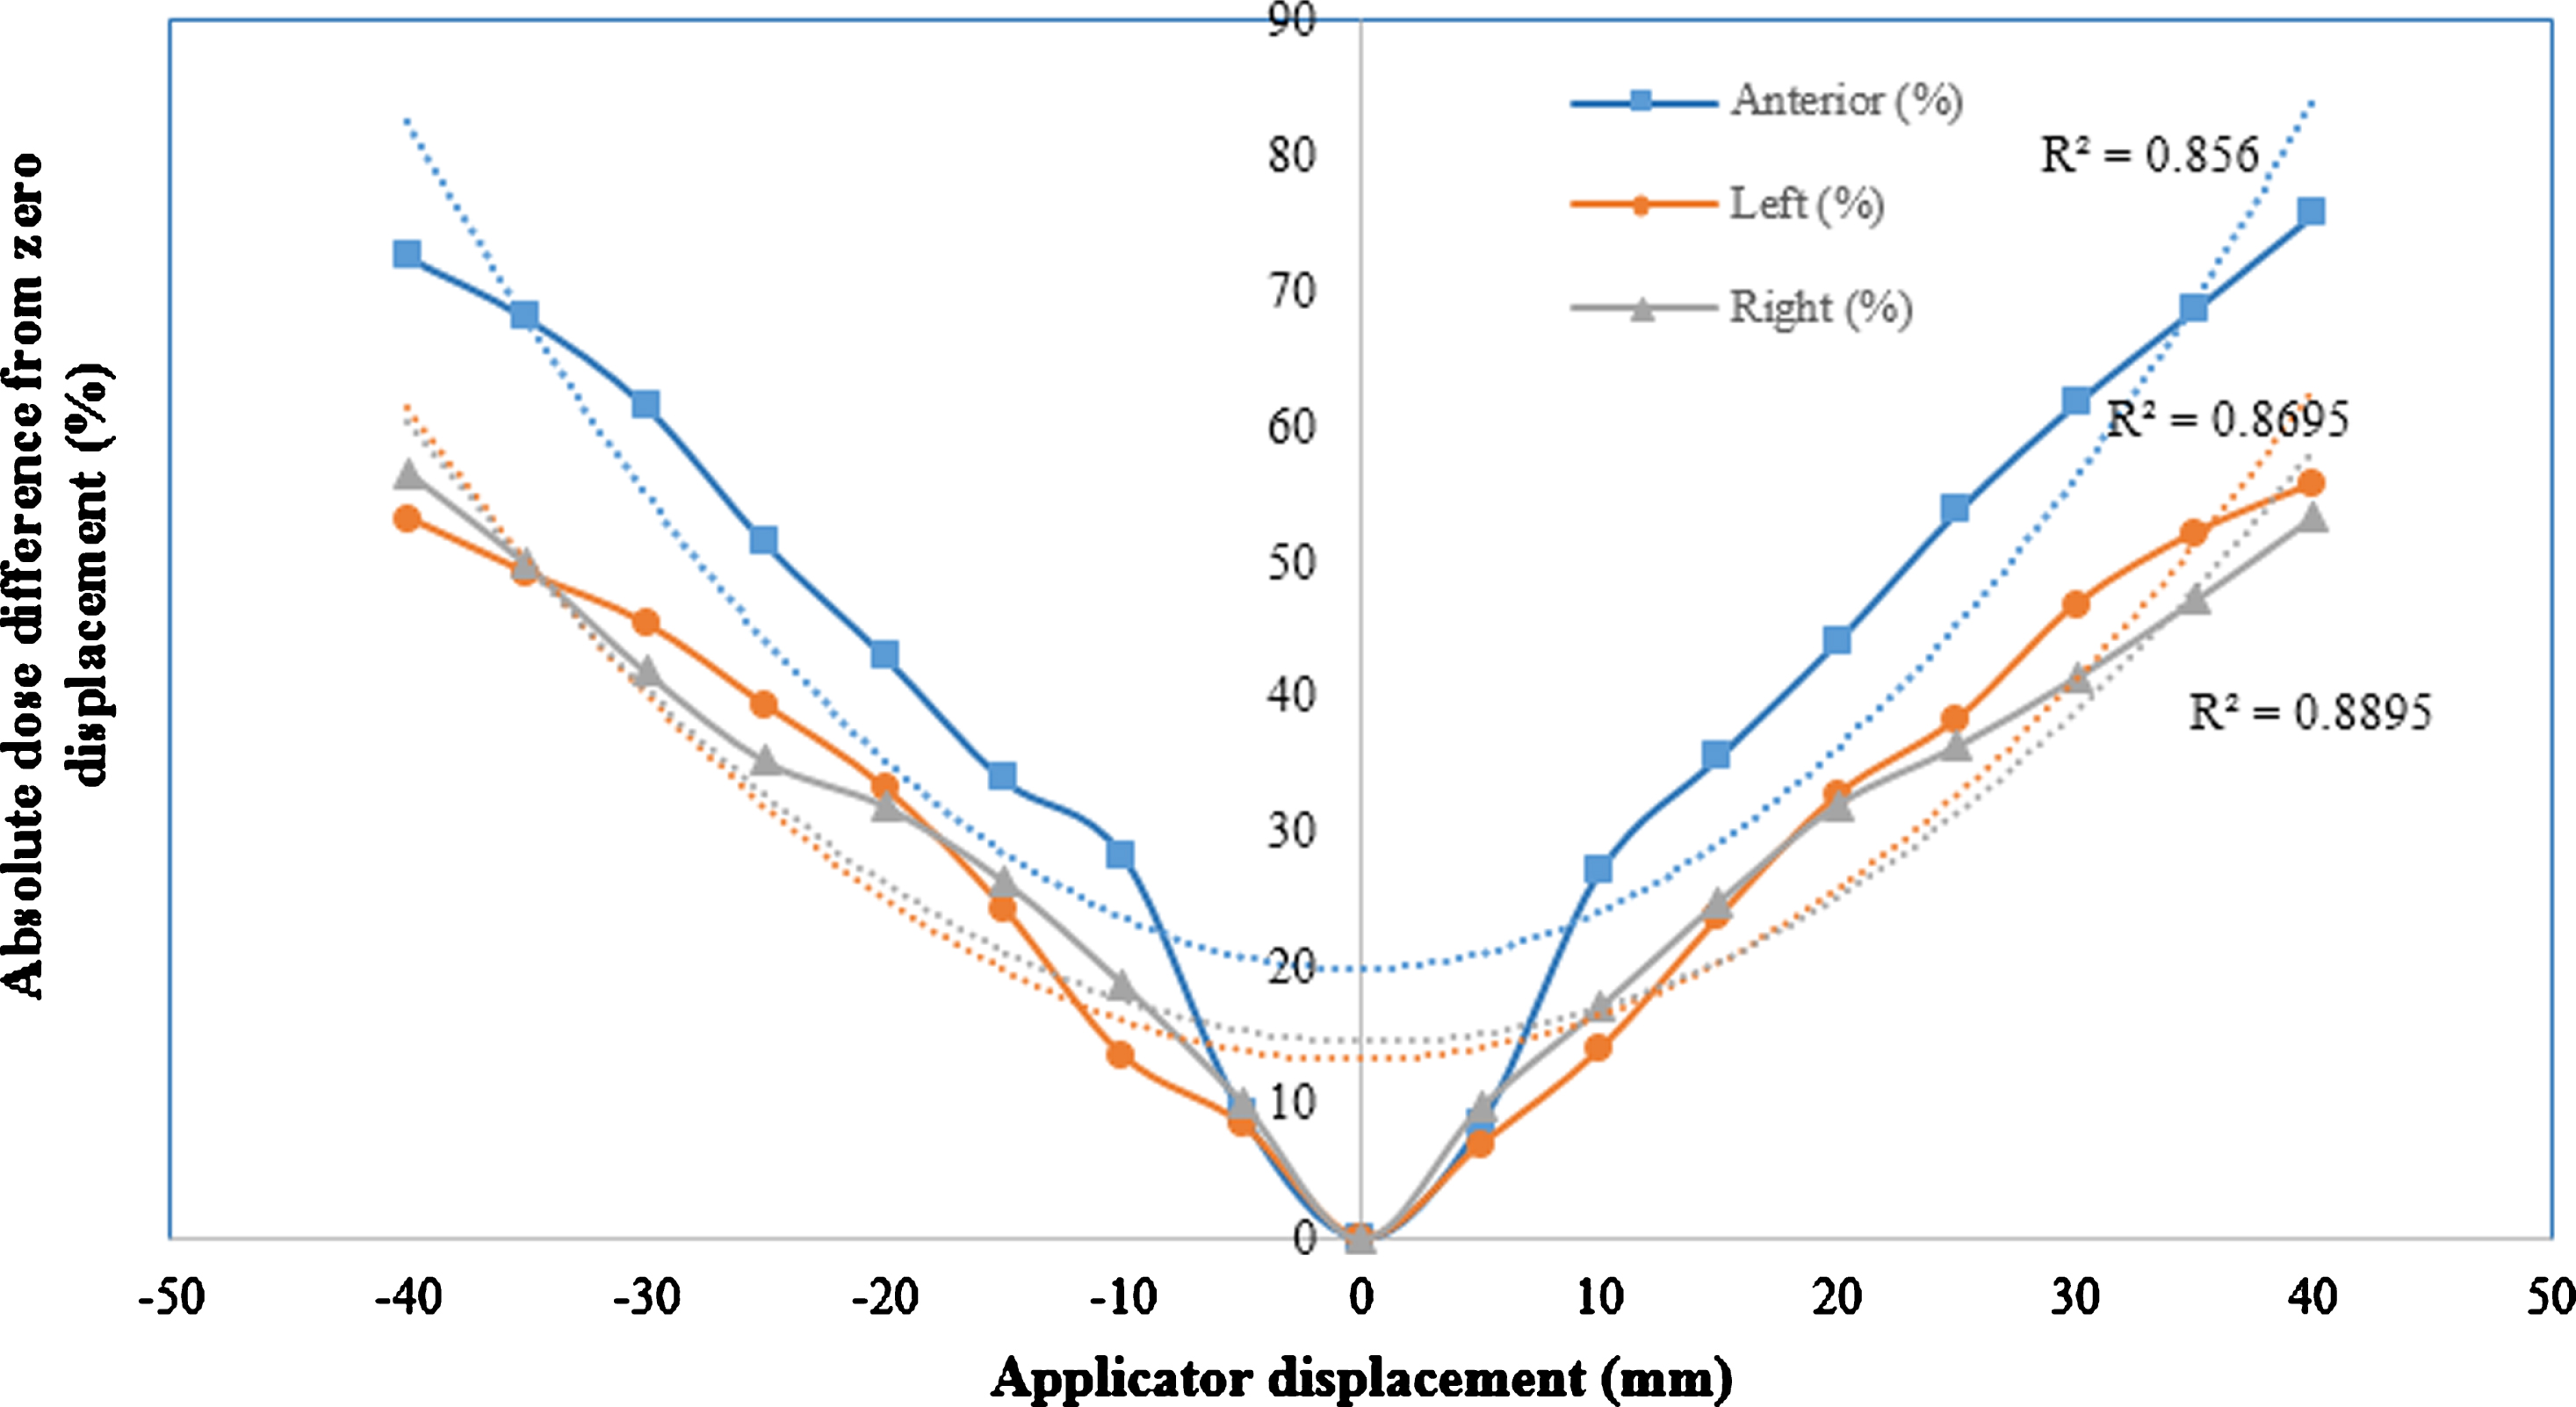
Absolute dose difference (%) from the initial correct applicator placement regarding the different applicator displacements (mm) which shows the effect of applicator displacements in the surface dose values measured at anterior, left, and right points on the phantom.
The correlations between the applicator displacement and absolute dose difference values were calculated with Spearman correlation in the three assessed surface points. The mean R2 values of these three regions were equal to 0.88, showing a very strong correlation between the assessed parameters.
Skin is relatively far from the brachytherapy source, therefore, its dose usually ignored in most cases. However, we showed that obtaining TPS uncertainties in skin dose with TLD measurements could be an appropriate quality assurance method for future TPS software considering tissue inhomogeneities. Furthermore, changes in skin dose showed a relationship with applicator displacement enabled us to predict the misplacements of the applicator. In the current study we used TLDs for skin dose measurements because they are small and low sensitivity to radiation energy or dose rate, as well as can evaluate the point doses which make them appropriate dosimeters for intra-cavity and superficial dose measurements [15]. It is notable that the phantom was used to the effect of different shifts in applicator placement on the surface dose due to the repetition of brachytherapy procedure which could not be performed on the patients.
In the present research, TLD calibration was performed on a Perspex (PMMA) phantom, however, the patient-mimicking phantom was made from RW3. It has been reported that radial dose at various distances from 60Co source is different for Perspex compared to RW3 [16]. In general, this difference will decline with decreasing the distances from the source, in a way that, in distances lower than 4 cm from the source, the difference is below 1%[16]. The calibration procedure was performed at a depth of 2 cm, therefore, the differences in the TLD readouts were very low. Furthermore, the density correction related to PMMA to water was applied for readings of TLDs.
Since the skin-air inhomogeneity is a potential source of uncertainty in dose measurement, we covered the TLDs in a phantom using the bolus. It is notable that we did not use bolus for patients and TLDs located in patients in the air-tissue interface. Therefore, a correction factor extracted from a previous study [14] was used to reduce this effect. Raffi et al. [14] investigated the skin dose values using Monte Carlo simulations and TLD dosimeter for HDR 192Ir source in 35 patients. They reported that there is a good agreement (2%variation) between the measurements and simulations. They expressed that TLD dosimeters have the potential accuracy to evaluate the skin dose value when the proper corrections are applied.
Following the treatment planning guideline, tissue dose (delivered dose) should not differ more than ∼5.5%from TPS dose calculations [17]. However, we found higher tolerances especially in the left and right points during the dosimetry of the patients’ skin dose. In the mentioned points, the distances from the radiation source are greater and the dose levels are lower. There are some reasons for increasing these tolerances, such as inaccuracies of TPS calculations at low dose regions and inhomogeneous interfaces, as well as movements of markers on the patient’s skin during the CT-imaging and treatment rooms. However, in this study, we used a suitable method to ascertain the TLD positions during CT- scanning and treatment procedures. The tolerances in phantom surface dosimetry were lower than the recommendation which could be due to the use of thermoplastic bolus over the TLDs.
Despite TPS calculation errors in the inhomogeneous regions, uncertainties in TLD measurements can affect the results of dose comparison between the TPS calculations and measurements. The dose differences in patients’ skin for anterior, left, and right points were 3.14±1.03, 6.25±1.88, and 6.20±1.97 %, respectively. We obtained 1.5%uncertainty in TLD dose measurement. Therefore, these dose differences could be higher up to 8%for right and left points or could be lower up to 1.1%for the anterior point. However, the TLD measurement uncertainties must be considered for any future development of skin dose measurements as a quality control method for radiotherapy. Other factors which can affect the skin dose value are the prescribed dose, location of brachytherapy applicator, and patient’s body mass index, in a way that, higher prescribed doses and thinner patients lead to a greater skin dose. As shown in a previous study by Andrew et al. [18], a 35%dose difference is related to 1.2 cm displacement of tandem in caudal-cranial direction. In our study, the applicator displacements of about 2 cm resulted in a roughly 36%skin dose difference which seems to have a good agreement with the above-mentioned study. In another study [19], correct placement of applicator (tandem and ovoid) were evaluated using orthogonal radiographs. They expressed that changes in the adjustment of the applicator can cause dose variations of up to 823 cGy. Lower dose changes in our study are probably due to the choice of different points (surface of the phantom) for dose calculations.
Several studies have reported that real-time dose monitoring is an appropriate technique for assuring HDR brachytherapy treatment [8, 21], however, the misplacements of applicator have not been evaluated. For example, in a study by Gambarini et al. [8], TLD in-vivo dosimetry in HDR brachytherapy of prostate (14 Gy), using ultrasound imaging, was performed. In their study, the TLDs were attached to the ultrasound probe, and the misplacement of the probe, prior and during the treatment was not investigated.
In the present work, we evaluated the effect of applicator misplacement on the surface dose values using TLD tools on the phantom. The main novelty of this study is that the skin dose was used to evaluate the applicator placement. This study provided a new perspective about the importance of skin dose for future studies as the quality control method. Also, there are other methods like image-guided brachytherapy which are appropriate methods to track the location of the applicator and reduce the TPS uncertainties [22–25], which also can reduce the misplacement of the applicator effectively [26]. In this regard, a combination of image-guided brachytherapy along with skin dosimetry can be an appropriate subject for future research about the dosimetric effects of applicator misplacement. Furthermore, in comparison with measurements, Monte Carlo simulation will yield more accurate uncertainty of TLD dose measurements and TPS calculations in skin dosimetry. In addition, an investigation of TLD misplacement/error during CT setup could be considered along with previous suggestions for future research.
Conclusion
The differences between TPS calculations and TLD measurements were higher during phantom and patients’ skin dose calculations (especially in the left and right regions) compared to the points in the applicator surface. The reason could be related to the higher uncertainty of TPS dose calculation at skin regions. Regarding the high skin dose variations due to the applicator misplacements, we have suggested investigating the accuracy of skin dose calculations in different TPSs for further use of skin dosimetry as an easy quality assurance tool.
Conflict of interest
None.