
Abstract
OBJECTIVE:
To investigate feasibility of the quantitative parameters of dual-energy computed tomography (DECT) to assess therapy response in advanced non-small cell lung cancer (NSCLC) compared with the traditional enhanced CT parameters based on the Response Evaluation Criteria in Solid Tumors (RECIST) guidelines.
METHODS:
Forty-five patients with unresectable locally advanced NSCLC who underwent DECT before and after chemotherapy or concurrent chemoradiotherapy (cCRT) were prospectively enrolled. By comparing baseline studies with follow-up, patients were divided into two groups according to RECIST guidelines as follows: disease control (DC, including partial response and stable disease) and progressive disease (PD). The diameter (D), attenuation, iodine concentration and normalized iodine concentration of arterial and venous phases (ICA, ICv, NICA, NICv) and the percentage of these changes pre- and post-therapy were measured and calculated. The Pearson correlation was used to analyze correlation between various quantitative parameters. The receiver operating characteristic (ROC) curves were used to evaluate accuracy of therapy response prediction.
RESULTS:
The change percentages of Attenuation (Δ-Attenuation-A and Δ-Attenuation-V), IC (ΔICA and ΔICV) and NIC (ΔNICA and ΔNICV) pre- and post-therapy correlate with the change percentage of D (ΔD). Among these, ΔICA strongly correlates with ΔD (r = 0.793, P < 0.001). The areas under ROC curves generated using Δ-Attenuation-A, ΔICA, and ΔNICA are 0.796, 0.900, and 0.880 with the corresponding cutoff value of 9.096, −15.692, and −4.7569, respectively, which are significantly different (P < 0.001).
CONCLUSIONS:
The quantitative parameters of DECT iodine map, especially iodine concentration, in arterial phase provides a new quantitative image marker to predict therapy response of patients diagnosed with advanced NSCLC.
Keywords
Introduction
The incidence and mortality of lung cancer have increased rapidly worldwide with the evolution of the human lifestyle and living environment. In China, the incidence and standardized mortality of lung cancer continue to increase every year. In the last 30 years (1990–2017), the mortality due to lung cancer increased from 14th of all-cause death to 4th at present. Lung cancer was the first cause of cancer-related deaths [1, 2]. Therefore, accurate and reasonable evaluation of lung cancer is very important to improve the prognosis and reduce the cost of public medical burden [3, 4]. At present, the efficacy assessment of a solid tumor is achieved using the Response Evaluation Criteria in Solid Tumors (RECIST, version 1.1) based on the morphological measurement [5]. However, a potential lag was observed in the morphological assessment [6]. In addition, some central lung cancers were covered with solid lung tissue, making it difficult to determine the actual size [7]. A functional assessment could find the changes in tumor microenvironment caused by tumor cell death in the early stage and better explain the structure–activity relationship for efficacy evaluation.
With the technical progress of computed tomography (CT) equipment, dual-energy CT (DECT) has been applied to the imaging of the brain, neck, chest, abdomen, musculoskeletal system, and other parts [8, 9]. The DECT iodine map accurately identifies and quantifies iodine substances. As a potential radiographic marker, it is also used in the diagnosis, assessment, and prediction of tumor recurrence in lung cancers [10–14]. DECT iodine map has the technical feasibility of being fully used in the therapeutic efficacy assessment and is expected to provide more comprehensive functional information. However, the application of the DECT iodine map in the therapeutic efficacy assessment of lung cancer has not been reported to date.
This study aimed to investigate whether the quantitative parameters of DECT, especially the iodine content (IC) and normalized iodine content (NIC) could predict the effects of chemotherapy or cCRT in patients with advanced NCSLC.
Materials and methods
Patients selection and treatment
This was a prospective study approved by the ethics committee of the hospital. All registered patients signed the informed consent. From December 2017 to December 2018, 61 patients (51 males and 10 females) with unresectable locally advanced NSCLC were prospectively registered. The mean age of all patients was 58.12±10.13 years (range 39–75 years). Of these, 9 patients had stage IIIA NSCLC, 13 patients had stage IIIB NSCLC, and 39 patients had stage IIIC NSCLC. The pathological types included 33 patients with squamous cell carcinoma, 27 patients with adenocarcinoma, and 1 patient with large-cell carcinoma.
The inclusion criteria were as follows: lung cancer confirmed by biopsy and pathology; standard chemotherapy or concurrent chemoradiotherapy (cCRT); assessable lesions according to the RECIST criteria [5]; and DECT used for baseline and efficacy assessment.
The exclusion criteria were as follows: complete response according to the RECIST criteria [5]; incomplete follow-up; poor image quality; replacement of treatment. (Fig. 1).
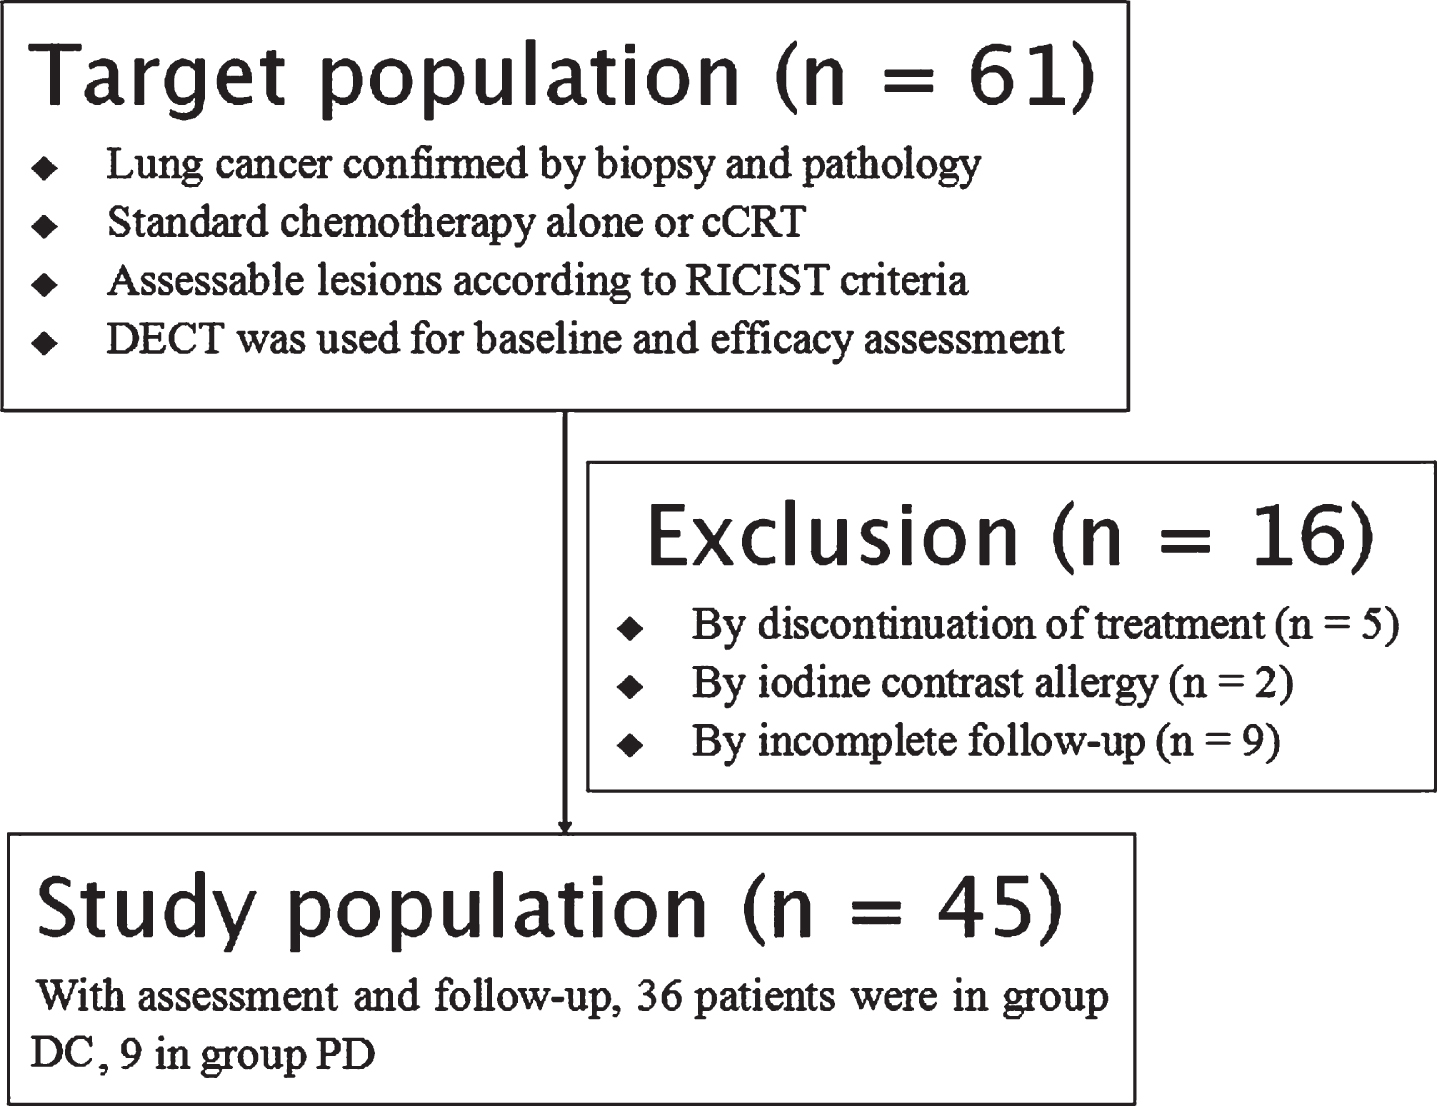
Flow chart of patients’ enrollment.
All patients were followed up using the electronic medical records and telephone. The time points were first two cycles (8 weeks) after chemotherapy alone and 3–6 months after cCRT.
All the patients were placed supine on the table, and 128-slice dual-source CT (Definition Flash, Siemens Healthcare, Germany) was performed. The contrast agent (1.0 mL/kg with 5.0 mL/s of injection rate; iodoprolamine, 370 mgI/mL; Bayer Schering Pharmaceutical, Germany) was injected via the elbow vein using a double-barrel high-pressure syringe (Stellant II, Medrad Inc., PA, USA). The DECT scan was performed with a delay of 30 s and 60 s. The tube voltage/current time product of tubes A and B were 100 kV/300 mAs and Sn 140 kV/232 mAs, respectively. The collimator was 32×0.6 mm, the rotation speed was 0.5 s/r, and the pitch was 1.0. After scanning at 100 kV and Sn 140 kV, linear fusion images (M = 0.5) were obtained. The slice thickness and interval were 1.0 mm. The automatic tube current modulation technique (Care DOSE 4D, Siemens Healthcare) was used. The linear fusion images were equivalent to routine enhanced CT in the efficacy assessment.
Image post-processing
The data of arterial and venous phases were transferred into Siemens syngo via workstation, and the iodine map was obtained using the “Virtual Non-Contrast” software (VNC, Siemens healthcare, Germany). The 400 HU of window width (WW) and 40 HU of window level (WL) were set on the iodine map for measurement: selecting the largest slice of a tumor and measuring the longest diameter (D). The 75 HU of WW and 50 HU of WL were set on the iodine map for delineation (Fig. 2). The region of interest (ROI) was drawn manually according to the maximum range of the tumor, and then the attenuation of arterial and venous phases (Attenuation-A and Attenuation-V, respectively), the iodine concentration of arterial and venous phases (ICA and ICV, respectively), and the normalized iodine concentration defined as IC ratio in lesion and aorta (NICA and NICV, respectively) were measured. ROIs were drawn at the same slice as much as possible. The aforementioned data were measured three times to take the mean value to reduce the random measurement error.
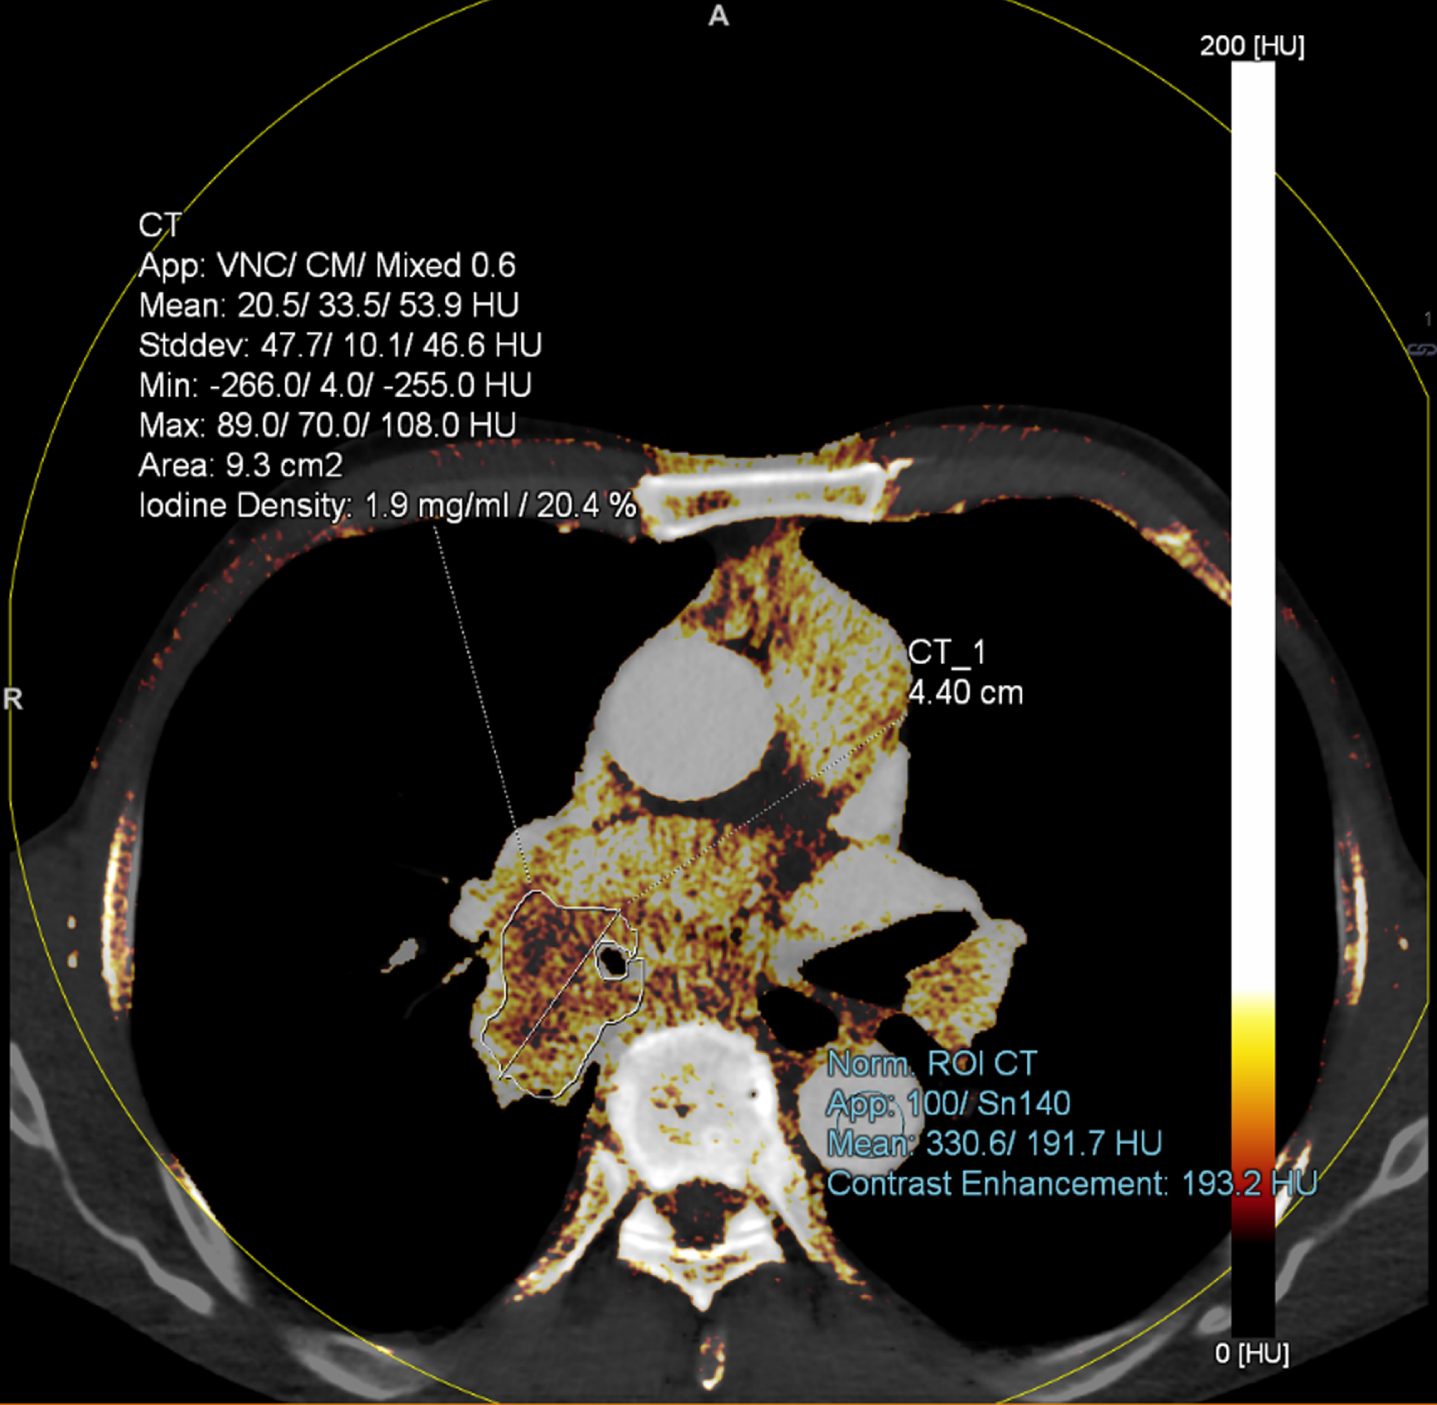
Sketch of drawing the ROI. Note: Iodine map setting: 75 HU (WW) and 50 HU (WL). When drawing the ROI (lung lesion), the atelectasis of lung tissue and blood vessels should be avoided.
Efficacy assessment
The patients first completed the baseline DECT and were then assessed for the efficacy of the primary lesions after anti-tumor treatment. DECT was taken again after the first two cycles of treatment with chemotherapy alone and 3–6 months after cCRT. Based on the RESICT criteria (version 1.1) [5], the tumors were divided into complete response (CR), partial response (PR), stable disease (SD), and progressive disease (PD).
CR: Compared with baseline, the target lesion disappeared completely. In this study, CR had been excluded.
PR: Compared with baseline, a≥30%decrease in the diameter of the target lesion.
PD: Compared with baseline, a≥20%increase in the diameter of the target lesion.
SD: Compared with baseline, the diameter of the target lesion between < 30%decrease to < 20%increase.
In this study, the patients were divided into two groups: disease control (DC, including PR and SD) and progressive disease (PD) (Fig. 1).
Quantitative parameters of iodine map
In this study, the differences in parameters before and after treatment were used as new measurable parameters, including the following: The change percentage of Dbefore and after treatment (ΔD) = (Dafter treatment − Dbefore treatment)/ Dbefore treatment×100%. The change percentage of Attenuation-before and after treatment of arterial and venous phases (ΔAttenuationA, ΔAttenuationV, respectively) = (Attenuation-after treatment − Attenuation-before treatment)/Attenuation-before treatment×100%. The change percentage of ICbefore and after treatment of arterial and venous phases (ΔICA, ΔICV, respectively) = (ICafter treatment − ICbefore treatment)/ICbefore treatment×100%. The change percentage of NICbefore and after treatment of arterial and venous phases (ΔNICA, ΔNICV, respectively)=(NICafter treatment − NICbefore treatment)/NICbefore treatment×100%.
A radiologist (Z. X. Y) with 5 years of chest imaging diagnosis experience measured the imaging parameters without knowing the patient’s clinical information.
Radiation dose
After the CT examination of each patient before and after treatment, Dose Length Product (DLP) was recorded from the dose report. The effective dose (ED) was estimated by DLP multiply by a k value. In this study, k value for chest was 0.014 mSv/mGy×cm [15].
Statistical treatment
SPSS 20.0 statistical software was used for the analysis. The Attenuation, IC, and NIC of all patients before and after treatment were tested using the paired-sample t test or paired rank-sum test (Wilcoxon test). Two independent-sample rank-sum tests (Mann–Whitney U) were used for comparing the DC and PD groups. The Pearson correlation was used to analyze the correlation between continuous variables. The receiver operating characteristic (ROC) curves were used to evaluate and compare the accuracy of PD prediction of each parameter, and the cut-off values were calculated. A P value < 0.05 was statistically significant.
Results
Patients characteristics
Based on the inclusion and exclusion criteria, 16 patients were excluded from the study for different reasons, including discontinuation of treatment (n = 5), iodine contrast allergy (n = 2), and incomplete follow-up (n = 9). The remaining 45 patients were successfully enrolled in this study; among them, 36 patients were in the DC group (Fig. 3) and 9 in the PD group (Fig. 4). The age of the patients was 61.31±9.17 years (range, 39–75 years), body mass index was 23.53±2.86 kg/m2 (range, 19.66–28.73 kg/m2), and body surface area was 1.76±0.14 m2 (range, 1.23–2.10 m2) (Table 1). The pathological types included squamous cell carcinoma (48.89%; 22/45), adenocarcinoma (13.33%; 6/45), and small cell carcinoma (37.78%; 17/45). (Table 1)
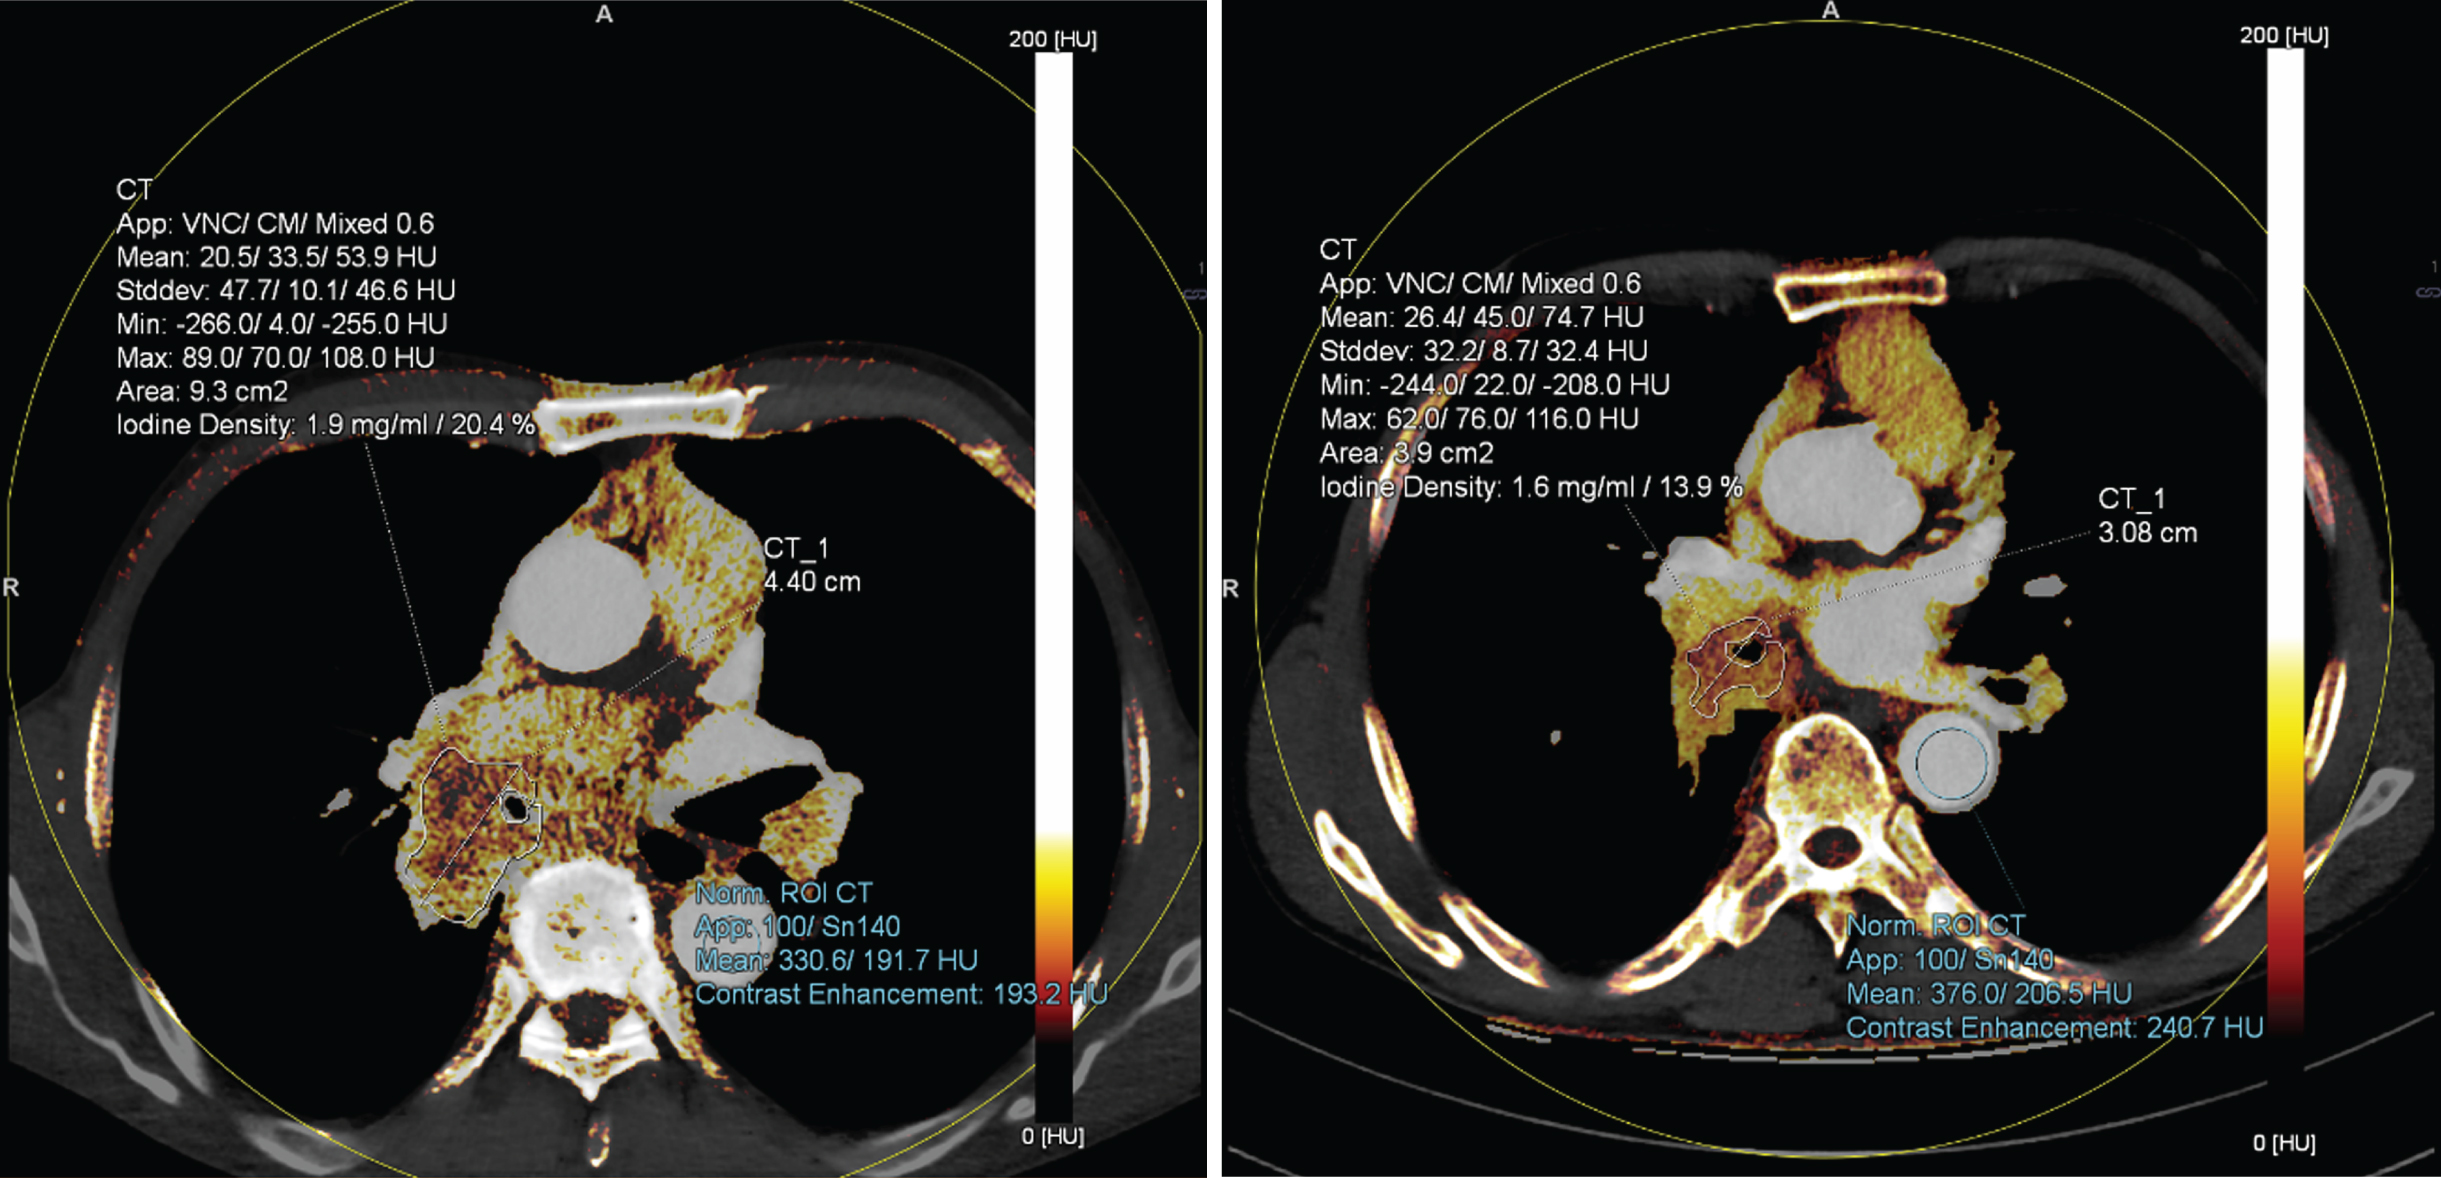
Typical case of PR. Note: 70 year old male, squamous cell carcinoma (T3N2M0, IIIA) with cCRT treatment. Before treatment, D of primary lesion was 4.4 cm, ICA was 1.9 mg/mL, after treatment, D of primary lesion was 3.1 cm, ICA was 1.5 mg/mL, D and ICA decreased by 30%and 21%, respectively, while Attenuation-A increased. Efficacy assessment was PR.

Typical case of PD. Note: 61 year old male, squamous cell carcinoma (IV) with cCRT treatment. Before treatment, D of primary lesion was 3.0 cm, ICA was 0.2 mg/mL, after treatment, D of primary lesion was 3.9 cm, ICA was 1.3 mg/mL, D and ICA increased by 30%and 550%, respectively, while Attenuation-A decreased. Efficacy assessment was PD.
Baseline Data
Note: a as continuity correction, b as Z value.
Intergroup comparison
Significant differences were found in D and ICA before and after treatment (P < 0.05). There were significant differences between before and after treatment for Attenuation-A, Attenuation-V, ICV, NICA, and NICV in group DC, however, there were no significant differences between before and after treatment in group PD (P > 0.05 or = 0.05) (Table 2, Fig. 5).
Comparison of parameters before and after treatment
Comparison of parameters before and after treatment
Note: a as t value, b as Z value.
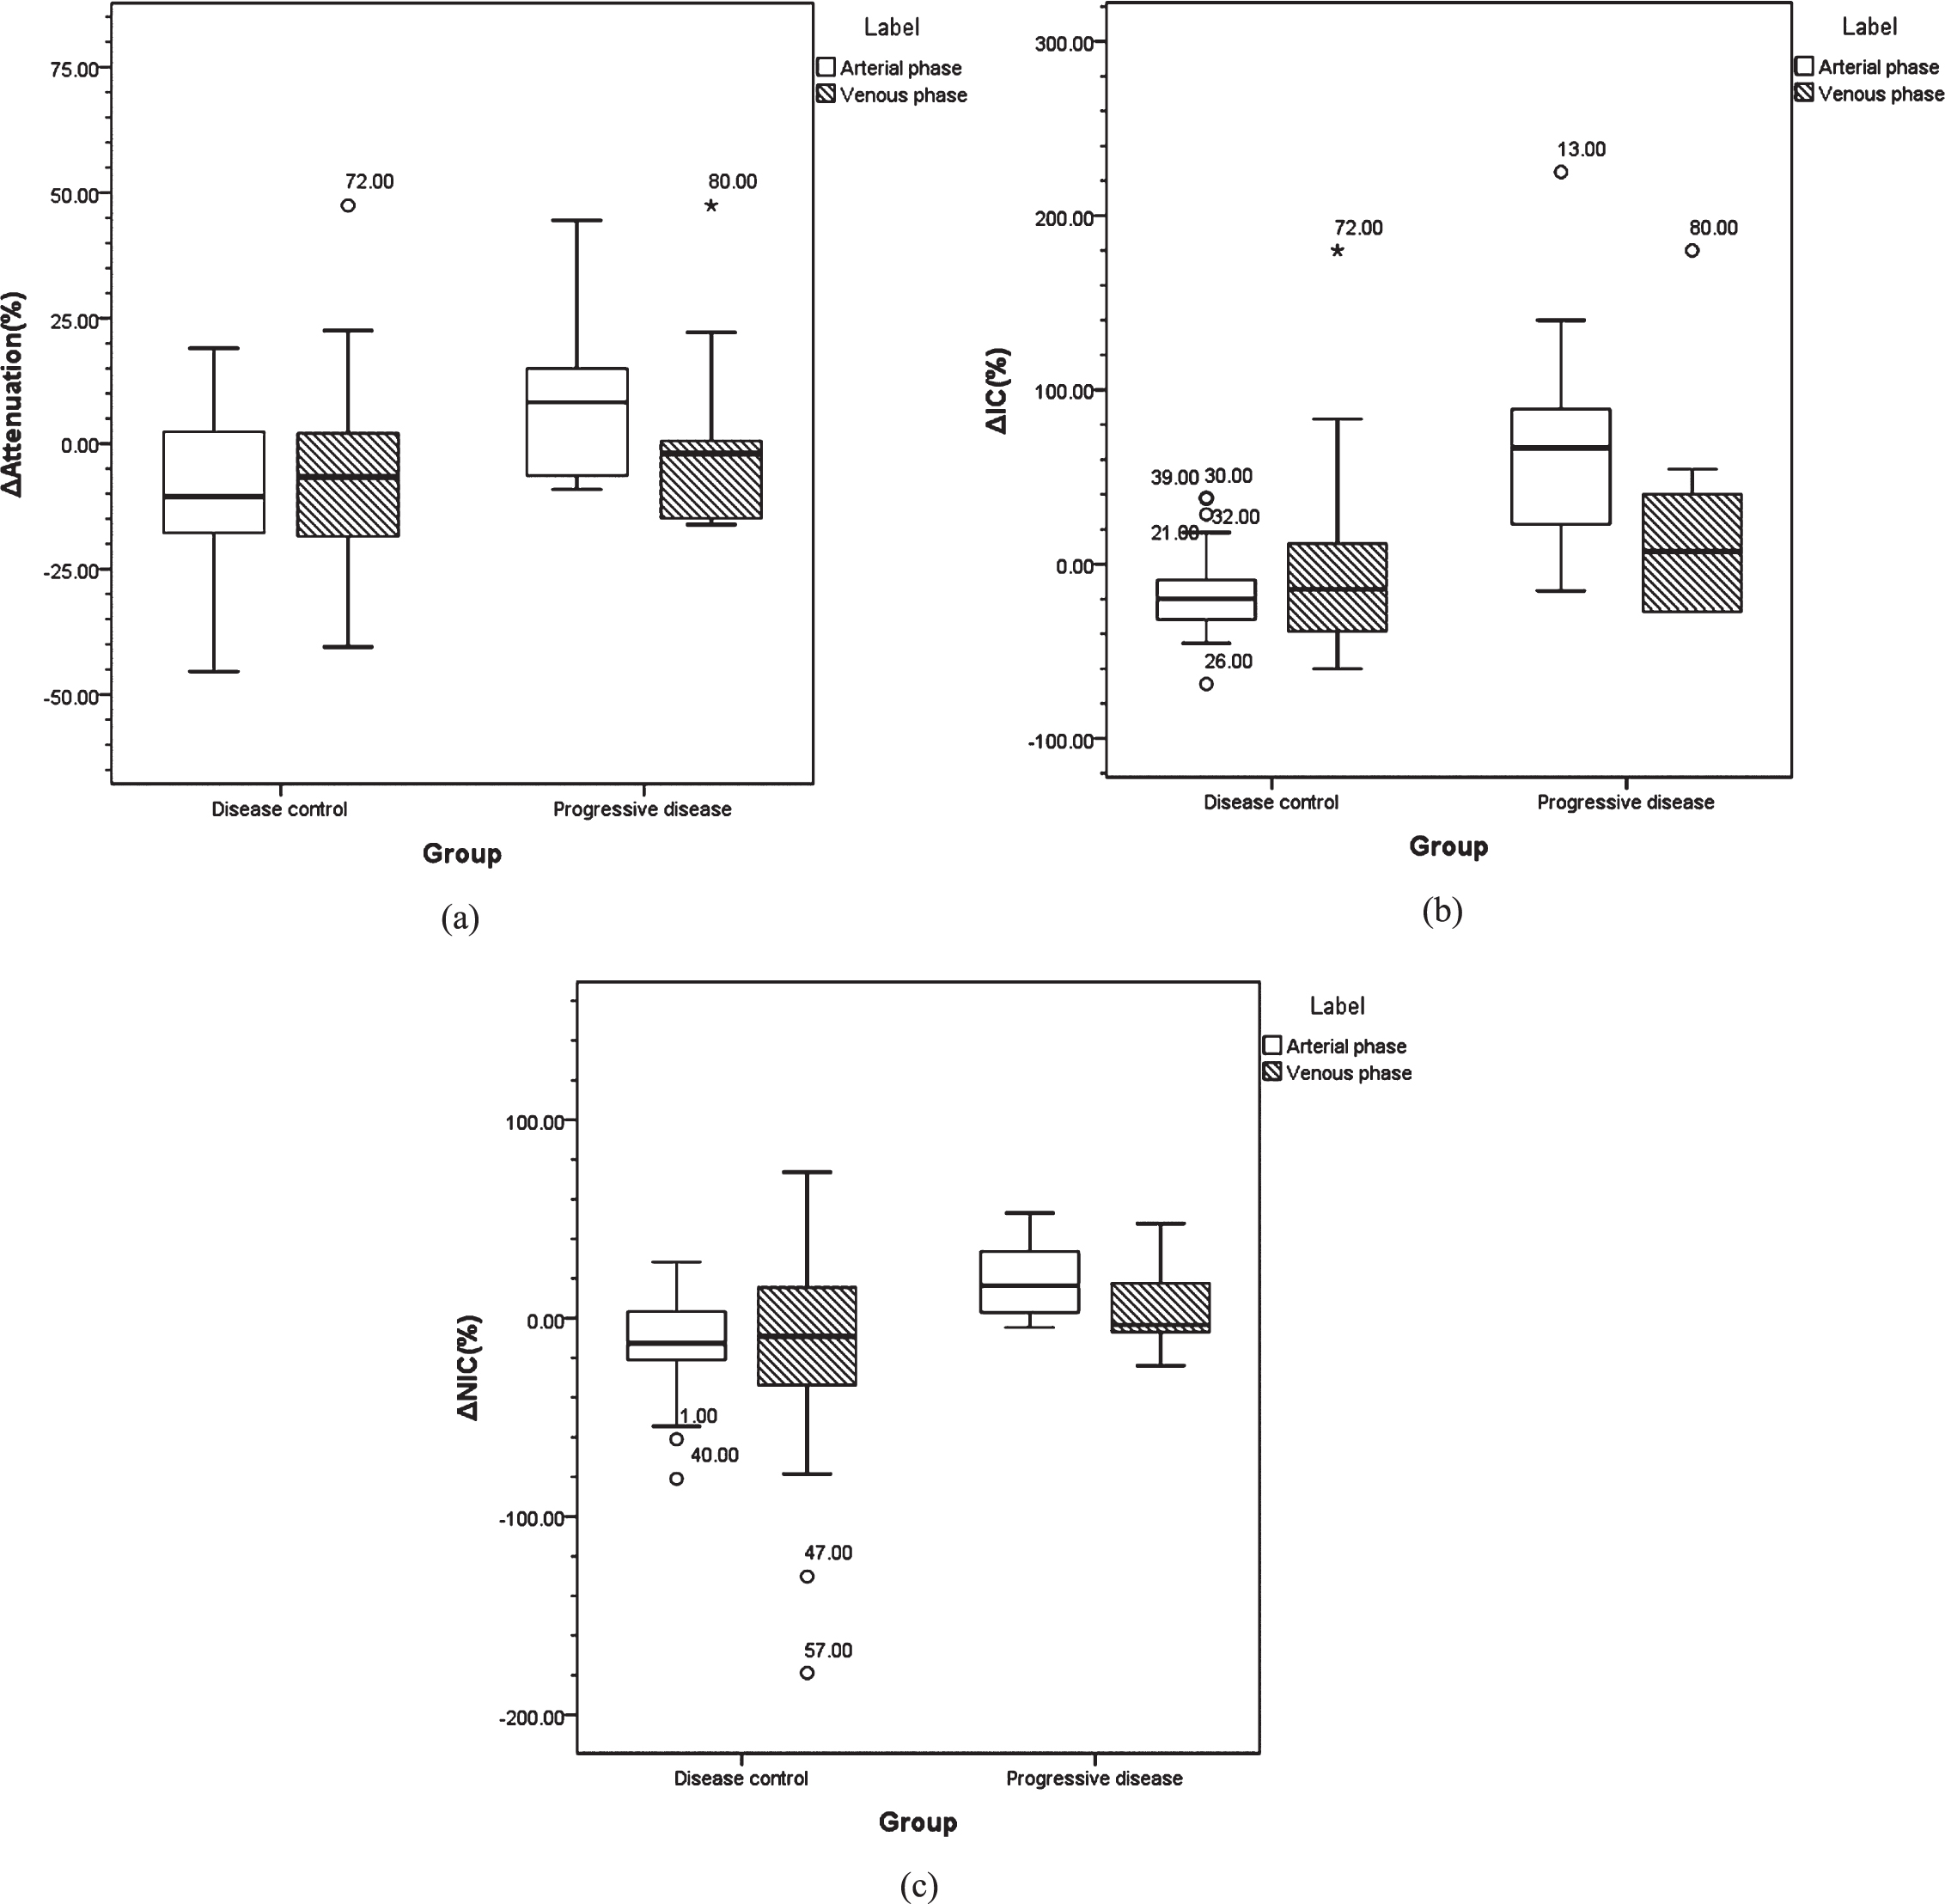
Box plots of comparison between group DC and PD. Note: The differences of Δ-Attenuation-A (a), ΔICA (b) and ΔNICA (c) for group DC and PD had statistically significant.
Before and after treatment, the total change rates of all lesions was as follows: (−3.96±23.79)%of ΔD; (−6.36±23.46)%of Δ-Attenuation-A; (−5.14±18.06)%of Δ-Attenuation-V; (−1.54±52.97)%of ΔICA; (−2.40±14.18)%of ΔICV; (−3.53±49.98)%of ΔNICA; and (−3.47±48.96)%of ΔNICV. The change rates between group DC and PD were shown in Table 3.
Comparison of change rates between group DC and PD
Comparison of change rates between group DC and PD
The Pearson correlation was used to analyze the correlation between the parameters. The results showed that the correlation was not significant between Δ-Attenuation-V and ΔD (P = 0.381), but other paired parameters correlated with ΔD (P < 0.05) (Table 4, Fig. 6).
Correlations between ΔD and other parameters
Correlations between ΔD and other parameters
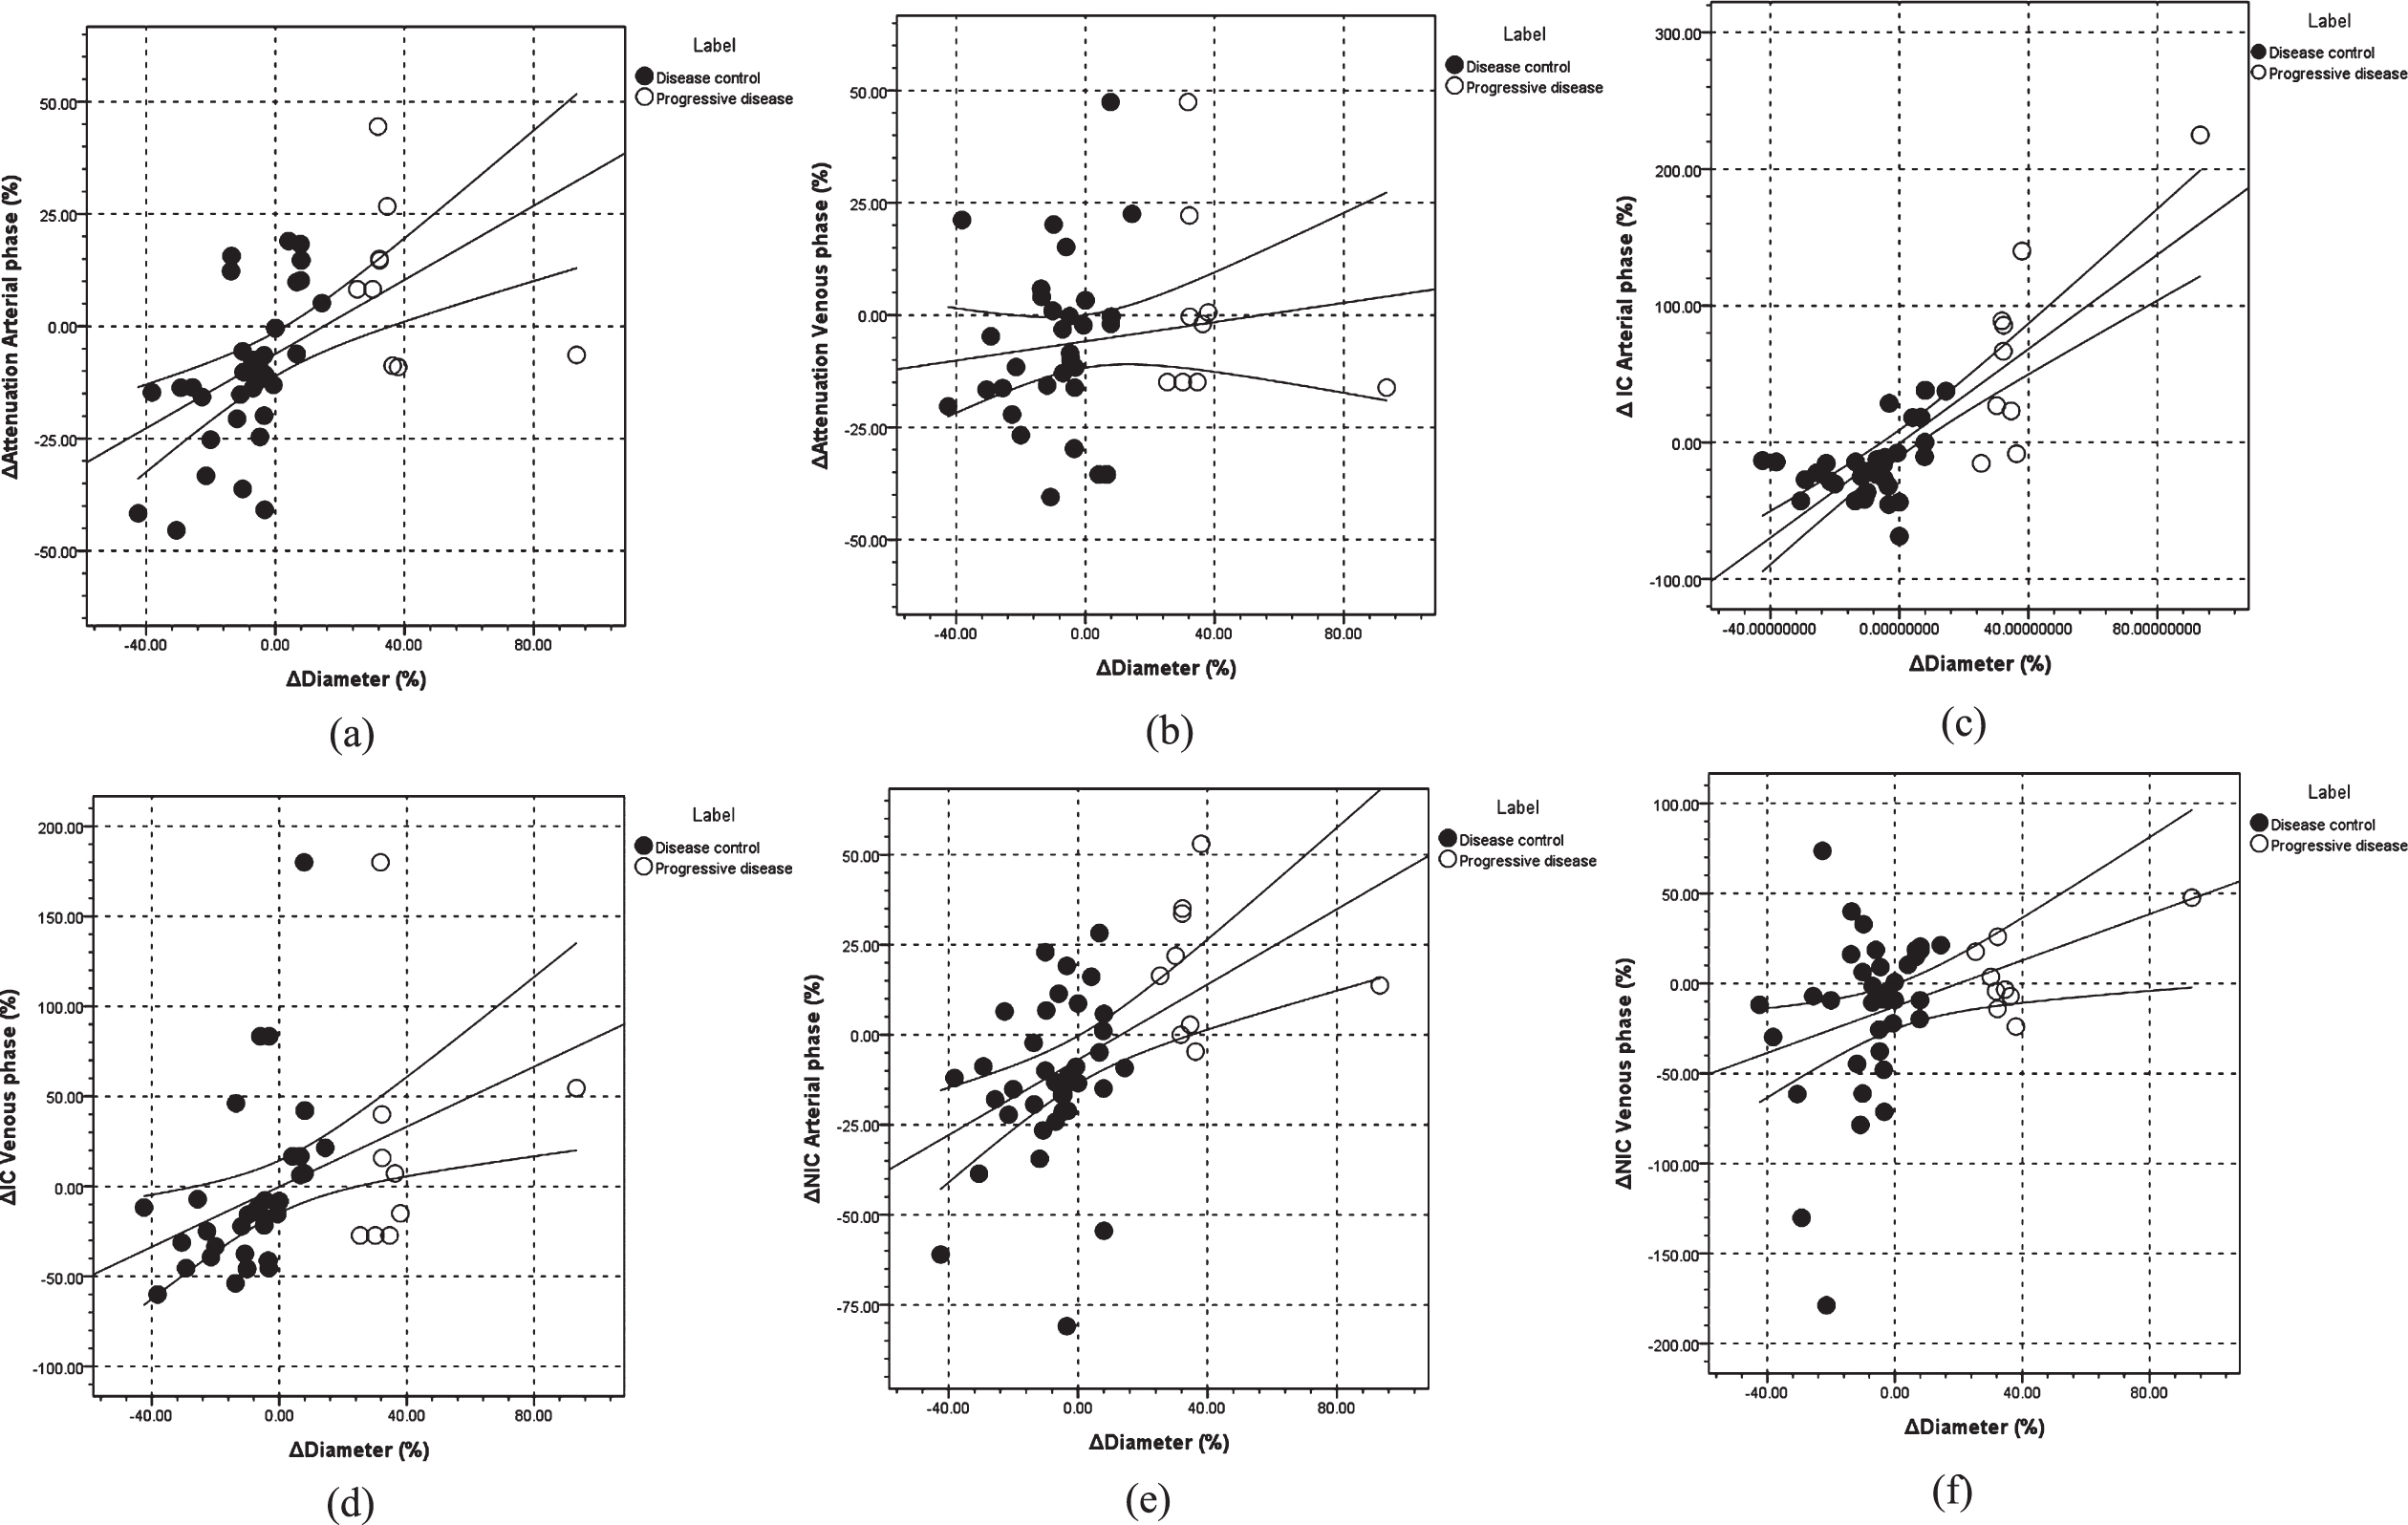
Scatter plots of correlations between ΔD and other parameters. Note: The correlations between Δ-Attenuation-A–ΔD (a, r = 0.529), Δ-Attenuation-V –ΔD (b, r = 0.134), ΔICA –ΔD (c, r = 0.793), ΔICV –ΔD (d, r = 0.390), ΔNICA –ΔD (e, r = 0.505) and ΔNICV –ΔD (f, r = 0.356).
The ROC curves for predicting PD showed that the area under the curves (AUCs) of Δ-Attenuation-A, Δ-Attenuation-V, ΔICA, ΔICV, ΔNICA, and ΔNICV were 0.796 (P = 0.006), 0.583 (P = 0.444), 0.900 (P = 0.000), 0.686 (P = 0.212), 0.880 (P = 0.000), and 0.633 (P = 0.222), respectively. Cut-off values of Δ-Attenuation-A, ΔICA and ΔNICA were 9.0961, –15.6923, –4.75690, respectively (Fig. 7).
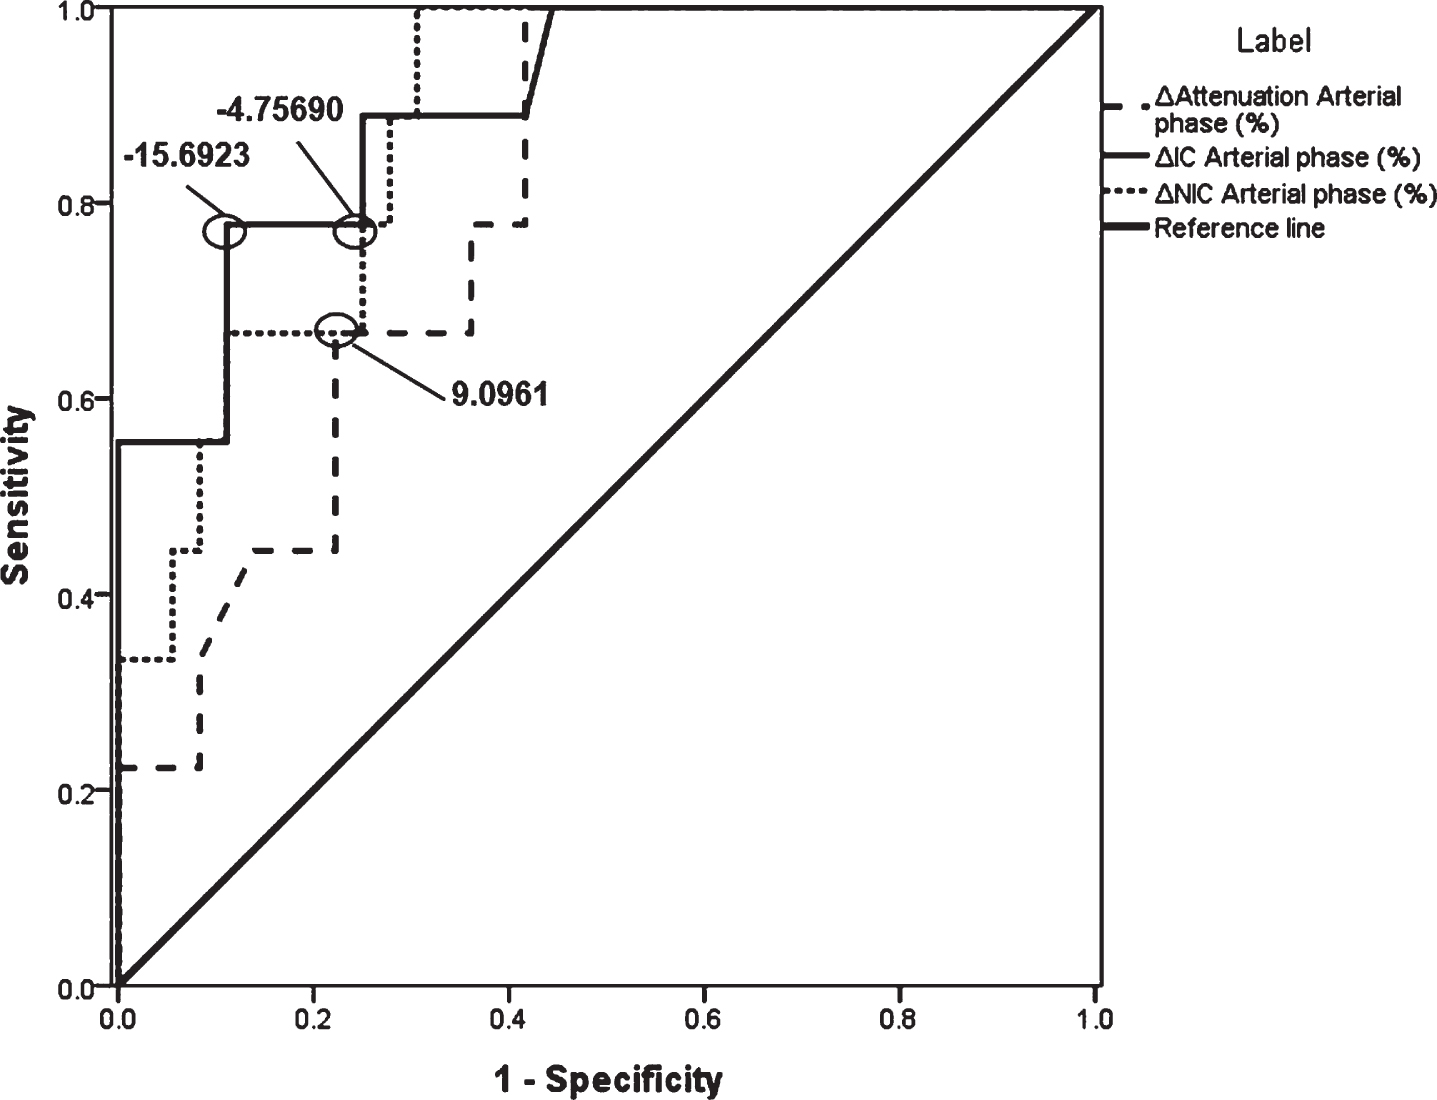
ROC curves. Note: ROC curves for predicting PD (first efficacy assessment) showed AUCs of Δ-Attenuation-A, ΔICA and ΔNICA. Cut-off values of Δ-Attenuation-A, ΔICA and ΔNICA were 9.0961, –15.6923, and –4.75690, respectively.
DLP was 479.00±63.08 mGy
Discussion
In this study, except for Δ-Attenuation-V, other parameters of lung cancer lesions (Δ-Attenuation-A, ΔICA, ΔICV, ΔNICA, and ΔNICV) correlated with ΔD; among these, ΔICA strongly correlated with ΔD and Δ-Attenuation-A and ΔNICA moderately correlated with ΔD. In addition, compared with other parameters, the change of ΔICA might be more obvious to indicate the progressive disease. The ROC curves showed that the accuracy of ΔICA in assessing DC or PD was 90%(P = 0.000) using the RECIST criteria [5]. Therefore, Δ-Attenuation-A, ΔICA, and ΔNICA might be more appropriate in reflecting the changes in tumor components and perfusion. This suggested that Δ-Attenuation-A, ΔICA, and ΔNICA could be used as effective complementary parameters to reflect the therapeutic efficacy of lung cancer, especially ΔICA.
At present, the RECIST criteria are widely used to assess the therapeutic efficacy of lung cancer based on the changes in the tumor length before and after treatment [5, 16]. James et al. [17] found that the tumor length was closely related to the tumor cell number, in line with the RECIST criteria. However, the RECIST criteria had some limitations in assessing the therapeutic efficacy of lung cancer because the tumor morphology and composition did not change uniformly and regularly in the treatment process, leading to inaccurate measurement of the actual tumor length [18]. In addition, the morphological change was not a sensitive marker in reflecting the therapeutic efficacy in the early stage. Therefore, accurate and early information on therapeutic efficacy may not be obtained by just relying on the length change of the tumor [6]. On the contrary, Toepker et al. [19] used the attenuation of single-energy enhanced CT to assess the efficacy for patients with liver cancer. The results showed that the attenuation was not sensitive to the assessment of early efficacy because of the interference from water, air, tumor, and so on, affecting the stability of density measurement. Lung cancer is an angiogenesis-dependent disease, and IC, which reflects the blood flow status of the tumor, is a potential marker for efficacy monitoring [20]. Fehrenbach et al. used the dual-energy CT iodine map to assess patients with NSCLC receiving cCRT. They found that the IC was helpful in predicting tumor progression and identifying metastatic lymph nodes [12].
At present, CT perfusion (CTP) and positron emission tomography/computed tomography (PET/CT) are the main techniques to reflect the hemodynamic changes in lung cancer. CTP is a functional imaging technique based on a tracer dynamics algorithm, which reflects tumor functional information using blood perfusion parameters. Sun et al. [21] assessed 50 patients with gastric cancer and found that CTP could accurately assess the efficacy of gastric cancer by reflecting the change in blood flow. Klauss et al. and Bao et al. [22, 23] showed good consistency between IC and CTP parameters on the iodine map. PET/CT, as a technique reflecting tumor metabolism and activity, was the best reference standard of functional assessment. Ordu et al. showed that the metabolism of lung cancer had obvious changes before and after treatment [24]. The maximum standard uptake value (SUVmax) was a common parameter of PET/CT for accurate quantitative analysis. The results showed that metabolism and morphology had the same effect in predicting the medium-term and long-term efficacy. Also, functional parameters were very sensitive for efficiency assessment [25]. Schmid-Bindert et al. [25] showed that in any primary lung cancer, a moderate correlation existed between the IC of DECT and SUVmax of PET/CT (r = 0.507), but a strong correlation (r = 0.876) existed when the examination interval was less than 21 days. Thus, compared with CTP and PET/CT, the IC accurately reflected the tumor blood flow and could be measured quantitatively, so as to objectively explain the potential tumor neovascularization [26]. IC provided evidence of blood perfusion and might be used as a complement to the assessment system (RECIST criteria). In addition, the DECT iodine map was safer and more economical than CTP and PET/CT, and the morphology and enhancement effect of traditional enhanced CT could be provided using a linear fusion technique. These results suggested that the DECT iodine map had potential suitability for clinical practice.
This study had some limitations. (1) The sample size of this study was small, affecting the statistical inference. (2) Selection bias in the efficacy assessment of lung cancer might be present. The different pathological types led to different treatment options or blood perfusion [10, 28], influencing the universality and regularity of assessment in clinical application. (3) The RECIST criteria were based on morphological measurement, while the short-term efficiency assessment was based on the tumor size. Therefore, as the gold standard, size should not be compared and analyzed with other parameters after quantification.
The Dual-Energy CT iodine map could accurately and effectively help in the efficacy assessment of non-small cell lung cancer by measuring and calculating iodine content, thus providing a new method for clinical monitoring and assessment.
Footnotes
Acknowledgments
None.
Funding
This work was supported by Natural Science Foundation of Inner Mongolia (grant number 2017MS0893 and 2017MS0895) and General Scientific Research of Inner Mongolia Medical University Affiliated Hospital (grant number NYFY YB035).
Conflict of Interest
The authors declare that they have no conflict of interest.