
Abstract
OBJECTIVE:
To assess reliability of cone-beam CT (CBCT) for nasolabial soft tissue measurements in patients with skeletal class III malocclusion based on 3-dimensional (3D) facial scanner results.
METHODS:
CBCT and 3D facial scan images of 20 orthognathic patients are used in this study. Eleven soft tissue landmarks and 15 linear and angular measurements are identified and performed. For qualitative evaluation, Shapiro-Wilk test and Bland-Altman plots are applied to analyze the equivalence of the measurements derived from these two kinds of images. To quantify specific deviation of CBCT measurements from facial scanner, the latter is set as a benchmark, and mean absolute difference (MAD) and relative error magnitude (REM) for each variable are also calculated.
RESULTS:
Statistically significant differences are observed in regions of nasal base and lower lip vermilion between two methods. MAD value for all length measurements are less than 2 mm and for angular variables < 8°. The average MAD and REM for length measurements are 0.94 mm and 5.64%, and for angular measurements are 2.27° and 3.78%, respectively.
CONCLUSIONS:
The soft tissue results measured by CBCT show relatively good reliability and can be used for 3D measurement of soft tissue in the nasolabial region clinically.
Introduction
Cephalometric measurement and analysis serve as an indispensable part in clinical diagnosis and treatment of dento-maxillofacial deformities for orthodontics as well as orthognathic surgeons. Traditional 2-dimensional (2D) radiological imaging such as lateral and posteroanterior radiography have been widely used in the clinic. As imaging techniques and associated tools continue to mature, the application of 3D images in cephalometry has been put on the agenda [1–5].
Cone-beam computed tomography (CBCT) is developed specially for the treatment of oral and maxillofacial diseases, whose wide application is attributed to the advantages such as low radiation dose, low cost and strong interactivity [6–8]. But its use in cephalometry for the treatment of dento-maxillofacial deformities is still in infancy [9]. Digital-assisted orthognathic surgery using CBCT is a relatively mature technique recently, but the simulation is limited to the postoperative morphology of bony tissue, and soft tissue simulation remains far out of reach [10–12]. For one, CBCT was originally designed to investigate cranio-maxillofacial skeletal features and therefore had low recognition power for soft tissues. For another, the lack of relevant studies affirming the soft tissue measurement capability of CBCT makes it less applicable in the clinic for soft tissue analysis, which are the major issues currently. Therefore, the postoperative prediction of soft tissue changes is regarded as one of the current difficulties by scholars and the utmost concern to patients [13–15].
The prediction of soft tissue changes is dependently based on the precise measurement of their morphological characteristics, which has been made possible by the development of 3D imaging techniques. Facial scanner is a well-established device currently used in the clinic, which can record the texture and characteristics of facial skin three-dimensionally, leading clinicians to be increasingly accurate in studying changes in facial soft tissue before and after treatment. Commonly used are 3DMD, Morpheus 3D, etc., and their precision and accuracy have been verified by previous studies [16–19]. Nevertheless, facial scanner can only record the morphology of soft tissues, which needs to be fused with CBCT when to explore the relationships and ratios of soft and hard tissues [20, 21], thus possibly bringing the technical error when the two data fuse, which in turn affects the measurement results, and soft tissues imaged by CBCT avoid this problem [22].
Three-dimensional cephalometric technique based on CBCT is one of the hot topics in orthodontic and orthognathic clinical research in recent years [23–25]. Traditionally, cephalometric measurements involve both soft and hard tissues. There is no doubt about the ability of CBCT for hard tissue measurements, whereas its ability to measure soft tissue morphology involves fewer studies to date. Precise measurement of the morphological structure of soft and hard tissues is fundamental to the development of 3D cephalometric techniques, and thus deserve intensive study.
The objective of this study, therefore, is to qualitatively analyze whether CBCT reconstructed facial soft tissue models show statistically significant differences compared with 3D facial scanner when is used for soft tissue morphometry. Meanwhile, using 3D facial scanner measurements as a benchmark, to quantitatively analyze the degree of specific deviation of the CBCT measurement variables, so as to provide reference and guidance for the clinical application of CBCT in soft tissue measurement and 3D cephalometric analysis, and finally promote the clinical use of CBCT.
Materials and methods
Samples selection
This study was carried out at the Department of Stomatological Hospital of Chongqing Medical University, China after the ethical approval and study protocol was approved (NO. CQHS-REC-2021001). Written informed consent for the participation in the study has been obtained from all subjects. We confirm that all methods were performed in accordance with the relevant guidelines and regulations.
The CBCT and 3D facial scan images of 20 orthognathic patients (ten women) were used. Two types of image were taken at the same time for diagnostic purposes. All patients underwent the same surgery procedure-maxillary Le Fort I osteotomy and mandibular bilateral sagittal splint ramus osteotomy to treat skeletal class III malocclusion, which were performed by a same surgeon from the above hospital. Patients with congenital syndromes, systematic diseases, cleft lip /palate, temporomandibular joint disorder or facial trauma were excluded.
Data acquisition
CBCT (KaVo Dental Gmb H, USA; 80 mA, 8.9-second scan time) scans were acquired at a 0.4 mm* 0.4 mm* 0.4 mm voxel size level and set at a matrix of 400×400 pixels in each CT slice and a 0.25 mm slice thickness. The CBCT data were then stored into a specialized computer in Digital Imaging and Communications in Medicine (DICOM) format, and were converted in to 3D models for measurement with a 3D reconstruction software, Mimics 19.0, (Materialise, Leuven, Belgium). To obtain the optimal facial soft tissue models, the threshold values for Hounsfield units(HU)were set as –718 to –177 HU and smooth procedure was performed. After these processes, the 3D facial soft tissue images reconstructed by CBCT were obtained.
The facial scanner Morpheus 3D (Morpheus, Gyoung-gi, Korea) was used for 3D facial surface scan, which emitted white structured light to the patient and fine texture of facial skin can be obtained. Other parameters of this device included a scan time of 0.8 seconds, a scan accuracy of 0.1mm and an image resolution of 1024×768 ppi. After scanning process, the images were then auto-synthesized by the MDS software of the device (Morpheus, Gyoung-gi, Korea), and the 3D facial scan models were obtained.
Variables measurement
Eleven soft tissue landmarks and 15 linear and angular measurement variables were used in this study (Figs. 1 2 and Table 1). Landmarks location was performed in CBCT model and 3D facial scan models respectively using a mouse-driven graphics cursor in 3D view and variables measurement was carried out using the linear and angular tools of Mimics and MDS software tool. All variables were measured twice in two-week interval by the first author, and the mean of the two measured values was used for final statistical analysis. As a measure of reliability of the study data, the intra-class correlation (ICC) analysis was performed at 95%confidence intervals. Intra-observer reliability was determined by comparison of the repeated measurements of the first author. To assess the inter-observer reliability, a comparative analysis of the measurements of the first two authors was performed.

Soft tissue landmarks and measurement variables in CBCT model.

Soft tissue landmarks and measurement variables in facial scanner.
Definition of landmarks and measurements in this study
PC, the philtrum crest; UL, the upper lip; LL, the lower lip; UM, the upper mouth; LM, the lower mouth; CB, the Cupid’s bow.
Data of this study were analyzed using SPSS 26.0 software (IBM Co., Armonk, NY, USA) and MedCalc Software (version 20.009, Ostend, Belgium) For qualitative evaluation, the Shapiro-Wilk Test was applied to analyze the distribution characteristics of the data and the Bland-Altman plots was used to analyze the equivalence between measurements derived from these two kinds of model. To determine the equivalence of the 2 methods, the line of equality (difference = 0) must contain entirely within the 95%confidence interval of their mean difference. To quantify specific deviation of CBCT measurements from facial scanner, the results of the latter were set as a benchmark and mean absolute difference (MAD) and relative error magnitude (REM) for each variable were calculated. The calculation was performed as follows:
Results
The high ICC value (95%confidence interval ranging from 0.894 to 0.913 for intra-observer and 0.897 to 0.915 for inter-observer) indicated good reliability in this study, and the Shapiro-Wilk Test results showed that the data fit a normal distribution. Table 2 shows linear and angular measurement results of the facial scanner and CBCT respectively.
Measurement results of CBCT and facial scanner
Measurement results of CBCT and facial scanner
L, the left side; R, the right side; PC, the philtrum crest; UL, the upper lip; LL, the lower lip; UM, the upper mouth; LM, the lower mouth; CB, the Cupid’s bow; FS, facial scanner.
In Table 3 and Figs. 3–5, Bland-Altman plots show the difference between the mean of linear and angular measurements of CBCT and facial scanner in each variable. According to the results, there are statistical differences between facial scanner and CBCT in the variables of the length of philtrum crest on both sides, width of mouth, the protrusion angle of the lower lip, angle of upper mouth on the left side and the nasolabial angle.
Equivalence analysis of measurements between CBCT and FS
L, the left side; R, the right side; PC, the philtrum crest; UL, the upper lip; LL, the lower lip; UM, the upper mouth; LM, the lower mouth; CB, the Cupid’s bow; FS, facial scanner; N, NO; Y, YES.

Bland-Altman plots showing the difference between the mean of linear measurements of CBCT and facial scanner in each variable. (

Bland-Altman plots showing the difference between the mean of angular measurements of CBCT and facial scanner in each variable. (
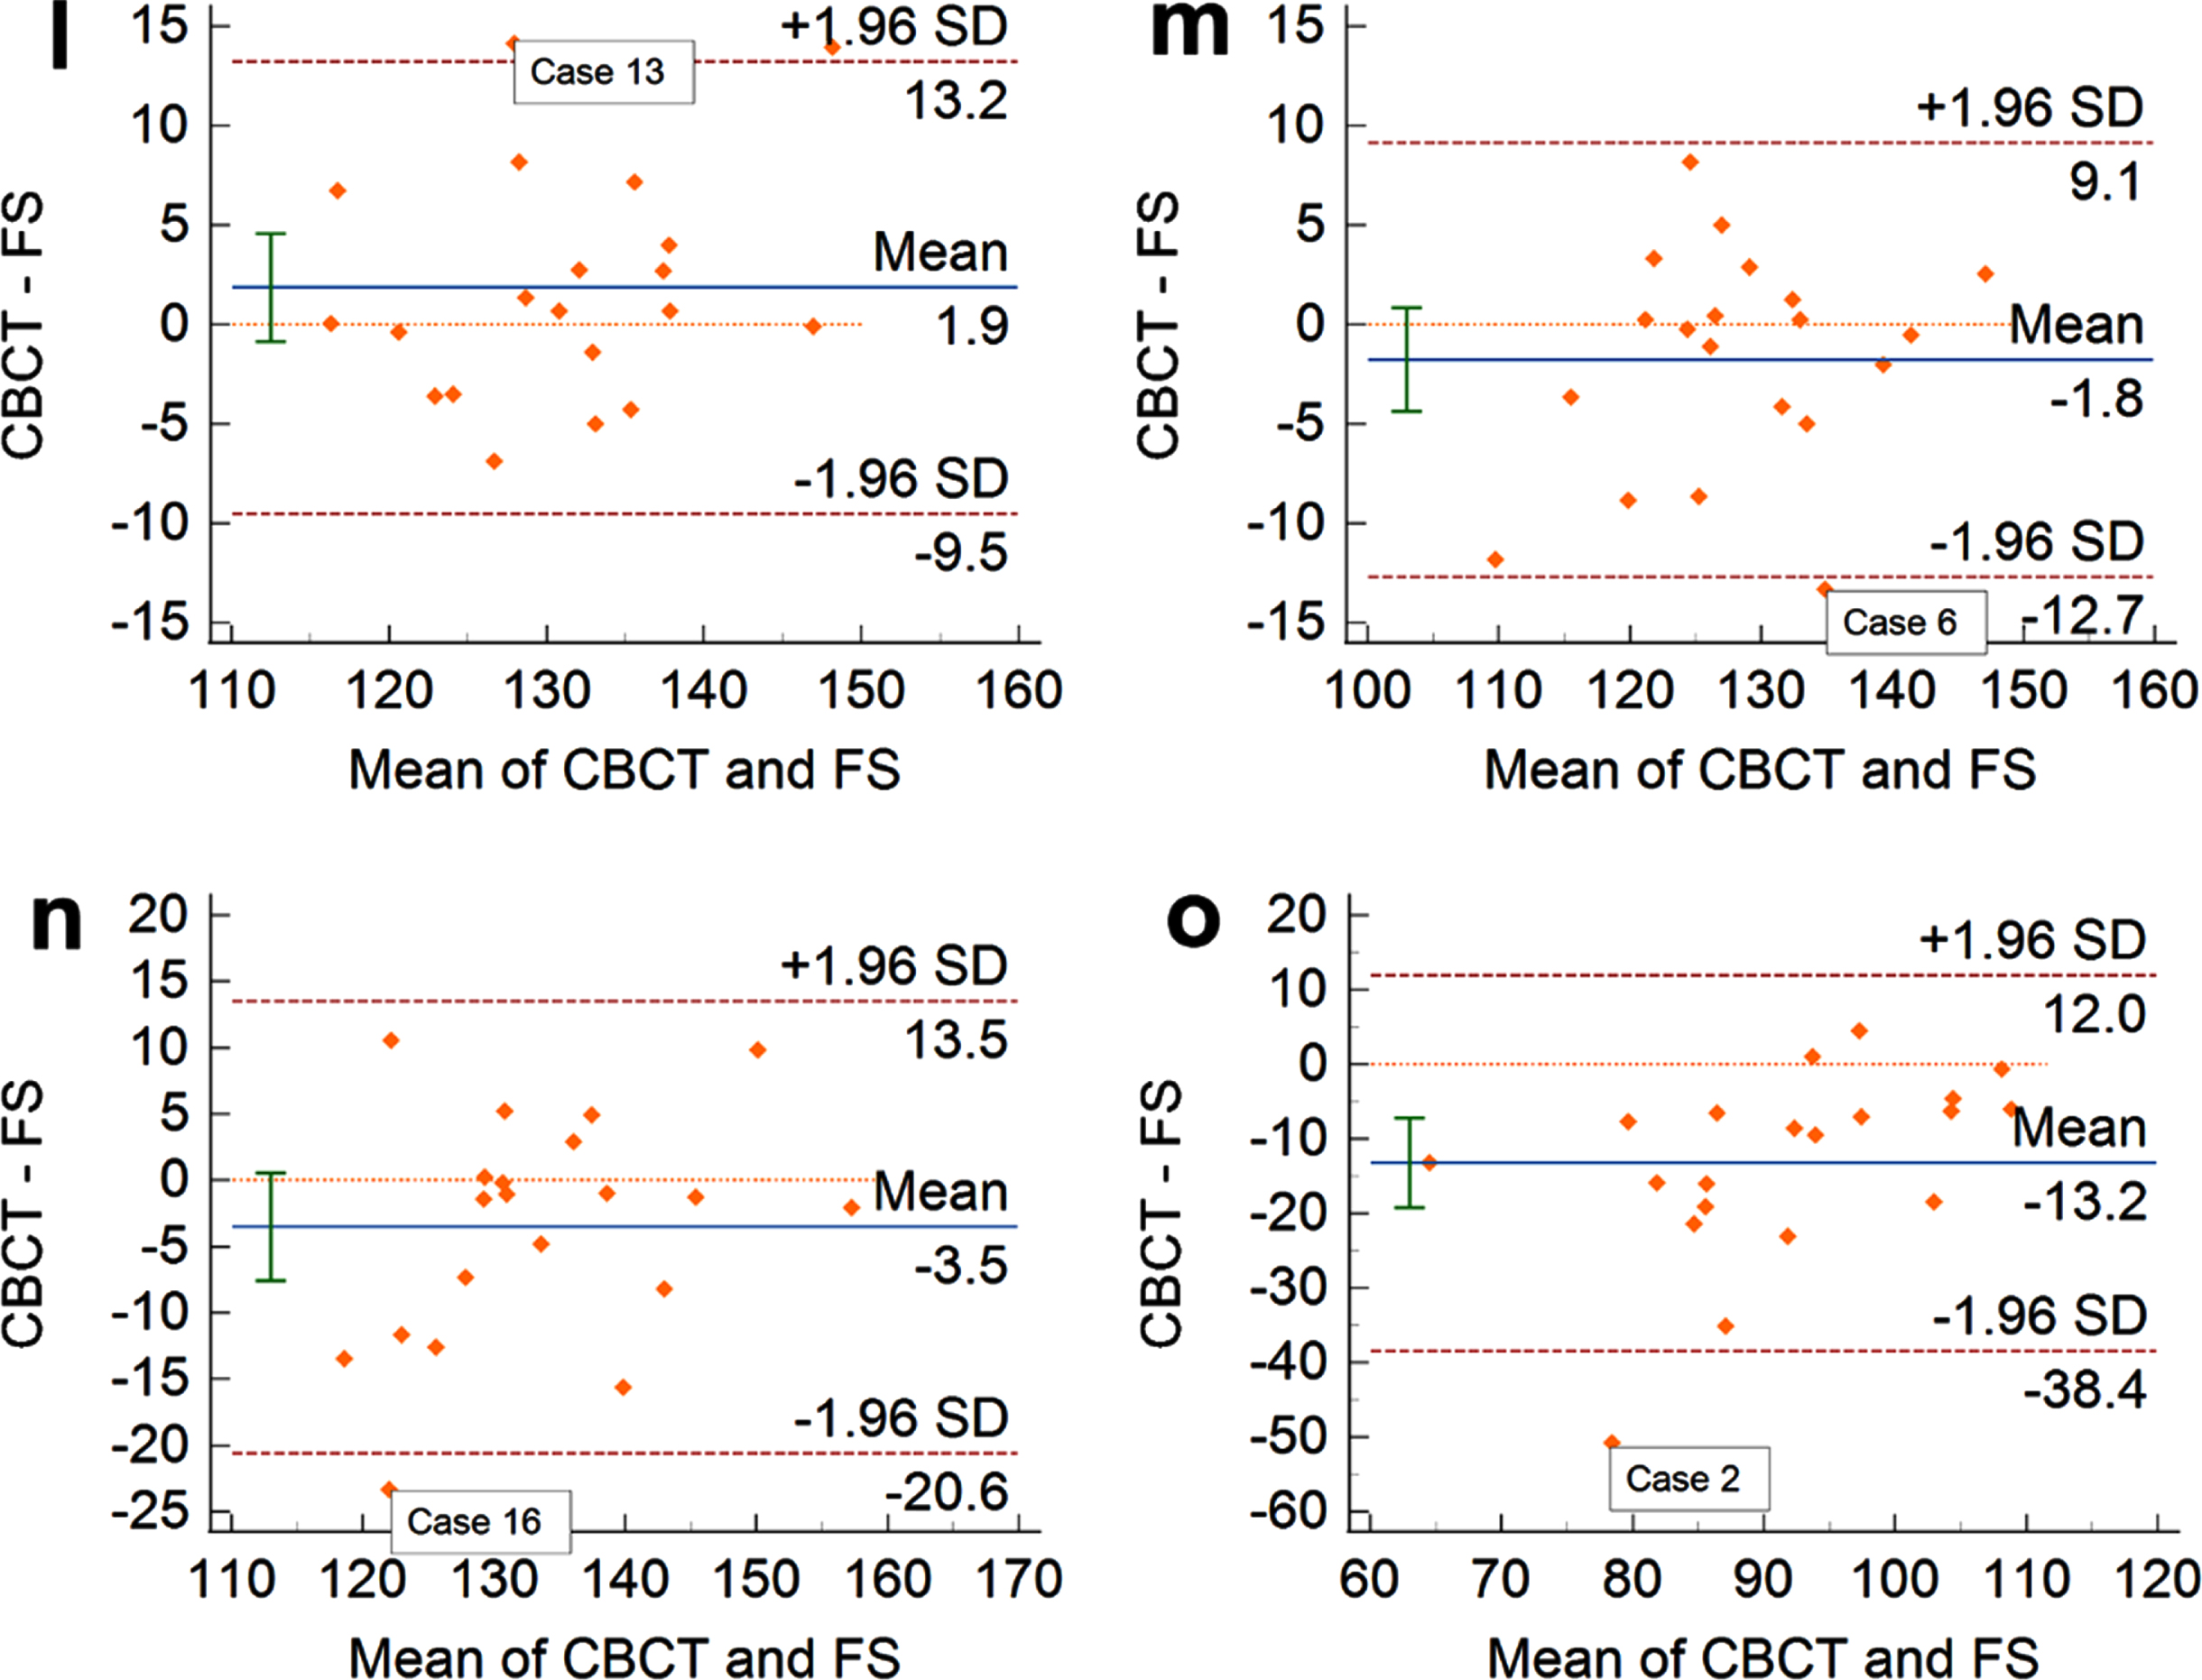
Bland-Altman plots showing the difference between the mean of angular measurements of CBCT and facial scanner in each variable. (
The quantitative analysis results of linear and angular measurement differences between facial scanner and CBCT are shown in Tables 4 5. For linear measurements, the average MAD was 0.94 mm and the average REM was 5.64%, and the larger differences manifested in the length of bilateral philtrum crests and the width of the mouth (MAD > 1 mm). For angular measurements, the average MAD was 2.27° and the average REM was 3.78%, and the larger differences exhibited in the protrusion angle of the lower lip and the nasolabial angle (MAD > 7°).
Linear measurement deviation of CBCT from facial scanner
L, the left side; R, the right side; PC, the philtrum crest; UL, the upper lip; LL, the lower lip; MAD, mean absolute difference; REM, relative error magnitude; SD, standard deviation.
Angular measurement deviation of CBCT from facial scanner
L, the left side; R, the right side; UL, the upper lip; LL, the lower lip; UM, the upper mouth; LM, the lower mouth; CB, the Cupid’s bow; MAD, mean absolute difference; REM, relative error magnitude; SD, standard deviation.
In this study, 20 CBCT and 3D facial scan data of skeletal class III patients were combined to explore the reliability of CBCT for soft tissue measurements, and the nasolabial region was selected as the research structure. One consideration was based on the special structure of this region- vermilion mucosa and the skin [26]. Since the two structure cannot be distinguished on CBCT images, we sought to explore how accurate the measurements of CBCT are for that, and whether it has an impact on clinical use. The second was its diverse morphological measurements, including the length, angle and symmetry in 3D space, which can cover feature measurements of many areas of the face [27, 28].
The results of qualitative evaluation showed that the difference between CBCT and facial scanner in measuring nasolabial structures mainly manifested in the length of philtrum crest on both sides, width of mouth, the protrusion angle of the lower lip, angle of upper mouth on the left side and the nasolabial angle. Maal et al. [29] reported that 90%of soft tissues reconstructed by CBCT showed no difference when matched with 3D facial photographs, and the remaining 10%were affected by head position and facial expression at the process of image acquisition. In the present study, statistically significant differences were mainly centered on structures located at nasal base and lower lip, involving bilateral philtrum length and nasolabial angle in the upper lip and the protrusion angle of lower lip. Due to the complex concave characteristics of the nasal base, the accuracy of the landmarks located in this region is compromised [17]. In contrast, landmarks at the junction of the vermilion and skin of the upper lip are easier to identify because of their well-defined characteristic structures like the Cupid’s bow. The accuracy of measurements of the lower lip is mainly affected by the Li-point, which was defined as the midpoint of the vermilion border of the lower lip by Wong et al [30]. Given the reality that the boundary between the vermilion and the skin is not clear on CBCT and the absence of explicit contour structure like the upper lip, thus making its positioning with suboptimal accuracy.
On quantitative analysis, the mean absolute difference in length measurements of CBCT for all variables were less than 2 mm. In the literature, scholars [31, 32] reported that clinically acceptable deviations of soft tissue measurements were ranging from 1–3 mm according to the number of landmarks utilized. In this experiment, variables with relatively obvious deviation were the length of bilateral philtrum crests and the oral width, but none of them exceeded 2 mm, thus can be considered as no impact on clinical use. For angular measurements, the deviation of protrusion angle of lower lip and nasolabial angle were both > 7°, but were still classified as good measurements [33, 34]. For one thing, the angle measurements involve more landmarks, so the corresponding error becomes larger inevitably. For another, according to findings by Andrade et al. [32], the deviation of 3D tools in measuring concave surface structure is relatively large, such as nasolabial angle and mentolabial angle. Patients with skeletal Class III have a smaller nasolabial angle due to insufficient maxillary development, which makes the measurement of this area more difficult. Therefore, in clinical use, one should pay much attention to control the technical error of this region, such as locating the landmarks with a multidimensional view and taking the mean value of multiple measurements.
In summary, when returning to our original intention, we found that although certain inconformity exists in regions of nasal base and lower lip vermilion between CBCT and facial scanner in measuring nasolabial surfaces, these differences were considered as clinical acceptable from view of orthodontists and orthognathic surgeons. When CBCT has only been used to study hard tissue characteristics in today’s clinic, our study shows its great promise in the field of soft tissue research as well. Thus, our study can be regarded as a preliminary study regarding the ability of CBCT to measure facial soft tissue features, future studies are still needed to explore other areas of the face. After all, the face is a large and complex region.
Footnotes
Acknowledgments
This work was supported by Medical Research Key Project of Chongqing Science and Technology Commission and Health and Family Planning Commission Joint (Grant number 2018ZDXM020).
Competing interests
The authors declare that they have no competing interests.