
Abstract
BACKGROUND:
In vertebrae, the amount of cortical bone has been estimated at 30–60%, but 45–75% of axial load on a vertebral body is borne by cortical bone.
OBJECTIVE:
To compare the role of L1 CT-attenuation and cortical thickness in predicting osteoporosis by opportunistic CT and explore cortical thickness value in osteoporosis.
METHODS:
We collected data of 94 patients who underwent DXA and thoracic and/or abdominal CT to demonstrate an entire L1 for other indications in routine practice. Patients were divided into three groups according to T-score: osteoporosis, osteopenia, or normal. CT-attenuation value and cortical thickness of L1 were measured. ANOVA analysis was utilized to analyze CT-attenuation and cortical thickness among the three groups. Sensitivity, specificity, and area under the curve (AUC) predicting low BMD were determined using ROC. Pearson correlations were employed to describe relationship between L1 BMD and CT-attenuation value, BMD, as well as cortical thickness.
RESULTS:
The mean cortical thickness was 0.83±0.11, 0.72±0.10, and 0.64±0.09 mm for normal, osteopenia, and osteoporotic subgroups, respectively. A statistically significant difference was observed in cortical thickness and CT-attenuation value among these three subgroups. A mean CT-attenuation value threshold of > 148.7 yielded 73.0% sensitivity and 86.0% specificity for distinguishing low BMD from normal with an AUC = 0.83. Pearson correlation analysis indicated that BMD was positively correlated with CT-attenuation (r = 0.666, P < 0.001) and cortical thickness (r = 0.604, P < 0.001).
CONCLUSIONS:
L1 CT-attenuation and cortical thickness measured on opportunistic CT can help predict osteoporosis. Compared with cortical thickness, CT-attenuation is a more sensitive and accurate index for distinguishing low BMD from normal.
Keywords
Introduction
Osteoporosis is a systemic skeletal disease defined as low bone mass and microarchitectural deterioration of bone tissue, with a consequent increase in bone fragility and susceptibility to fracture [1]. Christiansen et al. reported that mechanical contributions of the cortical and trabecular compartments contribute to differences in age-related changes in vertebral body strength in men and women assessed by QCT-based finite element analysis, whereas women lost bone mass and bone strength in both the cortical and trabecular compartments with age [2]. Besides, cortical bone constitutes 80% of skeletal mineralized bone volume [3]. In vertebrae, the amount of cortical bone has been estimated at 30–60%, but 45–75% of axial load on a vertebral body is borne by cortical bone [4]. In laboratory studies, fracture load decreased by only 7% after removing trabecular bone from femoral neck, indicating that cortical bone contributes over 90% to fracture load and bone strength [5]. Besides, Ritzel H et al. determined that osteoporosis results in loss of spinal bone mass, which is a loss of trabecular structure and cortical thickness [6]. As a result, in this study, the attention is provided to cortical bone and cortical thickness.
Dual x-ray absorptiometry (DXA) is currently the most widely used screening tool for osteoporosis and the preferred approach for bone mineral density (BMD) measurement [7]. However, DXA cannot distinguish between cortical and trabecular bone. In addition, DXA-derived values are influenced by the structures surrounding the spine and degenerative changes [8]. Recent research indicates that measurements obtained from routine CT examinations performed for chest or abdomen for various indications may detect reduced BMD without additional radiation exposure or expense to patients [9–11]. Consequently, opportunistic screening is particularly promising for identifying individuals with low BMD who are at risk of spinal fractures [12]. However, they did not consider cortical bone or cortical thickness, which is critical for bone strength.
Therefore, this study aimed to compare the role of L1 CT-attenuation and cortical thickness in predicting osteoporosis by opportunistic CT and evaluate cortical thickness value in osteoporosis.
Methods
Patients
The institutional review board approved this retrospective study, and the need for obtaining signed informed consent was waived for retrospective analysis. All methods were carried out in accordance with relevant guidelines and regulations. The study cohort was identified by searching the institutional picture archiving and communication systems(PACS) database for medical records from January 2019 to July 2020 to identify patients undergoing DXA of the hips and lumbar spine as well as thoracic and/or abdominal CT, revealing entire L1 for other indications in routine practice. The mean time interval between the two examinations was less than one week. Exclusion criteria included image artifacts obscuring the spine or patients with spinal fractures, spinal tumors, endocrine diseases, rheumatic diseases, and so on. Baseline clinic data recorded in retrospective analysis included age, gender, and body mass index (BMI). The final cohort consisted of 94 patients (36 men, mean age, 59.00±6.06 years; 58 women, mean age, 58.65±8.37 years).
DXA examination and diagnostic criteria of osteoporosis
DXA of the lumbar spine and hips was performed for BMD assessment by using standard techniques according to manufacturer and WHO guidelines using Hologicdiscovery dual-energy X-ray bone densitometer (Hologic Inc., Bedford, MA). According to WHO definition [13], patients were divided into three different categories: osteoporosis (T-score≤–2.5), osteopenia (–2.5 < T-score < –1.0), or normal (T-score≥–1.0).
Routine CT examination and image analysis
All patients underwent routine thoracic or abdominal CT by using a Revolution CT scanner (GE Healthcare, Wauwatosa, Wisconsin, USA). Images were viewed in a typical bone window setting, parameters were as follows: tube voltage = 120KV; tube current = 335 mA; slice thickness = 1.25 mm, slice interval = 1.25mm, window width = 500HU, window level = 1500HU.
For CT-attenuation value(HU) measurements, the region of interests (ROIs) were drawn to be as large as possible within L1 trabecular bone on transverse series angled to parallel the endplates, excluding degenerative changes, posterior venous plexus, focal abnormalities or lesions, artifacts, and cortical bone. Typically, three trabecular levels are employed to place ROI: midline zone, lower level of superior endplate, and upper level of inferior & endplate, as displayed in Fig. 1 Finally, an average HU value of CT attenuation was calculated by the above three levels.
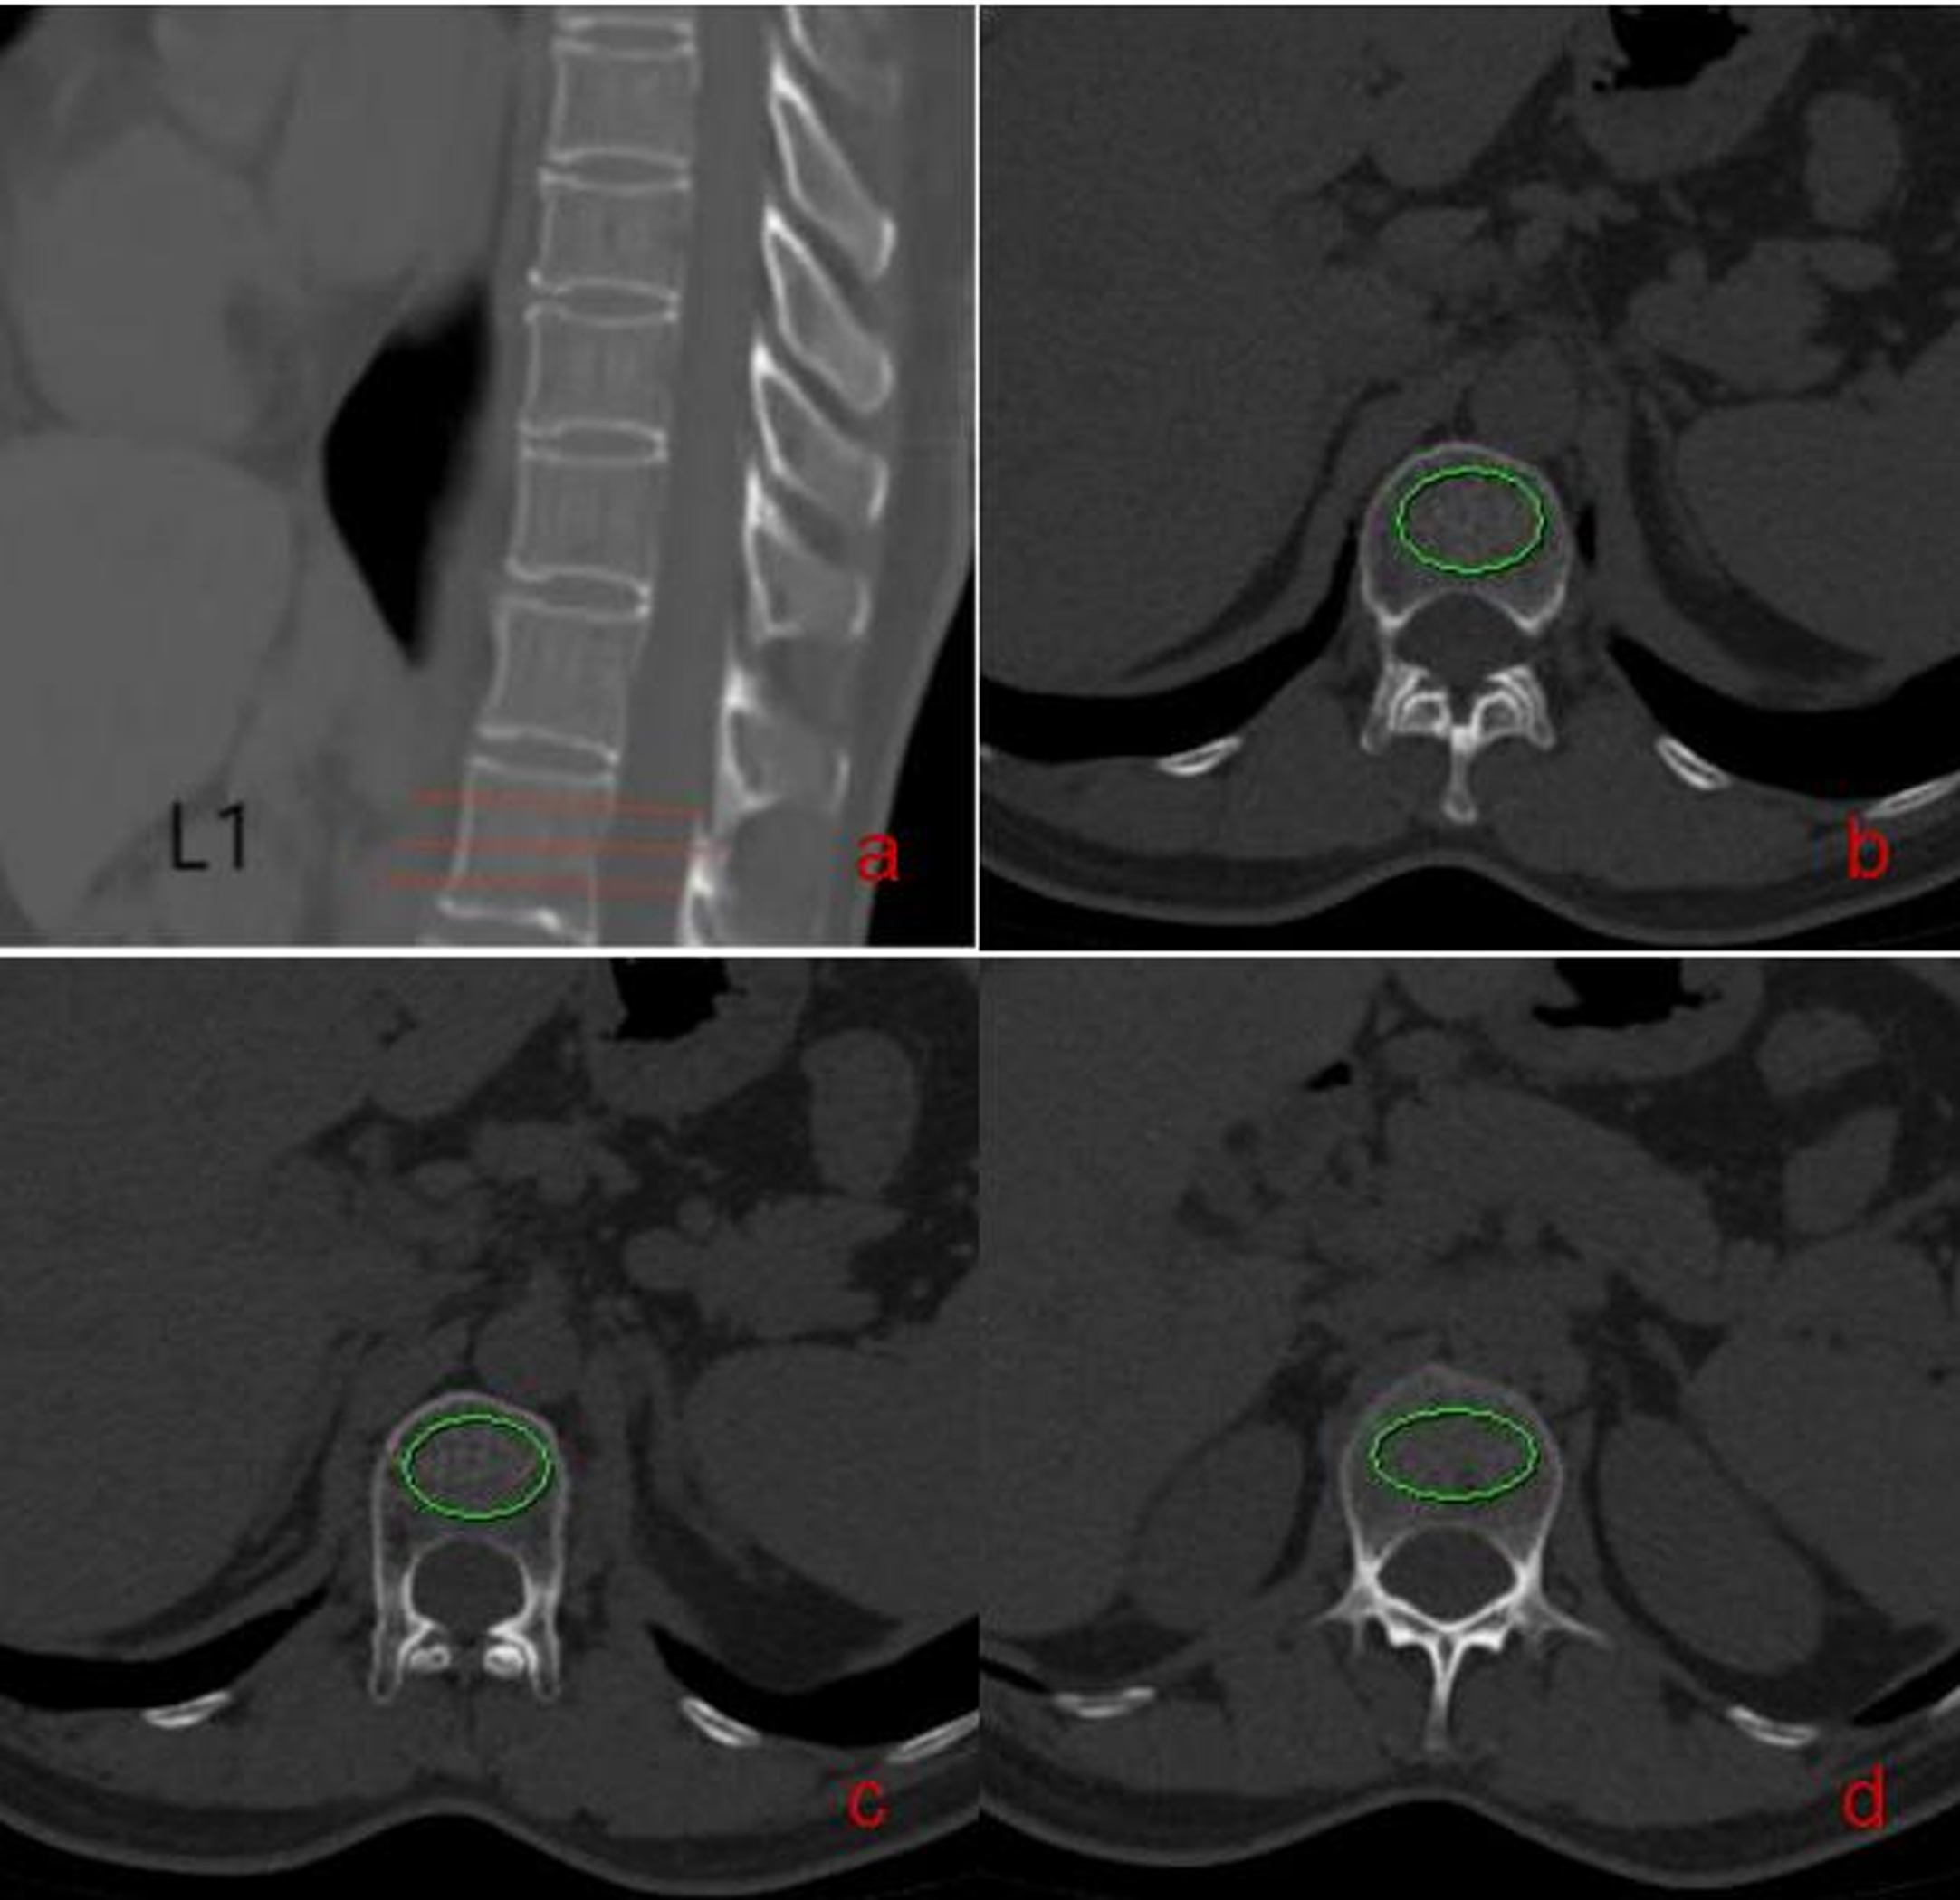
CT-attenuation value measurements The female was 57 years old, who had a thoracic CT because of physical examination. a: the lower level of superior endplate of L1, ROI = 405.61mm2, CT-attenuation value = 119.6HU; b: the midline zone of L1, ROI = 395.21mm2, CT-attenuation value = 118.5HU; c: the upper level of inferior endplate of L1, ROI = 403.71mm2, CT-attenuation value = 104.4HU; An average HU value of L1 was 114.16HU.
For cortical thickness measurements, stradview 6.0 software (https://mi.eng.cam.ac.uk/Main/StradView) was deployed. A slice thickness of 1.25 mm was selected to reduce partial volume effect. We selected the same levels as the measurement of CT-attenuation values, and left, right, and front cortical thickness of L1 were measured, as illustrated in Fig. 2. Subsequently, the average value was taken as the average thickness of cortical thickness of L1.
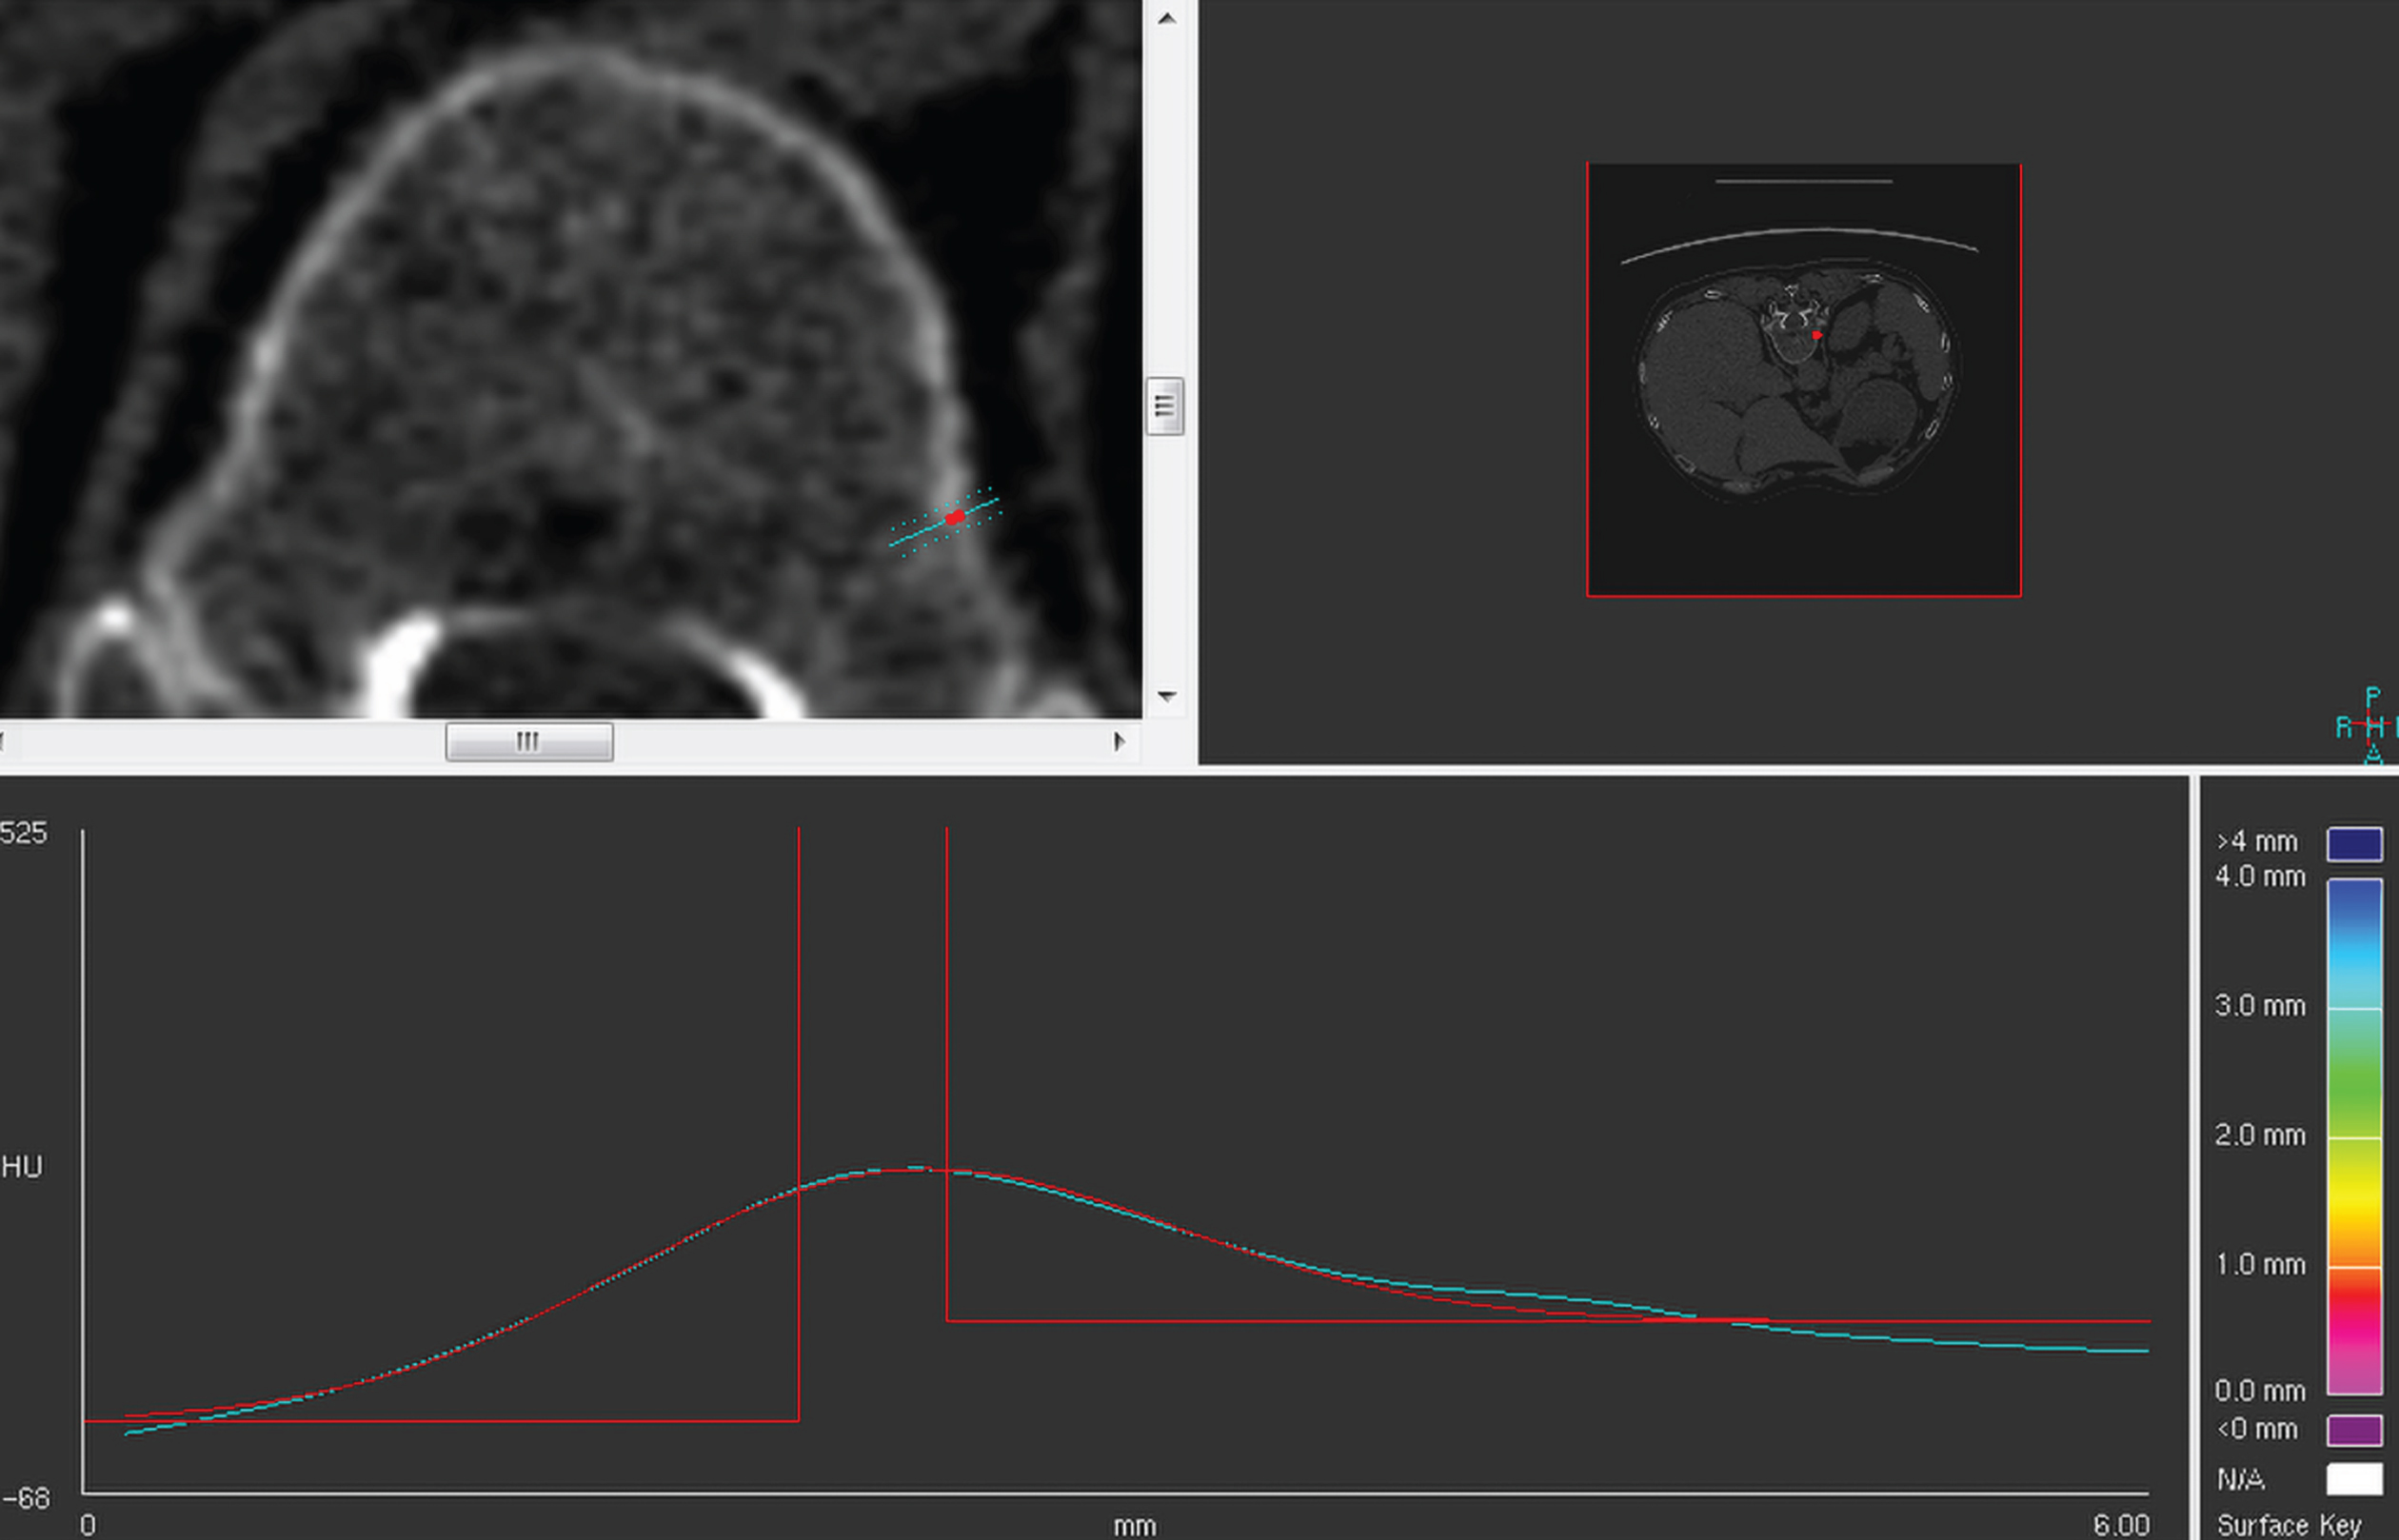
Cortical thickness measurements. The female was 56 years old, who had a abdominal CT because of physical examination. The L1 cortical thickness was measured by stradview 6.0 software (https://mi.eng.cam.ac.uk/Main/StradView). The left cortical thickness of the L1 was 0.42mm.
CT-attenuation values and cortical thickness measurements were initially performed by one student coauthor who was blinded to the information, she was trained by radiologist coauthors and subsequent confirmation was performed by a board-certified radiologist with 15 years of clinical experience. All data were measured 3 times and the average is taken to reduce bias caused by measurement error.
The L1 was determined to be an optimal target in present study, because it is included at both chest and abdominal CT examinations, and it has the closest correlation with BMD measured at DXA compared with other vertebral levels [9].
The IBM SPSS 23.0 (Armonk, NY) and Med Calc 19.1 (Mariakerke, Belgium) software were used for statistical analysis. The descriptive statistics of all variables were expressed as mean±standard deviation (SD). Continuous variables were tested for normality and homoscedasticity using the Kolmogorov-Smirnov and Levene’s test. To compare the difference among the three groups, a one-way analysis of variance (ANOVA) was used for normally distributed data and multiple comparisons were evaluated using LSD test. Categorical variables were compared using the Chi-square test. Receiving operator curve (ROC) analyses were performed to identify the optimal cutoff for the prediction of osteoporosis, osteopenia, or normal. Area under ROC curve (AUC), specificity, and sensitivity were calculated according to the cutoff value that maximized the Youden index. The Pearson correlation coefficients were calculated to assess their relationships. P value < 0.05 indicated statistically significant difference for all tests.
Results
Patients characteristics
The study enrolled 94 patients(36 men, mean age, 59.00±6.06 years; 58 women, mean age, 58.65±8.37 years), of whom 37 were categorized as normal (39.36%), 38 as osteopenia (40.42%), and 19 as osteoporosis (20.21%) according to WHO guidelines using DXA. As age and BMI of patients gradually increase, bone mass is decreased. The detailed patient characteristics are displayed in Table 1.
Detailed characteristics of the studied participants
Detailed characteristics of the studied participants
Values are expressed as mean±SD; M: man; F: female; BMI: gender body mass index.
As bone mass is decreased, CT-attenuation value and cortical thickness of L1 decrease significantly. The mean cortical thickness was 0.83±0.11, 0.72±0.10, and 0.64±0.09 mm for normal, osteopenia, and osteoporotic subgroups, respectively. A statistically significant difference was observed in cortical thickness among the three subgroups of bone status and CT-attenuation (P = 0.000). On average, cortical thickness values were the lowest in osteoporosis group. CT-attenuation exhibited the same regularity. The results are presented in Table 2.
ANOVA analysis of CT-attenuation and cortical thickness among the three groups
ANOVA analysis of CT-attenuation and cortical thickness among the three groups
aP < 0.05 for differences in changes between Normal versus Osteopenia. bP < 0.05 for differences in changes between Osteopenia versus Osteoporosis. cP < 0.05 for differences in changes between Normal versus Osteoporosis. HU: Hounsfield units.
In normal versus low BMD (including osteopenia and osteoporosis) group, CT-attenuation value and cortical thickness exhibited good sensitivity for distinguishing low BMD from normal. A mean HU threshold of > 148.7 was 73.0% sensitivity and 86.0% specificity for distinguishing low BMD from normal, with an AUC of ROC as 0.83 (95% CI: 0.74–0.90). Meanwhile, a mean cortical thickness threshold of > 0.73 was 83.8% sensitivity and 63.2% specificity for distinguishing low BMD from normal with an AUC of ROC as 0.81 (95% CI: 0.72–0.89). Besides, a statistically significant difference was observed between the two groups (P < 0.05). The results are displayed in Table 3 and Fig. 3.
ROC analysis of CT-attenuation and cortical thickness between normal and low BMD groups
AUC: Area under the curve; CI: confidence interval; low BMD: osteopenia and osteoporosis.
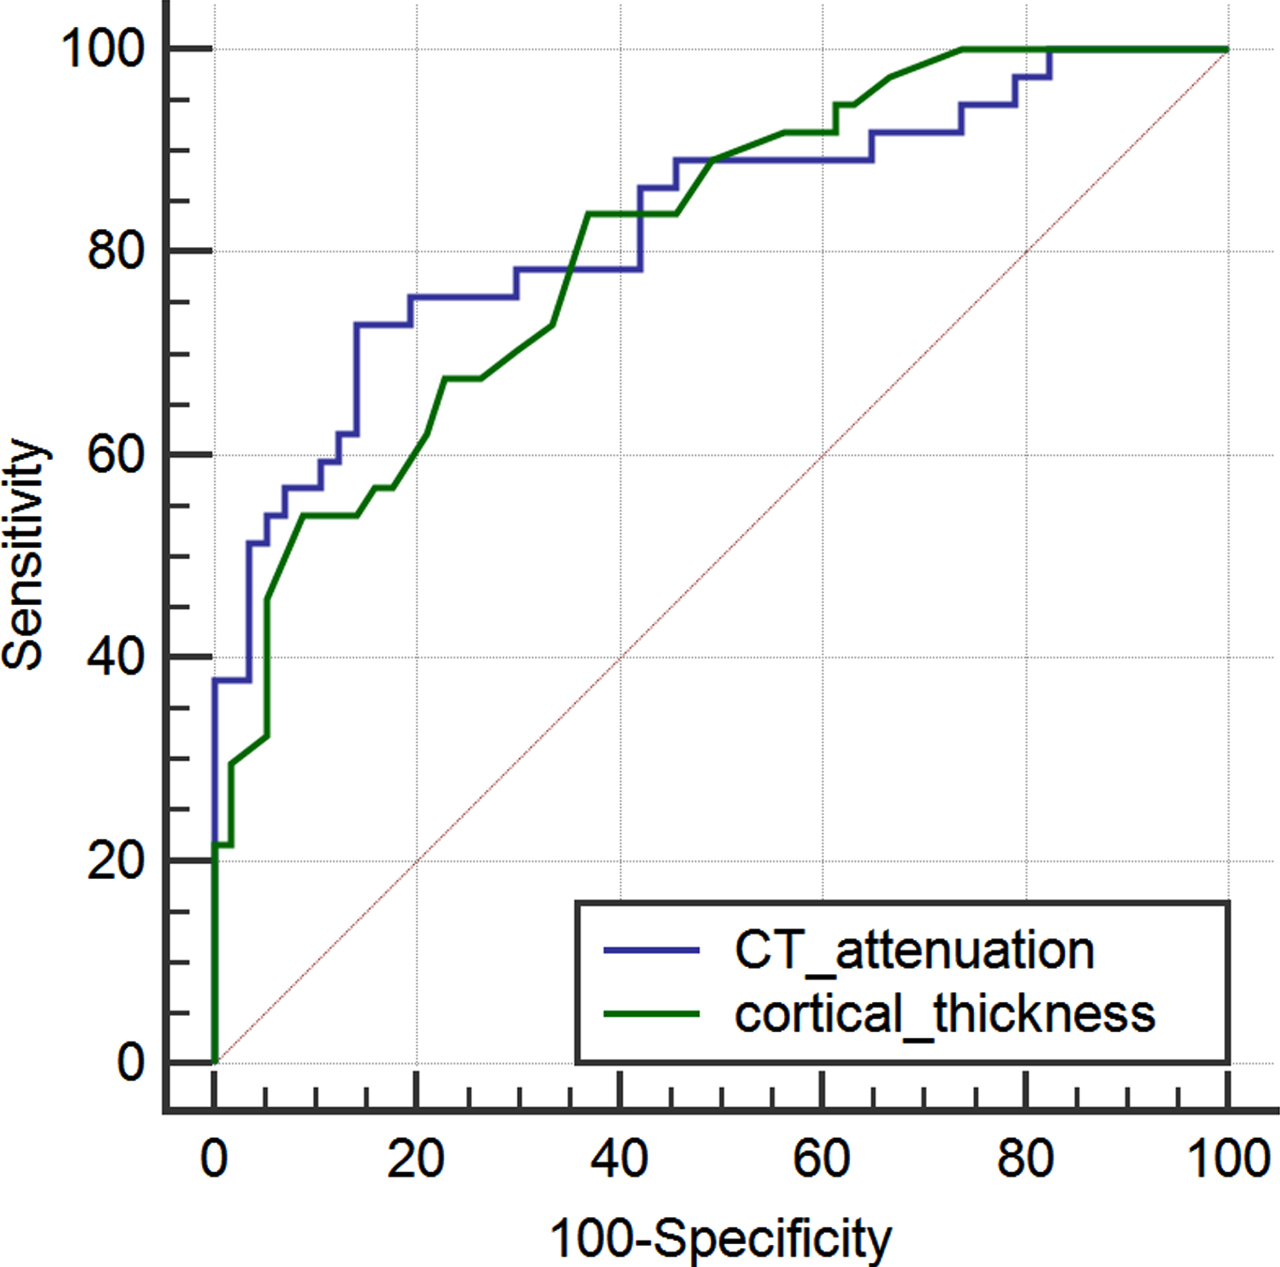
Comparison of ROC curves between CT-attenuation and cortical thickness The blue line: diagnostic efficiency of CT-attenuation between normal and low BMD groups. The green line: diagnostic efficiency of cortical thickness between normal and low BMD groups. low BMD: osteopenia and osteoporosis.
For the entire cohort (94 patients), Pearson correlation analysis indicated that BMD of L1 was positively correlated with CT-attenuation value (r = 0.666, P < 0.001) and cortical thickness (r = 0.604, P < 0.001). The results are demonstrated in Table 4 and Figs. 4-5.
Relationship between BMD and CT-attenuation, BMD and cortical thickness by Pearson correlation analysis
Relationship between BMD and CT-attenuation, BMD and cortical thickness by Pearson correlation analysis
BMD: Bone mineral density.
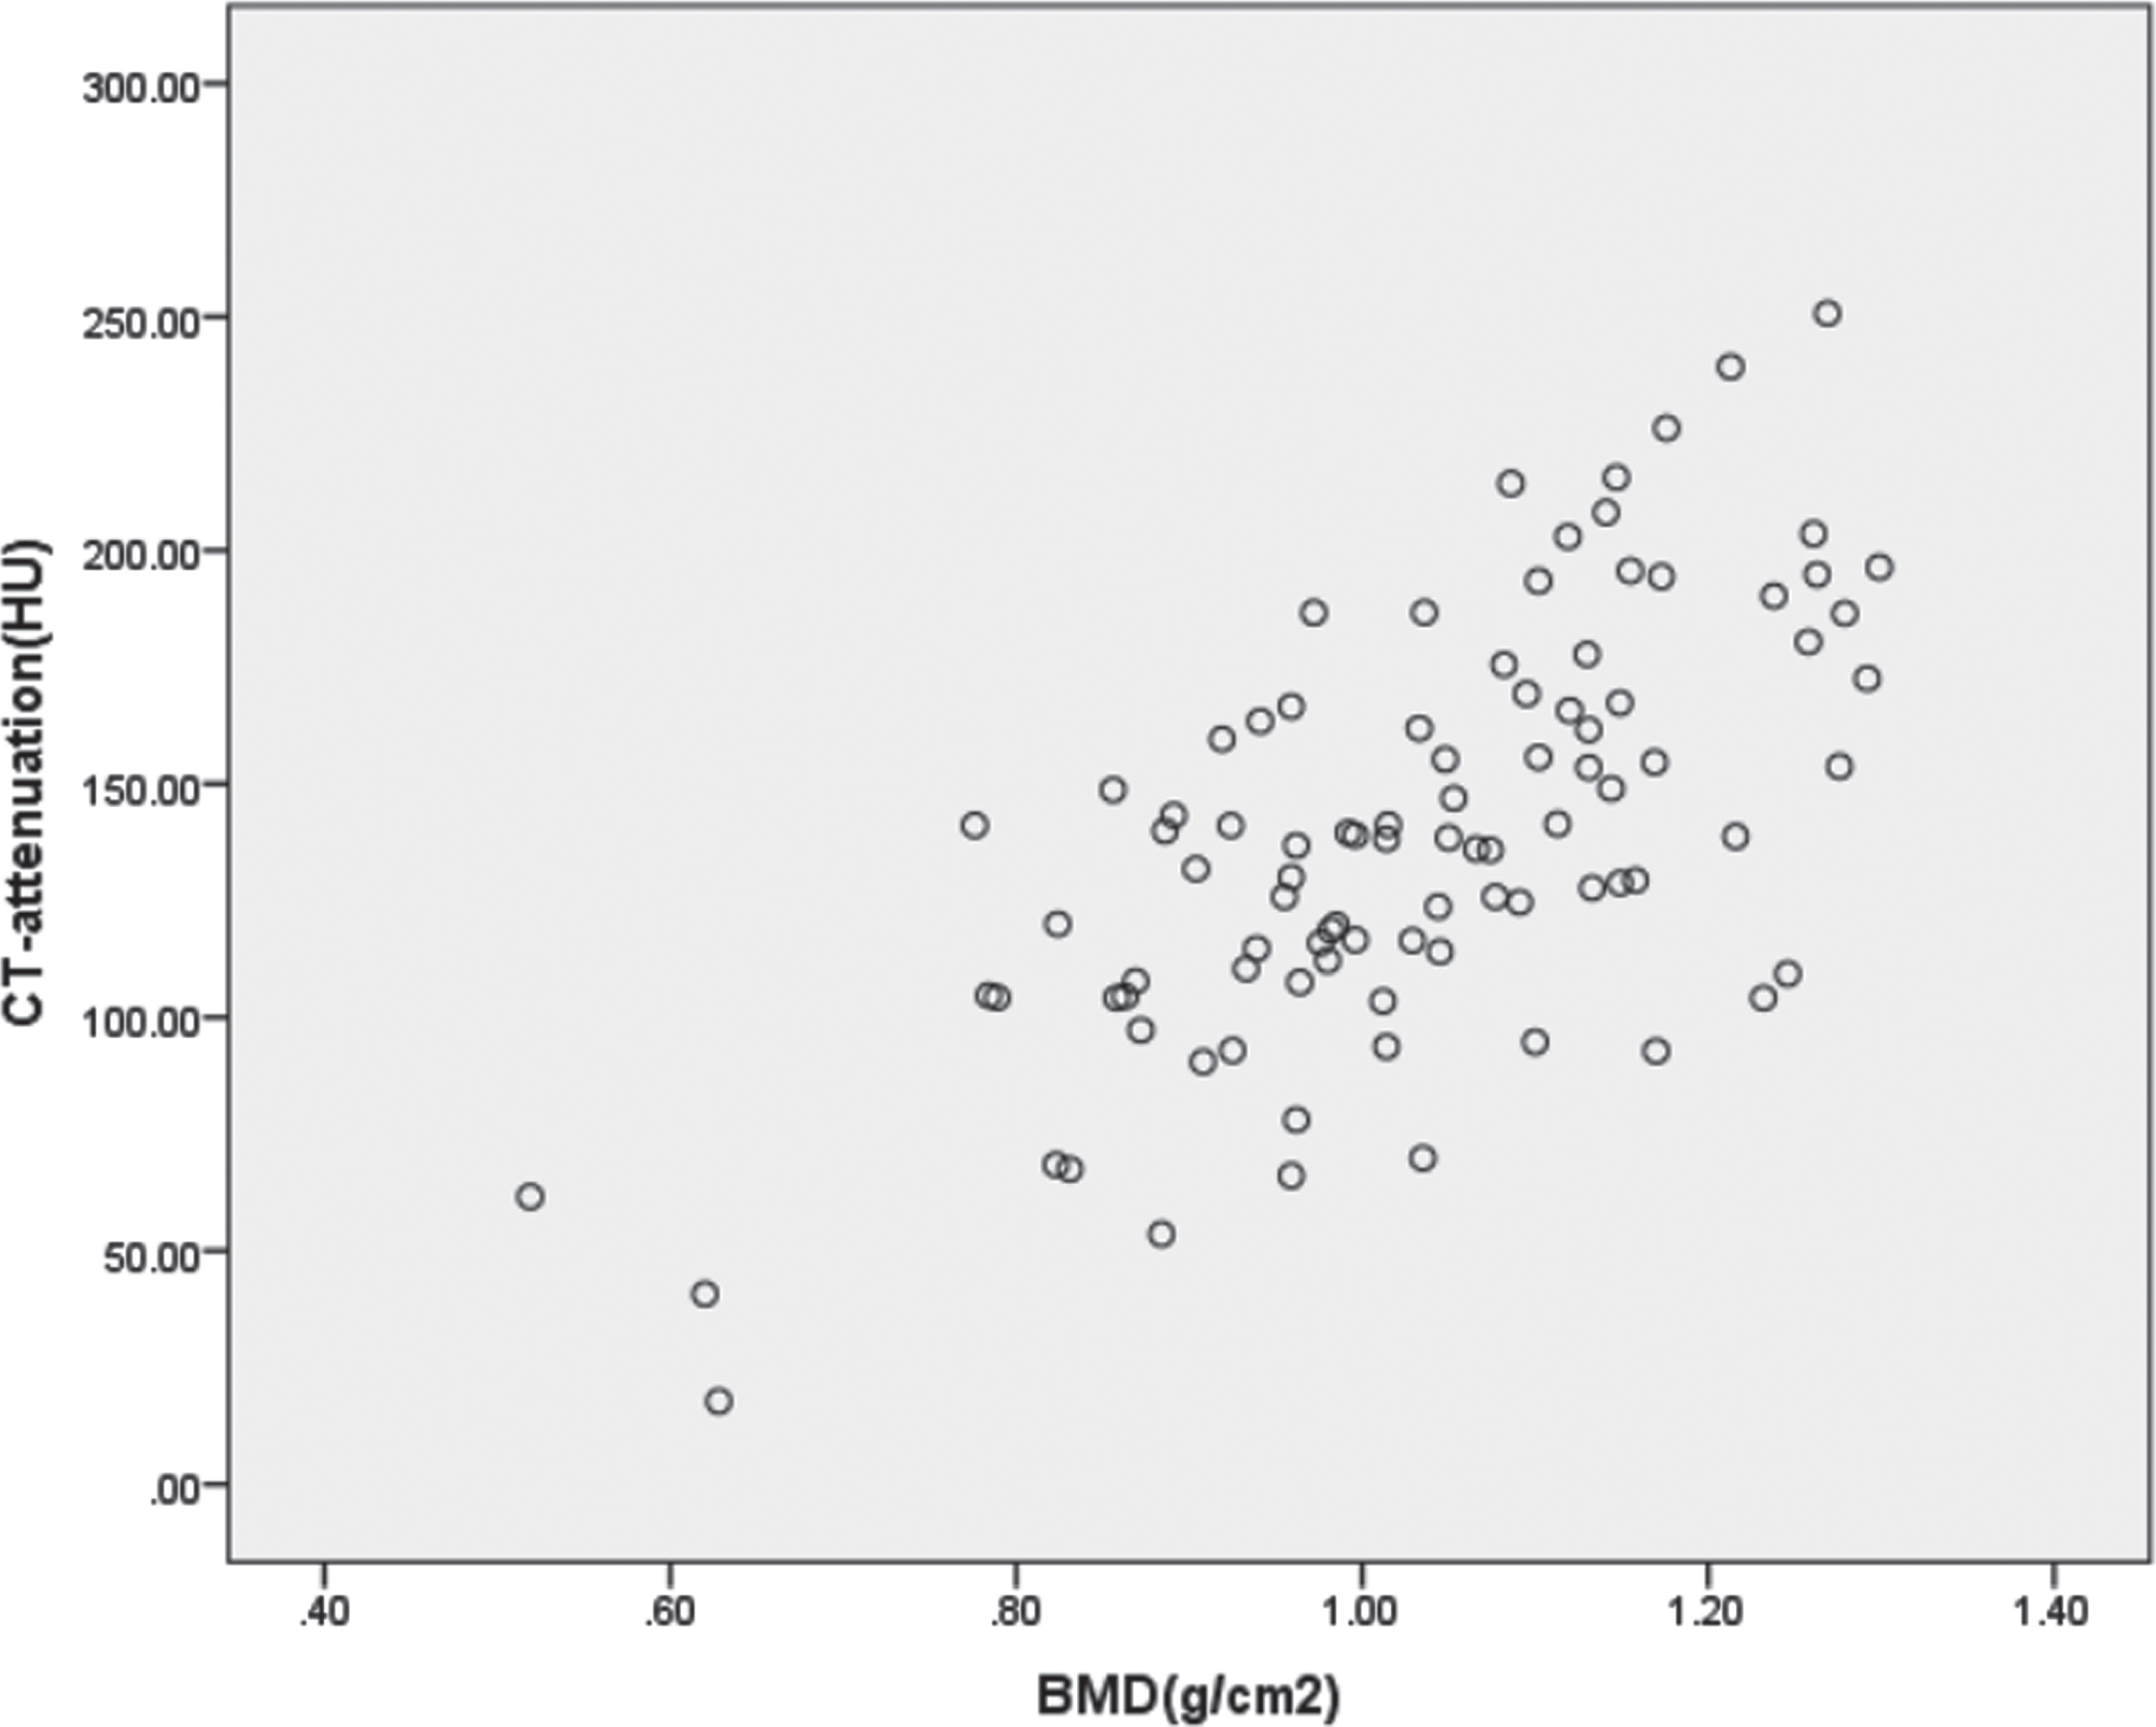
Scatterplot between BMD and CT-attenuation. Scatterplot showing a positive correlation between BMD and CT-attenuation (r = 0.666, P < 0.001).
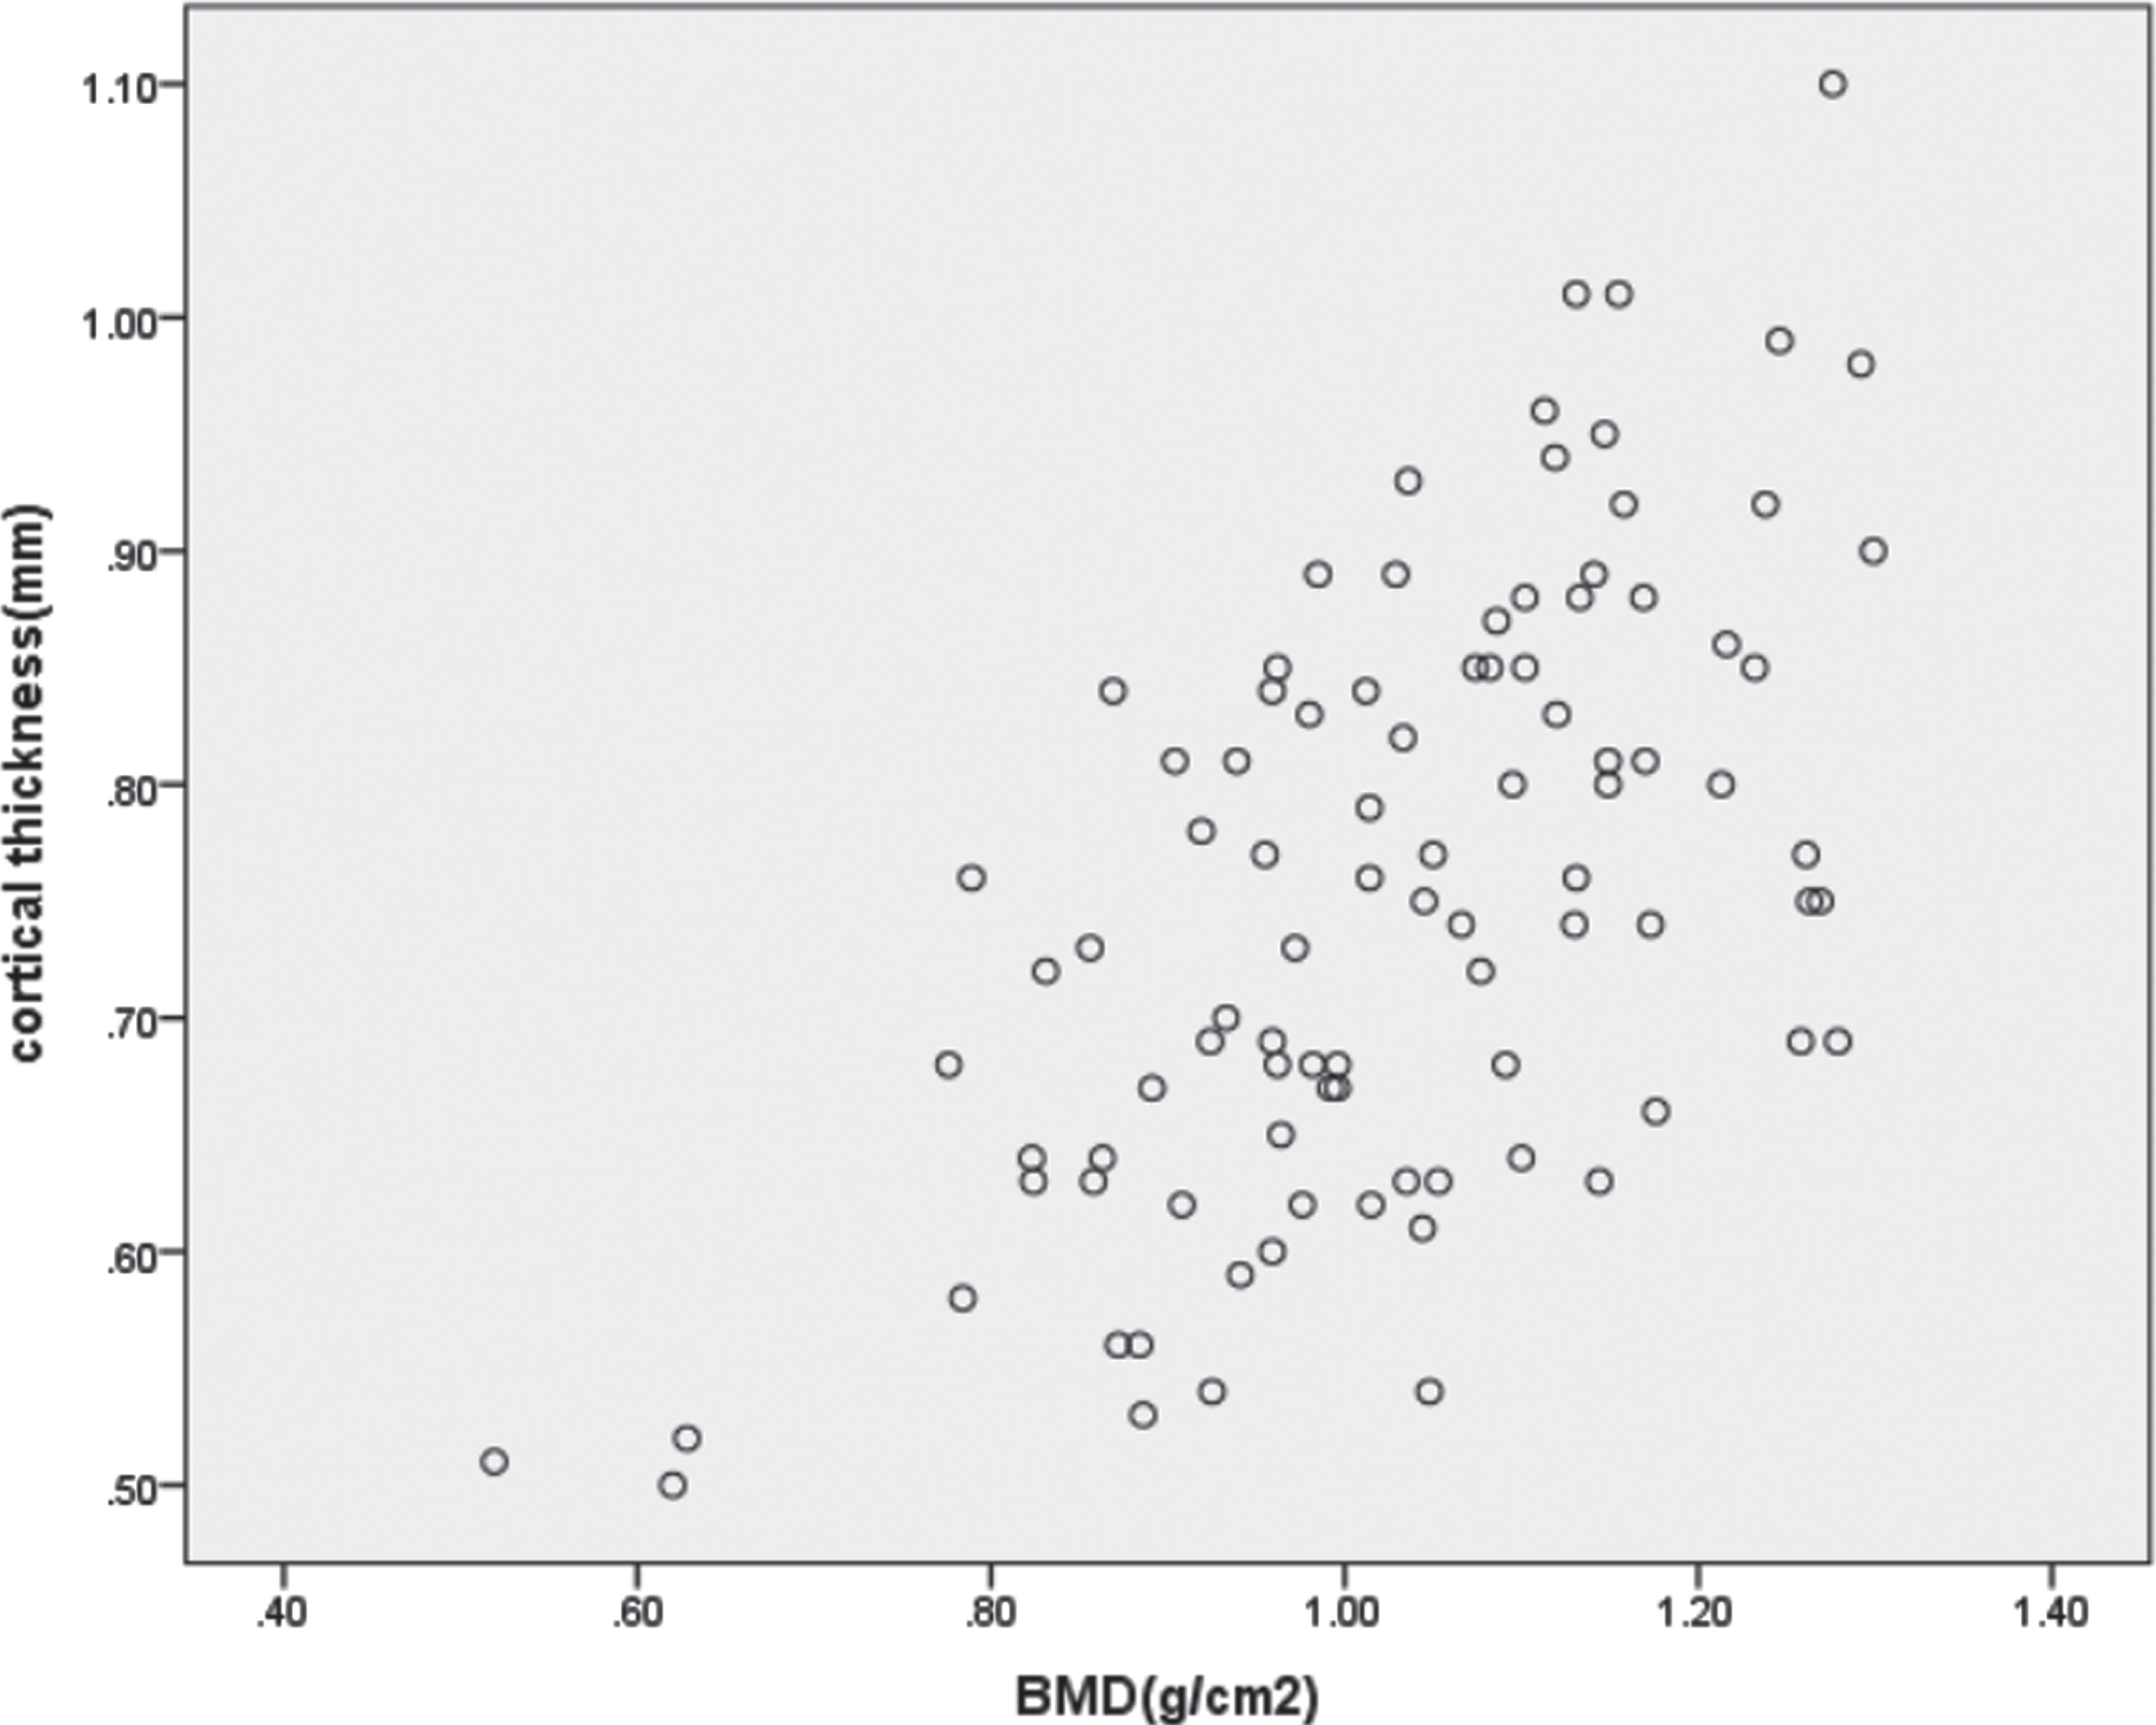
Scatterplot between BMD and cortical thickness. Scatterplot showing a positive correlation between BMD and cortical thickness (r = 0.604, P < 0.001).
WHO guidelines [13] have confirmed DXA to be the current standard of reference for diagnosis of a low BMD and osteoporosis. Nevertheless, DXA does not differentiate between cortical and trabecular bone [14]. Previous studies have shown that abdominal or thoracic CT images obtained for other reasons that include the lumbar spine can be used to identify patients with osteoporosis or normal BMD without additional radiation exposure or expense to patients [7, 15]. DXA cannot be currently replaced but it can be supported by BMD assessment from CT scans in daily practice.
In Yan-Lin Li et al.’s study [16], mean CT-attenuation values were 230HU, 135HU, and 97HU for normal, osteopenia, and osteoporotic subgroups, respectively. With similar values of HU with those of Yan-Lin Li et al., in the present study, mean CT HU differed significantly (P = 0.000) for the three DXA-defined BMD categories of osteoporosis (98HU), osteopenia (127HU), and normal individuals (169HU). The slight difference may be that CT-cutoffs are influenced both by the selection of the study population and the scanner calibration. CT-attenuation values were significantly lower at L1 vertebral levels for patients with DXA-defined osteoporosis. Besides, Pickhardt et al. utilized ROC analysis to derive optimal cutoff values for diagnosis and exclusion of osteoporosis [9]. In their study, an L1 CT-attenuation threshold of 160 HU resulted in a balanced sensitivity and specificity of approximately 70% for distinguishing normal from low BMD. Our current results of CT < 148 HU for distinguishing low BMD from normal of 73.0% sensitivity and 86.0% specificity were similar with them. In Pickhardt et al.’s study, the group “low BMD” included osteopenia and osteoporosis too. Therefore, compared with Pickhardt’s results, our results exhibit higher sensitivity and specificity. In addition, Marinova M et al. demonstrated no significant intraindividual differences between HU measurements on sagittal, coronal, and transversal plane [17].
An intracortical remodeling unbalance leads to cortical bone loss, which increases cortical porosity resulting in a high proportion of age-related bone loss [3, 18]. Therefore, it is essential to recognize the vital role of cortical bone in determining bone strength [19]. However, few identified previous study has specifically evaluated cortical thickness changes in vertebral osteoporosis.
Stradwin is a novel post-processing software developed by Cambridge University. It has been demonstrated to accurately assess cortical bone thickness using routine CT [20, 21]. Accurate cortical bone thickness estimates have been demonstrated down to 0.3 mm in cadaveric samples [22]. Michael Farris et al.’s [23] measured cortical thickness within each vertebra in Non-Human Primates after Single-Fraction Whole-Chest Irradiation by using this software. Stradview was originally developed from Stradwin, but without any of the live ultrasound acquisition features, which makes it much more appropriate for those who only need to visualize and analyze existing medical data. Besides, considering that the automatic measurement will be affected by lumbar degeneration, the manual measurement method was used in this study. In present study, three points were manually selected at the upper, middle and lower levels of L1 separately and averaged as the final cortical thickness.
In normal versus low BMD groups, cortical thickness had a better sensitivity than CT-attenuation value, although the specificity of cortical thickness was lower than CT-attenuation value. In the present study, the average cortical thickness of normal and low BMD groups was less than 1mm, which may lead to deviation due to partial volume effect in the measurement process, resulting in the reduction of the specificity of cortical thickness. Besides, the number of patients enrolled in our study was relatively small, it may also have an impact on the final results. However, AUC across cortical thickness and CT-attenuation value at L1 to distinguish normal from low BMD were more than 0.80. A statistically significant difference was observed between the two groups (P < 0.05).
Yoshii et al. chose the mid-portion of metacarpal bone of the right middle finger as ROI, and cortical thickness ratio (CTR) was then calculated as cortical thickness relative to transverse diameter. CTR demonstrated a significant correlation with BMD [24]. ChunXiao Ye et al. reported that distal radius cortical thickness was positively correlated with lumbar spine BMD (r = 0.529, P < 0.01) [25]. We performed the present study to assess L1 vertebral cortical thickness ability to predict osteoporosis compared with CT-attenuation. We found that cortical thickness was positively associated with BMD (r = 0.604, P < 0.001), similarly with the relationship between CT value and BMD (r = 0.666, P < 0.001), indicating that a thinner bone cortex is linked to osteoporosis, consistent with previous research. Consequently, using L1 vertebral cortical thickness may be a promising method in assisting radiologists in differentiating osteoporosis from normal BMD.
The limitations of our study should be acknowledged. Firstly, it was a retrospective study performed in a single institution. Secondly, the number of patients enrolled in our study was relatively small. Additionally, we only included one vertebral body (L1). The other problem of the study is that it does not demonstrate an ability to identify individuals at a high risk of a fracture. In the future, the limitations need to be further improved in the following investigations.
Conclusions
In conclusion, this study stated that L1 CT-attenuation and cortical thickness measured on opportunistic CT can help predict osteoporosis. Compared with cortical thickness, CT-attenuation is a more sensitive and accurate index for distinguishing low BMD from normal. In addition, routine CT may serve as an efficient tool to help clinicians and radiologists identify abnormally low BMD from normal BMD.
Footnotes
Acknowledgments
This study was funded by Academic Promotion Programme of Shandong First Medical University (No.2019QL017) and Medical Health Science and Technology Development Plan Project of Shandong Province (No.202009041141).
Competing interests
The authors declare that they have no competing interests.