
Abstract
OBJECTIVE:
To investigate the importance of color-map virtual touch tissue imaging (CMV) in assisting Breast Imaging Reporting and Data Systems (BI-RADS) in diagnosing malignant breast lesions.
METHODS:
A dataset included 134 patients and 146 breast lesions was assembled. All patients underwent biopsy or surgical excision of breast lesions, and pathological results were obtained. All patients with breast lesions also underwent conventional ultrasound (US) and CMV. Each lesion was assigned a CMV score based on the color pattern of the lesion and surrounding breast tissue and a BI-RADS classification rating based on US characteristics. We compared the diagnostic performance of using BI-RADS and CMV separately and their combination.
RESULTS:
BI-RADS (odds ratio [OR]: 3.665; 95% confidence interval [CI]: 2.147, 6.258) and CMV (OR: 6.616; 95% CI: 2.272, 19.270) were independent predictors of breast malignancy (all P < 0.05). The area under the receiver operating characteristic curves (AUC) for either CMV or BI-RADS alone was inferior to that of the combination (0.877 vs. 0.962; 0.938 vs. 0.962; all P < 0.05).
CONCLUSIONS:
The performance of BI-RADS in diagnosing breast lesions is significantly improved by combining CMV. Therefore, we recommend CMV as an adjunct to BI-RADS.
Introduction
Conventional ultrasound (US) has been widely used for the clinical detection and diagnosis of breast lesions. The US has the advantages of being low-cost, real-time, fast, and non-invasive. The conventional US can provide information about breast lesions’ structure and blood supply and is a critical two-dimensional and color Doppler imaging technique. Clinicians or radiologists commonly use the Breast Imaging Reporting and Data System (BI-RADS) to evaluate breast lesions [1–4]. Using BI-RADS, radiologists classify breast lesions into seven categories (i.e., categories 0 through 6).
However, diagnosing breast lesions with the US is challenging due to the overlapping US features of breast lesions. BI-RADS category four lesions are defined as suspicious for malignancy with a probability of malignancy of 2% –95% [5–8]. BI-RADS category four lesions management options are the most controversial due to the extensive malignancy. Patients may become anxious and choose to have the lesion biopsied or surgically removed. Biopsy or surgical removal can increase patient anxiety and medical costs. Therefore, improved diagnostic methods for breast lesions may reduce overtreatment.
Malignant lesions of the breast are often harder than benign lesions. Elastography can be used to diagnose whether a breast lesion is malignant by assessing the stiffness of the lesion. Strain elastography and shear wave elastography are the two most commonly used elastography techniques [9–14]. Strain elastography applies pressure to the lesion through the operator. Operator experience affects the diagnostic performance of strain elastography. Shear wave elastography uses radiation to excite the target tissue to generate shear waves and assesses the stiffness of the tissue by measuring the shear wave velocity. Acoustic Radiation Force Impulse (ARFI) measures shear wave velocity and detects displacement by stimulating the lesion with high-intensity short-amplitude pulses to analyze the lesion hardness.
Several studies have investigated the diagnostic value of ARFI for breast tumors, and these studies have focused on virtual touch tissue quantification (VTQ) or virtual touch tissue imaging and quantification (VTIQ) [15–18]. The stiffness of the lesion is positively correlated with the shear wave velocity. However, the shear wave velocity displayed by VTQ or VTIQ often shows X.XX readings. The reason may be that the shear wave velocity within the lesion exceeds the measurement range. This drawback limits the use of VTQ or VTIQ. Also, the shear wave velocity can only assess the local stiffness of the lesion, not the entire lesion.
Virtual tissue imaging (VTI) investigates tissue displacement by acoustic pulses and is a qualitative assessment method. VTI technology displays the stiffness of the tissue through color maps or grayscale. There are relatively few studies on the value of VTI for diagnosing breast lesions, and most of these studies are based on grayscale VTI [19–21]. However, the human eye’s ability to discriminate between different shades of gray is significantly weaker than the ability to differentiate between colors. Therefore, we aimed to evaluate the diagnostic value of color map VTI (CMV) for breast lesions and to assess the added value of CMV for BI-RADS.
Materials and methods
The ethics committee has approved this retrospective study. All patient data were anonymized. Therefore, we waived the requirement for informed patient consent.
Patients
A total of 134 women who underwent diagnostic breast US testing at our hospital between June 2019 and July 2021, involving 146 breast lesions, were included for analysis (Fig. 1). All patients underwent biopsy or surgical excision of breast lesions, and pathological results were obtained.

Flowchart of patient inclusion for the cases. US = ultrasound. CMV = color-map virtual touch tissue imaging.
The inclusion criteria are as follows: (1) patients who have undergone the conventional US, color Doppler and ARFI within one month before biopsy or mastectomy of a breast lesion; (2) patients in whom histopathological results were obtained after biopsy or surgery.
Meanwhile, the Exclusion criteria were listed as follows: (1) incomplete US and ARFI data; (2) pathological findings of breast lesions are unclear; (3) patients with breast implants; (4) patients who were pregnant or breastfeeding; (5) previous mastectomy or biopsy of breast lesions; (6) patients who are receiving chemotherapy or radiation therapy for any cancer.
The Siemens ACUSON S2000 ultrasound instrument with linear transducer 9L4 was used for all patients’ conventional US and color Doppler examinations. We first performed the US examination to observe the US signs of the lesion (according to the 2013 version of the BI-RADS classification), recording lesion size, shape (regular or irregular), margins (well-defined or indistinct), internal echogenicity (homogeneous or inhomogeneous), posterior features (non-attenuated or attenuated), growth direction (parallel or perpendicular position), and internal microcalcifications (absent or present). Next, a color Doppler examination was performed, and we classified the blood flow images of the lesion into two classes (poor and rich). If there is a punctate signal or no signal on color Doppler, it is determined to have “poor” internal flow. If more than three linear or dendritic signals are present on color Doppler examination, it is determined that there is an “abundant” internal flow[17].
Breast imaging reporting and data system
Breast lesions were classified according to BI-RADS. BI-RADS category 3, where the lesion is likely to be benign (≤2% probability of malignancy); BI-RADS category 4, lesions with suspicious abnormalities (category 4a, low suspicion, malignant probability 2% –10%; category 4b, intermediate suspicion, malignant probability 10% –50%; category 4c, moderate suspicion, malignant probability 50% –95%); BI-RADS category 5, lesions highly suspicious of malignancy with ≥95% probability of malignancy [22].
Color-map virtual touch tissue imaging
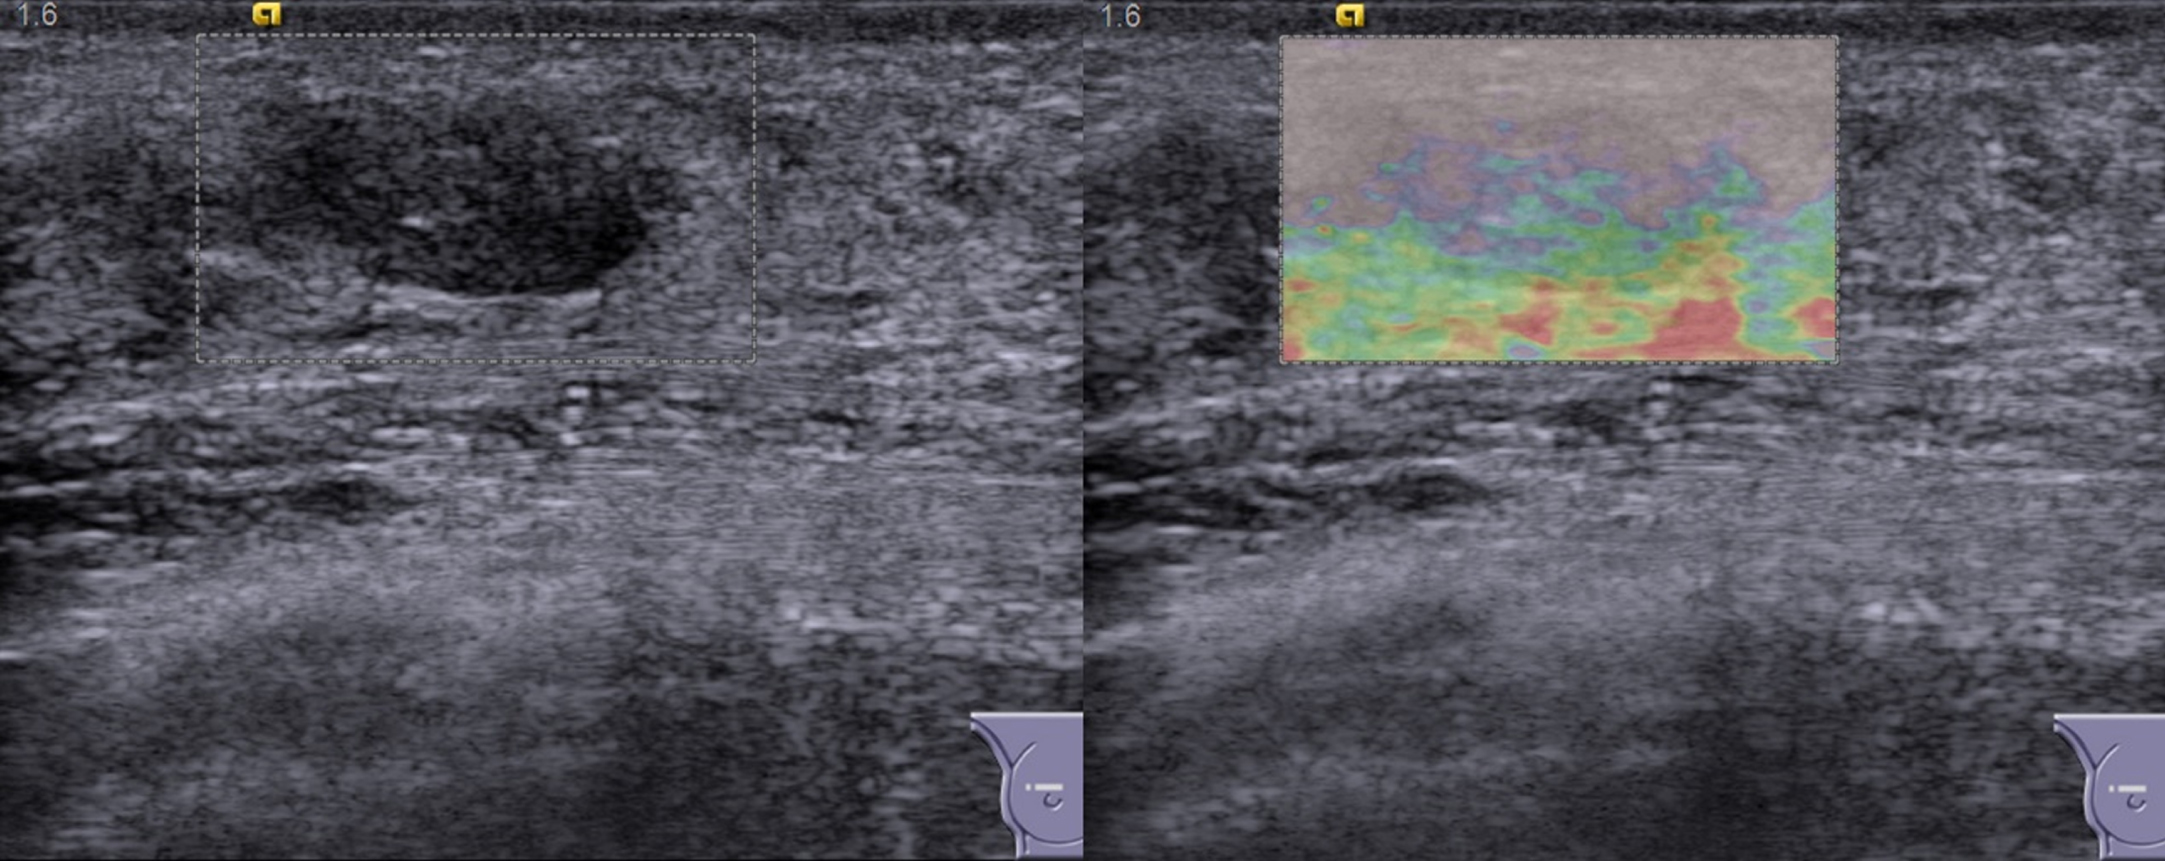
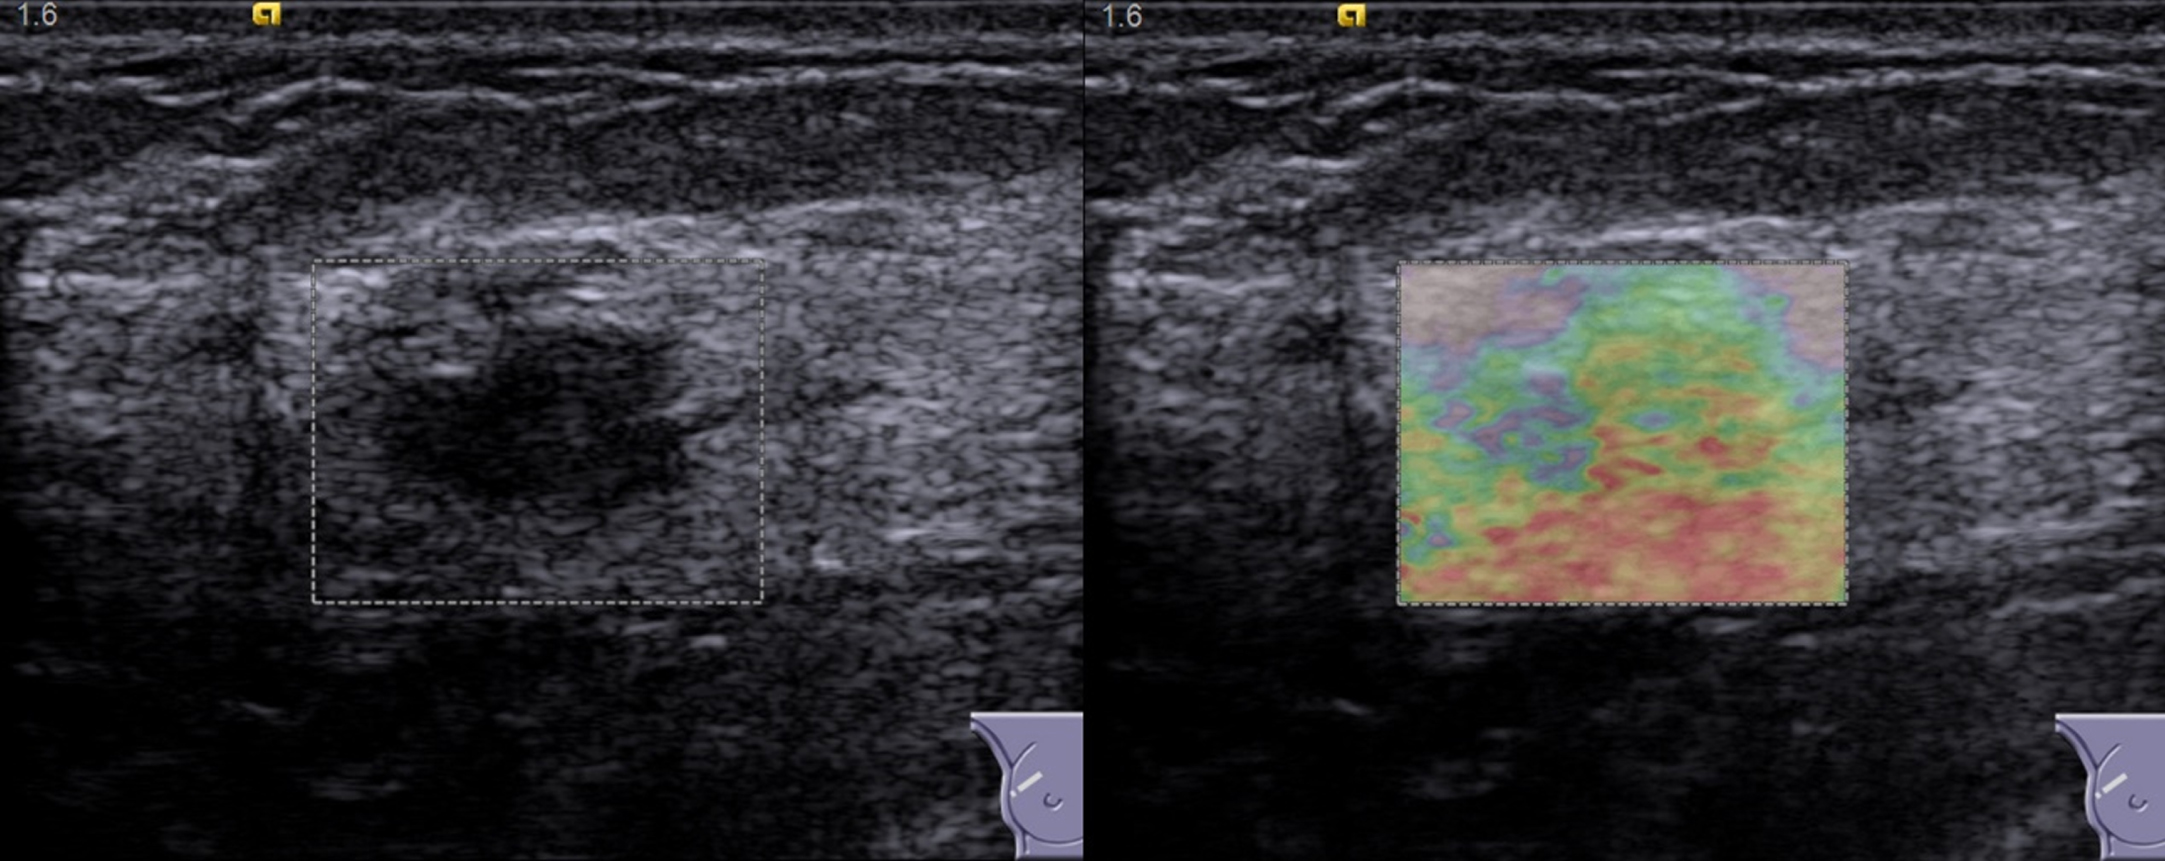
The Siemens ACUSON S2000 ultrasound instrument with linear transducer 9L4 (with ARFI function) was used for CMV examinations. All patients underwent CMV screening. We adjusted the size of the region of interest (ROI) to ensure that both the lesion and sufficient surrounding breast tissue were included in the ROI. If the lesion was too voluminous, we positioned the ROI at the juncture of the lesion and the surrounding breast tissue. To obtain excellent quality VTI images, we asked the patients to hold their breath. Then we started the VTI function and got the VTI image. Our study performed CMV in all cases instead of grayscale VTI. In the CMV display mode, the different colors reflect the different relative hardness levels of the lesions. The hardness decreases in red, orange, green, blue, and purple in the CMV images. The more red and orange components, the higher the stiffness; the more purple and blue, the softer. The green color indicates medium hardness. We scored the CMV images as follows: score 1, where the primary color of the lesion is purple, blue, or green; score 2, for a primary shade of orange and a secondary color of green within the lesion; score 3, for a lesion with a predominantly red or orange color and an especially blue or green color of the surrounding breast tissue; for score 4, the predominant color of the lesion and its surrounding tissue is red or orange [22].
The same radiologist (L.K.M) performed US and CMV examinations on the patient on the same day. Two radiologists (Z.X.H and L.W.X) (more than five years of breast imaging experience) reviewed all lesion images, respectively. The two radiologists did not know the pathological findings of the breast lesions. Two radiologists resolved differences through discussion in the case of disagreement.
Inter-observer agreement analyses
Two additional radiologists (L.W.X and H.X.E) evaluated images from 30 randomly selected lesions to assess the interobserver variability of BI-RADS and CMV. The two radiologists had more than 2 and 5 years of breast imaging experience, respectively.
Statistical analysis
Statistical analysis was performed using SPSS software (Version 26.0) and MedCalc (Version 18.0). Continuous variables were analyzed by t-test or Mann-Whitney U-test. The χ2 test or Fisher’s exact probability method was utilized for analyzing counted data. A binary logistic regression was performed based on two variables (BI-RADS and CMV) to establish the logistic regression equation.
where b1 and b2 are regression coefficients and X0 is a constant. Based on the Hosmer-Lemeshow goodness-of-fit test, we assessed the fit of the regression model. We calculated the combined predictor (BI-RADS plus CMV) as BI-RADS + b1/b2×CMV [23].
Receiver operating characteristic curves (ROC) were also used to evaluate and compare the diagnostic performance of BI-RADS, CMV, and the combination. Inter-observer agreement was determined using Kappa statistics (poor agreement, k-values less than 0.40; moderate agreement, k-values ranging from 0.40 to 0.60; substantial agreement, k-values ranging from 0.60 to 0.80; almost perfect agreement, k-values more than 0.80). The Z test was utilized to test the difference of the area under the curve value (AUC). Independent proportions were compared using the χ2 test. A P-value less than 0.05 was regarded as statistically significant.
Results
The patients and lesions characteristics
This study included 146 (103 benign, 43 malignant) pathologically confirmed breast lesions in 134 female patients (Table 1). The mean age of the patients was correlated with the malignancy of the breast lesions (P < 0.001). Breast cancers were more common in older women than in benign lesions. The mean maximum diameter of malignant breast lesions was 22.40±11.84 mm and 18.02±10.30 mm for benign lesions, with a statistically significant difference (P < 0.001).
Pathologic classification of breast lesions
Pathologic classification of breast lesions
The conventional US features such as irregular shape, poorly defined margins, non-homogeneous echogenicity, posterior echogenic attenuation, taller than wide, and internal microcalcifications were more common in malignant lesions (for all, P < 0.05). Malignant lesions were mainly found in BI-RADS 4b, 4c, and 5, especially in BI-RADS 4c and 5 (P < 0.001). In CMV, benign lesions scored significantly lower than malignant lesions (P < 0.001) (Table 2).
Comparison of US characteristics, CMV, and BI-RADS between benign and malignant lesions
Comparison of US characteristics, CMV, and BI-RADS between benign and malignant lesions
Notes. Unless otherwise noted, data points are the number of lesions, and numbers in parentheses are percentages. US = ultrasound. CMV = color-map virtual touch tissue imaging. BI-RADS=Breast Imaging Reporting and Data System. *Fisher’s exact test.
BI-RADS (odds ratio [OR]: 3.665; 95% confidence interval [CI]: 2.147, 6.258) and CMV (OR: 6.616; 95% CI: 2.272, 19.270) were independent predictors of breast malignancy (all P < 0.05) (Table 3). The regression equation is
Multivariate logistic regression analysis based on BI-RADS and CMV
Multivariate logistic regression analysis based on BI-RADS and CMV
BI-RADS=Breast Imaging Reporting and Data Systems. CMV = color-coded virtual touch tissue imaging. CI = confidence intervals. B = regression coefficient. SE = standard error. Wald = chi-square value.
The Hosmer & Lemeshow test was 0.855. BI-RADS’s diagnostic value was higher than CMV (AUC: 0.938 vs. 0.877, P = 0.0415). Among BI-RADS, CMV, and the combination, the combination had the highest diagnostic performance (AUC: 0.938 vs. 0.962; 0.877 vs. 0.962; all P < 0.05). The sensitivity and specificity of BI-RADS were also significantly higher when combined with CMV (all P < 0.05) (Table 4) (Figs. 2–6).
Diagnostic performance of BI-RADS, CMV, or both in breast lesions
Note. Unless otherwise indicated, the data point is a percentage, and the number in parentheses is 95% CI. BI-RADS = Breast Imaging Reporting and Data Systems. CMV = color-coded virtual touch tissue imaging. CI = confidence intervals. SEN = sensitivity. SPE = specificity. ACC = accuracy. PPV = positive predictive value. NPV = negative predictive value. * = data are percentages and raw data in brackets. a = Compared with BI-RADS, P < 0.05. b = Compared with CMV, P < 0.05.
Comparison of conventional US (left) and CMV (right) images of fibroadenoma in a patient with a CMV score of 1. BI-RADS classification of 3. US = ultrasound. CMV = color-map virtual touch tissue imaging. BI-RADS = Breast Imaging Reporting and Data Systems.
Comparison of conventional US (left) and CMV (right) images of adenosis in a patient with a CMV score of 2. BI-RADS classification of 4a. US = ultrasound. CMV = color-map virtual touch tissue imaging. BI-RADS = Breast Imaging Reporting and Data Systems.

Comparison of conventional US (left) and CMV (right) images of fibroadenoma in a patient with a CMV score of 3. BI-RADS classification of 4b. US = ultrasound. CMV = color-map virtual touch tissue imaging. BI-RADS=Breast Imaging Reporting and Data Systems.
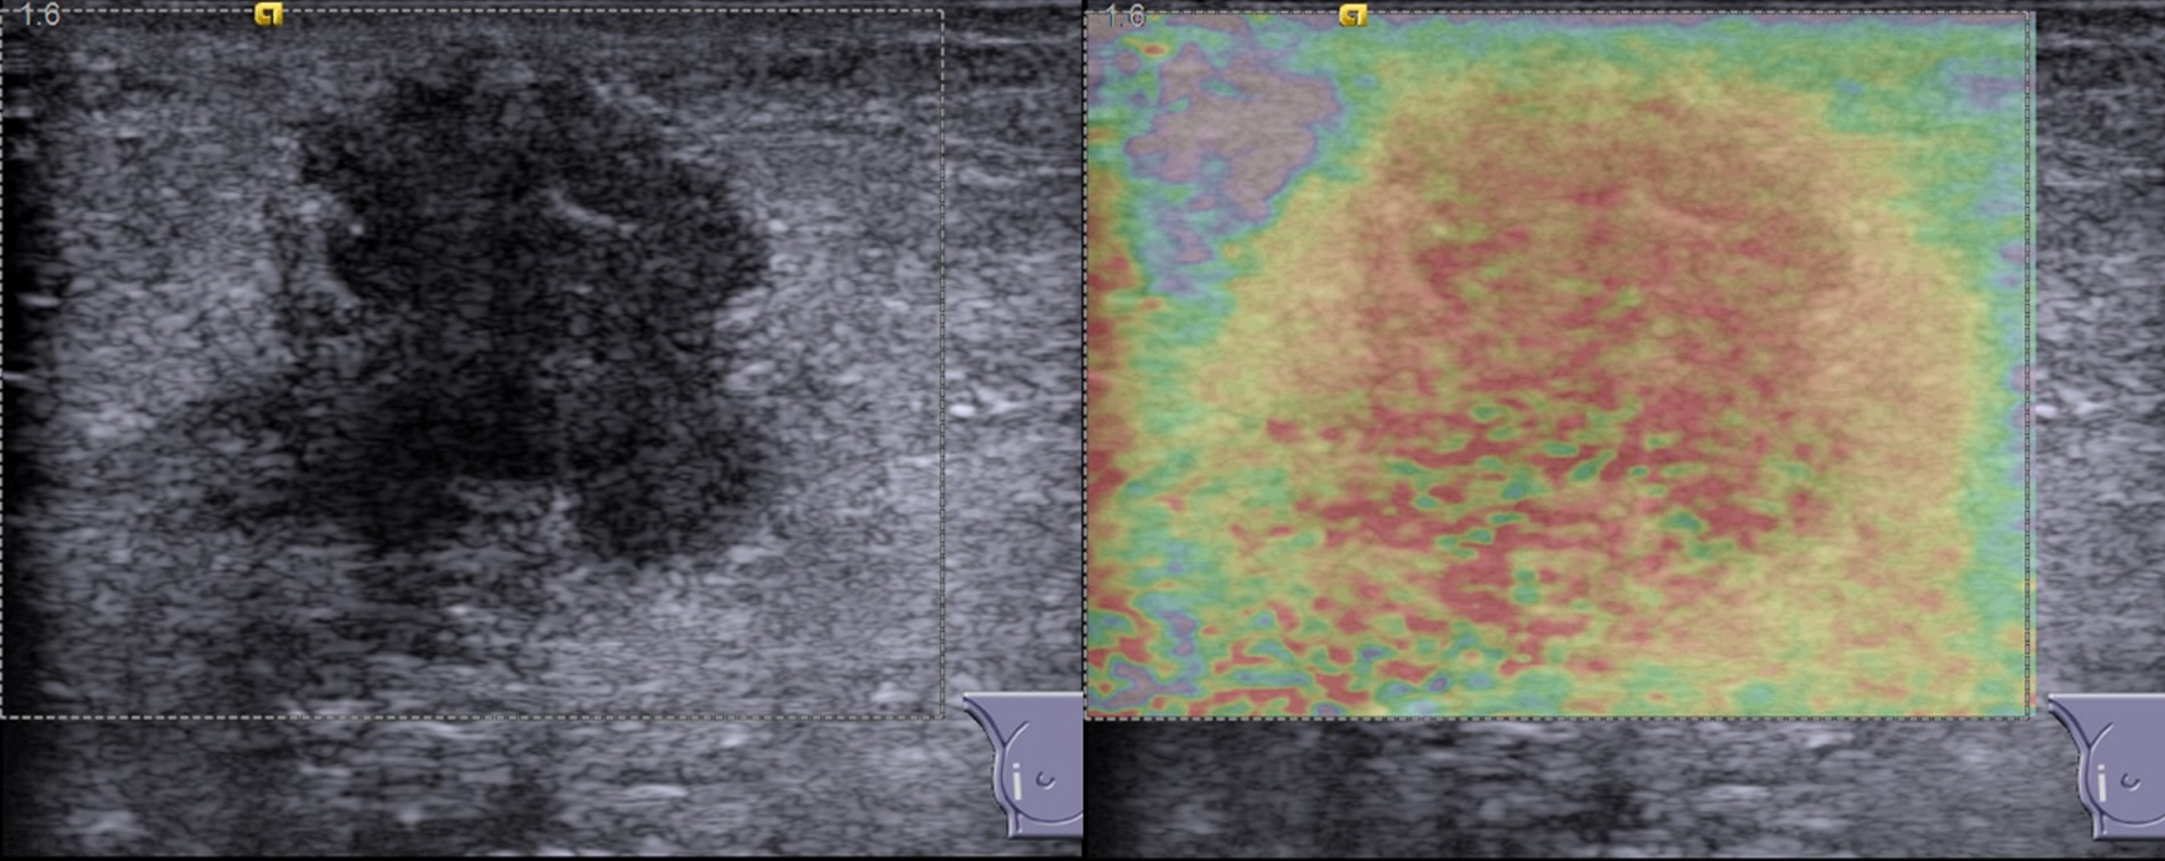
Comparison of conventional US (left) and CMV (right) images of infiltrating lobular carcinoma in a patient with a CMV score of 4. BI-RADS classification of 4c. US = ultrasound. CMV = color-map virtual touch tissue imaging. BI-RADS=Breast Imaging Reporting and Data Systems.
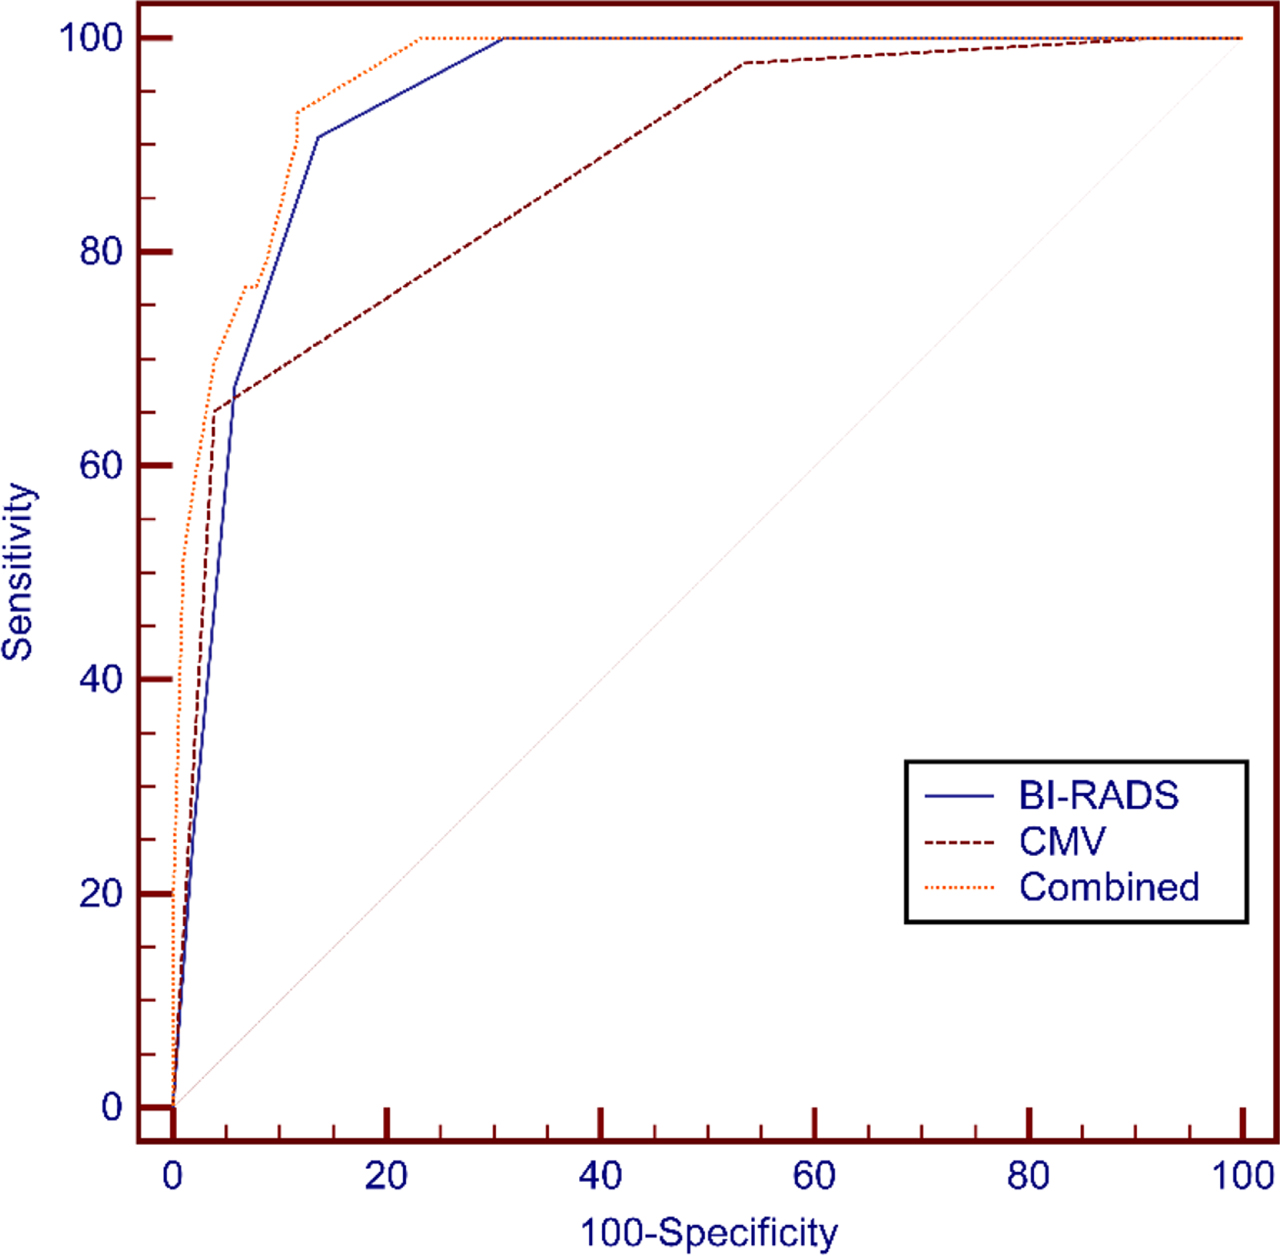
ROC analyses of CMV, BI-RADS, and CMV combined BI-RADS. ROC = receiver operating characteristic curves. BI-RADS=Breast Imaging Reporting and Data Systems. CMV = color-map virtual touch tissue imaging.
Our results showed substantial agreement could be obtained using BI-RADS and CMV between radiologists with different work experiences (BI-RADS: Kappa = 0.747, 95% CI = 0.626 –0.867; CMV: Kappa = 0.725, 95% CI = 0.565 –0.886).
Discussion
We retrospectively analyzed US and CMV images of 146 breast lesions. The results of this study suggested that CMV could be effective in diagnosing malignant breast lesions (the AUC was 0.877). The CMV score assessed the hardness of the lesion and the size of the lesion. CMV scores from 1 to 3, reflecting the change in hardness within the lesion. CMV scores from 3 to 4, reflecting the change in lesion size. Our results showed that benign lesions were predominantly scored 1–3, while malignant lesions were scored 4. In our study, when the breast lesion and surrounding tissue stiffness were high, the lesion was probably malignant (CMV score of 4). The increased stiffness of the surrounding tissues may be due to the invasion of cancer cells. Our data is consistent with previous elastography findings [19, 24].
However, the US remains a fundamental clue to distinguish malignant from benign breast lesions. The US should not be underestimated, despite the availability of elastography. Our study found a higher diagnostic performance of BI-RADS than CMV, similar to some previous studies [9, 26].
We aimed to assess the added value of CMV for BI-RADS. BI-RADS had an excellent performance in evaluating the risk of malignancy of breast lesions. Our study showed that BI-RADS performed well in assessing malignant breast lesions with an AUC value of 0.938. Several studies have revealed that elastography can improve diagnostic accuracy as an adjunct to the US. Our finding was similar to these studies [12, 26–29]. Among BI-RADS, CMV, and the combination, the combination had the highest diagnostic performance (all P < 0.05). The sensitivity and specificity of BI-RADS were also significantly higher when combined with CMV (all P < 0.05). The results suggested that CMV provided additional information to BI-RADS, thus improving its diagnostic performance for malignant breast lesions.
Compared to strain elastography, CMV does not require pressure from the operator and is therefore highly reproducible. Compared to VTQ or VTIQ, CMV does not have the problem of invalid readings. At the same time, VTQ or VTIQ may generate a large amount of measurement data. However, there is no uniform diagnostic cut-off value for VTQ or VTIQ. CMV is easier to handle and indicates different stiffness levels based on five colors.
This study has some limitations. First, this study is a retrospective with relatively small sample size. We selected only those patients with breast lesions who had undergone surgery or biopsy for the study. Inevitably, there might be some selection bias. Therefore, the benign and malignant ratios in our study do not represent the incidence of the entire population. Second, only one radiologist performed all US and CMV image acquisitions in this study, and no differences were compared between operators. We did not compare the diagnostic performance of different radiologists using the CMV score. We did not distinguish between the training, validation, or test groups. These issues need to be addressed and improved in more prospective and multicenter studies.
Conclusions
The performance of BI-RADS in diagnosing breast lesions was improved by combining CMV. Therefore, we recommend CMV as an adjunct to BI-RADS.
Footnotes
Acknowledgments
The authors gratefully acknowledge Xiaohuan Zhu, Wenxia Lin, and Xiao-E Huang from the Department of Ultrasound, The First Affiliated Hospital of Shantou University Medical College, Shantou, Guangdong Province, P.R. China.
Conflict of interest
The authors declare that they have no conflict of interest.
Ethical approval
Institutional Review Board approval was obtained.
Informed consent
The institutional review board approved a waiver of informed consent.
Funding
This research did not receive any specific grant from funding agencies in the public, commercial, or not-for-profit sectors.