
Abstract
BACKGROUND:
Medical diagnostic support systems are important tools in the field of radiology. However, the precision obtained, during the exploitation of high homogeneity image datasets, needs to be improved.
OBJECTIVE:
To develop a new learning system dedicated to public health practitioners. This study presents an upgraded version dedicated to radiology experts for better clinical decision-making when diagnosing and treating the patient (CAD approach).
METHODS:
Our system is a hybrid approach based on a matching of semantic and visual attributes of images. It is a combination of two complementary subsystems to form the intermodal system. The first one named α based on semantic attributes. Indexing and image retrieval based on specific keywords. The second system named β based on low-level attributes. Vectors characterizing the digital content of the image (color, texture and shape) represent images. Our image database consists of 930 X-ray images including 320 mammograms acquired from the mini-MIAS database of mammograms and 610 X-rays acquired from the Public Hospital Establishment (EPH-Rouiba Algeria). The combination of two subsystems gives rise to the intermodal system: α-subsystem offers an overall result (based on visual descriptors), then β-subsystem (low level descriptors) refines the result and increases relevance.
RESULTS:
Our system can perform a specific image search (in a database of images with very high homogeneity) with an accuracy of around 90% for a recall of 25%. The average (overall) accuracy of the system exceeds 70%.
CONCLUSION:
The results obtained are very encouraging, and demonstrate efficiency of our approach, particularly for the intermodal system.
Keywords
Introduction
The development of electronic imaging devices generates several billions of images. In particular, the medical field generates a huge number of images of therapeutic interest. Radiologist and practitioners are often confronted with great difficulty in analyzing and using images in a quantitative, qualitative and objective manner [1, 2]. The persistent demand for hospital information systems (HIS) in recent years further motivates us to get involved in the research dynamics aimed at making radiology facilities more and more intelligent. Particularly in Algeria, dozens of medical imaging centers are spread all over the country and produce, daily, several thousand medical images. The diagnosis and monitoring of the evolution of certain diseases (such as cancer for example) requires a computerized management of all these resources. Nowadays, it has proved that image-indexing processes based solely on semantic attributes are not enough, particularly with regard to the indexing of significant images in sensitive fields such as medicine. Our goal is to design an algorithm that can help healthcare professionals in decision making in tumor diagnosis cases [3, 4].
Since the 1990s, scientific communities have started to implement content-based image retrieval system (CBIR system) based image indexing systems [5–9]. Searching for information from images databases is now possible thanks to CBIR systems such as, for example, Google images 1 . These image recognition systems make it possible to perform an image search by URL or by remote loading of an image request stored in a local machine. Several indexing techniques and image search approaches have developed [10]. However, observations in this type of image representation show limits in remaining faithful to the analyzed image [11]. In this work, we analyze different methods to improve radiological information systems (RIS) which are currently expanding in Algeria. We propose a technique based on a computer processing of radiological images at two levels: the digital content and the semantics of the images.
Until today, the qualitative exploitation of medical image databases as well as the immense amount information of these images or the associated annotations remains a challenge to meet. That encourages us to develop an approach based on different techniques often used individually or separately. The exclusive use of keywords in TBIRs, or the use of a limited number of attributes in the case of CBIRs (shape parameters for shape recognition . . . etc.).
The objective of this work is to develop a hybrid system grouping the main methods already known based on the advantages of each of them and bringing an additional advantage by its particular assortment. We can call a system: CTBIR (for: Content and Text Based Image Retrieval). The proper combination of these two systems (TBIR and CBIR) lets us derive the benefits of both at the same time. Our contribution, in this present work, therefore, consists in the development of a CBIR system complementary to a TBIR system dedicated to public health practitioners to exploit as a learning system. The improved version dedicated to radiology experts for a better clinical decision-making during the diagnosis and treatment of the patient (CAD approach).
This paper is organized as follows. The existing methods and its related literature survey are presented in section 2. The proposed method for indexation and research modelization is presented in section 3. Implementation and Result analysis is described in section 4. Finally, this paper is concluded in Section 5.
Related Work
This overview introduces content-based and text-based image retrieval (CBIR/TBIR) system and some aspects of the technologies. Nowadays, the information retrieval (IR) domain and specifically using image has been an extremely active research area over the last three decades together with mutation technology around multimedia and Internet. The first research papers on methodology in image databases and processing had appeared in the early 80s [12, 13]. The scientific community in this field of image processing had given in details a set of descriptions in image archives, indexing approaches and searching needs, based on text retrieval using annotated images [14, 15]. Others in scientific communities had given an overview in this research topic in 90 s as the future of research over the image processing and image retrieval [16, 17]. We had to note that is important to explain all alternatives in image retrieval methods and to discuss the future progress in technics and methodologies improvements. As a definition utility, image retrieval is the process of browsing, searching and retrieving images from a large database of digital images. The advanced technology progress in image storage and acquisition had enabled the progress in big-data, cloud computing of image databases. In order to deal with high quality information in image, it will be necessary to develop appropriate CBIR systems to manage these image datasets in stored collections. In order to represent the digital content of images, several recent approaches have developed (Legendre Moments, contrast and intensity adjustment, histogram equalization, Feature Distance, etc.). Some based on the exploitation of the color or the gray level of the image [18–22]. Others exploit texture or shape in the image [23–26]. In these recent years with tera-bytes data storing of medical images, the main need expressed is: How to develop efficient methods of indexing, searching and retrieval in image databases? In CBIR systems, image processing is used to extract information that represents a set of properties such as color, texture, shape, etc. [27, 28]. These properties are the morphologic aspects as low-level attributes in the image. In these systems, it is possible to retrieve similar images according to image- query [29–31]. By this way, the text-based image retrieval (TBIR) systems can give main advantages to CBIR by completing processing on annotations or descriptive texts as high-level attributes (or semantic patterns) in image [32]. A brief recapitulation for any CBIR system, it involves in four main steps: Step 1: feature extraction and indexing of images in the database according to the chosen visual features, which form the perceptual feature space, e.g., color, shape, texture or any combination of the above; This forms the indexing part of the CBIR; Step 2: feature extraction of query as image (like in step 1); This forms the query-attributes part of the CBIR; Step 3: matching the query-image to the most similar images in the database according to some similarity measure. This forms the search-matching part of the CBIR; Step 4: end-user and feedback which governs the display of the outcomes, their ranking, the type of the user- interaction with possibility of refining (in step 1 or 2) the search process through some automatic or manual preferences. This forms the relevance feedback (or refining) part of the CBIR.
The CBIR system distinguishes the different regions present in an image based on their similarity in color, texture, shape, etc. (as low-level attributes in patterns) and determines the similarity between two images by reckoning the closeness of these different patterns [33]. Thus, we overcome the difficulties present in TBIR system because in morphology features in image can be automatically extracted by CBIR system and to some extent it indexes the image with better specifications compared to the text-based approach. Most of the methods used for image indexing (CBIR) are adopted from text indexing research (TBIR). As definition utility, “text-based image indexing is achieved by assigning (manually or automatically) descriptive metadata in the form of keywords, subject headings or classification codes to each image, and then use these as retrieval key-descriptors”. However, the complexity and subjectivity of TBIR have reported by many researchers. In order to deal with morphology features (and/or key-descriptors) in CBIR (and/or TBIR) applications, it is necessary to develop appropriate approaches in image clustering that depends on similarities [34–36]. Image clustering is often developed by computing the similarity measurement. This process is restricted to images in big databases that belong to the nearest classes as predicted for the query. The logical further in testing, the image retrieval process becomes skewed: categorization in clustering and similarity measurement become the retrieval process. Finally, the semantic aspects in image are still in rumination. Efforts in defining appropriate vocabulary (patterns, metadata, attributes, descriptors or ontologies) and language to represent the different objects in image are still a challenging task for both information retrieval (applying image processing) and CBIR/TBIR communities [37, 38]. The progress of multimedia semantics from MPEG-7 to Web3.0 and W3C community (description framework in RDF and XML for metadata) will be ongoing image research in many prototypes of CBIR systems in different context applications: medicine [39], astronomy [40], remote sensing in geographical information systems [41], media [42], social networks, etc [43].
Block diagram of the proposed technique.
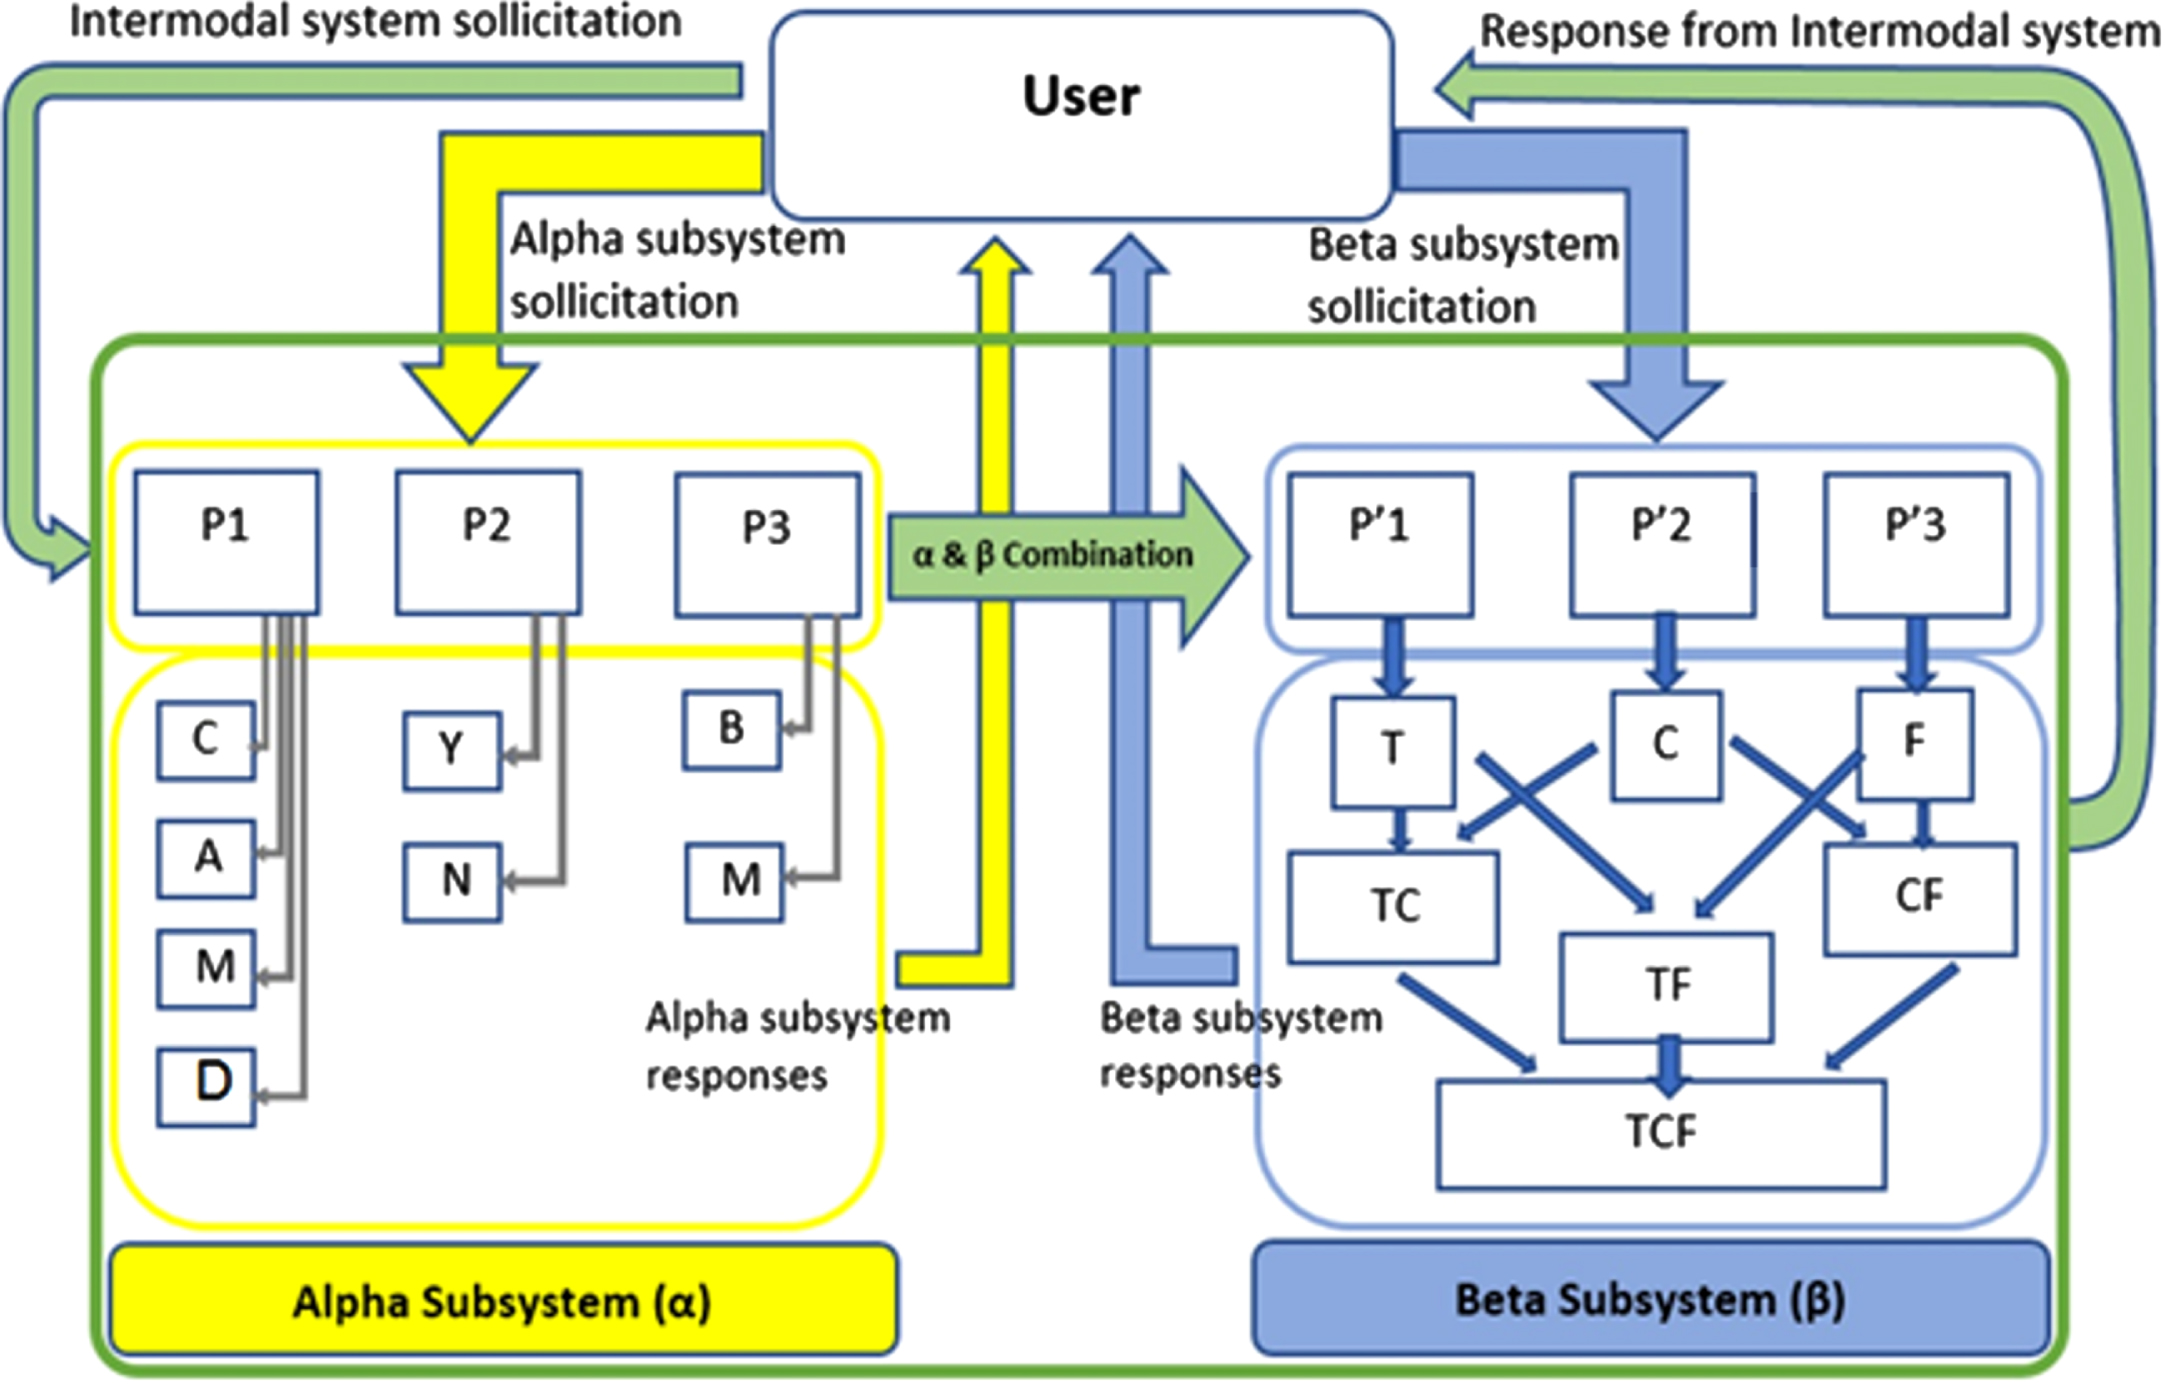
The principle of the proposed technique is given in block diagram illustrated in Fig. 1. This system is based on a pairing of semantic and low-level attributes. Intelligent attribute matching is made possible by two subsystems: The α-subsystem: A TBIR (Text Based Image Retrieval) subsystem based on a semantics attribute. In this part of the system, the indexing as well as the interrogation are carried out thanks to explicit key words such as: Cerebral (C), Abdominal (A), Mammography (M), Benign (B), Malignant (M) . . . etc.
These are MySQL queries. Practically, we have designed an easy-to-use search interface, on which the user is offered keywords for an optimal search. Each keyword corresponds to a well-defined group of images. Whenever the keyword submitted in the MySQL query, all images in the group are returned accurately. The β-subsystem: A CBIR (Content Based Image Retrieval) subsystem based on the digital content of the image. In this part, the indexing and the interrogation are carried out thanks to the exploitation of the low-level attributes of the image, namely: The texture (T), the color (C) and the shape (F).
Note that the letters (A, B, C, M, F, D, T . . . etc.) used in this paragraph and in Fig. 1 are given for abbreviation only. Practically, each letter corresponds to a specific (and unique) keyword on the user interface and in the index base.
The combination of the two subsystems gives rise to a more robust system called Intermodal or Hybrid. Details and operation of the different parts will be discussed in the next sections.
Case of any matter
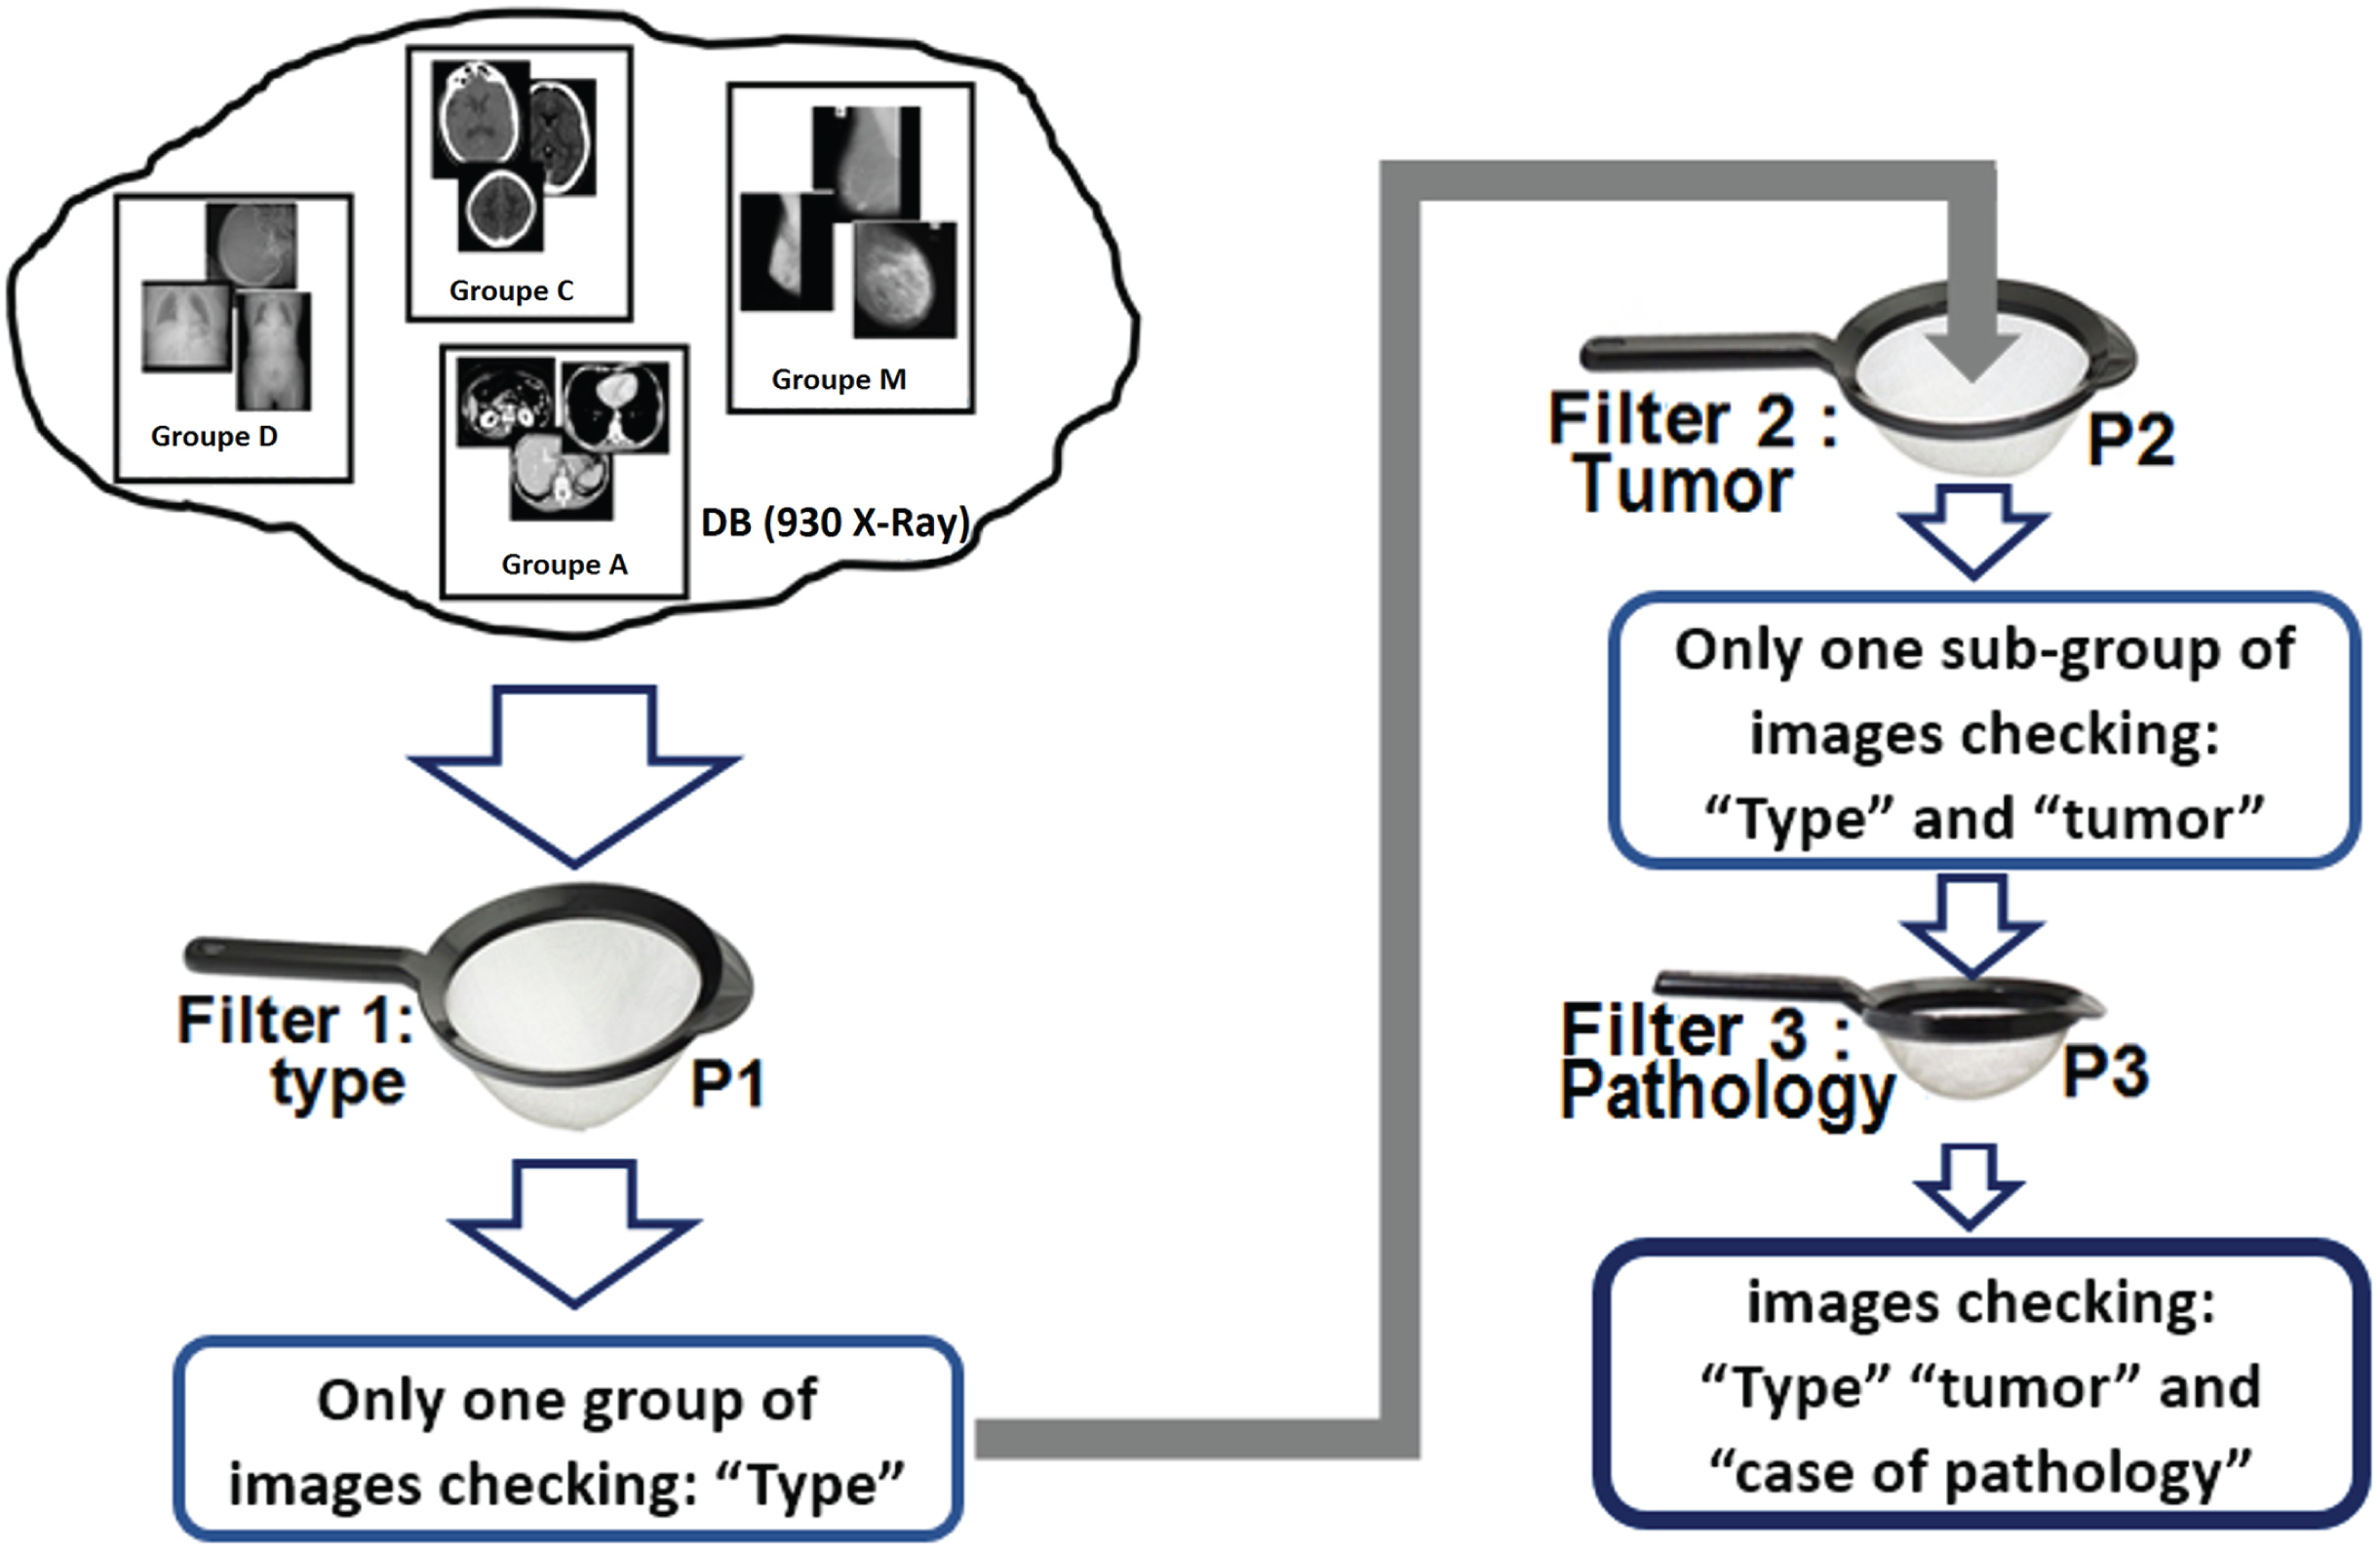
Structure A (Fig. 2(a)): It is clear that the matters to be filtered, successively passes through the strainers P1 and P2 to end up at the third strainer P3. The strainers are therefore complementary as: The strainer P1 (with large meshes) eliminates the “big waste”. The strainer P2 (medium meshes) eliminates the “medium waste” while the third strainer P3 eliminates the rest of the waste (the finest). Structure B (Fig. 2(b)): In this case, the P 1 to P 3 strainers are completely independent. The matters to be filtered will pass entirely into each of the strainers separately and independently.

Vertical (a) and Parallel (b) filtering of three strainers.
Equivalence of strainers in both the α and β subsystems
The α-subsystem: As the order of the strainers is important (The P1 –big meshes: first, the P2 - medium meshes: in the middle, and the P3 –fine meshes: last) the strainers P1, P2 and P3 are then designated as follows: P1 ⇒ Attribute 1: Category (Type) of the image (Cerebral C), Mammogram (M), Abdominal (A), Thoracic (T) …etc.) P2 ⇒ Attribute 2: Tumor case (existence or not of the tumor) P3 ⇒ Attribute 3: Pathological case (benign (B) / malignant tumor (M))
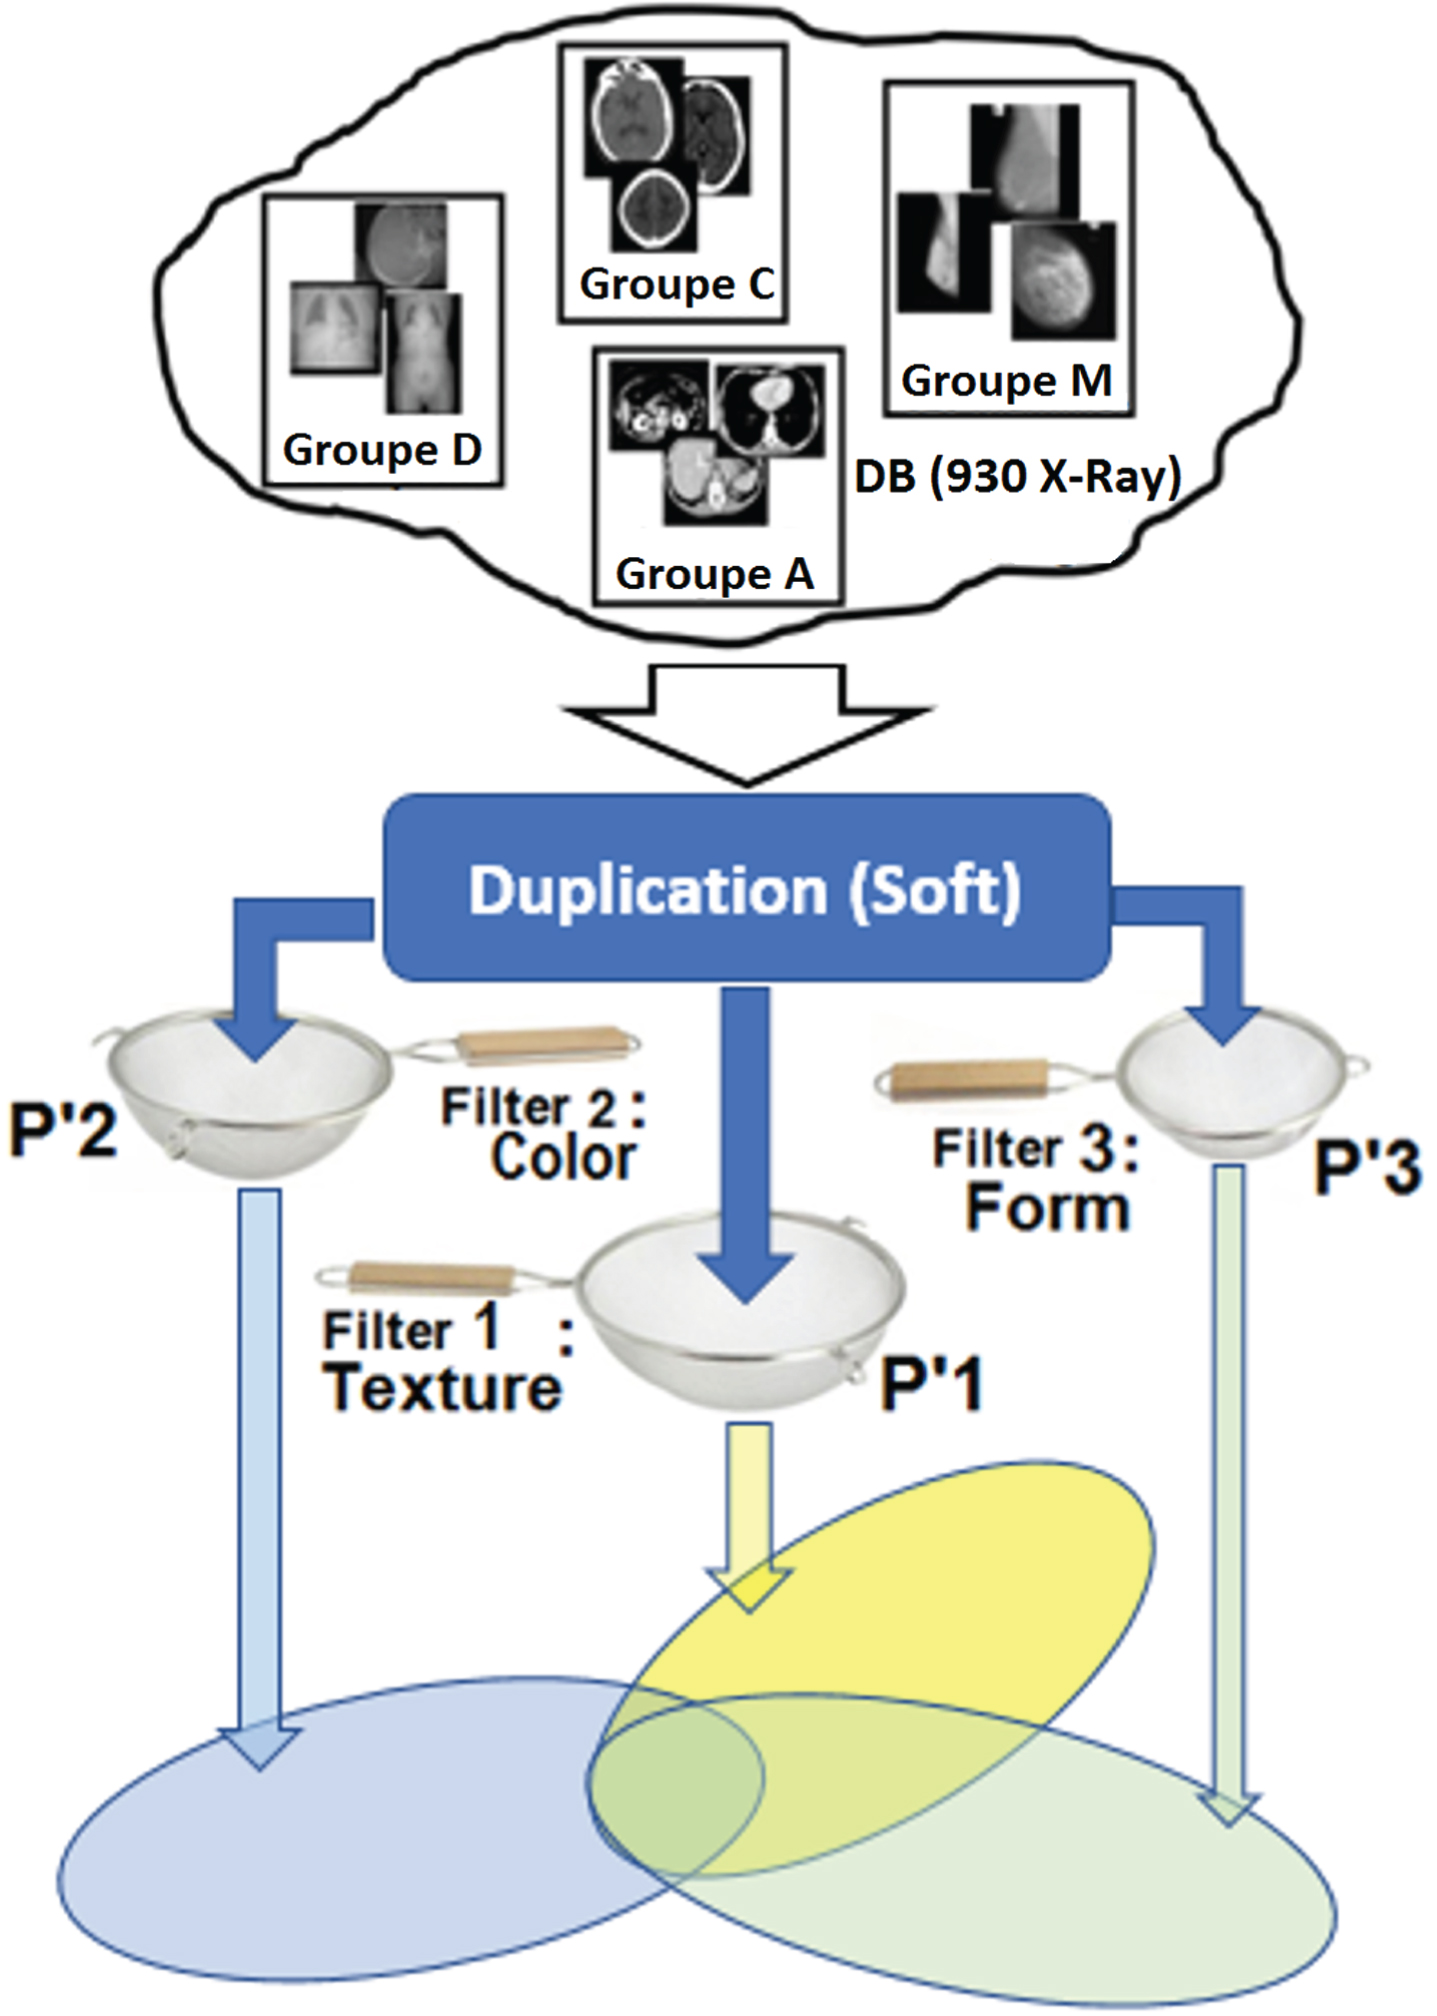
The β-subsystem: The strainers P 1, P 2 and P 3 of this subsystem are designated as follows (the order is not important): P 1 ⇒ texture P 2 ⇒ color P 3 ⇒ shape
Indexation phase
The indexing phase of the images is the most consistent task of the work since it involves indexing (doubling: by semantics and content) all the images of the database (nearly 1000 images). This phase of indexing requires a maximum of adequacy: A good choice of the semantic attributes and a good representation of the digital contents of the images. This task is executed offline where all the attributes are stored in a database (Index database) that can be queried online in the search phase.
Text Indexing (Semantic Attributes): The choice of semantic attributes is mainly related to the objectives initially drawn, namely: the expected results of this system. As this system is supposed to serve in the medical field, where specific pathologies are sought, it is inevitable to represent the pathological cases of images in addition to their types or natures. For this, we have opted for three essential semantic attributes, namely: the type of the image, the existence of a tumor and the pathological case. We have noticed immediately that the system, in this current version, should receive, online, well adapted requests too. The requests are then submitted in the form: Mammogram with benign tumor, brain image with malignant tumor …etc.
It should note that this method based on MySQL queries using predefined keywords. It enables to find, for example, all mammograms with malignant cases when the user specifies it in his request.
However, in practice, we confronted with a decision-making difficulty. If the user is a medical assistant, an intern student, or a radiologist, he is supposed to ignore the case of the tumor (or even the existence or not of the tumor). He should therefore not specify that in his MySQL query but he will attach his new X-ray in the form of an image in the hope of finding, more quickly and easily, similar images by content in order to be able to rule on the new case. Otherwise, it should compare visually, frame by frame, among all the images returned by the MySQL query! That is the point of the beta subsystem (Indexing by digital content).
Indexing by digital content: As the visual side predominates in the majority of medical diagnoses, the digital content of the images of the base is then represented by the fundamental “visual attributes”, namely: shape, color and texture. Shape: In this case, the shape parameters are extracted by means of the calculation of the invariant moments of Hu [44]. The invariant moments of Hu are simple to handle, robust to the changes of scale, the translation and the rotation. These criteria suit us a lot in our case.
In order to represent the shapes by Hu’s moments, we use a method of segmentation by classification with two levels of thresholding: Threshold at “Low level” using the OTSU algorithm: the (automatic) threshold is generally less than 50 (out of the 256 possible levels). This allows us to detect the entire image (extraction of the useful image from the black background): in this case, the Hu’s Moments will represent the overall shape of the image. Threshold at “High level”: this is manual thresholding based on experimental learning. However, the experiments we have carried out show that all the suspicious masses (in MIAS dataset for example) have intensities between 160 and 200. Therefore, an appropriate choice allows us to detect the specific shapes present in the image. For example, a threshold taken at 165 allows the detection of all masses representing 0.06% of the useful image or more. (About 14 pixels in radius around the centroid of the mass for a 1024×1024 image or: close to 4 pixels in radius around the centroid of the masses for a 256×256 images.
Note that we have performed our tests on images of sizes 256×256 pixels and 1024×1024 pixels only. Therefore, the dimensions of the objects (specific masses) detected are normalized with respect to the dimensions of the images which contain them.
As the MIAS dataset was pre-diagnosed by specialists with reference to the 1024*1024 resolution (the centroids of the suspect masses as well as the diameter in pixels are given at this resolution precisely) we then took this resolution as a reference in our evaluations. According to the annotations of the specialists, all the masses in this database have a radius greater than 17 pixels (Diameter = 34) the rest are micro-calcifications (10 cases in MIAS). Therefore, a radius of 17 pixels around the centroid of the mass corresponds to a mass with an area of around 908 pixels. Which corresponds to 0.086% by normalizing with respect to 1024*1024. The same mass of the same image at a different resolution (256*256 for example), would correspond to an area of only 57 pixels (a diameter close to 9 pixels). Thanks to this normalization the algorithm detects the two masses with the same precision.
However, we think to use, in a future work, the Pseudo-Zernike moments during the representation of the shape attributes. Because we are going to enlarge our image base by taking into account the different possible resolutions (128*128, 2048*n . . . etc.) as well as cases of micro-calcifications.
According to [44], the two principal moments directly involved in similarity measurement, with respect to the shape, are the first and second moments defined by:
Practically, the extraction of the shape parameters of an image I(x,y) (with MxN dimension) using the moments of Hu, is done simply by computing the centered moments following the relation:
The barycenter of the image (or of a particular shape) can be determined by the equation:
The vector thus characterizing the shape is stored in the index database in the form: Hu_MRV =[M1, M2] or Hu_Feat = [X, Y]. This vector characterizes the degree of similarity as regards shape, during the image search by its content (shape). Color: the intensity distribution (or grayscale) of the images is represented by the color histogram (gray levels in our case). Histograms are known for their resistance to a number of transformations of the image [45]. They are mainly, if normalized to the image size, invariant to rotations, translations and changes of scale [45]. Since the images in the database are in gray level (8-bit coded), the extraction of the histogram consists in counting, for each gray level between 0 (black) and 255 (white), the number of pixels x with the value g. The histogram thus extracted is supposed to be representative of the global distribution and detailed intensities that take all the pixels of the image considered. The extracted normalized histogram, noted h, will be saved in the index database for later use (during similarity computing) [46]. Texture: to represent texture, we use the technique we developed in [36]. The texture parameters are extracted by means of the Gabor wavelets. This type of wavelet is known for its robustness (especially in the representation of texture). For an image I (x, y) of dimension MxN pixels, its discrete Gabor wavelet transform is given by the following convolution.
The function ψ (x, y) is the 2D Gabor’s function.
After applying the Gabor filter on the image, with the different orientations n and filtering levels m, the averages and standard deviations are computed:
The values of the averages:
Like Energy:
The values of the standard deviations:
The set of values of the means μm,n and standard deviations σm,n are thus computed, will represent the components of the vector of texture characteristics. This vector will then be saved in the index database for later use (search by texture parameters).
The α-subsystem (Semantic attributes) If only the α-subsystem (search by semantic attributes) is selected by the user, the search will be carried out according to the principle illustrated in Fig. 3. In taking the case of a query with three attributes, for example: Brain image with benign tumor. The important words in this query are: cerebral, tumor and benign. In this case, the three strainers are then solicited as follows: The strainer P1 (image type) is solicited as: type = “cerebral”. In this case the strainer P1 eliminates all “waste” other than “cerebral” at the exit of P1 only cerebral images (all brain images are returned 410 in all) will be obtained. The strainer P2 (existence of the tumor) is solicited such that: tumor = “TRUE”. At the exit of this strainer only cerebral images with tumor will be obtained. “Tumor less” (healthy) brain is eliminated. The strainer P3 (pathological case) is requested such that: case = “benign”. This strainer eliminates all “malignant” cases, so in output, exclusively brain images with benign tumor (all the relevant images) will be obtained.
Structure of the α-subsystem.
The search for similar images is carried out according to the classic Boolean document search model. In this case (under PHP) the search is carried out, by using a simple MySQL query with an appropriate use of Boolean operators (and, or, not), as an example:
$request = “SELECT * FROM table_signature where type = ’$type_in’ and tumor = ’$cas_in’ and pathology = ’$patho_in’; ”;
Such as the variables used in this query namely: ‘$type_in’, ’$cas_in’, and ’$patho_in’ correspond respectively to the type of image, the existence or not of the tumor and the pathological case of the tumor. The β-subsystem (Digital Content) When the β-subsystem is selected, there will be seven possible configurations: Only “Texture” selected: in this case, the search is carried out according to the textures parameters only (the selection is made thanks to the strainer P 1 in isolation) Only “Color” selected (strainer P 2 requested): in this case, the search performed according to the color settings (gray level in our case) only. Only “Shape” is selected: in this case, the search is carried out according to the shape parameters only (The selection is done by means of the strainer P 3 in isolation) The two attributes “Texture” and “Color” selected: the two strainers P 1 and P 2 solicited. The search performed according to the texture and color settings at a time. The two attributes “texture” and “Shape” selected: the two strainers P 1 and P 3 solicited. The search performed according to the texture and shape parameters. The two attributes “Color” and “Shape” selected: the two strainers P 2 and P 3 solicited. The search performed according to the color and shape parameters. The three attributes “texture”, “color” and “shape” selected: the three strainers P 1, P 2 and P 3 are all solicited. The search performed according to the texture, color and shape parameters.
Figure 4 illustrates the different steps of the research phase of the β-subsystem.
Structure of the β subsystem.
When we want to search for similar images Ti with respect to the image query Q, a procedure online is launched, with the extraction of the digital signature of the image Q. This image will save in three (03) vectors represent the texture, the color and the shape of the query. The similarity measurement of a query image Q with a target image T is then performed by calculating, for all the components of the feature vectors, the different approximation distances are defined by: For the texture: The Minkowski distance of second order is given by the equation:
For the color: Let hQ = [x1, x2,.... xn] and hT = [y1, y2,.... yn] be two histograms of the same size N respectively corresponding to the histograms of the request image Q and the target image T, the distance used verifies the Chi-square expression given by Equation (12) [35].
For the shape: For more efficiency, the calculations are limited to the two moments X and Y defined by:
X and Y are respectively the 1st and 2nd invariant moments of Hu defined in equation (1) and (2) above.
The distance d between the signature of the request represented by (X Q, Y Q) (stored in the index database like: Hu_Feat = [XQ,YQ]) and the signature of the target represented by (XT, YT) (stored in the index database like: Hu_Feat = [XT,YT]) is computed by Equation (10) such us:
The intermodal indexing system is achieved by combining the two subsystems α and β. Figure 5 illustrates the structure of the intermodal system. This global system can be exploited, in our case, under two possible combinations: First combination: Only one semantic attribute is selected in the α-subsystem (only the strainer P1 is involved). In this case the β-subsystem replaces the other two strainers P2 and P3. As shown in Fig. 6(a) . The search result corresponds to all the images returned by the β-subsystem itself “controlled” by the strainer P1 of the α-subsystem. In other words, the β-subsystem performs the similarity measure (the search) only in the set of images “proposed” by the α-subsystem. Second combination: Two semantic attributes are selected in the α-subsystem (both P1 and P2 strainers are involved). In this case, the β-subsystem replaces the last strainer (P3) only. In this case, the task of the β-subsystem will be reduced by preselecting the two strainers P1 and P2 of the α-subsystem. The results returned by the β- subsystem (which is also the output of the overall system) are more accurate and the computation time is then greatly reduced (Fig. 6(b)). From what we saw earlier, it is clear that the two subsystems α and β are complementary and interdependent. The shortcomings of one are addressed by the other. For example: if a user (possibly a radiologist) is undecided about the pathological (benign / malignant) case of a mammogram, while the tumor is manifest. In this case, the subsystems α will be incapable, in isolation, of removing the ambiguity: the semantic request is of type: “mammogram with tumor”: only the strainers P1 and P2 are solicited. The α-subsystem then will return all the mammograms of the base containing tumors. While the combination of β-subsystem (replacing the P3 strainer) should (thanks to the low-level research) remove the ambiguity to a certain percentage depending on the case. Conversely, if a user wishes to search, through the β-subsystem, images similar to a request one from the visual point of view (digital content), such as “brain images” according to a certain depth of the radiological section. In this case, not only does the β-subsystem lose considerable time searching among all the images in the database, but it also risks finding target images without any similarity to the request. In such a situation, the association of the α-subsystem greatly minimizes the search time and increases the accuracy.
Simplified structure of the intermodal system.
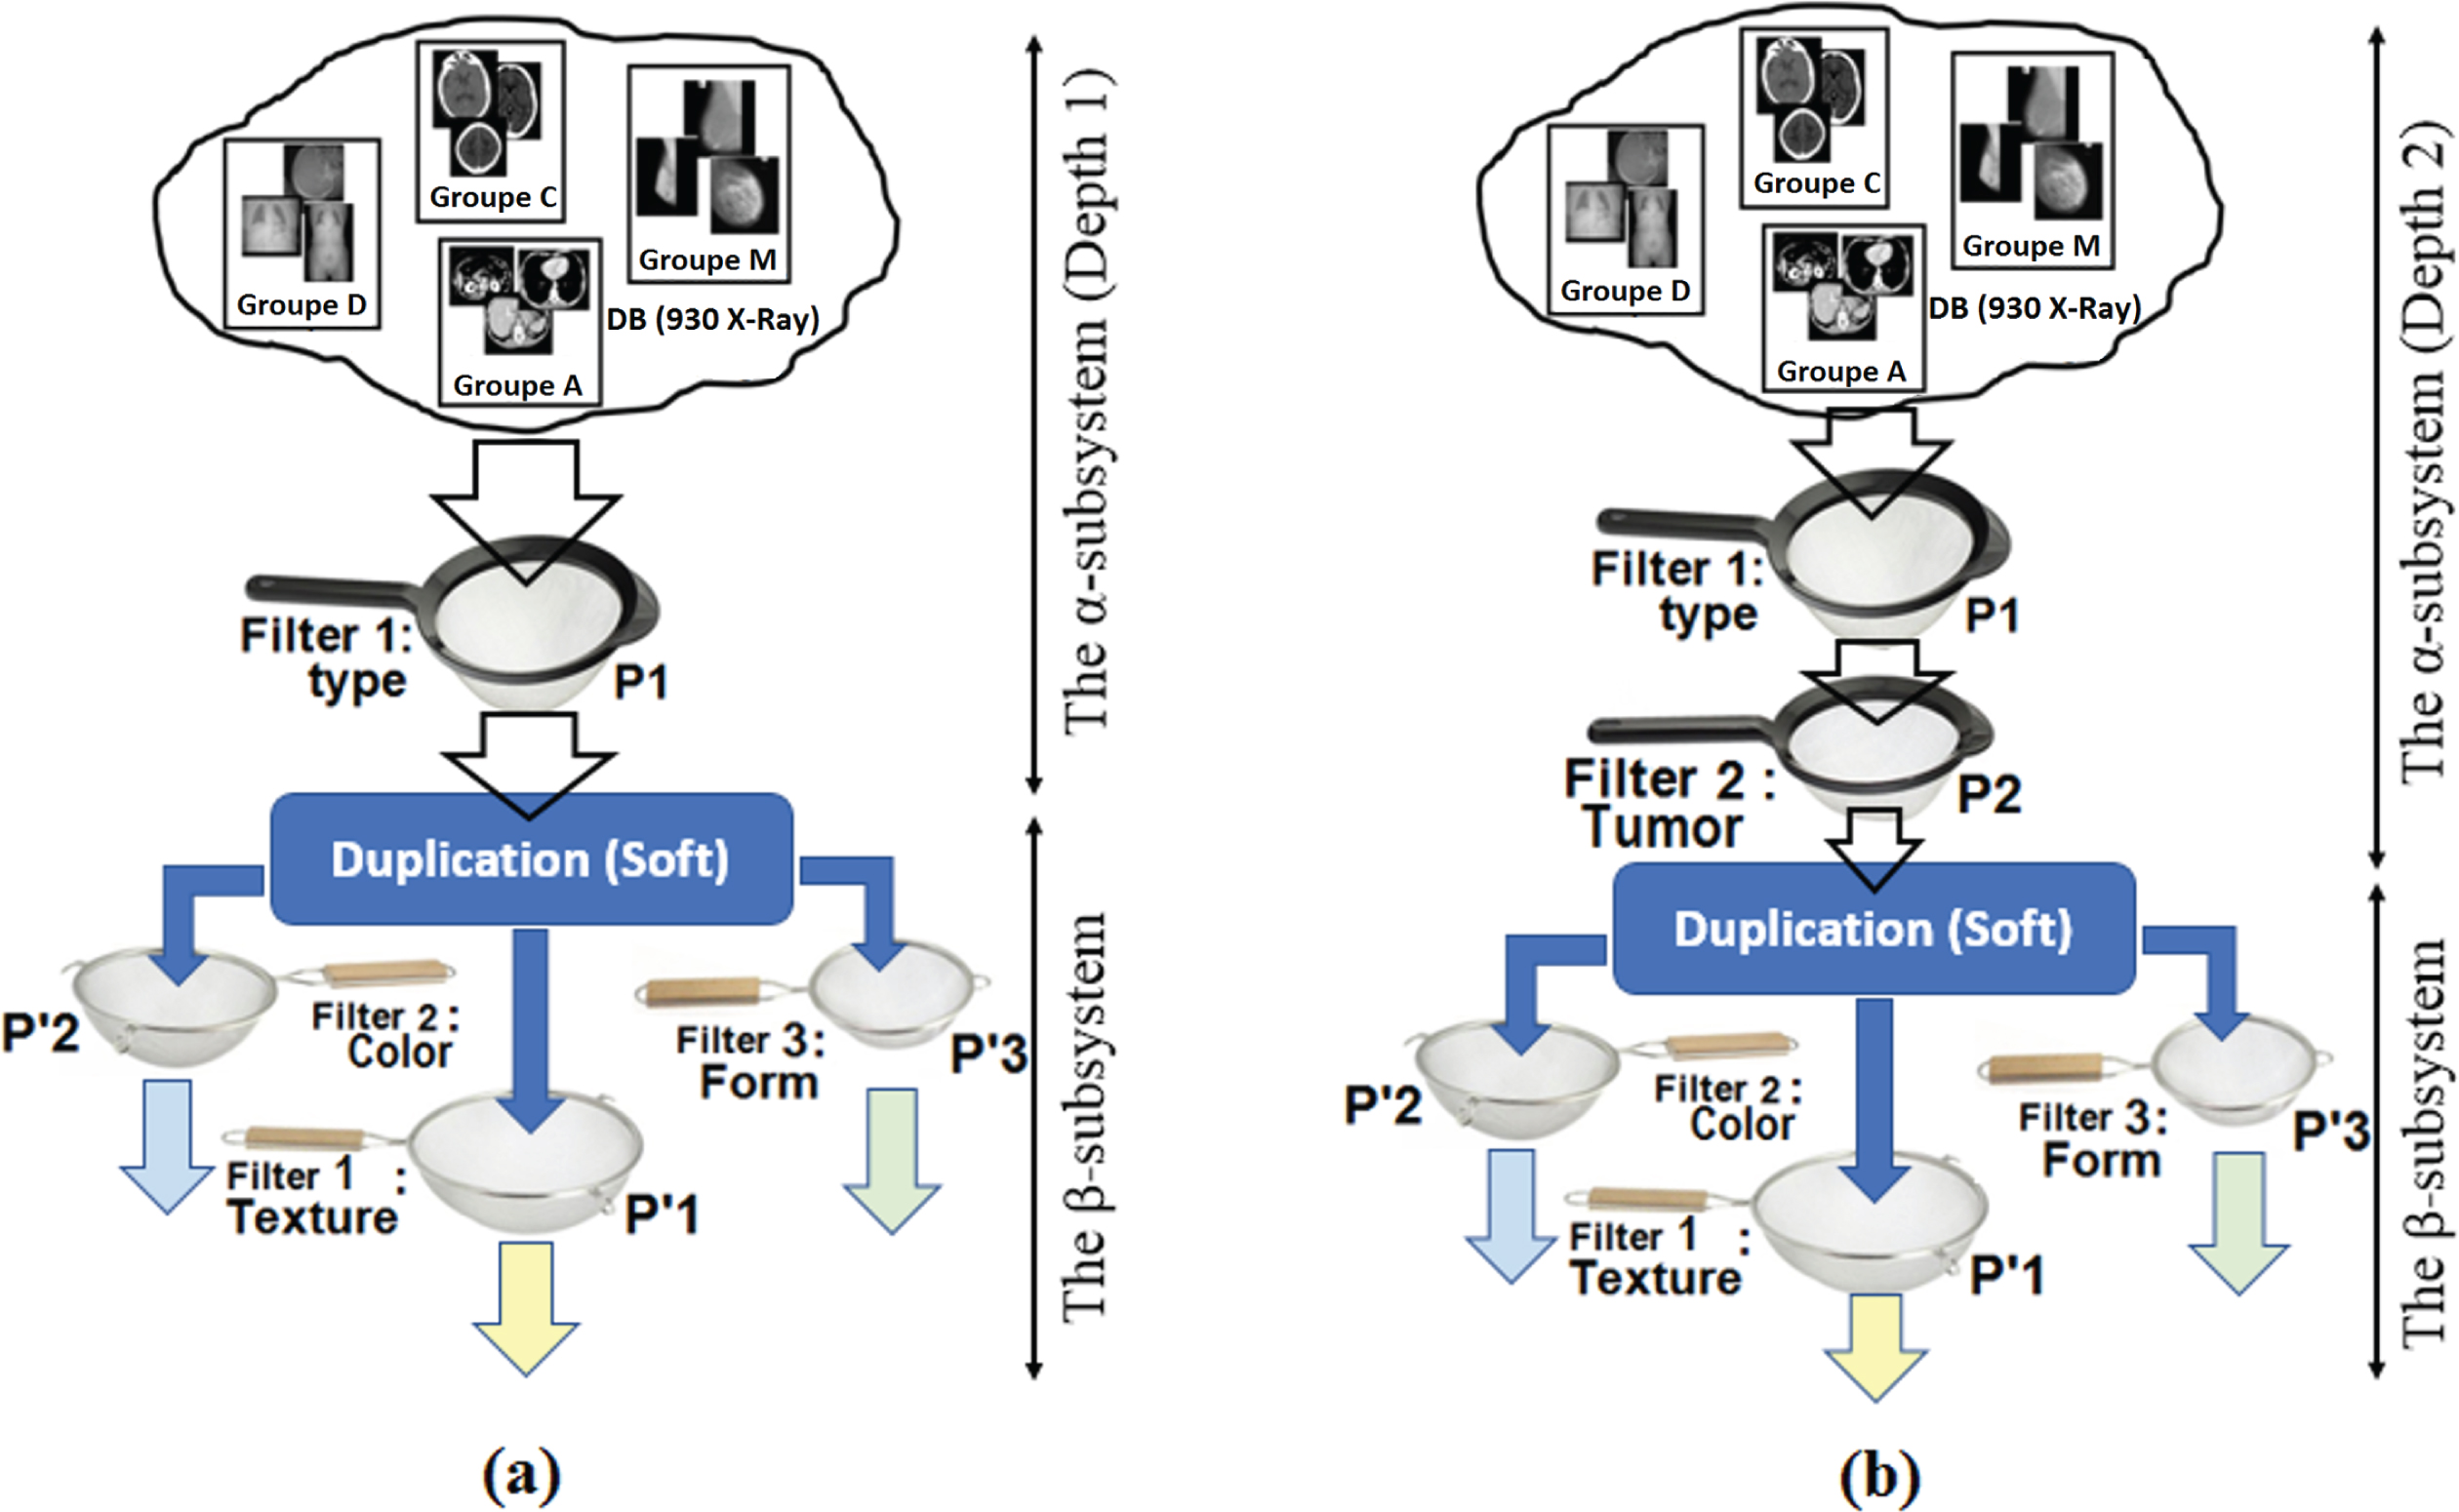
Structure of the intermodal system: (a) First Combination. (b) Second Combination.
Experimental dataset
We have used a database containing 930 medical radiography images: 320 mammograms used were from the MIAS (Databases Mammographic Image Analysis Society) and 610 X-ray images obtained from the Establishment Public Hospital (EPH-Rouiba) located in Rouiba, Algeria. Our test base is distributed over four groups: Each group contains a certain type of images. To know: The group C contains 410 brain images. Group A contains 90 abdominal images. Group M contains 320 mammograms. And group D contains 110 different images (skull, thoracic, bust …etc.). It worth to note that the latter group (D) is injected into the database to create” confusion” when searching through digital content particularly in order to objectively evaluate the system performance. An overview of the images database is given in Fig. 7.
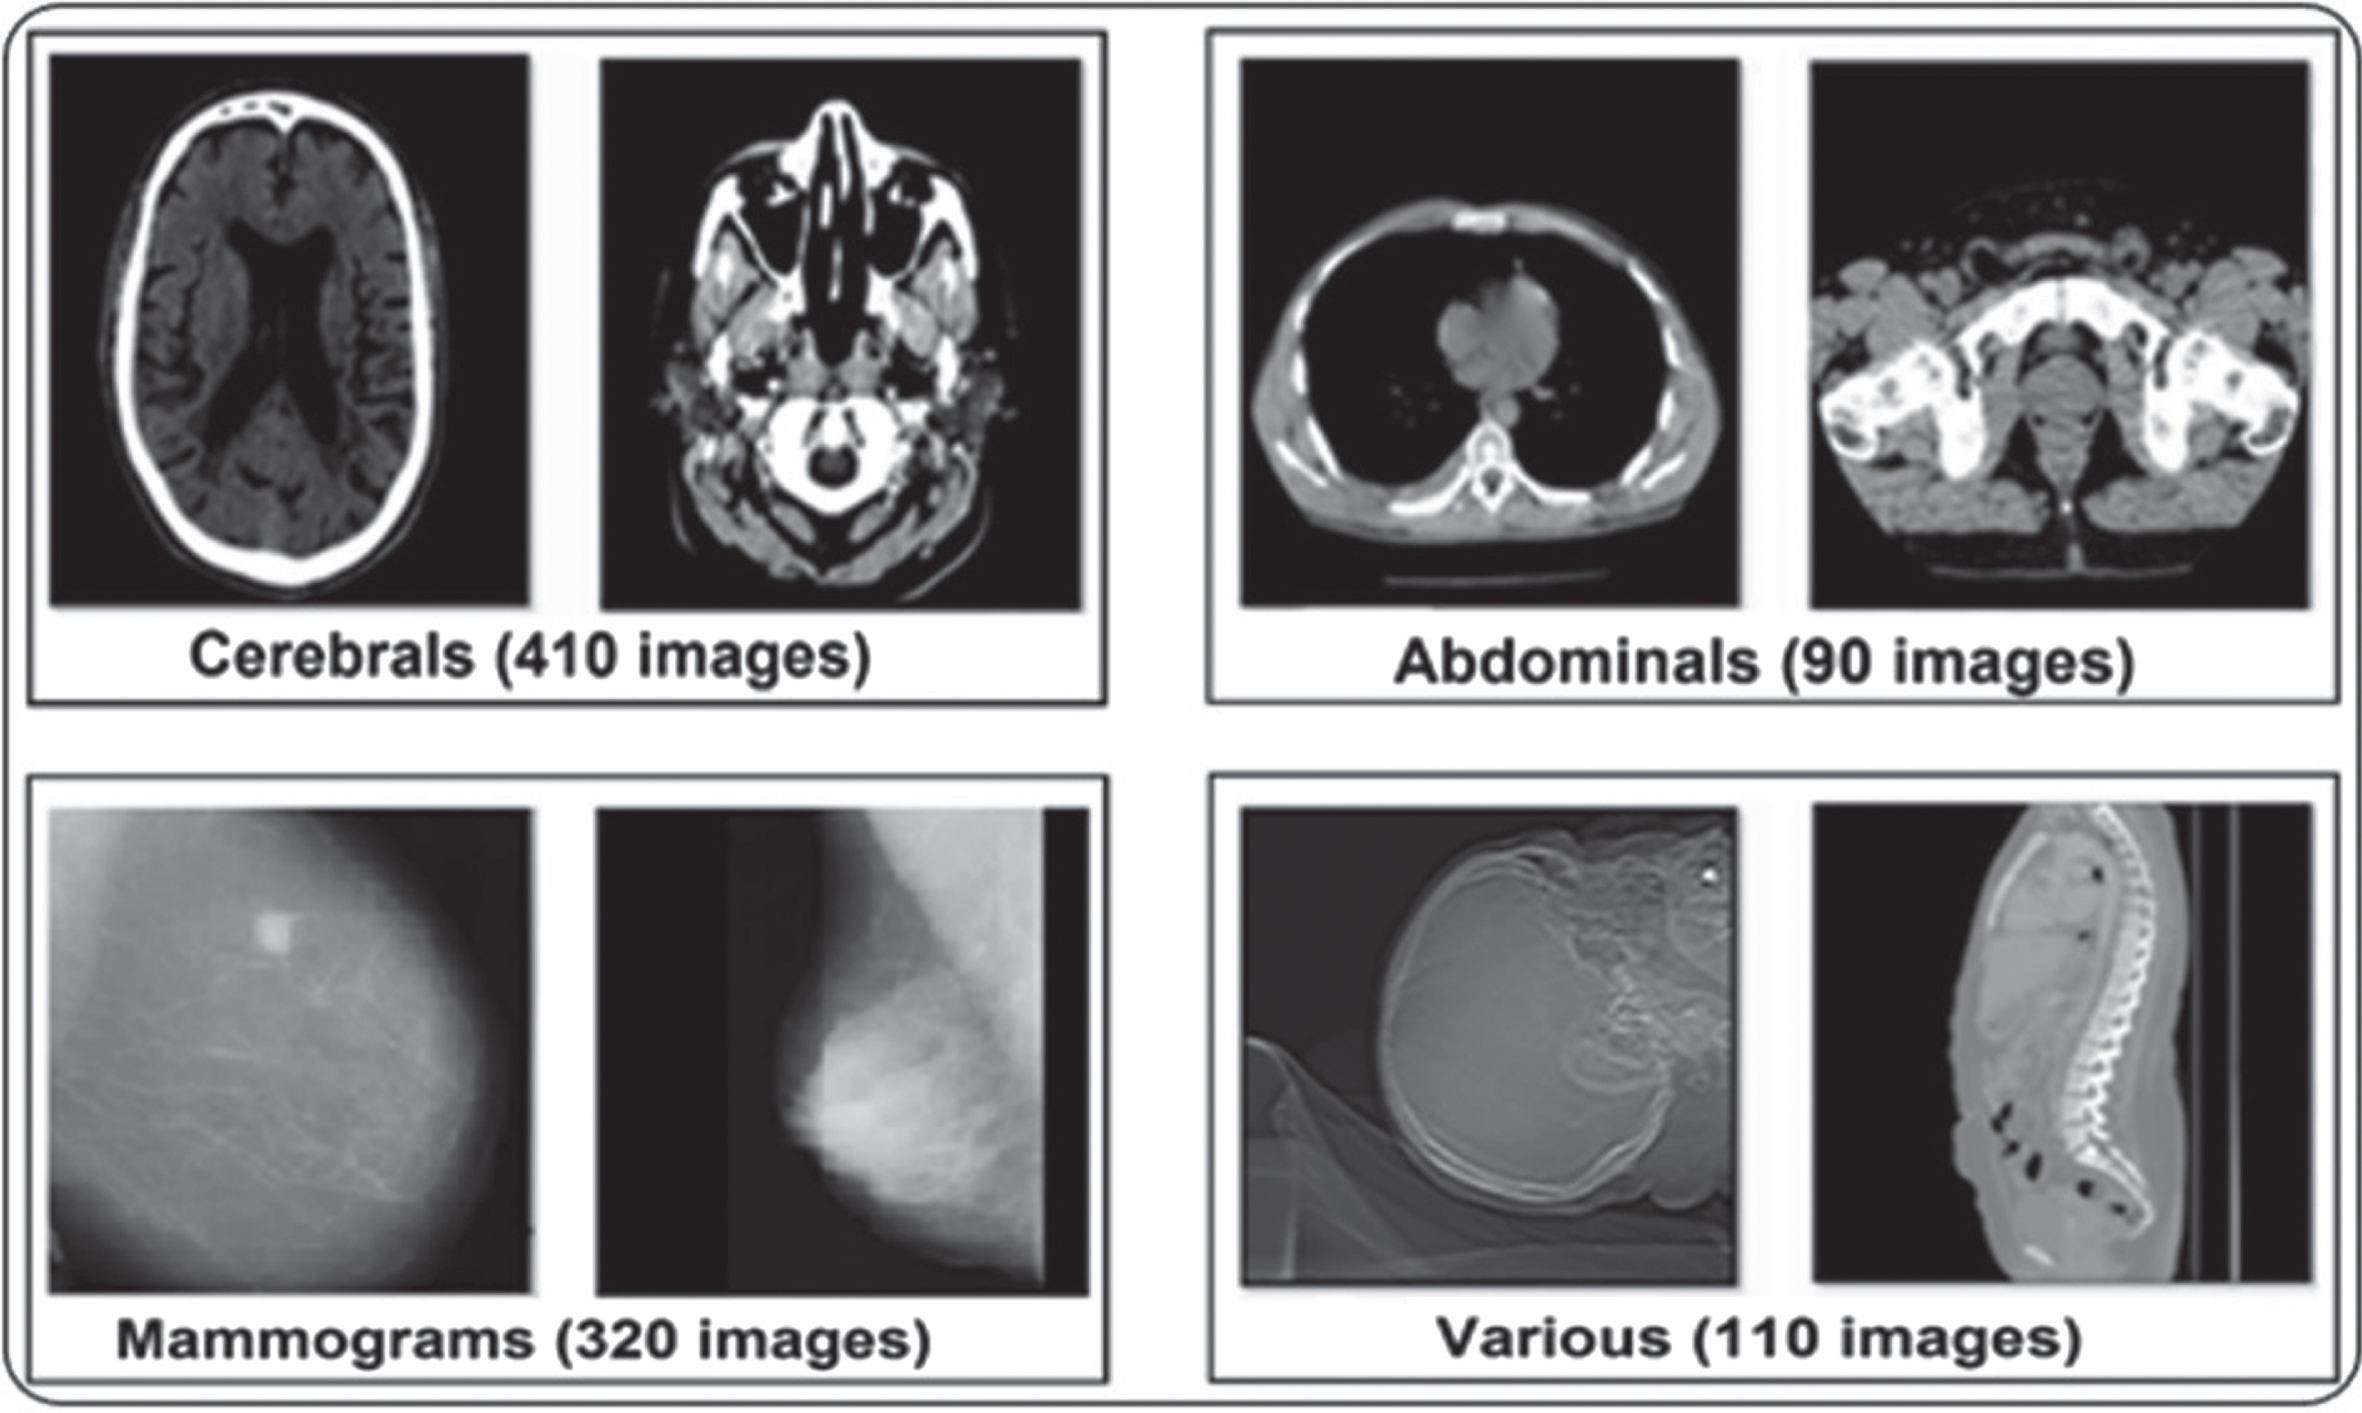
Overview of the overall image database.
The performance of a CBIR system is generally measured in terms of its precision and recall.
The precision
Let NFRI be: The number of found relevant images, NFI: The number of found images. The precision P is then defined as:
Let NFRI be: The number of found relevant images, NRIBI: The number of relevant images in the base of images. The Recall R is defined as follows:
In practice, the average precision AP is calculated for all requests corresponding to each recall (callback level) according to the following equation:
N
req
: The number of requests made P
i
(R): The precision corresponding to the request i for the recall R
As noted above, all relevant images of the database are found in an exclusive way (subject to using an appropriate combination of keywords in the MySQL query).
Since in this system we use a limited (and predefined) number of keywords: (abbreviated by: CAMD in Fig. 1 α-subsystem). and each keyword (proposed to the user on the search interface) corresponds to a well-defined group of images in database. Each time the keyword is submitted in the MySQL query, all images in the group are returned accurately. For this reason, the accuracy of this system is almost 100% (for a 100% recall too). This same precision value is achieved for the three groups of images: brain, abdominal, and mammographic.
The β-subsystem used in isolation
As mentioned above, in the research paragraph, we will deal with seven possible configurations. For each configuration, precision tests are calculated for each image group: Group 1 = brain images, Group 2 = abdominal images, Group 3 = mammographic images. Other images in Group 4 are considered irrelevant for all queries. However, these are involved in the content search process. The disadvantage is that this set of images is likely to reduce the accuracy of the system for some queries. However, the advantage of estimating the accuracy of the system objectively will be taken.
Configuration 1 (C1): Only “Texture T” is selected. The search result is noted T Configuration 2 (C2): Only “Color C” is selected. The search result is noted C Configuration 3 (C3): Only “Shape F” is selected. The search result is noted F Configuration 4 (C4): The two attributes “Texture T” and “Color C” are selected: The result corresponds to T∩C. it is noted TC Configuration 5 (C5): The two attributes “Texture T” and “Shape F” are selected: The result corresponds to T∩F. it is noted TF Configuration 6 (C6): The two attributes “Color C” and “Shape F” are selected: The result corresponds to C∩F, it is noted CF Configuration 7 (C7): The three attributes “Texture T”, “Color C” and “Shape F” are selected: The result corresponds to T∩C∩F, it is noted TCF
Figure 8 summarizes the different configurations considered. For each image groups (Group C: cerebral, Group A: Abdominal, Group M: mammogram) and for each configuration (Ci), the average accuracies AP(Ci) are given for different values of recall according to the relation (15) given previously. In this case, we get 21 tables (7 tables for each image groups). Subsequently, the partial average precisions PAP(Ci) are calculated for different recalls, such that: PAP (Ci) = average precision of the 3 groups (C, A, M) calculated for the configuration Ci (The three groups of images combined):

The Seven Possible Configurations of the β-subsystem.
The results obtained are summarized in Table 1. Then, finally, the overall average accuracies (OAP) of the whole system: s performed. This corresponds to the response, in terms of accuracy, of the β-subsystem, regardless of the configuration and regardless of the image groups. The corresponding graphical representation is illustrated in Fig. 9.
The results obtained for the β-subsystem
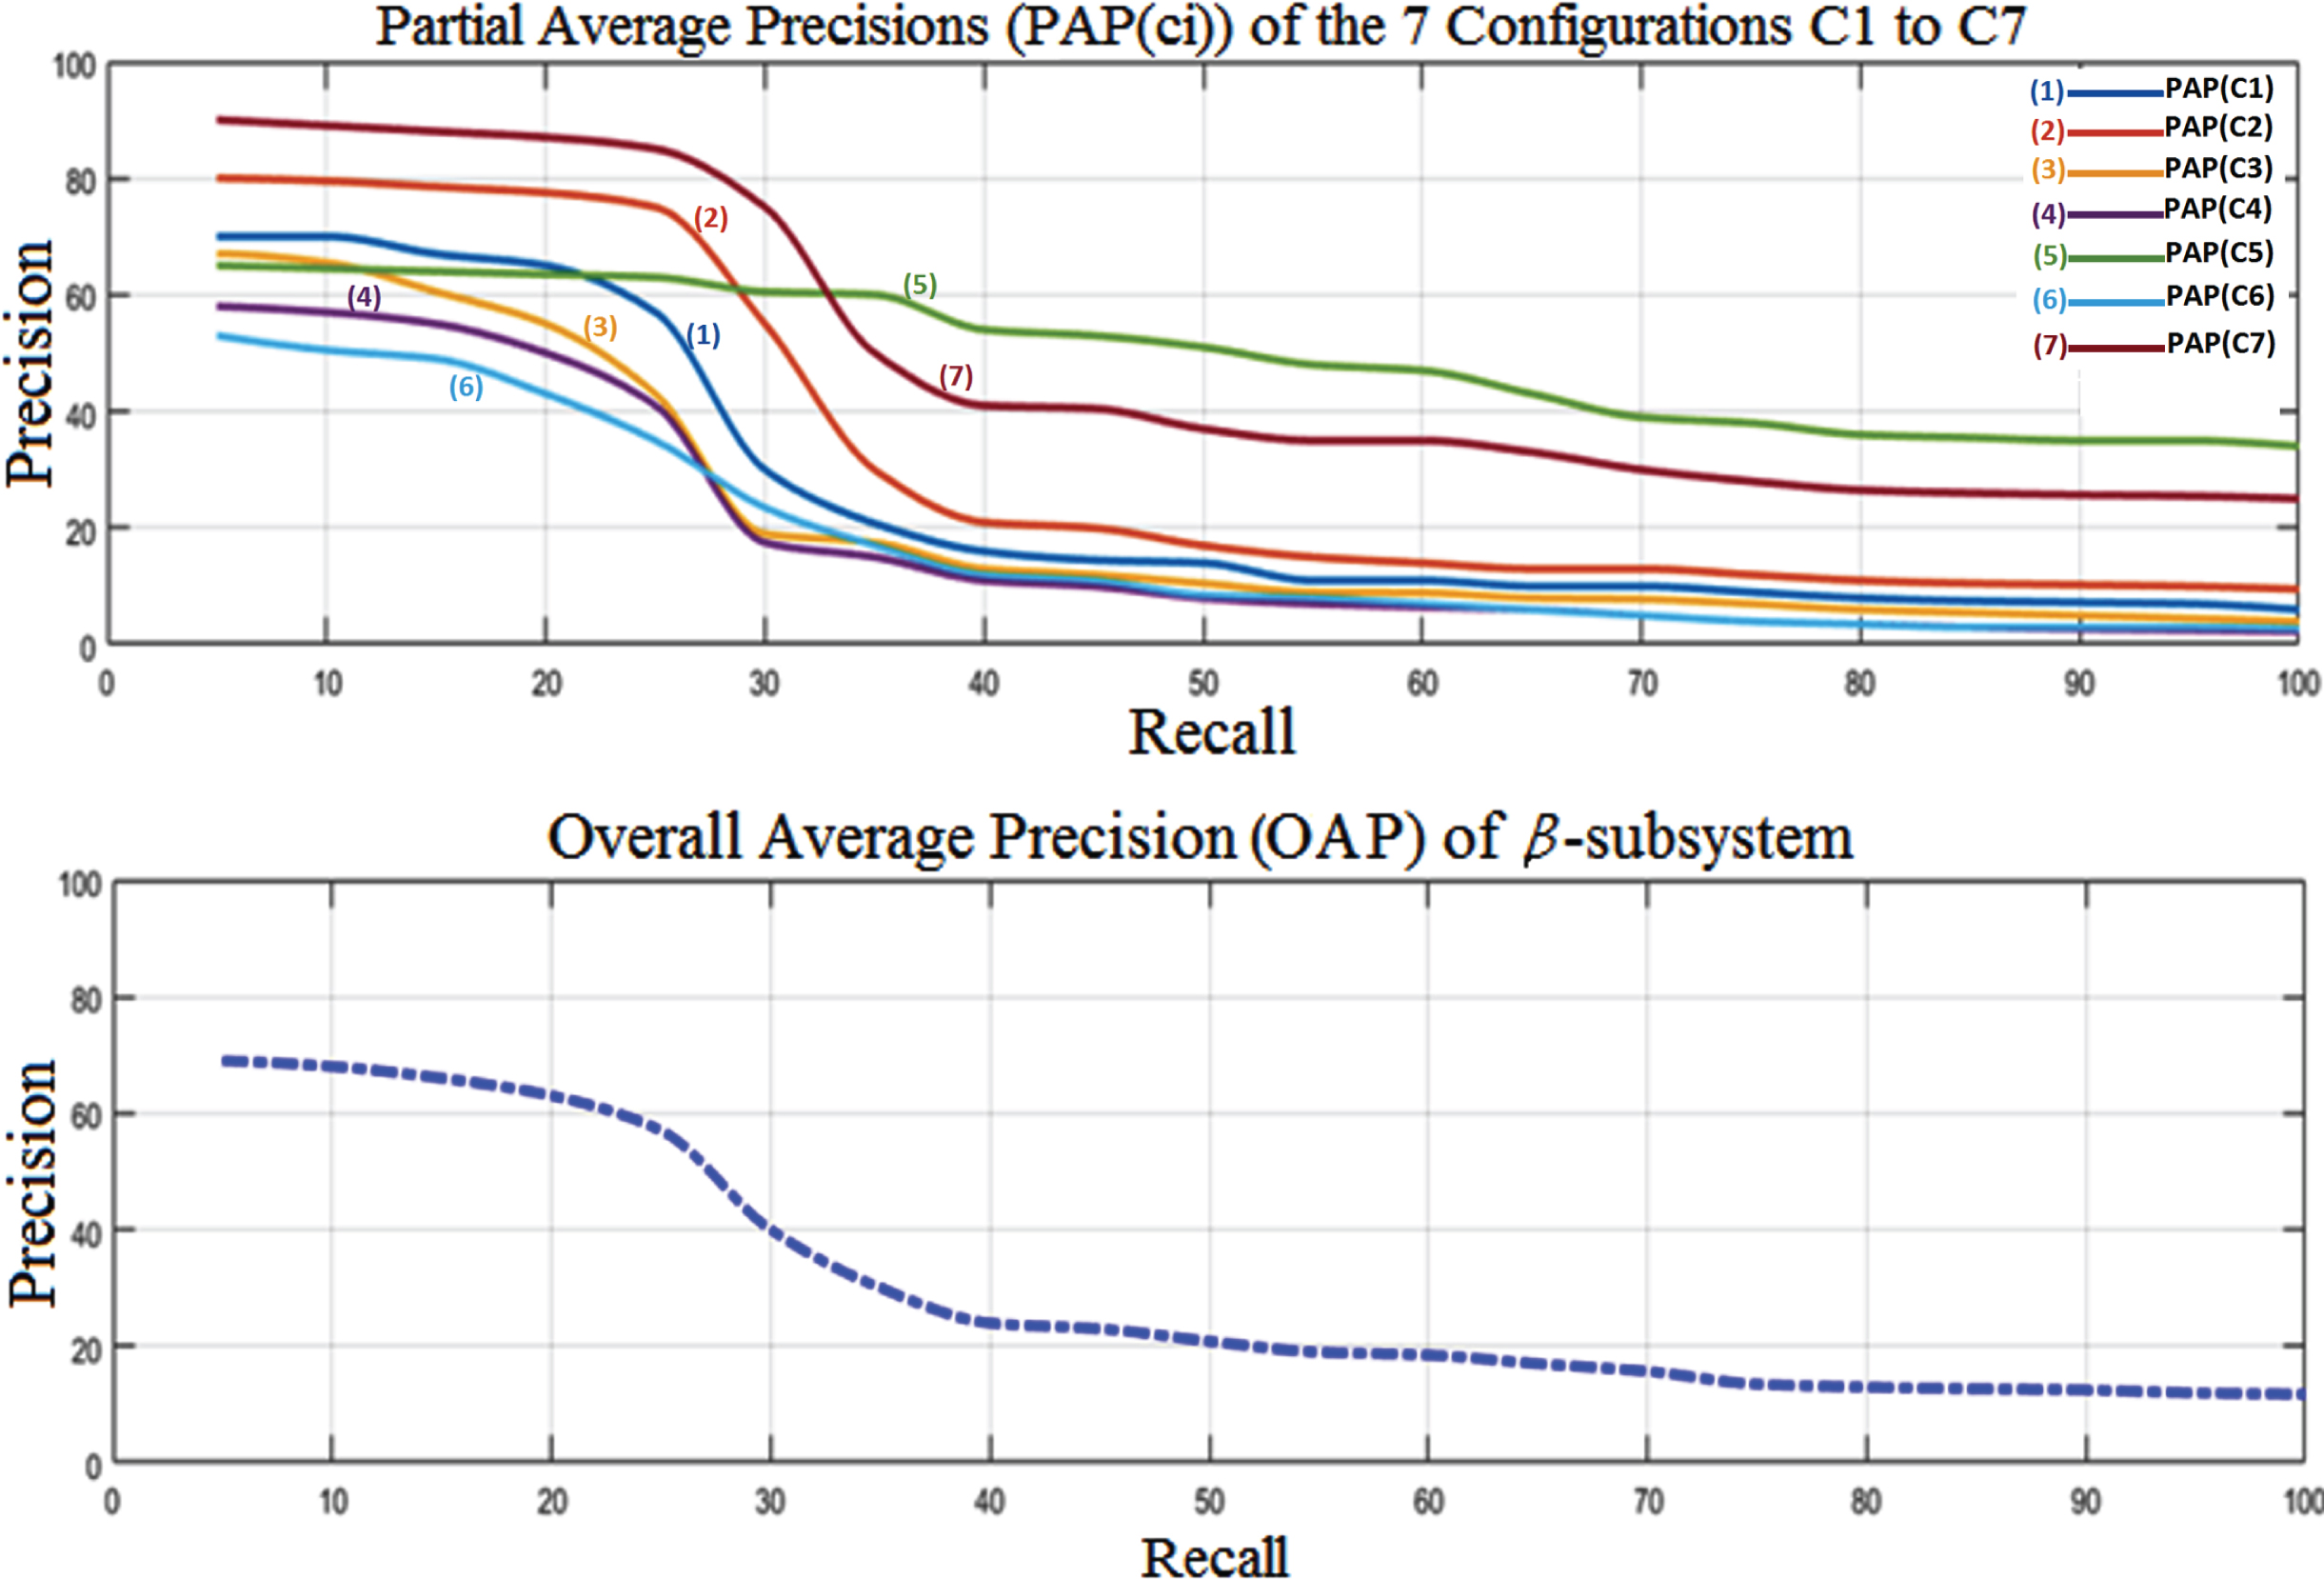
Graphical representation (summary) of the results obtained for the β-subsystem.
As explained in the intermodal research section. In both cases considered each have seven possible configurations mainly due to the different combinations that the β-subsystem can have (as described in the
The results obtained for the intermodal system according to the first combination
The results obtained for the intermodal system according to the first combination
The results obtained for the intermodal system according to the second combination
In summary, the results obtained for the 3 systems (β subsystems, the intermodal system in first combination and the intermodal system in second combination) are illustrated in Fig. 10. When the β-subsystem is used in isolation, the accuracy is relatively low (a precision of 57 % for a 25 % recall and a precision of 14.57 % for a 75 % recall). The accuracy is clearly increased thanks to the combination of the two subsystems. In this case, the substitution of the strainer P3 (pathological case) by theβ-subsystem gives broadly a better result in comparison to the case where the strainers P2 and P3 are both replaced by the β-subsystem. As an example, for a 25 % recall the accuracy of the intermodal system in second combination is estimated at 90 % (versus 81 % in first combination) while it reached only 57 % in the β-subsystem used separately. From the foregoing, it follows that the system tends to work better (it is more accurate for in high recalls) when the two subsystems are combined: In the α-subsystem, the strainers P1 and P2 are selected (type of image and the presence of the tumor, respectively) In the β-subsystem: the strainers P 1 and P 3 are selected (Texture and shape respectively) however, it is noticed that where the strainer P 2 (Color) is involved, the precision decreases particularly for recalls higher than 40 %. This must be, according to the estimation, the sensitivity of the strainer P 2 to the variation of light intensity from one image to another for the same type of imageries. Besides, the image databases of tests are not all taken under the same conditions (different imaging centers, different periods …etc.). However, if more precision is required (to the detriment of the number of relevant images found) Then the three strainers of β-subsystem (texture, color and shape) can be selected. It should be noted that the experiments which is carried out under this last configuration; it achieves a high degree of precision but returns in some queries an empty set.
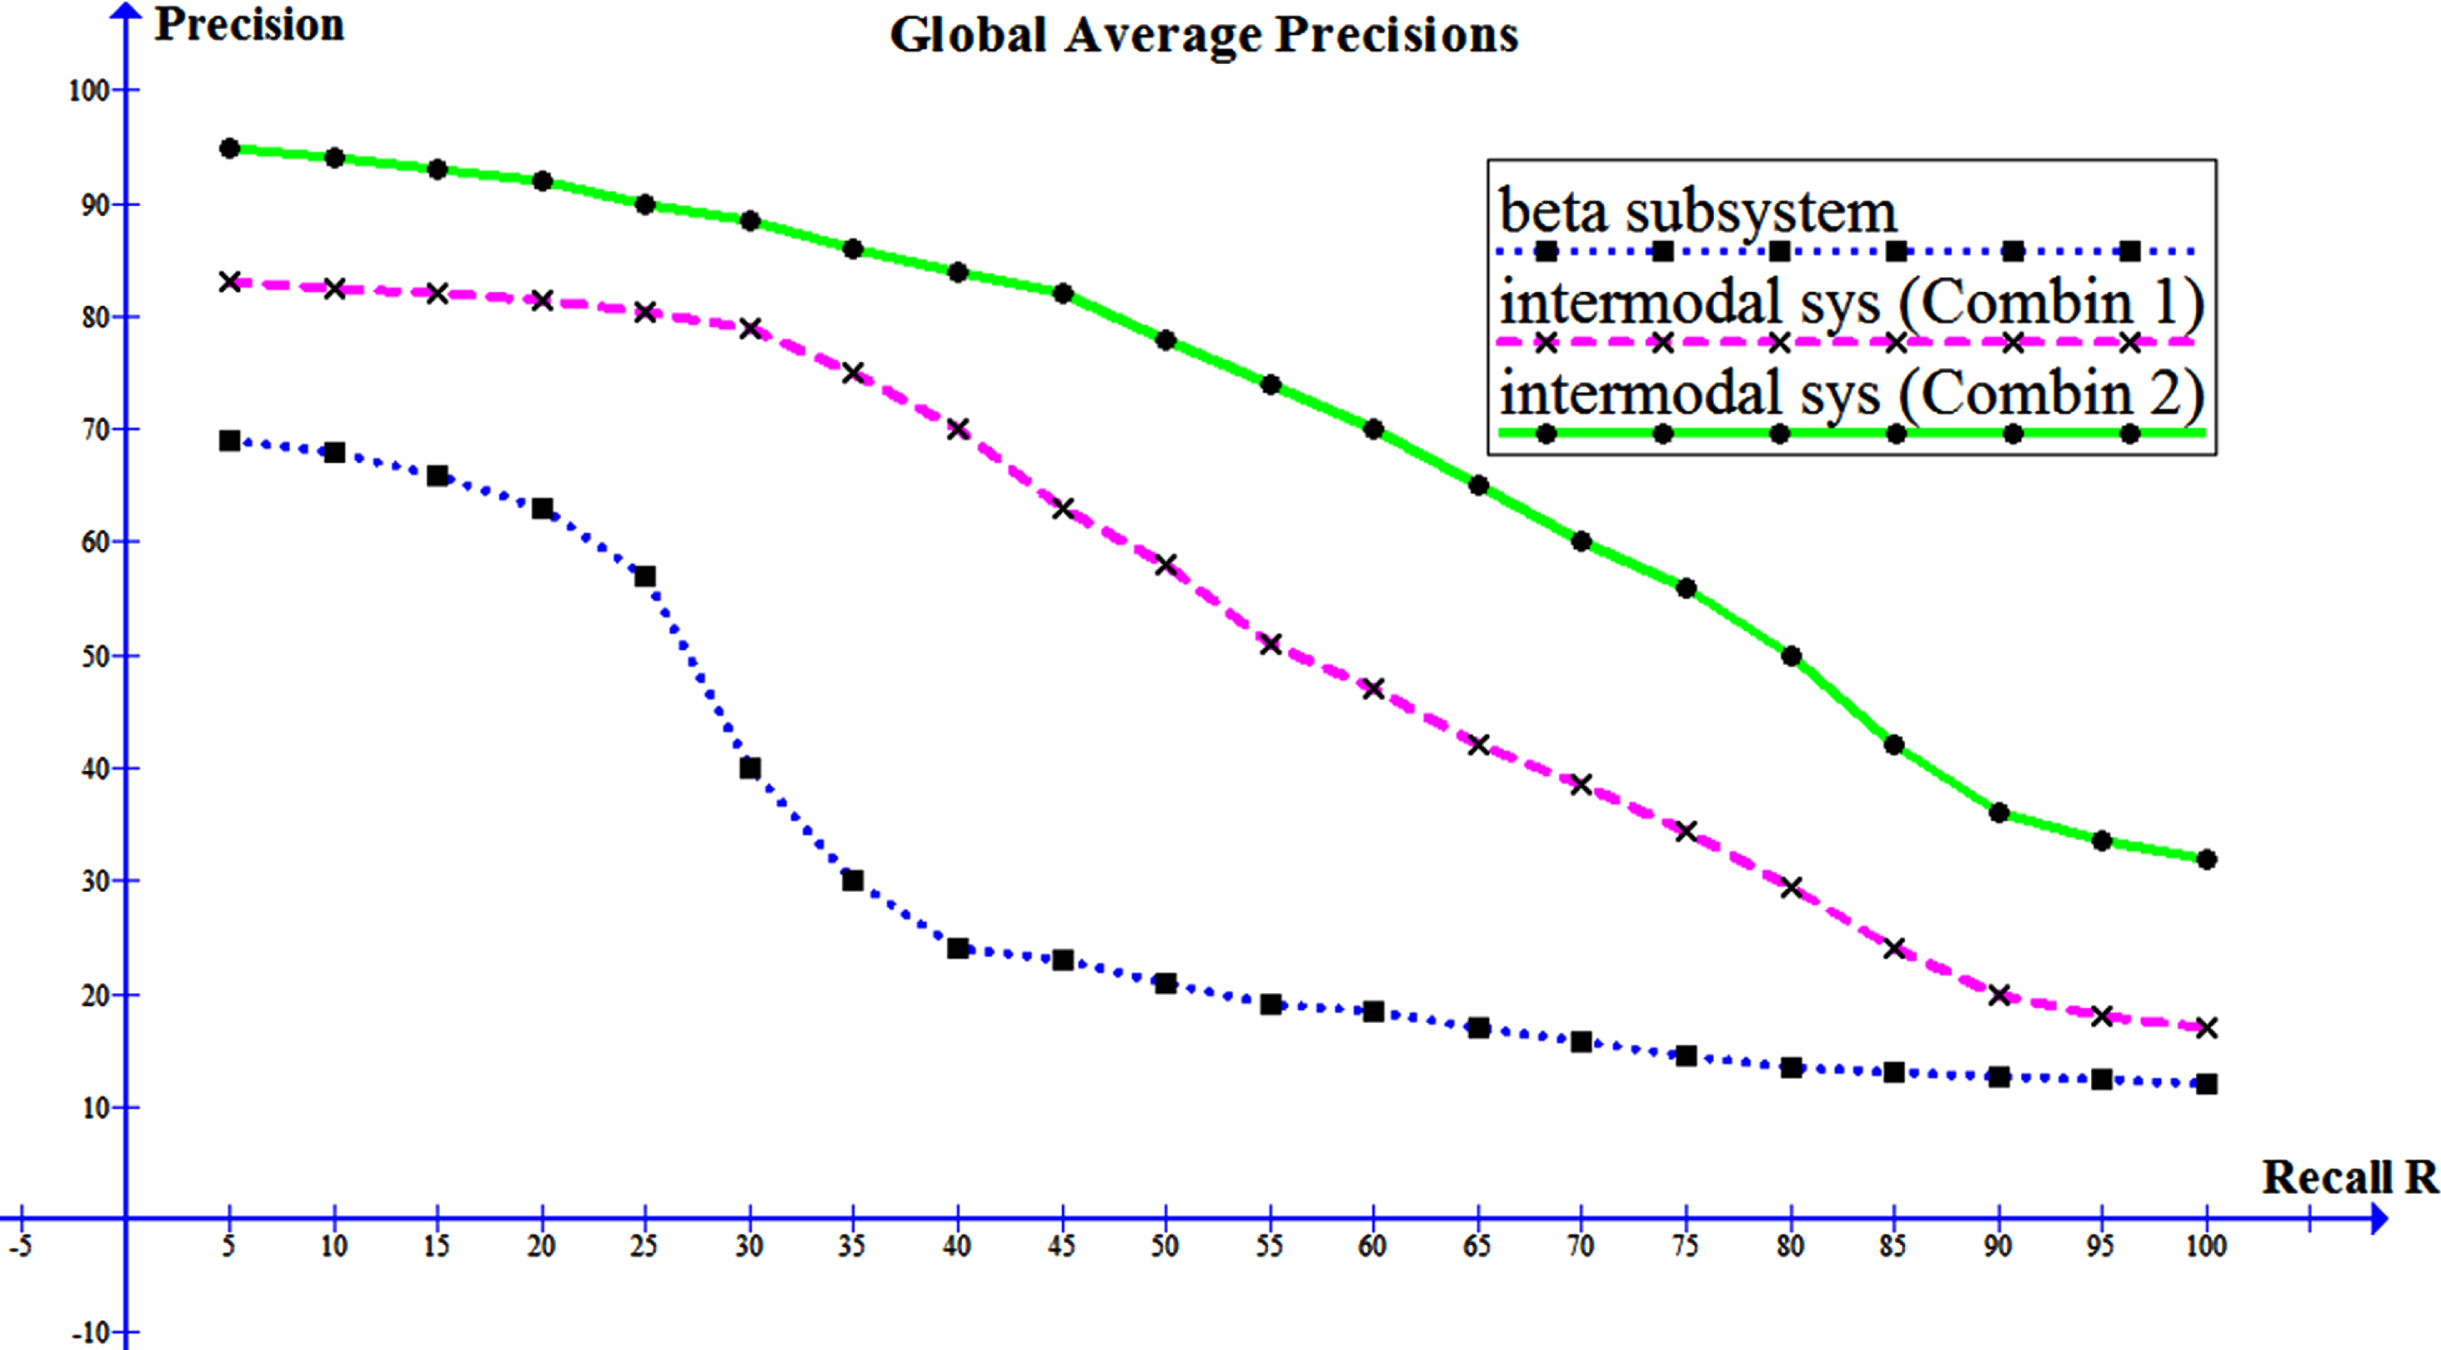
Summary graph of the results obtained for: The β-subsystem (in blue; The 1st curve at the bottom), the intermodal system (1st combination in Cyan; the middle) and the intermodal system (2nd combination in green; the 3rd curve up).
The choice of configuration is therefore important, and a compromise must be pre-established for each type of image.
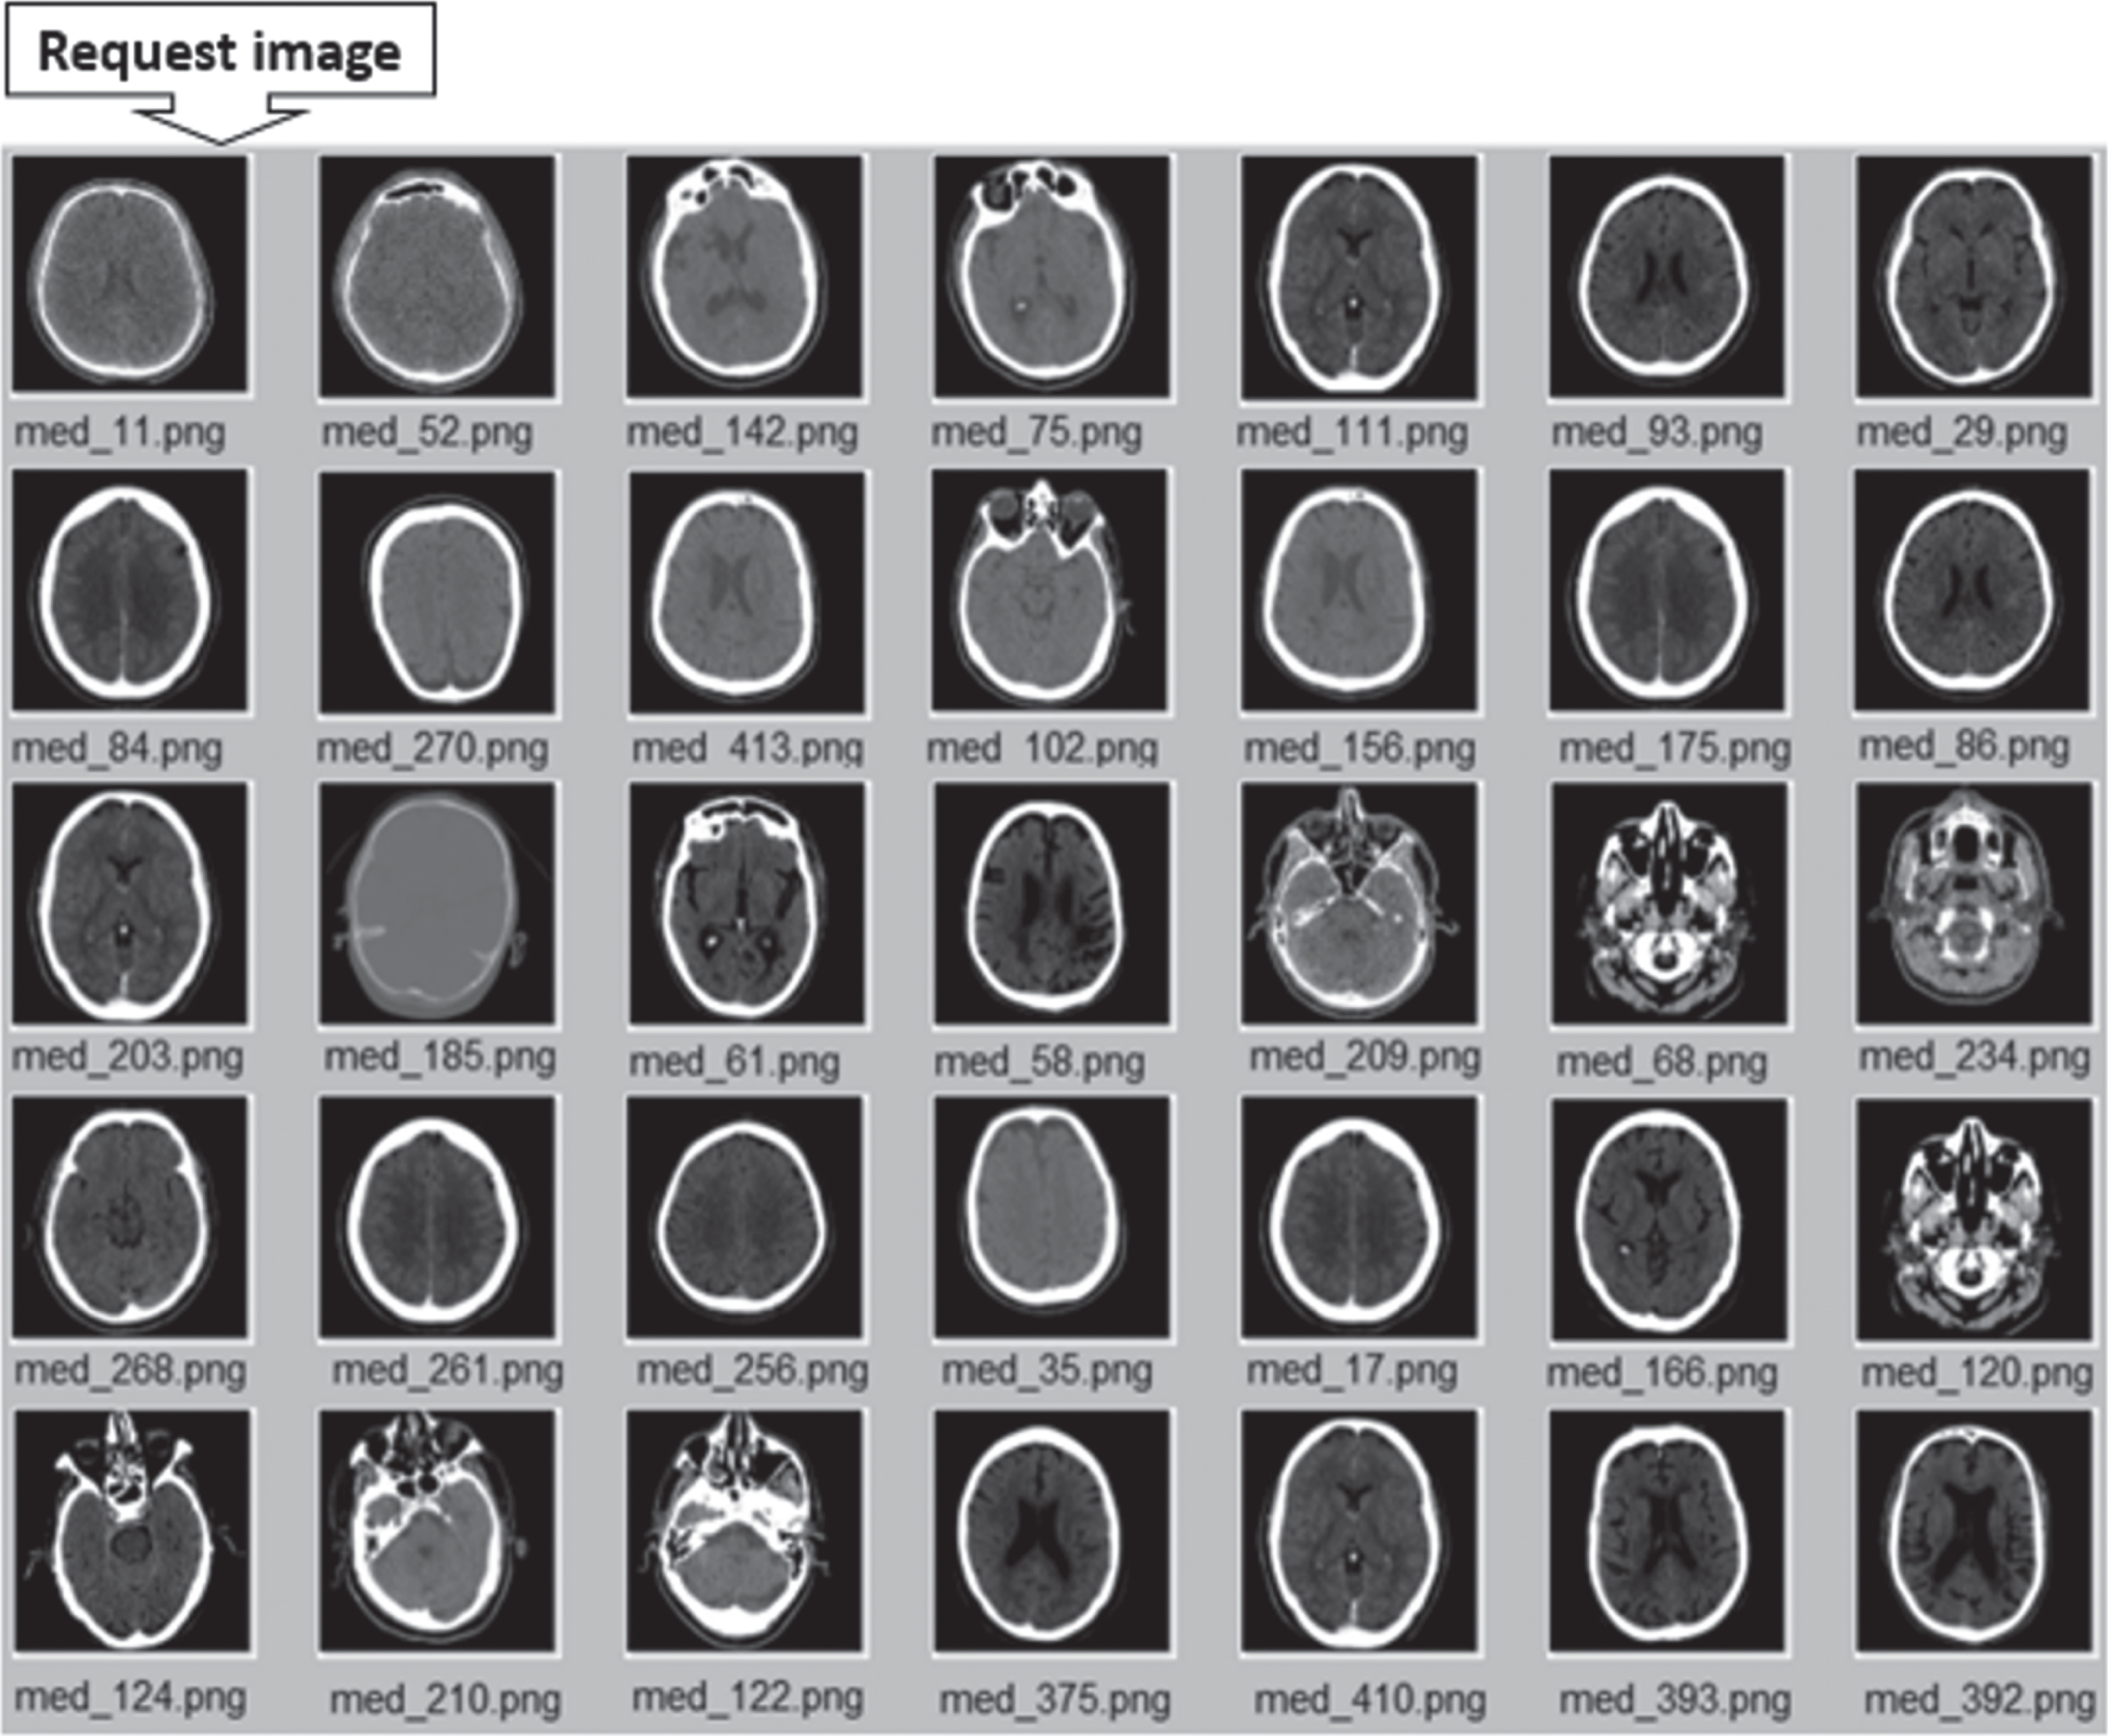
Figure 11 shows the results obtained of an example by means of content search. Although, the majority of the images found by the system are brain images close to the request one (called “med _11.png” in the Figure 11 below), the system also returns other images of a type that is different from the request one (some mammograms and some abdominal images). It should be noted that the results given in this figure (as an example), represent only one request among a hundred queries made. The accuracy estimation of this system is given in section 4.

Results obtained of an example by means of a content-based searching (β-subsystem).
Figure 12 shows the results of an example of an intermodal search. The results represent only one example of a hybrid search combining the two subsystems α and β. It can be easily noticed that the results are clearly improved compared to the previous ones (Fig. 11). Moreover, all the images coming from a different type to the request (abdominal images and mammograms …etc.) are eliminated. A priori, better accuracy is expected thanks to this system.
Results of an example of a hybrid search (intermodal system).
The results of the proposed and existing approaches listed in Table 4 and Fig. 13, where the average precision and average recall for top k returned images used to estimate the retrieval process. We compared the precision of the system obtained with our process for a recall of 27 % and the average precision with the algorithms obtained by Singh et al., Shatnaoui et al., Natarajan et al. and Sidhom et al. in [27–29, 36].
The average Precision and Recall of proposed and existing approaches

Comparative analysis of performance.
It should be noted that the datasets used by some authors (such as [27–29].) are almost identical, if we have taken the same bases by enriching them with new images collected locally (ROUIBA, Algeria). We then consider that there is a possibility of making a comparison since these authors all used X-ray images in their performance studies. It is much more about mammograms, chest or brain images. This is, for the most part, what we accounted for in our dataset.
These results clearly indicate that the proposed scheme with second combination have superior performance for heterogeneous medical image retrieval. For example, for a recall of 27 %, the proposed method achieves a precision performance of 89 %, significantly better than other algorithms found in [27–29] and [36] respectively. This improvement achieved due to the combination of semantic features and numerical content of the images during the feature vector-matching phase. On the other hand, the overall precision of the proposed method estimated at 70.05 % is better than 58.08 %, 62.45 % and 66.65 % introduced by Natarajan et al. [29], Sidhom et al. [36] and Singh et al. [27] respectively. It is also slightly higher than 70 % introduced by Shatnawi et al. [28].
In this paper, a hybrid system of indexing and image search was developed whose objective is to find among nearly a thousand medical images the ones that are similar to the request regarding the semantic side as well as the digital content side. The results obtained are very satisfactory. Besides, despite the disadvantage of not being able to maintain a high precision for recall above 75%, it remains advantageous that our system (in particular the intermodal system in second combination) can perform a specific image search (in a database of images with very high homogeneity) with an accuracy of around 90% for a recall of 25%.
Nevertheless, in this present work, we represented the digital content of a limited type of images without taking into account the different possible cases of rotations (eg 45°, 135, 225°…etc.) and the diverse scales or dimension (image of 181, 2896 or 5792 pixels diagonal …etc.)
While in future work, after expanding the test base to other types of images (considering several rotations and diverse dimensions) we will consider the recognition of specific shapes in the image (specific small lesions, microcalcifications, etc.) based on other techniques (eg segmentation by machine learning or U-Net approaches). We will use other invariant moments as Pseudo-Zernike Moments with employing an appropriate scale factor. Based on this, our new system should identify each new case (healthy, sick, benign, malignant . . . etc.) without using annotations or a pre-diagnosis (as the current system does). If the performance of the system allows it, this new system could aid radiologists (CAD) during the diagnostic phases of certain tumors.