
Abstract
BACKGROUND:
Pancreatic cancer is a highly lethal disease. The preoperative distinction between pancreatic serous cystic neoplasm (SCN) and mucinous cystic neoplasm (MCN) remains a clinical challenge.
OBJECTIVE:
The goal of this study is to provide clinicians with supportive advice and avoid overtreatment by constructing a convolutional neural network (CNN) classifier to automatically identify pancreatic cancer using computed tomography (CT) images.
METHODS:
We construct a CNN model using a dataset of 6,173 CT images obtained from 107 pathologically confirmed pancreatic cancer patients at Shanghai Changhai Hospital from January 2017 to February 2022. We divide CT slices into three categories namely, SCN, MCN, and no tumor, to train the DenseNet201-based CNN model with multi-head spatial attention mechanism (MSAM-DenseNet201). The attention module enhances the network’s attention to local features and effectively improves the network performance. The trained model is applied to process all CT image slices and finally realize the two categories classification of MCN and SCN patients through a joint voting strategy.
RESULTS:
Using a 10-fold cross validation method, this new MSAM-DenseNet201 model achieves a classification accuracy of 92.52%, a precision of 92.16%, a sensitivity of 92.16%, and a specificity of 92.86%, respectively.
CONCLUSIONS:
This study demonstrates the feasibility of using a deep learning network or classification model to help diagnose MCN and SCN cases. This, the new method has great potential for developing new computer-aided diagnosis systems and applying in future clinical practice.
Keywords
Introduction
Pancreatic cancer is a highly lethal disease, and mortality is closely related to morbidity. Most pancreatic cancer patients are asymptomatic until the disease progresses to an advanced stage [1]. Pancreatic serous cystic neoplasms (SCNs) and mucinous cystic neoplasms (MCNs) are rare pancreatic tumor types. SCN is a benign lesion with slow growth and a low malignancy rate. Most patients with SCN require only conservative treatment and regular imaging examination and do not require surgical resection unless the tumor is growing significantly faster or more aggressive. The optimal treatment option for patients with MCN is surgical resection before it developed into a malignancy. Therefore, differentiating between SCN and MCN is clinically crucial.
Medical imaging plays a vital role as reliable pancreatic cancer detection and diagnosis cannot be achieved based on symptoms and signs alone. At present, automatic detection of pancreatic tumors using contrast-enhanced computed tomography is widely used in the diagnosis and staging of pancreatic cancer [2]. Relevant studies [3] have shown that both CT and magnetic resonance (MR) are very sensitive for the detection of pancreatic cancer, up to 96% and 93.5%, respectively. CT was superior to MR in assessing tumor resectability, with accuracy rates as high as 86.8% and 78.9%, respectively. Whereas, the accuracy of detection and diagnosis largely depends on the experience of the radiologist, and misdiagnosis and missed diagnosis are not uncommon. To date, radiomics and deep learning research methods have shown increasing promise in advancing the precision management of pancreatic cancer through the diagnosis of precursor disease, early detection, accurate diagnosis, and treatment personalization and optimization [4].
Radiomics is an emerging medical image analysis method, which extracts quantitative features such as deep learning (DL) features and handcrafted radiomic (HCR) features from medical images in a high-throughput manner to describe the characteristics of the tumor [6]. Relevant studies have shown that radiomics is valuable in differentiating SCN from MCN, which provides new perspectives for addressing this clinical problem. Chen et al. [7] showed that a logistic model combining radiological features and CT texture features was more effective in differentiating pancreatic SCN and MCN than a model based on radiological features alone. Xie et al. [8] developed an ensemble model combining radiological and radiomic characteristics that could be used to aid in the preoperative identification of MCN and macrocystic serous cystadenoma (MaSCA).
Deep learning, a branch of machine learning, has shown great application value in medical image analysis. In recent years, many tumor detection methods based on deep learning have emerged. Compared with radiomics, an advantage of deep learning is that it no longer requires the ROI (region of interest) segmentation step, saves considerable time and effort, and also avoids the propagation of segmentation uncertainty into downstream analysis steps. In addition to studies using deep learning models alone, several studies combine deep learning with radiomics to make predictions by building an ensemble model. Yang et al. [9] used deep learning and radiomic methods to extract features and ensemble the classification probabilities of three single classifiers (KNN, Softmax, and Bayes) using random forest classifier to differentiate pancreatic SCN from MCN. Dmitriev et al. [10] trained a radiomics model, a CNN model, and an ensemble model to classify cystic lesion types, and in cross validation, the ensemble model outperformed the radiomics model and the deep learning models.
Deep learning showed great potential compared to traditional radiomics, but still faces many challenges [11]. First, the deep network architecture contains millions of parameters, which requires effective training based on large number of datasets to avoid overfitting. Second, the algorithm design and parameter optimization are very complex, involving many hyperparameters that need to be adjusted (such as the number and size of convolution kernels, learning rate, and activation function). Finally, the interpretability of deep learning needs to be improved compared with traditional machine learning models.
A common denominator in medical imaging research is data scarcity, which is also a characteristic of the medical field, with very few examples of publicly available annotated data. For pancreatic cancer, the rapid progression and worsening of the disease further limit the available data. The problem of data size limitation in deep learning can be alleviated by employing techniques such as data augmentation and transfer learning. Data augmentation typically uses operations such as flipping, rotating, translation, and scaling to synthesize modified data from the original data to increase the size of the training dataset. The idea of transfer learning is to take training weights learned from similar tasks, such as ImageNet, which can be fine-tuning to specific medical images [12]. The level of fine-tuning in transfer learning can be determined by the similarity between the pre-training task and the target task and the data characteristics to be used. Nguon et al. [13] implemented a CNN model using ResNet50 to differentiate MCN and SCN. When training selected layers, the pre-trained model of transfer learning was used for fine-tuning training. The proposed network model achieved up to 82.75% accuracy and 0.88 (95% CI: 0.817–0.930) area under curve (AUC) score. Zhang et al. [14] developed and validated a CNN-based transfer learning model for predicting overall survival in pancreatic ductal adenocarcinoma (PDAC) patients using two independent cohorts of resectable PDAC. The model based on transfer learning can significantly improve the prognostic performance of typical small sample medical imaging studies.
Recent research has shown that deep learning techniques can be applied to the diagnosis of pancreatic diseases. To our knowledge, there are no studies that directly use CNN models for end-to-end classification of SCN and MCN in CT images.In this study, we aim to implement a CNN model for CT image classification used to distinguish between SCN and MCN, and a comprehensive evaluation of the performance of the CNN model for this classification is carried out.The main contributions of this work are summarized as below: We propose a new end-to-end CT slice prediction model that enables accurate classification of SCN and MCN through a joint voting strategy. A transfer learning strategy is used, which enables the network to be well performed even in small sample training. A new attention mechanism is proposed which enhances the network’s focus on local features and effectively improves network performance.
The remainder of this article is organized as follows. In Section 2, We introduce the proposed method in detail. The dataset, experimental setup, evaluation metrics and results are provided in Section 3. Finally, we discuss and conclude this article in Section 4.
Methods
According to the data processing process, the overall framework of the network model experiment proposed in this paper is shown in Fig. 1. First, the dataset is divided into the training set and test set in proportion and preprocessed, and the patient image slices of the training set are input into the network for training to obtain a three-categories pre-trained model that can distinguish SCN, MCN, and no tumor. Then, make predictions on all slice images of the test set patient. Finally, the final prediction for each patient is made through a joint voting strategy.
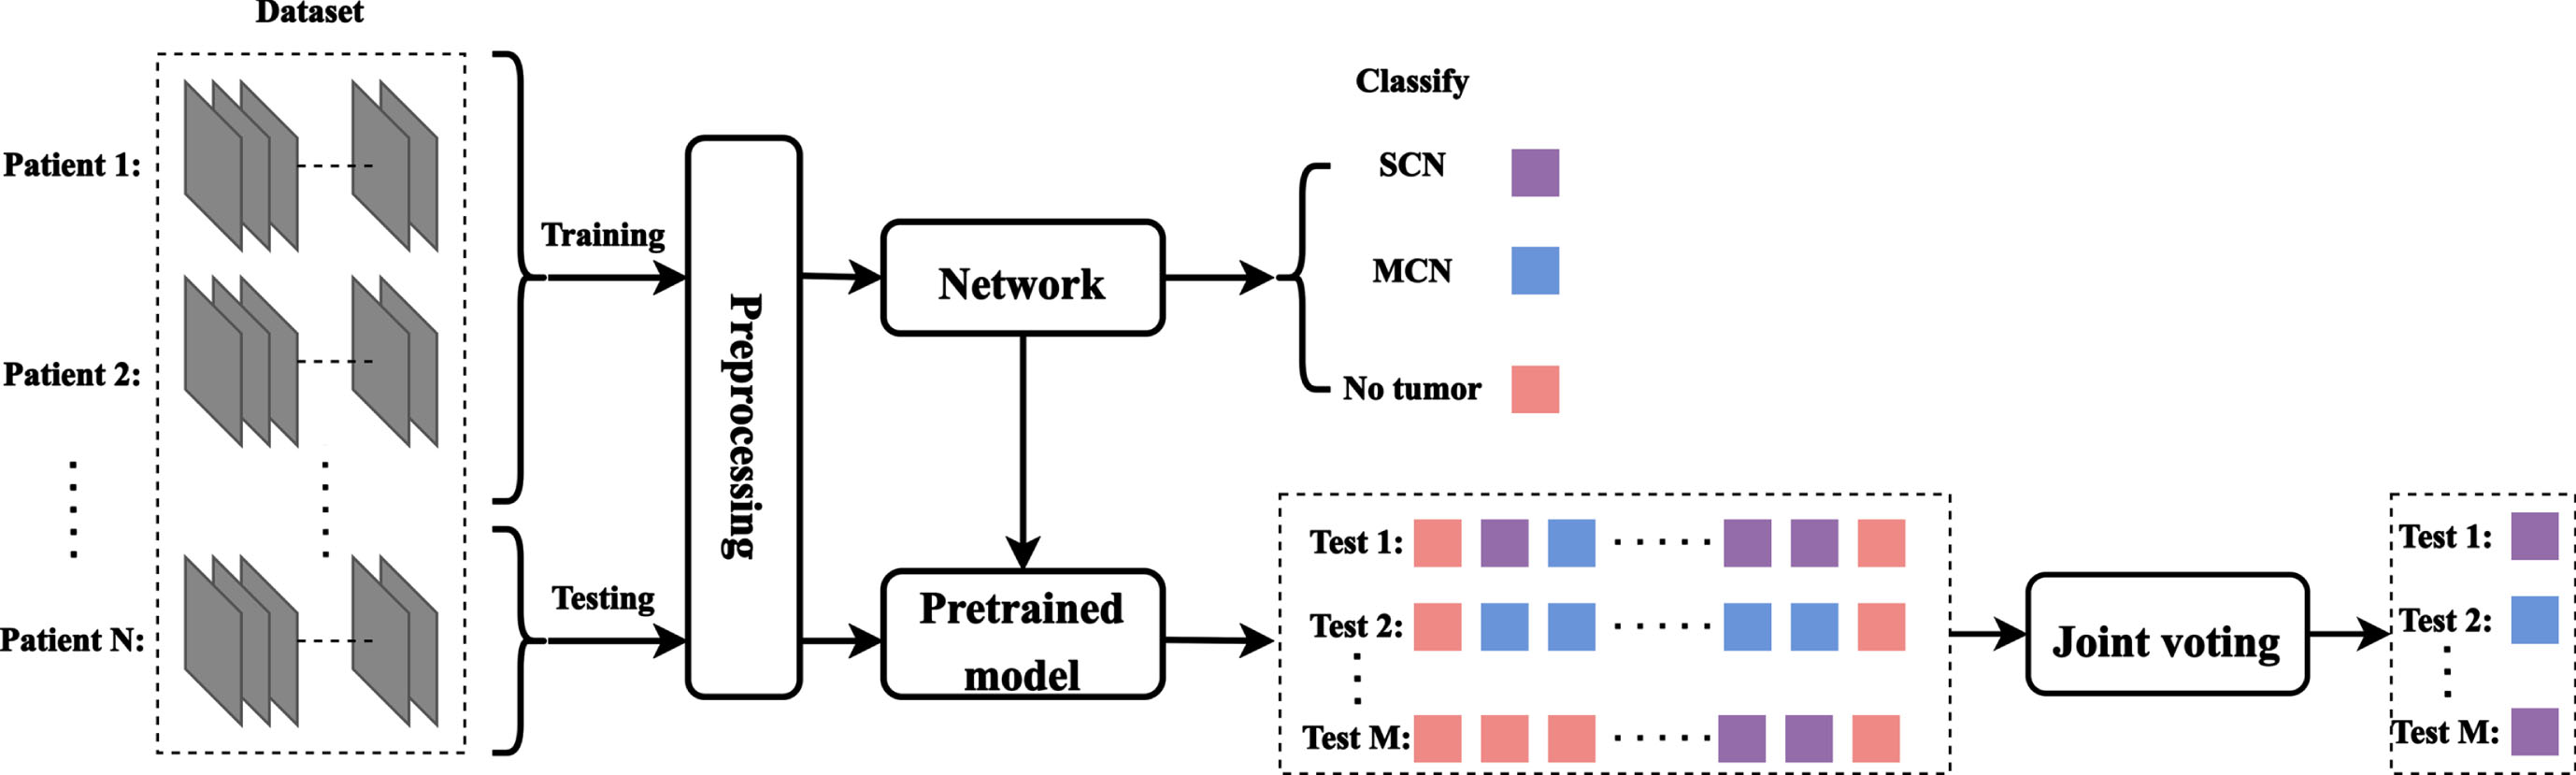
Overall framework of the experiment.
DenseNet201 [15] is used as the backbone network for classification, a transfer learning strategy is adopted, and imagenet pre-trained weights are used for training fine-tuning. For the purpose of predicting the entire patient image, in addition to inputting tumor slices into the network, we also input slices that do not contain tumors into the network to implement a three categories network architecture. Finally, the binary classification of patients with MCN and SCN was realized through the joint voting strategy.
The DenseNet201 classification network framework is shown in Fig. 2. First, the images are input into DenseNet201 initialized with ImageNet pre-trained weights. There is a global average pooling layer in the top layers. Next, we use a dropout layer [16] with a rate of 0.25, which helps to regularize the model to prevent the model from overfitting. Finally, a fully connected layer is connected and classified by the Softmax function. The dense connectivity structure which iteratively connects the input features to the output features allows each convolutional layer to capture the original information from all previous layers, which allows for the reuse of feature maps and thus more features to be extracted from fewer CT slices.
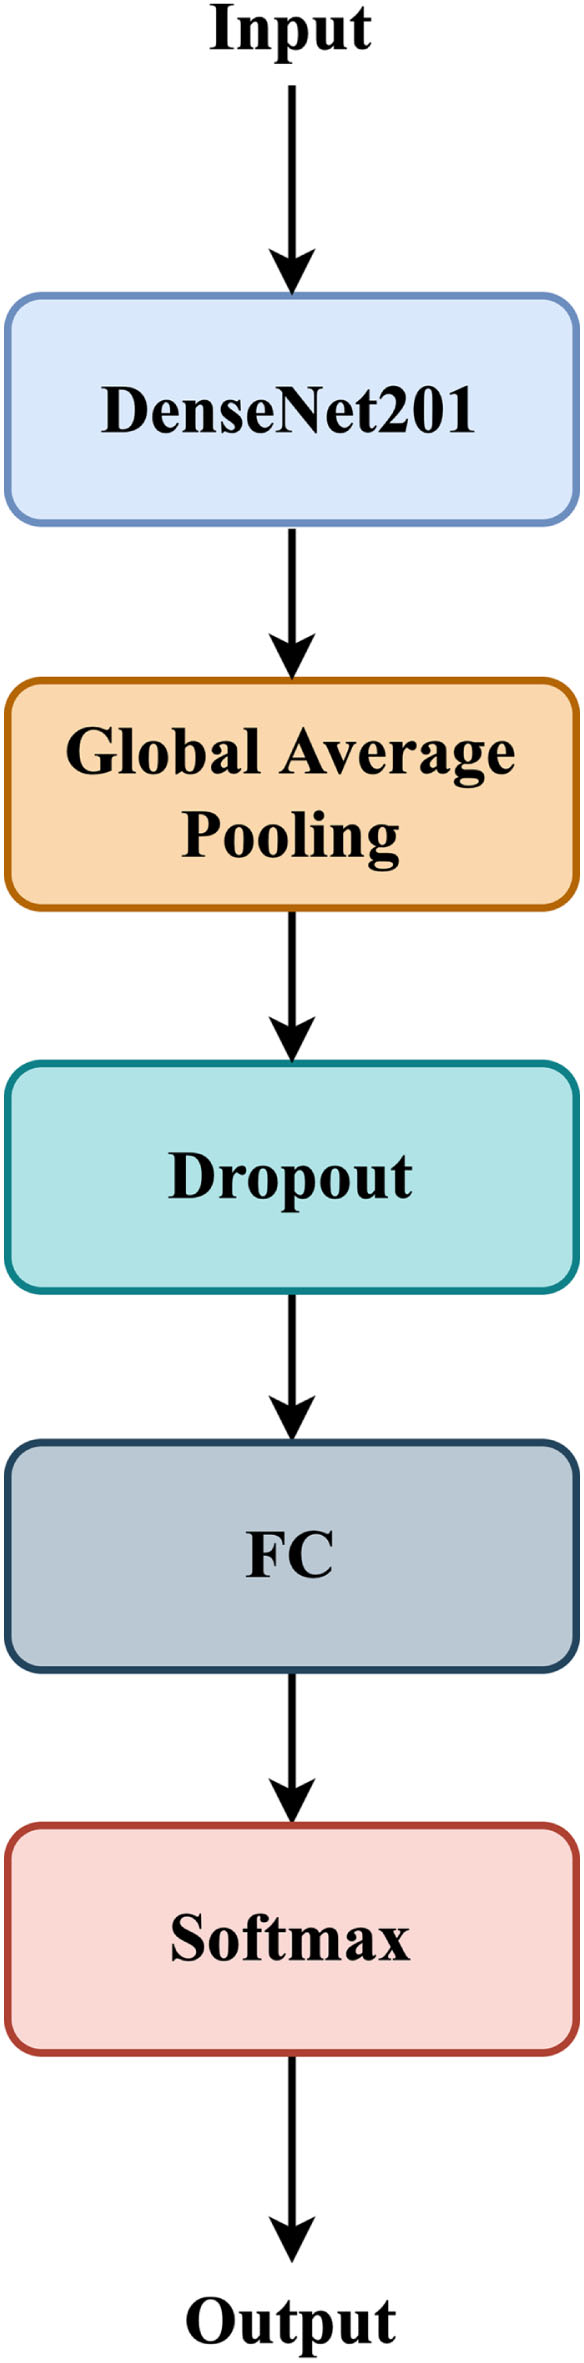
End to end architecture Of DenseNet201. FC stands for fully connected layer.
Based on this, we incorporate an attention mechanism into the network architecture to improve the network performance and propose a DenseNet201 network architecture with an attention block (DenseNet201-Attention). As shown in Fig. 3, we input the features output by DenseNet201 into the attention mechanism module. Since the parameters of the attention mechanism module in the early stage of the network are not well trained, it is not easy to pay attention to the area of interest. In order to alleviate this problem, the output features of the attention mechanism are concatenated with the output features to prevent the loss of the initial features and make the network easier to train.
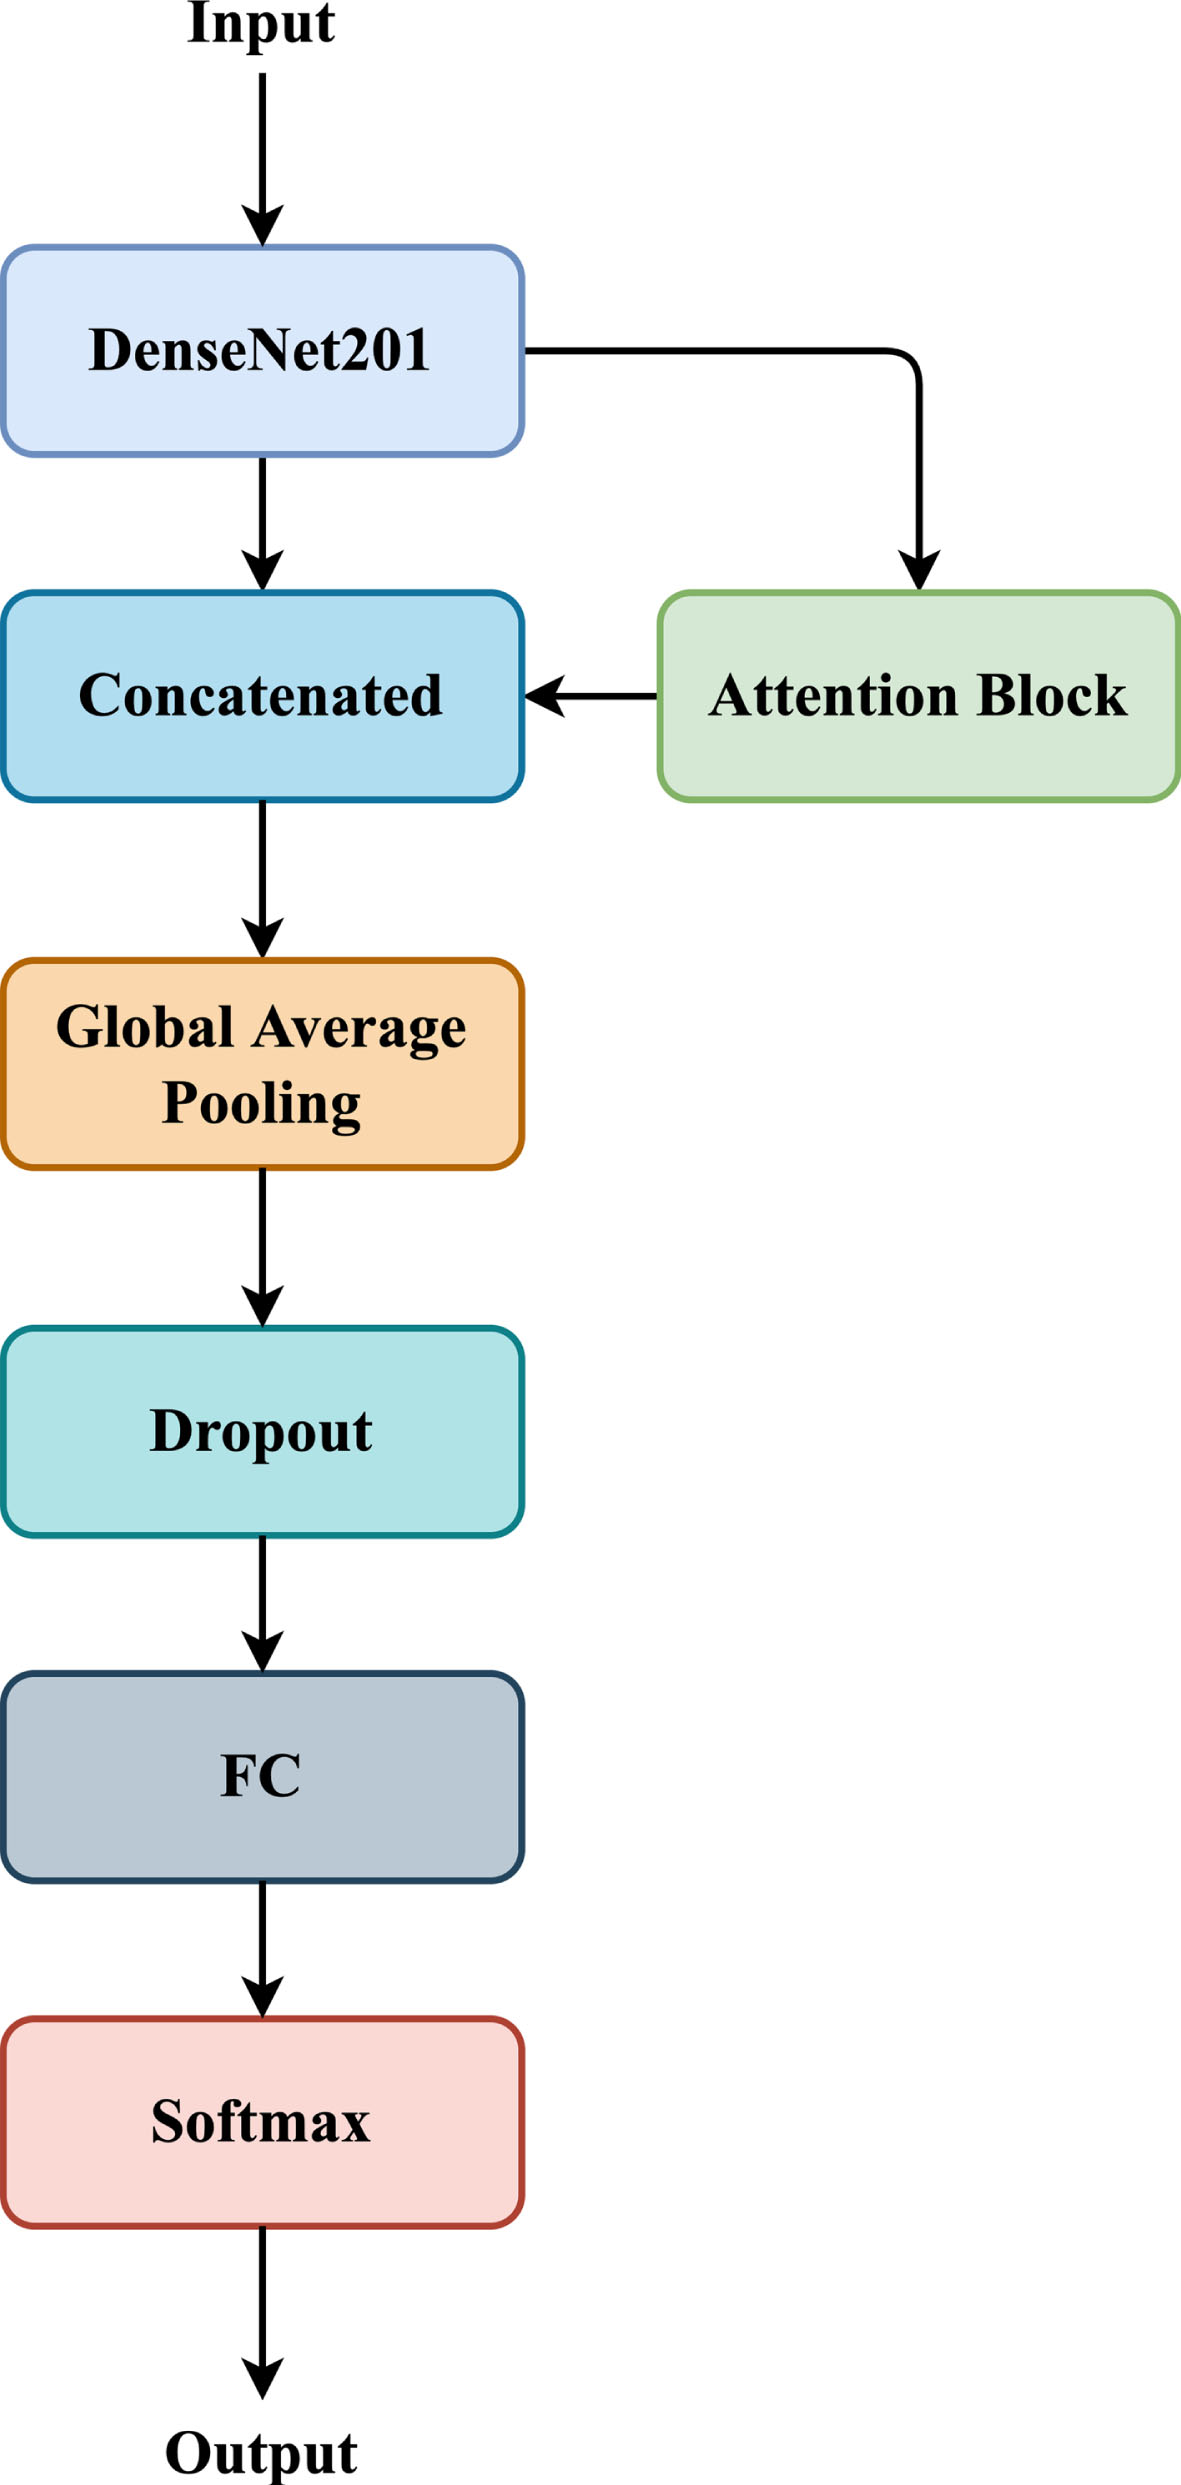
End to end architecture Of DenseNet201 with attention block.
To make it easier for the network to pay attention to local features, we added an attention mechanism to the network architecture. Inspired by the soft attention mechanism proposed by Shaikh et al. [17] based on the work of Tomita et al. [18] and CBAM [19], we designed a novel multi-head spatial attention mechanism (MSAM) for pancreatic cystic tumor classification.
As shown in Fig. 4, give an intermediate feature map
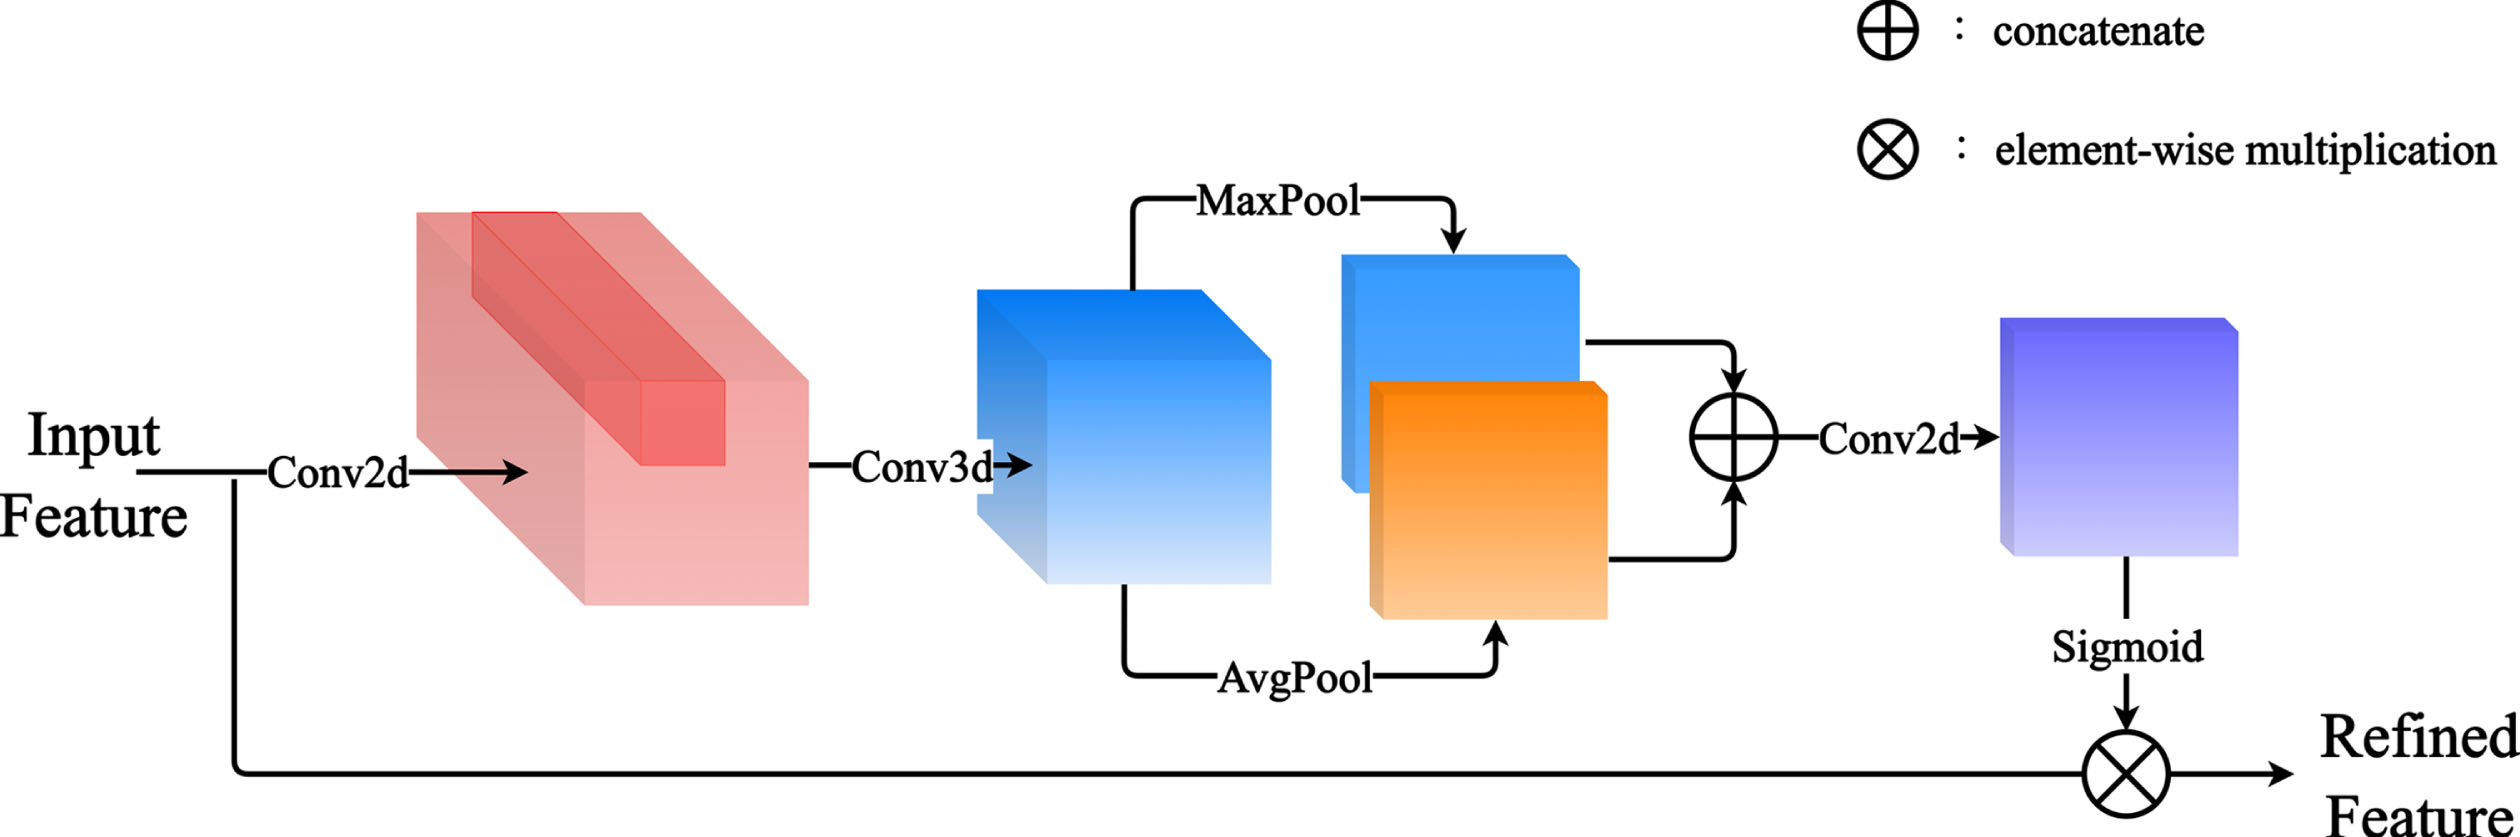
Attention block.
To realize the recognition of spatial features, we first aggregate the spatial information of feature maps by using average pooling and max pooling operations, generating two 2D maps:
MSAM implementation details. R denotes reduction ratio, M denotes the number of Multi-head
To evaluate the accuracy of experimental prediction, this paper takes a patient as a whole and inputs all slices of the patient’s CT images into the network for prediction, and jointly votes on all prediction results. The three categories network can divide the slices into three categories: SCN, MCN, and no tumor. We count the number of SCN and MCN in the prediction result and ignore the slice without tumor. When the number of MCN was greater than SCN, the patient was predicted as MCN, and otherwise was predicted as SCN. In clinical practice, radiologists are often more concerned with tumor detection sensitivity than specificity [20]. Thus, when the number of MCN is equal to SCN, we predict it as MCN.
Grad-CAM
To improve the interpretability of the model, we used Grad-CAM [21] (gradient-weighted class activation mapping) to visualize the important regions or features that guide the model’s decision-making. Warmer colors represent higher weight values, which indicate that the network is paying more attention to the region. The principle of Grad-CAM is as follows: first calculate
Grad-CAM is obtained by calculating the weighted sum for each channel of the feature layer A and using the ReLU activation function, calculated as follows:
Dataset and preprocess
The data of this study are obtained from patients with pancreatic cystic tumor admitted to Shanghai Changhai Hospital from January 2017 to June 2022. Inclusion criteria: 1) MCN or SCN confirmed by pathology; 2) Standard enhanced multi-slice spiral CT scan within one month before surgery. Exclusion criteria: 1) Treated before surgery; 2) MCN or SCN not confirmed by pathology; 3) Other pancreatic tumors; 4) Images with severe motion artifacts. A total of 6173 cross-sectional CT images (containing 812 MCN, 534 SCN and 4827 no tumor slices respectively) of 107 patients are eventually included in the study, including 56 patients with SCN and 51 patients with MCN. The CT data are images of the pancreas parenchyma (30–35s after contrast agent injection) with a slice thickness of 3 mm, a slice interval of 3 mm, and a resolution of 512×512.
The CT slice images of two patients are shown in Fig. 5. Before the data are fed into the network, we need to do some preprocessing on them. 2D slice images were extracted from CT images of 107 patients, which can be divided into three categories: MCN, SCN, and no tumor images. To enhance the contrast of the image, we first truncated the HU value of the original CT image to [–50,250] and adjusted the grayscale to 0 255 and saved it as PNG format. The slice image is positioned and cropped according to the delineated tumor label image to reduce the interference of other areas. All sliced images are uniformly cropped to a size of 224×224. In addition, we applied bilateral filters to all slices. Bilateral filtering is a very commonly used filter, which can achieve the effect of maintaining edges and reducing noise and smoothness. Finally, the image is normalized by dividing each pixel by 255 to keep the pixel values in the range 0 to 1before being fed into thenetwork.
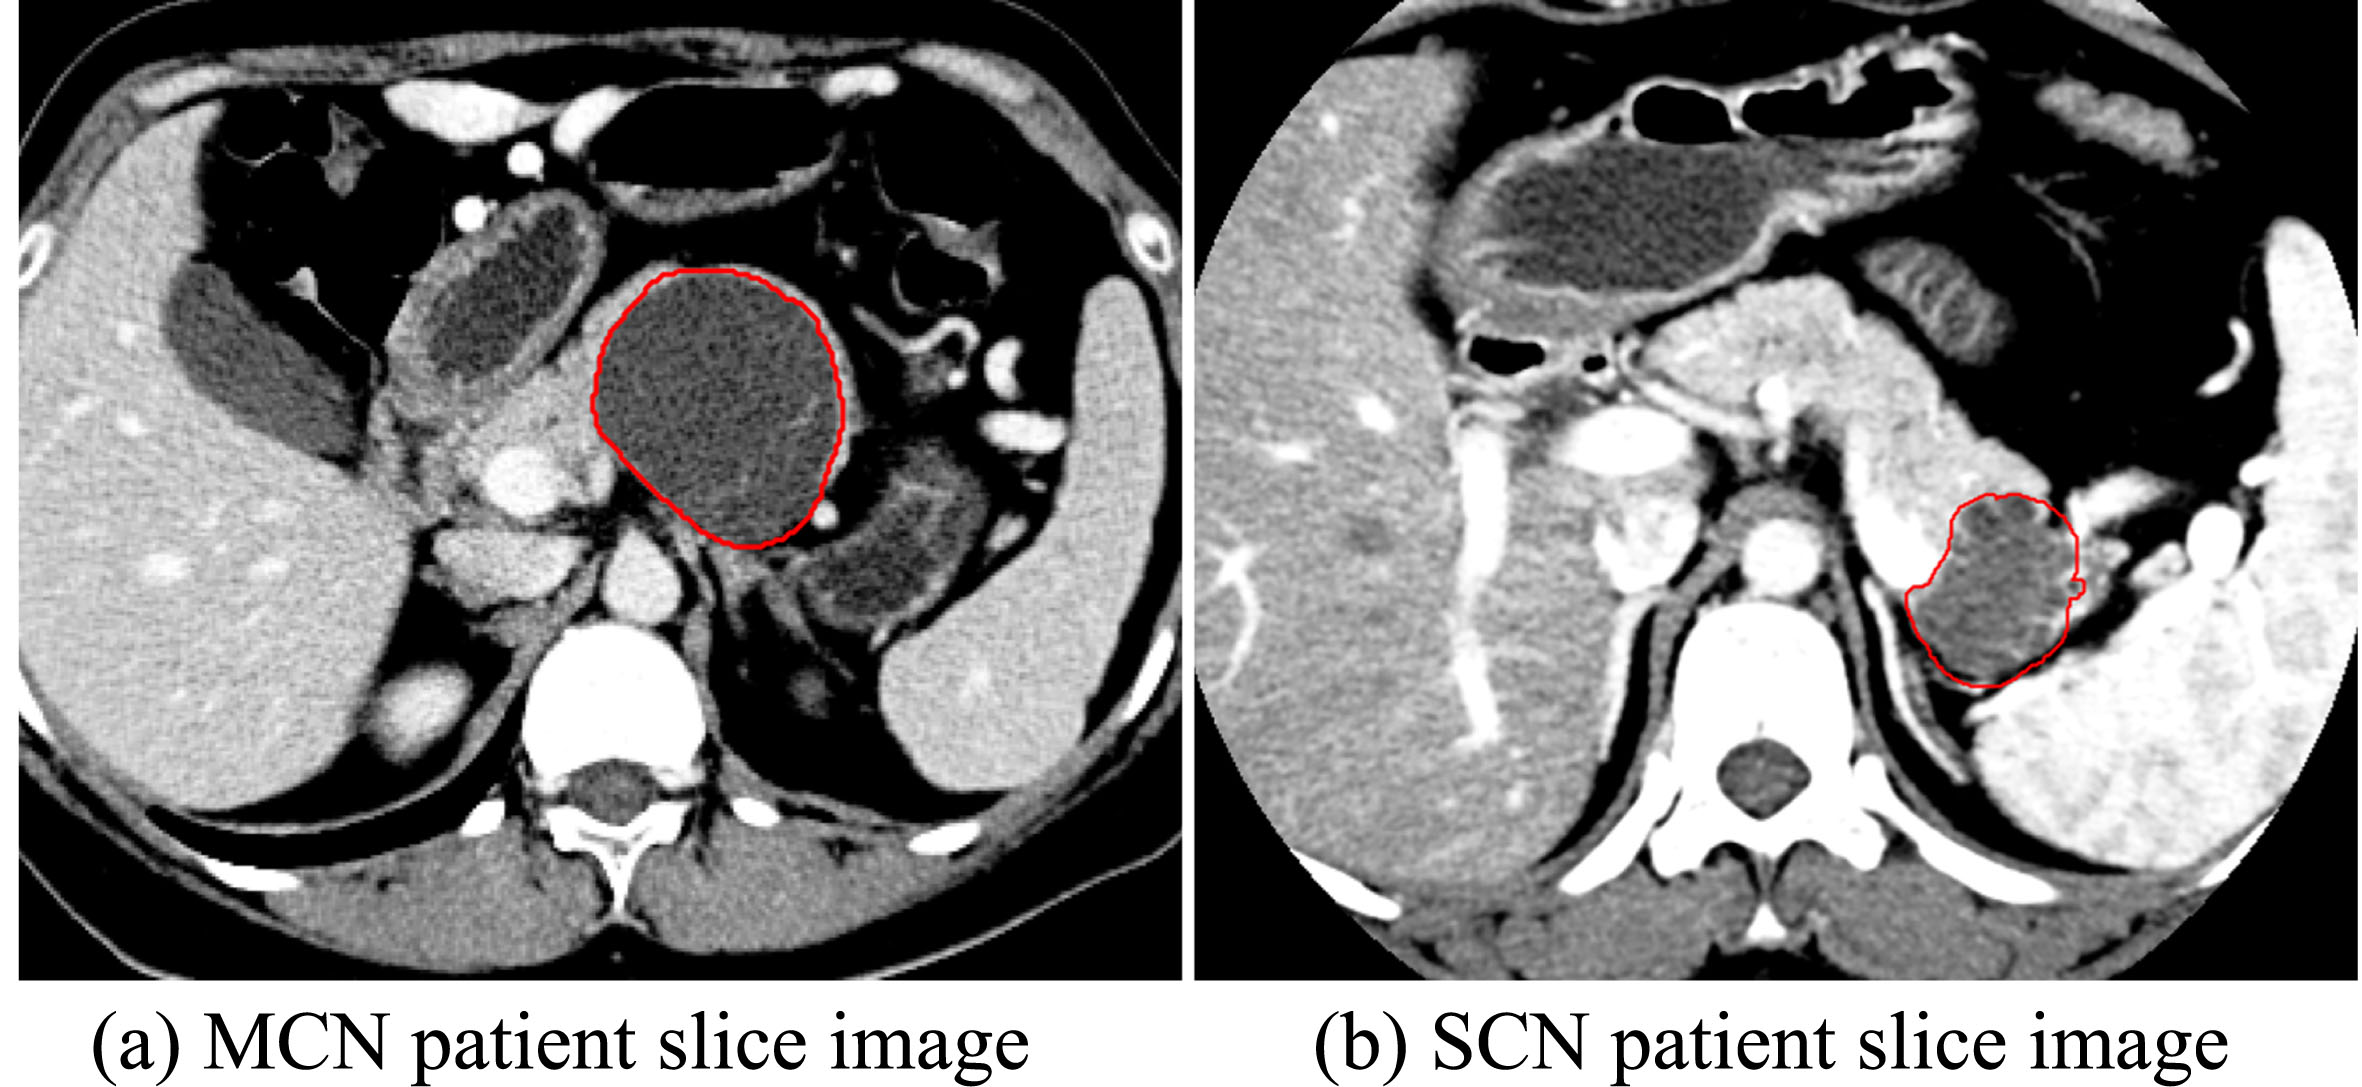
Example images of slices from different pancreatic cystic tumor patients.
To address the data imbalance problem, we have made the following efforts: 1) We did not input all no tumor slices into the network and under-sampled them, leaving about 1/3 of no tumor slices. 2) As the number of no tumor slices was high relative to the number of tumor slices, we assigned a 2 : 2:1 weight to MCN, SCN and no tumor slices in the loss function.
To verify the stability of the model, a 10-fold cross validation strategy was used for experiments. The training and test sets are randomly divided by a ratio of 9 : 1. During training, 20% of the training set is used as the validation set. The final evaluation of the model was performed by integrating the results of ten experiments.
To evaluate the performance of the proposed MSAM-DenseNet201, five evaluation metrics are introduced: Accuracy (ACC), Sensitivity (SEN), Specificity (SPE), Precision (PRE), and F1-score (F1), which are given as follows:
The number of experimental epochs is set to 50, the batch size is set to 16, the optimizer uses Adam, the initial learning rate is set to 0.0002, and the decay is 0.9 every 5 epochs. For MSAM, the channel reduction ratio is set to 4, and the number of Multi-head is set to 32; for Soft Attention, the number of Multi-head is set to 32; the reduction ratio of CBAM is set to 4. The model with the lowest loss value in the training epoch is selected as the final model to generate classification results. All experiments are done on the Tensorflow framework.
The Cross Entropy (CE) is used as the network loss function. The formula is as follows:
Effectiveness of attention mechanism
To compare the performance difference between MSAM and Soft Attention [17], CBAM [19], we adopt DenseNet201 as our baseline, combined with the above attention module for 10-fold cross validation experimental evaluation. The experimental parameters are the same as in Section 3.3.
The experimental results are documented in Table 2. When the network used the attention mechanism, the network classification performance has been improved to varying degrees. When used MSAM, the network accuracy and F1-score are improved by 3.73% and 3.70%, respectively, which are better than Soft Attention and CBAM. Experiments show that the attention mechanism can promote the classification accuracy of pancreatic cystic tumors to a certain extent. The confusion matrix for the different models is shown in Fig. 7.
Comparison of classification performance using different attention mechanisms on DenseNet201
Comparison of classification performance using different attention mechanisms on DenseNet201

Visualization comparison of Grad-CAM results with different attention.
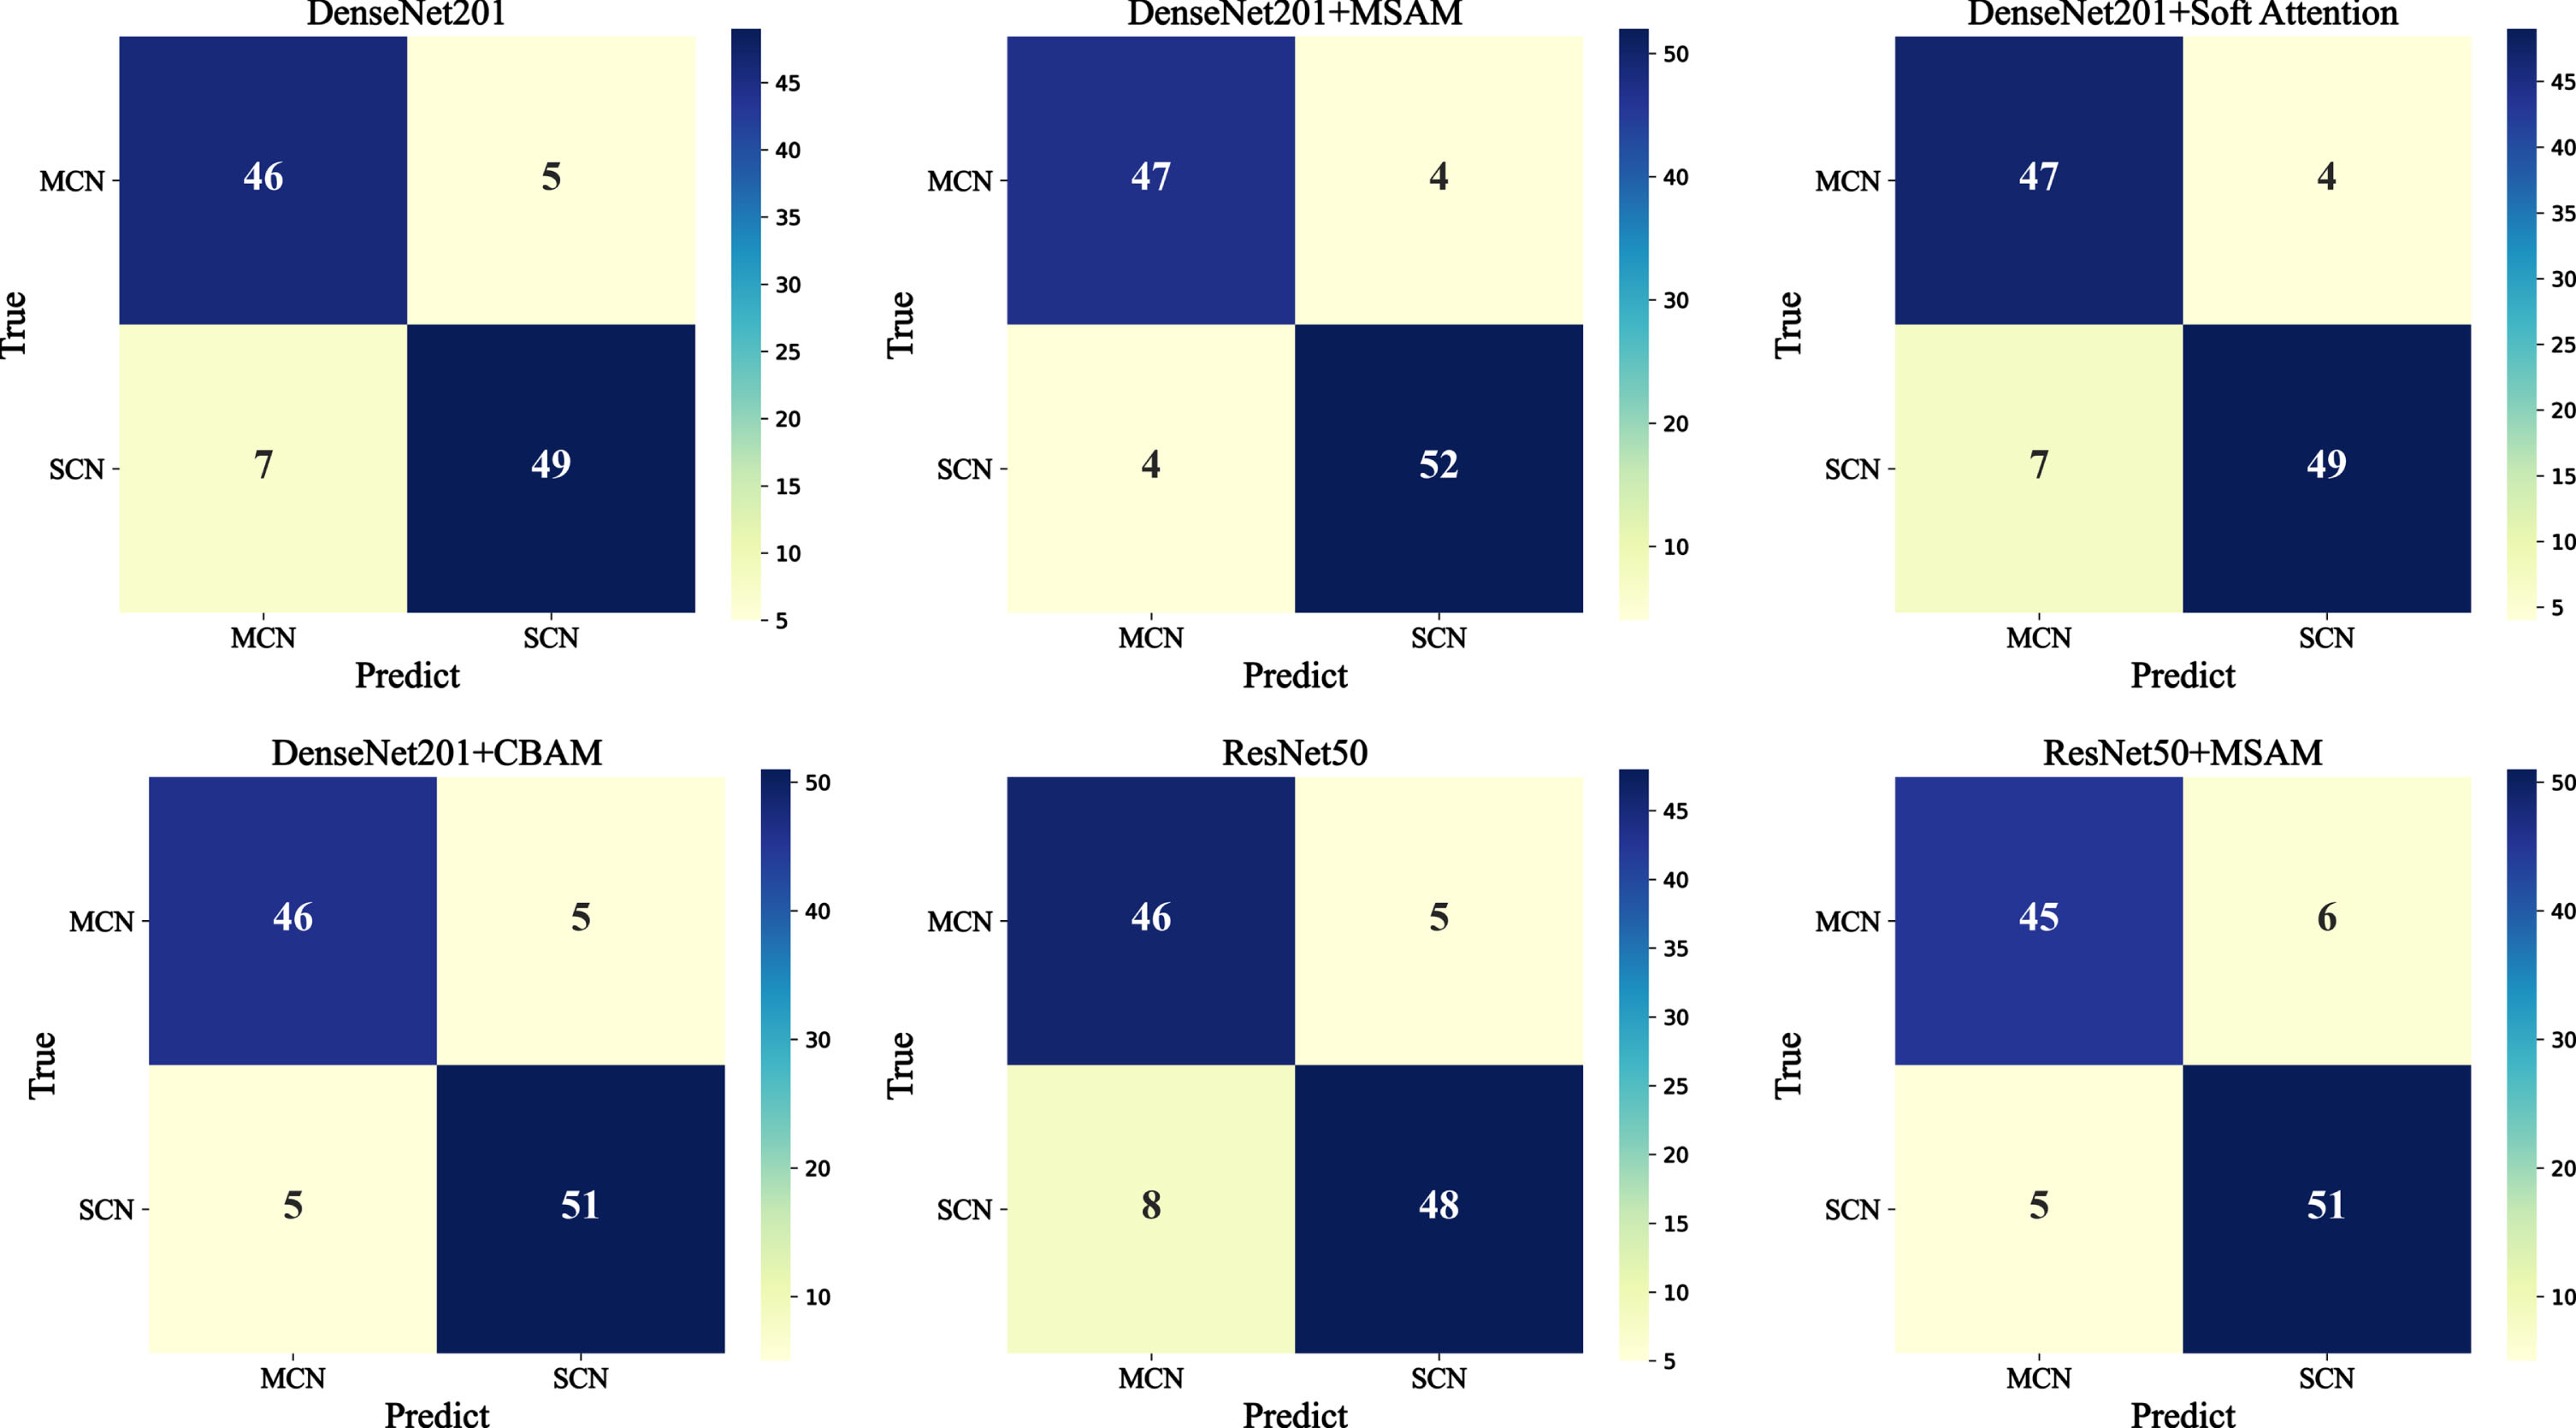
Confusion matrix of different networks.
We randomly selected 4 MCN and SCN slice images for Grad-CAM visualization. The results are shown in Fig. 6. Compared with Soft Attention and CBAM, MSAM can make the network focus on the tumor region more accurately.
We compare MSAM-DenseNet201 with the classic CNN architecture of ResNet50 [22], using different network architectures combined with MSAM for 10-fold cross validation experimental evaluation. The experimental parameters are the same as in Section 3.3.
The experimental results are documented in Table 3. For the feature extraction structure, regardless of whether the attention mechanism is used or not, the accuracy of DenseNet201 is higher than that of ResNet50, indicating that the network with dense connection structure is superior to the network with residual connection structure. It shows when the attention mechanism is added, the classification performance of DenseNet201 and ResNet50 are improved, and the best performance is achieved on DenseNet201. The confusion matrix for the different models is shown in Fig. 7.
Comparison with existing methods
The classification results of proposed method and some state-of-the-art methods are listed in Table 4. Chen et al. [7] constructed a logistic model combining radiological features and CT texture features, sensitivity: 0.90, specificity: 0.846. Yang et al. [9] proposed a deep neural network (DNN) model called Multi-Channel-Multi-classifier-Random Forest-ResNet (MMRF-ResNet), which achieved a sensitivity of 0.9163, a specificity of 0.9380, and an accuracy of 0.9269 on 110 subjects. Nguon et al. [13] implemented a CNN model using ResNet50 to distinguish MCN and SCN, which achieved a sensitivity of 0.8146, a specificity of 0.8436, and an accuracy of 0. 8436 on 108 subjects. Xie et al. [23] classified 226 cystic tumor patients by building a radiomics model, in 10-fold cross validation, which obtained the sensitivity is 0. 847, specificity is 0.745, and accuracy is 0.793. Gao et al. [24] developed a multi-phase (MP) CT-based radiomics nomogram to distinguish SCN from MCN with a sensitivity of 0.71, specificity of 0.90, and accuracy of 0.78.
Comparison of classification performance using MSAM on different networks
Comparison of classification performance using MSAM on different networks
Comparison of existing computer-aided SCN and MCN diagnostic methods
Preoperative differentiation between SCN and MCN remains a clinical challenge. In this study, we propose MSAM-DenseNet201 based on CNN architecture for computer-aided SCN and MCN diagnosis of abdominal CT scans. The attention module enhances the network’s attention to local features and effectively improves the network performance without the need to manually delineated the entire infection regions. We train the network on CT slices to obtain a slice prediction model, then use the pre-trained model to predict each slice patient CT scan dataset, and use a joint voting strategy to get the final patient prediction result. Experimental results show that our proposed network achieves satisfactory results with an accuracy of 92.52%, a precision of 92.16%, a sensitivity of 92.16%, and a specificity of 92.86%, outperforming most existing computer-aided diagnosis methods. Exploring more potential features combined with radiomics features will be an important approach to improve the performance of radiomics models.
Radiomics as a medical image analysis method shows great potential in tumor classification. Xie et al. [23] first investigated the value of radiomics in distinguishing SCN from MCN by constructing a radiomics score (Rad-score). Chen et al. [7] combined radiomic features and CT texture features to obtain a logistic model, which outperformed using radiomic features alone. Gao et al. [24] shown that the radiomics of the arterial and venous monophasic model was superior to the normal scan model. The combined nomogram combining MP-Radscore, tumor location and cystic number showed the best discriminative performance.
Compared with traditional radiomics methods, deep learning methods showed more efficient and stable performance. Yang et al. [9] used the deep learning method for feature extraction. In order to alleviate the error of manually delineating the ROI, the multi-channel image obtained through human-computer interaction and computer post-processing provided a more accurate image of the lesion area, which greatly improved the classification performance of the model. Compared with this study, our study only uses manually delineated ROI images for cropping and positioning of the original images, and the accuracy of delineating boundaries has less impact on model training and prediction. For the problem of data volume limitation, Nguon et al. [13] used transfer learning technology to alleviate the problem. This study also adopted this technology. Due to the large difference between ImageNet weights and CT image features, we did not freeze the weights of the entire network for training. We can see that our method achieved better classification performance compared to existing methods, which indicated that our method has great potential for development and application in computer-aided diagnosis systems.
This study still has several limitations. First, this study only analyzed CT images, and multimodal imaging methods can be further explored in the future to improve diagnostic accuracy. Second, the interpretability of deep learning methods is insufficient, and further studies are needed to confirm the hypothesis that deep learning methods reflect tumor heterogeneity. Third, this is a retrospective single-center study with a small sample size, and a multi-center study with a larger sample size for internal and external validation is critical for future clinical applications.
In conclusion, consistent with previous studies, the CT based deep learning classification framework can be used as a new medical image analysis method to distinguish SCN and MCN preoperatively, showing good diagnostic performance, and is expected to optimize treatment plans and avoid unnecessary surgery. Further studies are needed to confirm the validity of our conclusions.