
Abstract
Limited-angle CT scan is an effective way for nondestructive inspection of planar objects, and various methods have been proposed accordingly. When the scanned object contains high-absorption material, such as metal, existing methods may fail due to the beam hardening of X-rays. In order to overcome this problem, we adopt a dual spectral limited-angle CT scan and propose a corresponding image reconstruction algorithm, which takes the polychromatic property of the X-ray into consideration, makes basis material images free of beam hardening artifacts and metal artifacts, and then helps depress the limited-angle artifacts. Experimental results on both simulated PCB data and real data demonstrate the effectiveness of the proposed algorithm.
Introduction
Computed Tomography (CT) is widely used in planar objects’ defect inspection, such as printed circuit boards (PCB), solar panels, slab fossils, etc. Due to the shape restriction of the scanned object, to avoid collision of the scanned object with the X-ray source, we can only acquire projections within a limited-angle range. Even if full-angle projections can be acquired, some may be useless due to the heavy absorption of the X-rays, which also results in limited-angle projections. Image reconstruction from the limited-angle projections is called limited-angle CT (LACT). It is well known that limited-angle projections do not satisfy Tuy’s condition [5]. Images reconstructed with conventional algorithms, such as filtered back projection (FBP) and algebraic iterative reconstruction (ART), usually contain blurring artifacts and streak artifacts along specific directions, which could be more severe if there are metals in the scanned object.
Due to the wide application requirements of LACT, various imaging models and solving algorithms have been proposed. Early methods [29, 32] attempt to incorporate the local or global smoothness prior of projections to recover the complete projections by applying certain “extrapolation” techniques to the limited-angle projections. Recently, many regularization methods have tried to incorporate various priors into the imaging model to eliminate limited-angle artifacts, including geometrical shape, distribution of edges, or densities (gray values) [13, 30] of the image. The commonly used regularization algorithms include total variation (TV) minimization [8, 30], l0 gradient minimization [17, 27], alternating edge-preserving and smoothing (AEDS) method [12], directional total variation (DTV) algorithm [35], etc., all of which assume that the CT image is piecewise constant and thus has sparse gradients. The regularization reduces the solution space, thereby helping to eliminate image blurring and image aliasing artifacts caused by missing projections. In particular, AEDS and DTV algorithms, which incorporate both the piecewise constant prior to the ideal CT image and the correlation between the limited-angle artifacts and the scanning angular range, are state-of-the-art ones. All the above models, however, have assumed a linear relationship between the reconstructed image and the projections, which generally does not hold for a real CT system. Actually, the X-ray emitted from the source is polychromatic, and the X-ray absorption by the scanned object is energy-dependent. Therefore, images reconstructed with such algorithms using the above linear relationship usually suffer from beam hardening artifacts. The beam hardening artifacts make the reconstructed image not satisfy the piecewise constant assumption, so only suboptimal results can be obtained when the above algorithms are applied to real data. Moreover, if the scanned object contains metal such as copper and iron, the heavy beam hardening artifacts and metal artifacts can blur image edges, in which case the algorithms like AEDS that use edge information would fail to correctly recover blurred edges. In addition, beam hardening artifacts and metal artifacts may also introduce fake edges into the image and affect the final reconstructed results.
It is well known that dual spectral CT (DSCT) imaging can effectively eliminate beam hardening and metal artifacts. By acquiring projections of the scanned object at two different X-ray spectra, DSCT could reconstruct basis material images and synthesize a monochromatic image of the scanned object, which are theoretically free of beam hardening artifacts and metal artifacts [1, 12].
There are several ways to acquire DSCT projections. The simplest way is to scan the object twice at different tube voltages and tube currents. This method is easy to implement but will increase the scan time and dose. Other typical data acquisition methods for DSCT include the dual-source dual-detector method [16, 23], fast kVp switching method [31, 34] and double-layer detector method [18, 22]. In recent years, the rapidly developing photon-counting detector technology has provided a new way to acquire polychromatic projections [14, 28].
The key to DSCT imaging is the image reconstruction algorithm. The related study began in the 1970 s, and after over fifty years of exploration and research, scholars have invented a variety of reconstruction methods, which can be roughly classified into three categories: image domain methods [9], projection domain methods [19], and iterative methods [6, 11]. In image domain methods, two basis material images are approximated by linear combinations of the two images reconstructed separately from the two polychromatic DSCT projections. Such basis material images are usually regarded as a first-order approximation of the true images. Generally, beam hardening artifacts from reconstruction methods based on a monochromatic model [1, 11] propagate into basis material images. In projection domain methods, two sets of projections of basis material images are obtained from the two polychromatic projections. Then the basis material images are reconstructed from their projections with conventional image reconstruction methods, such as the FBP or back projection-filtering (BPF). Generally, projection domain methods can obtain better images than image domain methods. But projection domain methods require the DSCT data sets to be geometrically consistent. In other words, two separate flux measurements of the low and high X-ray spectra need to be acquired along each X-ray path [25]. However, this requirement is hard to meet for practical DSCT systems, such as dual-source CT systems. Therefore, several nonlinear optimization-based iterative methods for the DSCT were proposed in [11, 33]. These methods fit both geometrically consistent and inconsistent projections. The main problem of iterative algorithms is a large amount of computation, but with the rapid development of computing hardware such as GPUs, iterative algorithms are receiving more and more attention, and some CT manufacturers have already applied them to their CT systems.
Recently, scholars have also begun to study dual spectral limited-angle CT (DSLACT) imaging problems. In 2016, Xing et al. [15] proposed a segmental multi-spectral CT algorithm, which divided the angular range of a circular scan trajectory into several arcs to achieve satisfactory limited-angle reconstructed results after adding a prior image. Then, an optimization-based algorithm relying on partial-scanned projections is proposed by Pan et al. [2, 4], which provides new inspiration for DSCT on conventional CT scanners. Later, Zhang et al. [26] tried to eliminate DSLACT artifacts with the guidance of image gradient. Sheng et al. [25] proposed a basis material decomposition method combined with sequence regularization to solve the DSLACT problem, which is mainly for medical images. In 2021 and 2022, Pan’s research group extended the DTV model [35] to DSLACT [3, 36], which achieves promising reconstructed results, especially for very small scanning angular ranges. But as is pointed out in [3], X-ray spectra are not considered in the model, and beam-hardening artifacts could not be eliminated completely.
This paper proposes an image reconstruction model and corresponding reconstruction algorithm called Dual Spectral Alternating Edge-preserving Diffusion and Smoothing (DS-AEDS) for DSLACT, which combines the extended algebraic iterative reconstruction (E-ART) method and the AEDS method. This algorithm could effectively eliminate beam hardening artifacts and metal artifacts in the reconstructed basis material images by making full use of the energy spectrum information, and suppress limited-angle artifacts by using the piecewise constant assumption of the basis material images. The effectiveness of the proposed model and algorithm are verified by numerical experiments on noise-free and noisy data. The beam hardening artifacts, metal artifacts and limited-angle artifacts are well suppressed.
DS-AEDS method for DSLACT imaging problem
This section first introduces the LACT imaging problem and AEDS algorithm, and then presents the DSCT imaging model and E-ART algorithm. Finally, the DS-AEDS model and algorithm are proposed for DSLACT imaging.
LACT imaging problem and AEDS algorithm
For simplicity, we consider the two-dimensional fan-beam LACT system. As illustrated in Fig. 1, Ox1x2 as the global coordinate system, the scanned object is located in origin. The fan beam scanning system consists of the X-ray source and the detector rotating around the origin. The symbols D and R represent the distance from the X-ray source to the detector and to the rotation center, respectively, d represents the detector coordinate, and β is the rotation angle of the X-ray source. Let f (
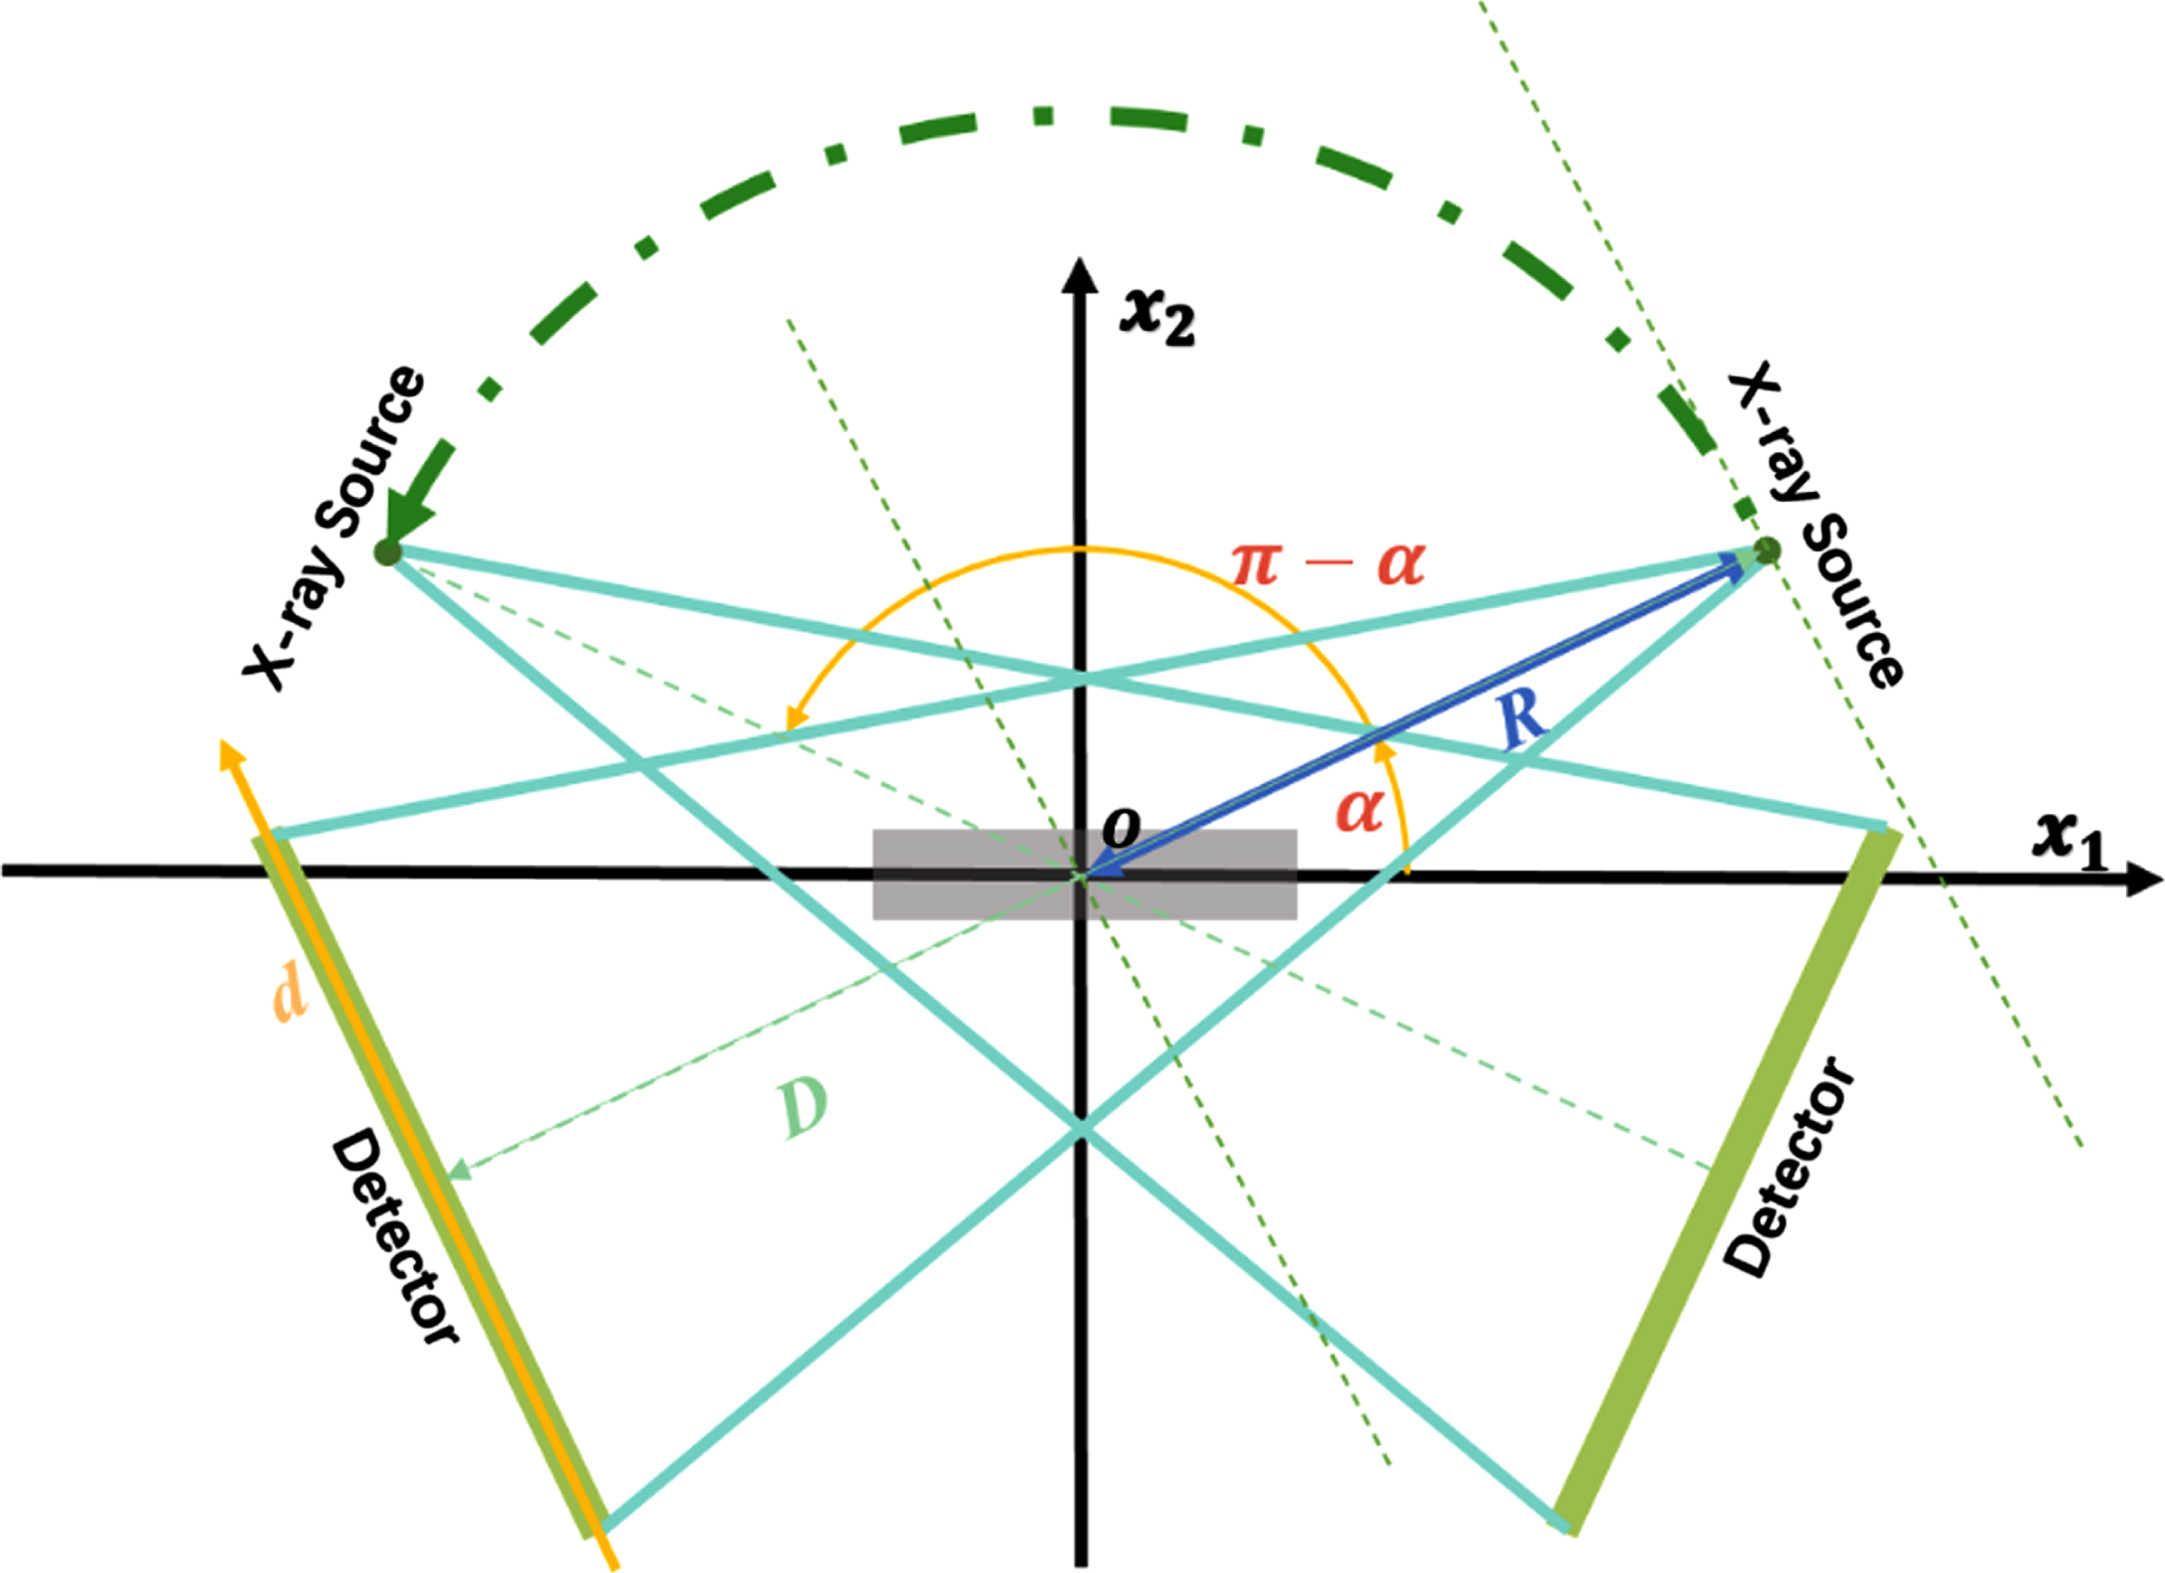
Illustration of the limited-angle fan-beam scanning configuration.
Problem (1) can be discretized as follows
Due to the strong ill-posedness of LACT imaging problem, severe blurring and streak artifacts along the ending lines of the limited-angular range and tangent to the boundary of some features in the object will be introduced when applying conventional reconstruction algorithms on limited-angle projections Fig. 2 illustrates this phenomenon, where (a) is a simulated planar object and (b) is the image reconstructed with the SART method from limited-angle projections (α = 30°). Obvious blurring could be seen in the reconstructed image, and streak artifacts appear along the directions of 30°and 150°.

(a) The simulated planar object; (b) Reconstructed image with scanning angular range [30°, 150°].
AEDS is one of the effective algorithms for solving LACT imaging problems. Using edge information of the reconstructed image, AEDS recovers the inner information of the scanned object by edge-preserving diffusion and smoothing operation. The optimization model for AEDS reads,
Omitting scattered photons, the polychromatic projections could be discretized as:
To solve Equation (5), Zhao et al. proposed the E-ART algorithm, which is an extension of the classic ART algorithm in 2015. It updates the basis material images by projecting the current estimations onto the approximate hyper plane of the nonlinear equation one by one. Let (
DS-AEDS model
In this section, we extend the AEDS algorithm to solve the DSLACT imaging problem and obtain our DS-AEDS algorithm. The proposed algorithm tries to remove metal and beam hardening artifacts, and simultaneously suppress the limited-angle artifacts. The DS-AEDS optimization model is as follows,
where
Due to the nonlinearity of DSCT, model (8) is non-convex, only local optimal solutions can be obtained. Here, we adopt a simple alternating minimization technique to solve (8). Let (
The E-ART algorithm, followed by a thresholding process, is used to solve subproblem 1, which is also an iterative process. In our implementation, we find that one E-ART iteration in each inner iteration is enough to solve our problem. After each E-ART iteration, the negative pixel values are replaced with 0 to satisfy the nonnegative constraint. At last,
It should be noted that the selection of edge-preserving diffusion operators φ
i
(·) (i = 1, 2) and edge-preserving smoothing operators ψ
i
(·) (i = 1, 2) affect the reconstructions greatly. For monochromatic imaging, as pointed out in [12], a suitable choice for horizontal edge-preserving diffusion operators φ
i
(·) (i = 1, 2) is l0 norm of image gradient, thanks to its edge-preserving ability. On the other hand, the choice of vertical direction edge-preserving smoothing operators ψ
i
(·) (i = 1, 2) depends on the noise level. In our experiment, we adopt the same regularization terms as [12] suggests. Define, the workflow of the DS-AEDS algorithm can be concluded as
The algorithm parameters of DS-AEDS include λ1, λ2, λ3, λ4, T, M, N, K and ω. λ1 and λ3 control the strength of x direction edge-preserving diffusion for the two different basis materials. And λ2 and λ4control the strength of y direction edge-preserving smoothing for the two different basis materials. Forλ i (i = 1, 2, 3, 4), the larger the value, the stronger the strength. How to determine the threshold T depends on the density of the different materials and the noise level. For example, if the densities of high and low attenuation materials are in [7, 8] and [0.9, 1.2], we recommend that T could be chosen from [2, 6]. The number N is the total iterations, which is determined by the sample structure and noise level. The more complex the sample and the higher the noise level, the more iterations are required. The number M is the iterations to start using the median filter, which is used every K time. M, N and K jointly determine the number of times the median filter is used. ω is the relaxation factor, determined by the noise level of projections. The greater the noise level, the smaller the ω value.
Experiments
Simulated experiment
In this section, experiments on a simulated PCB phantom will be carried out to validate the effectiveness of the proposed DS-AEDS algorithm. For simplicity, the numerical experiments are restricted to fan beam CT. The generalization to cone-beam CT is straightforward.
Experiment parameters and conditions
PCB inspection is a typical LACT imaging problem, so a simulated PCB phantom, as shown in Fig. 3, is used in our experiments. The phantom is composed of basis material polyvinyl chloride (PVC) and metal material (copper). The size of the phantom is 12.4mm*2.25 mm. Four different types of the copper route are included in the phantom, whose thicknesses are 0.24 mm, 0.015 mm, 0.03 mm and 0.045 mm, respectively. Due to the existence of high-absorption metal material in the phantom, conventional reconstruction algorithms will introduce severe beam hardening artifacts and metal artifacts in the reconstructed CT image. Furthermore, if an edge information-dependent algorithm is employed, the artifacts may affect the visibility of certain edges in the reconstructed image, making it difficult to exactly recover the inner information of the scanned object. Moreover, beam hardening artifacts and metal artifacts might introduce fake edges to the reconstructed image, affecting the interpretation of correct image.
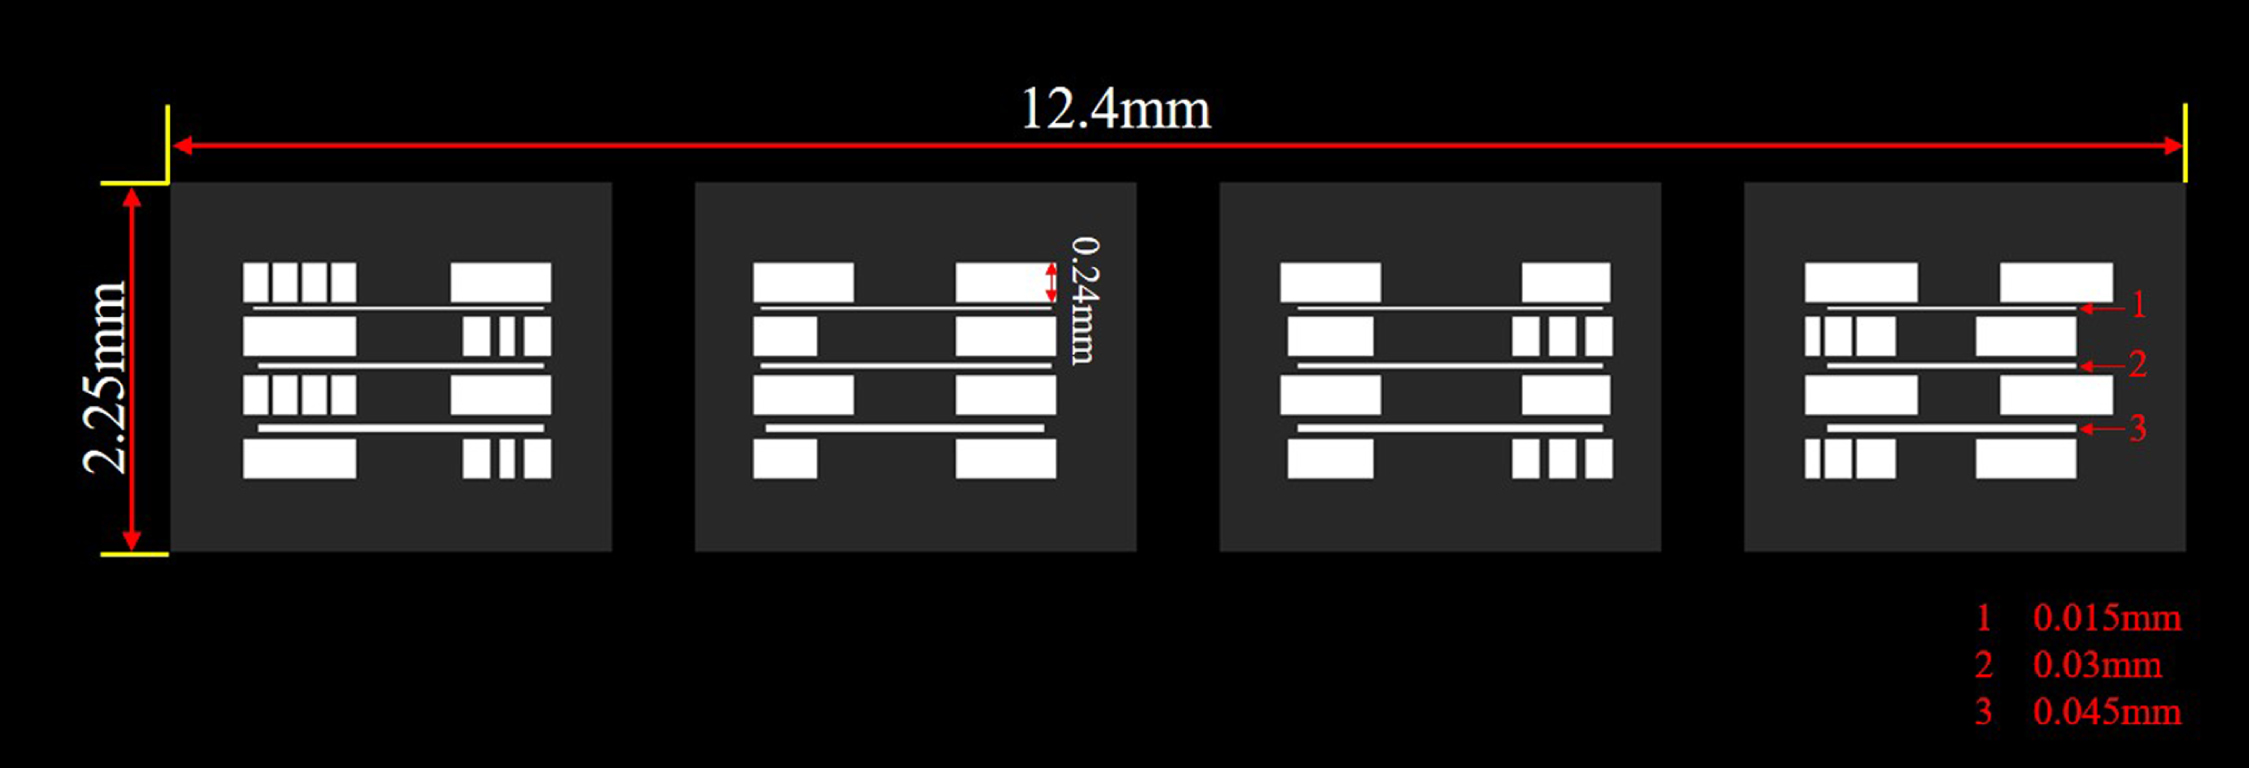
The simulated PCB phantom.
Table 1 shows the parameters of the scanning configuration. The resolution of the reconstructed image is 1024*370, with a pixel size of 0.015 mm.
The scanning configuration parameters for simulated data
The polychromatic X-ray spectra are simulated with the software SpectrumGUI, an open-source X-ray spectra simulator (see http://spectrumgui.sourceforge.net/’). We have simulated the X-ray spectra of GE Maxiray 125 X-ray tube with tube voltages 80 and 140 kV, where the latter is filtered with 1 mm copper. The distributions of the X-ray spectra are shown in Fig. 4. The mass attenuation coefficients used in the experiments are retrieved from the National Institute of Standard Technology (NIST) tables of the X-ray mass attenuation coefficient. The length of the sampling interval is 1 keV in the simulation of polychromatic projections.
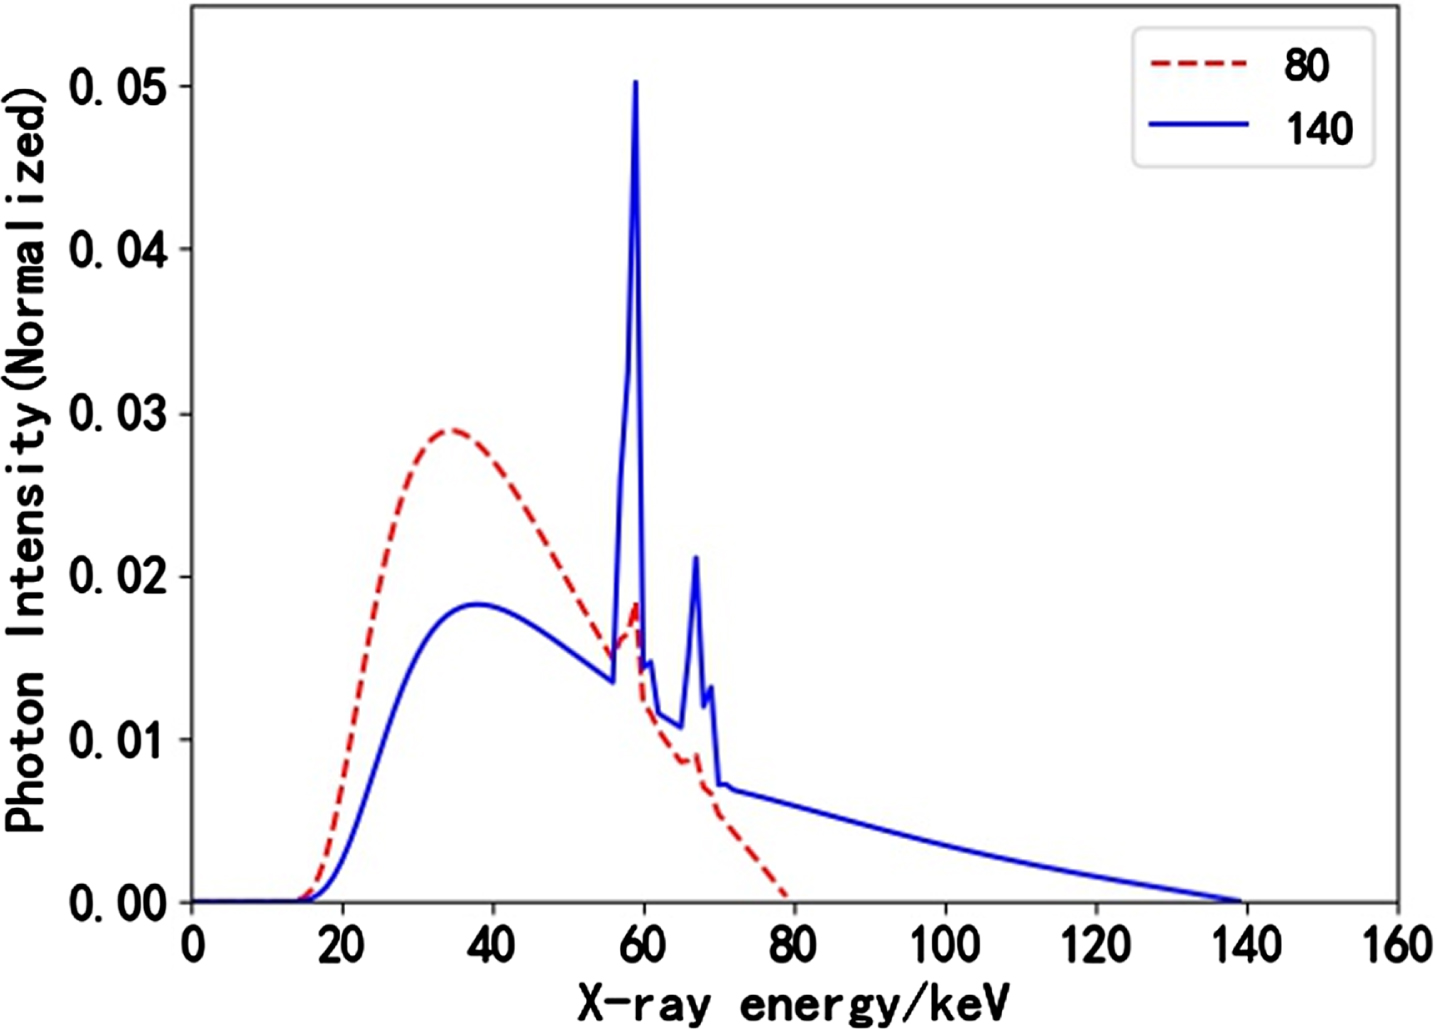
The X-ray spectra used in our experiments.
The proposed DS-AEDS is implemented by python and CUDA. All the experiments are performed on the Windows Server 2016 server (NVIDIA Tesla V100 S card with 32 G video memory).
The selection of parameters is critical in each of the above algorithms. The only parameter involved in the SART algorithm is its relaxation parameter which is set to be 1 in our simulated experiments. The parameters of AEDS [12], DTV [3] and Newton+AEDS for noise-free and noisy data are shown in Tables 2, 3 and 4, respectively, where we have used the same notations in the references.
Reconstruction parameters used by AEDS algorithm on simulated data
Reconstruction parameters used by DTV algorithm on simulated data
Reconstruction parameters used by the Newton+AEDS algorithm on simulated data
As for DS-AEDS, the threshold T for
Reconstruction parameters used by our proposed algorithm on simulated data
Due to the polychromatic nature of X-rays as well as the high abortion of the scanned sample, the image reconstructed with SART will be degraded by beam hardening artifacts, as shown in Fig. 5, where Fig. 5(a) is the reconstructed result with SART from 100kVp full-angle polychromatic projections. It can be seen that the gray values at the border parts of the metal are greater than those of the inner part. In addition, the middle part of the thin iron sheet pointed by the red arrow is not visible in the reconstructed result due to beam hardening artifacts. Obviously, there are beam hardening artifacts in the reconstructed result. Figure 5(b) and (c) show the profiles along the red lines in Fig. 5(a), where typical cupping artifacts can be clearly seen.
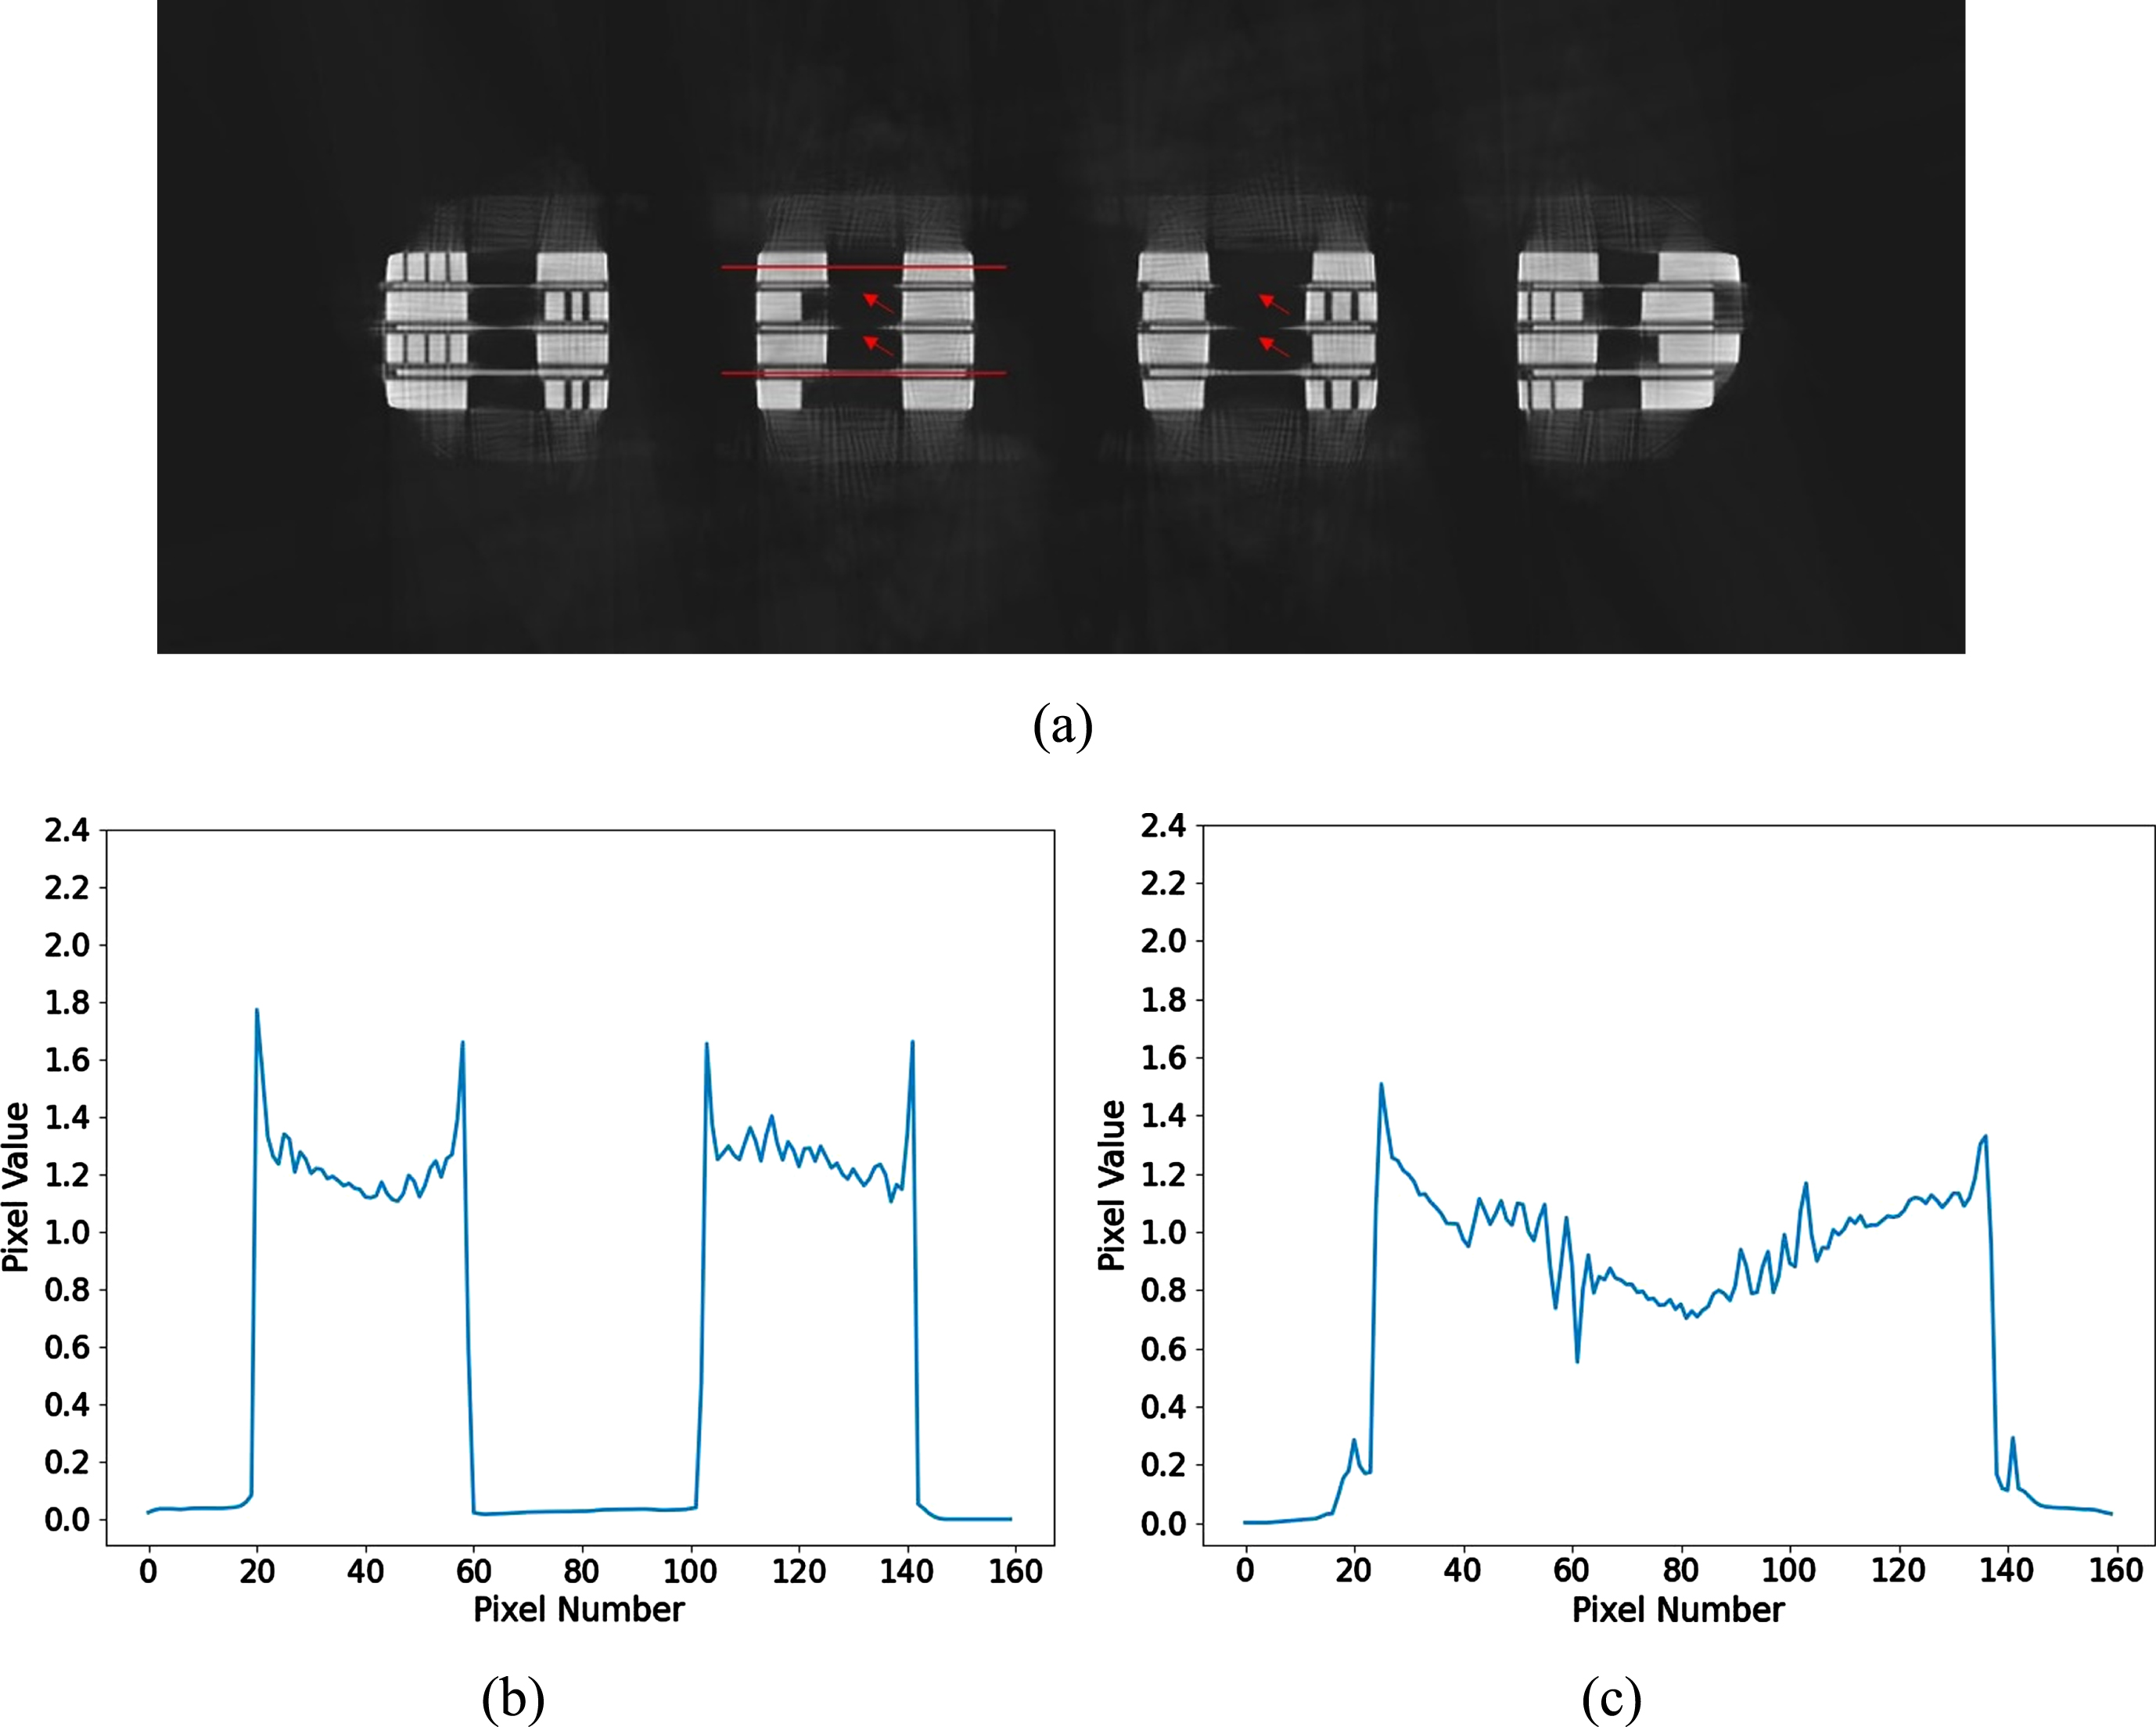
(a) The reconstructed result with SART from 100kVp full-angle polychromatic projections; (b) The profile along the top red line in (a); (c) The profile along the bottom red line in (a).
Reconstructed results of the proposed DS-AEDS algorithm and comparative algorithms are presented in this section. Figure 6 and 7 are reconstructed results from noise-free and noisy projections. For noisy data, the noise is the Poisson noise of 107 photons per ray. In both Fig. 6 and 7 , subfigures (a), (b) and (c) are reconstructed results by SART, AEDS [12] and DTV [3] from 100kVp polychromatic projections. Subfigures (d) and (g) are 100 keV monochromatic images reconstructed with Newton+AEDS and the proposed DS-AEDS from 80kVp and 140kVp polychromatic projections. The former is synthesized from the basis material images in subfigures (e) and (f), while the latter is synthesized from the basis material images in subfigures (h) and (i). The Newton+AEDS algorithm is a combination of Newton and AEDS algorithms, which consists of the following two steps: 1) Decompose the limited-angle polychromatic projections directly in the projection domain to obtain line integrals of basis material using the Newton method. 2) Apply the AEDS algorithm on obtained line integrals to reconstruct basis material images. The quantitative measurements including NRMSE, PSNR and SSIM for the reconstructed results are shown in Table 6.
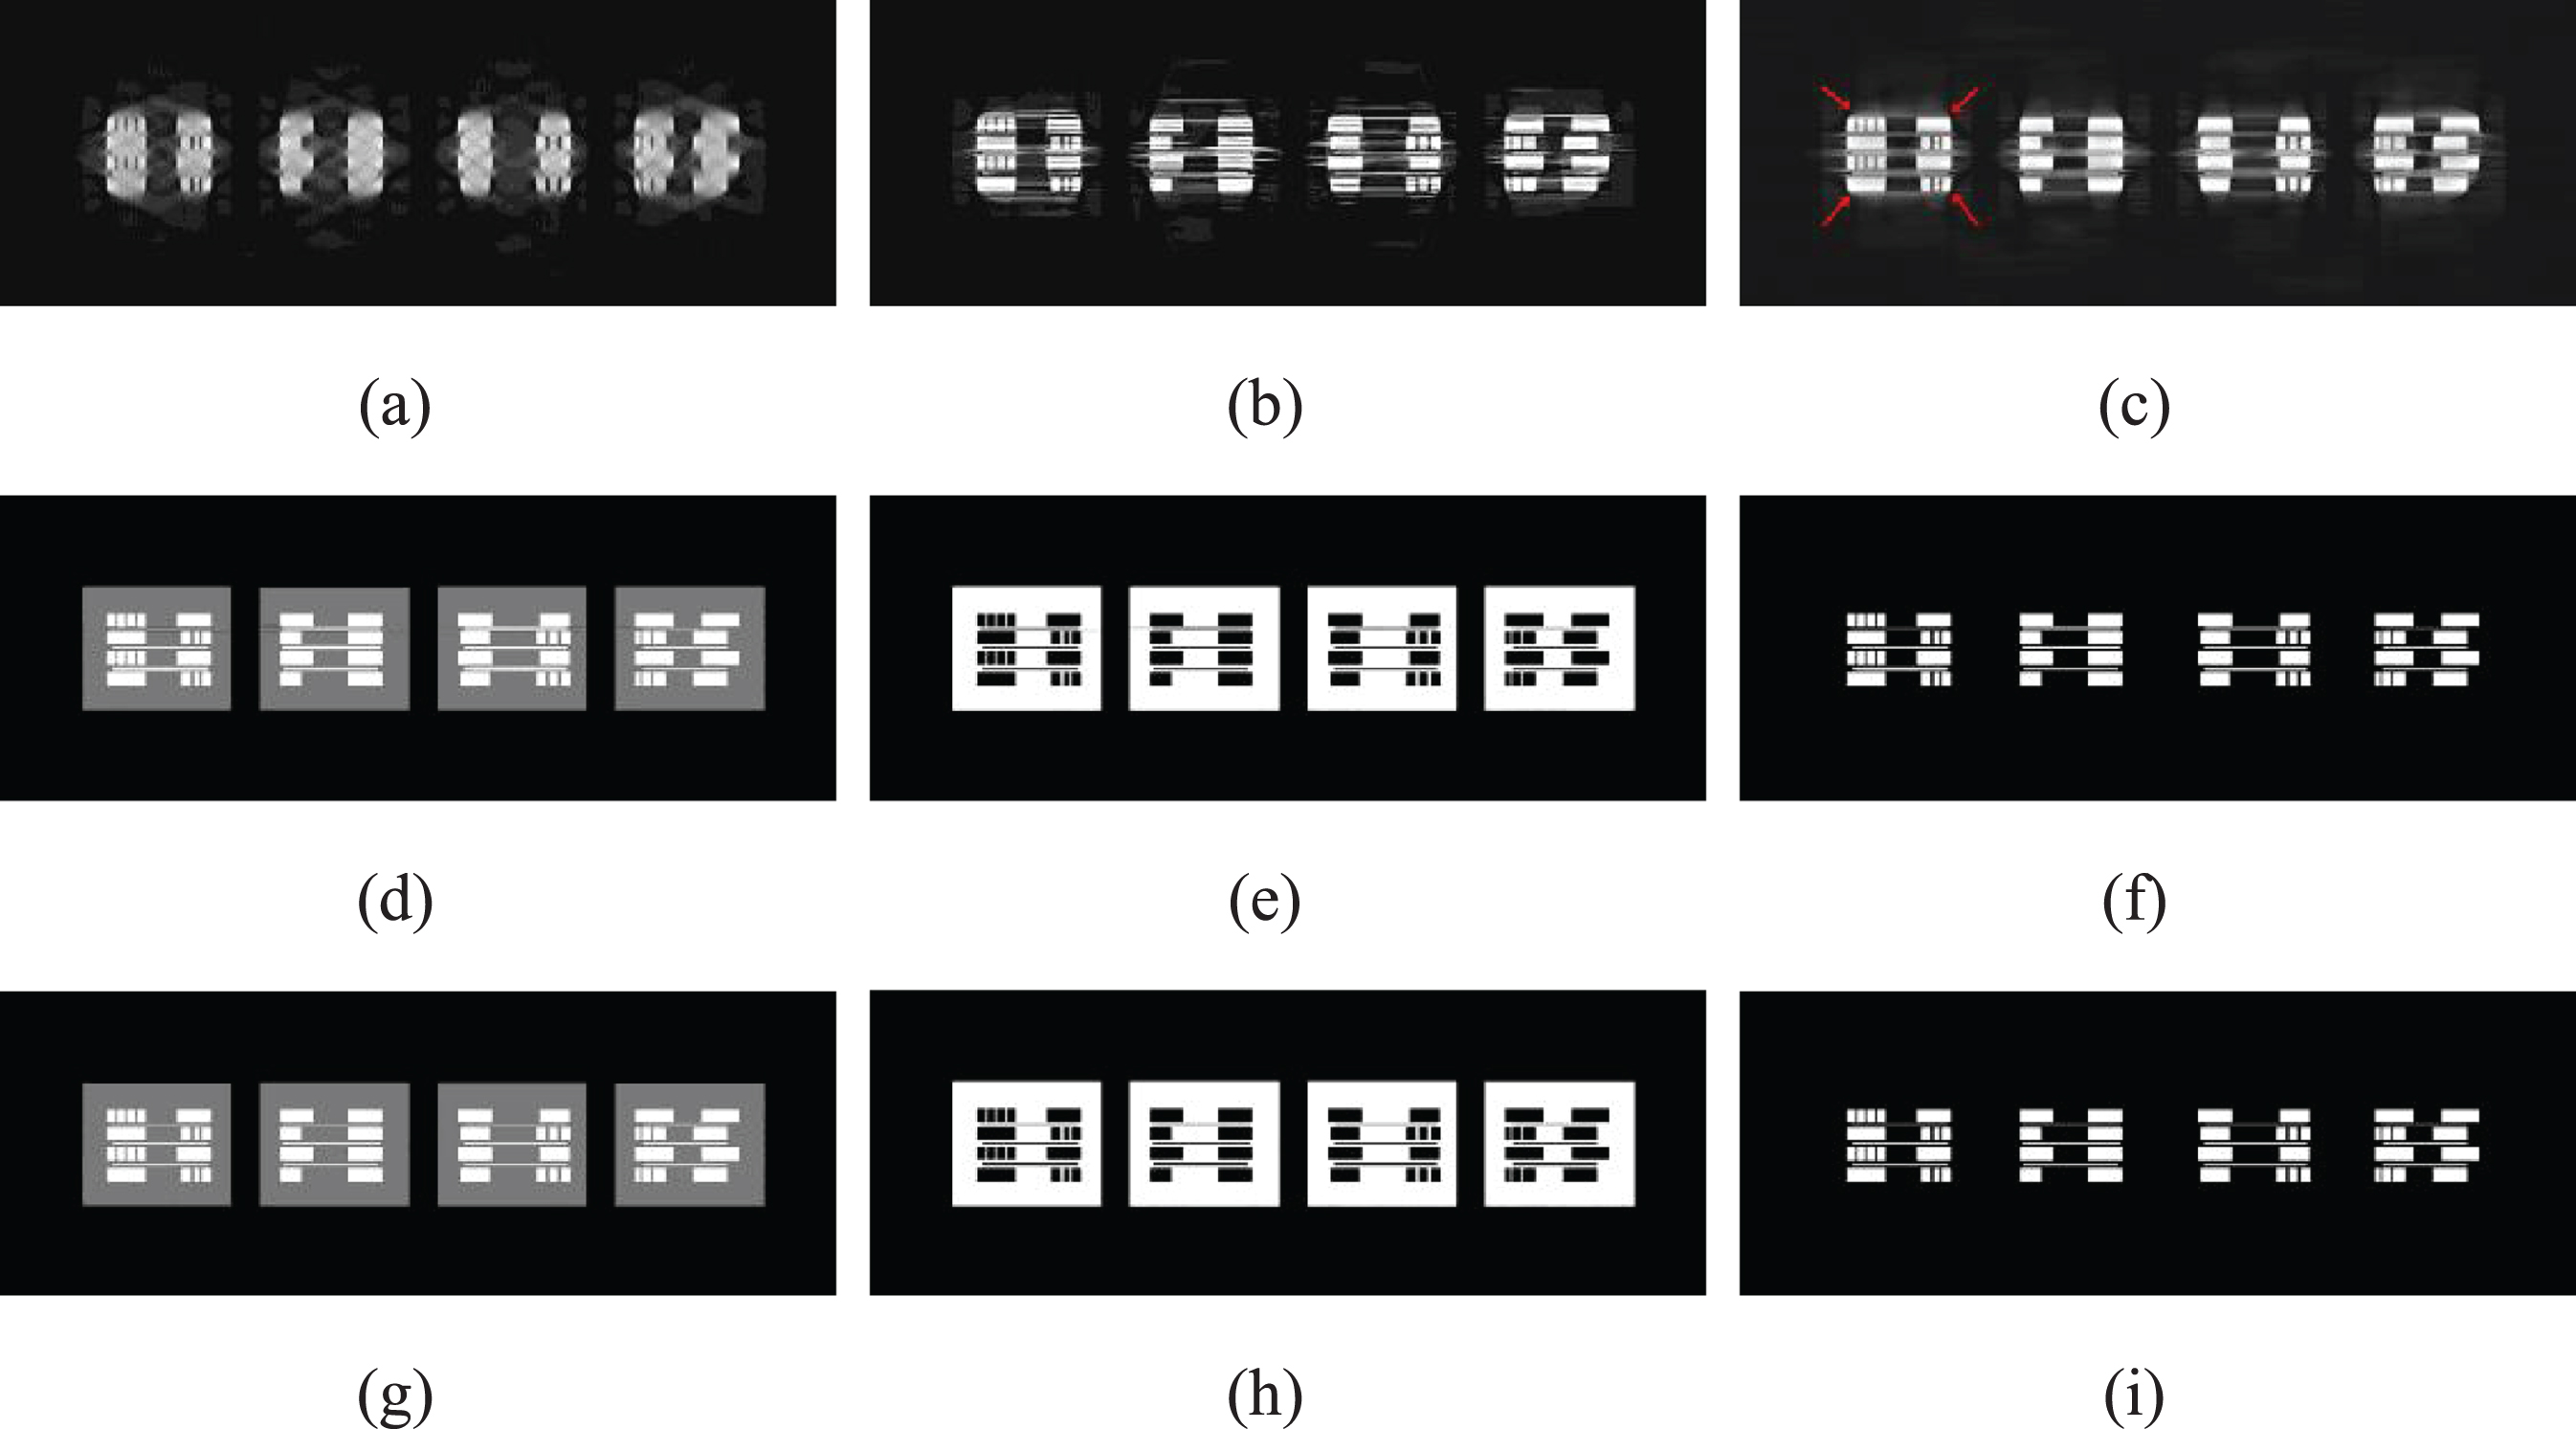
The reconstructed results from noise-free projections. (a), (b) and (c) are the results of SART, AEDS and DTV from 100kVp polychromatic projections; the display window of (a)-(c) is [– 0.2, 1.8]; (d) is the synthesized 100keV monochromatic image of Newton+AEDS algorithm, whose basis material images are (e) and (f); (g) is DS-AEDS algorithm’s synthesized 100keV monochromatic result, the corresponding basis material images are (h) and (i). For (d) and (g), the display window is [0.015, 0.045]; the display window of (e), (f), (h) and (i) is [– 0.2, 1.8]].
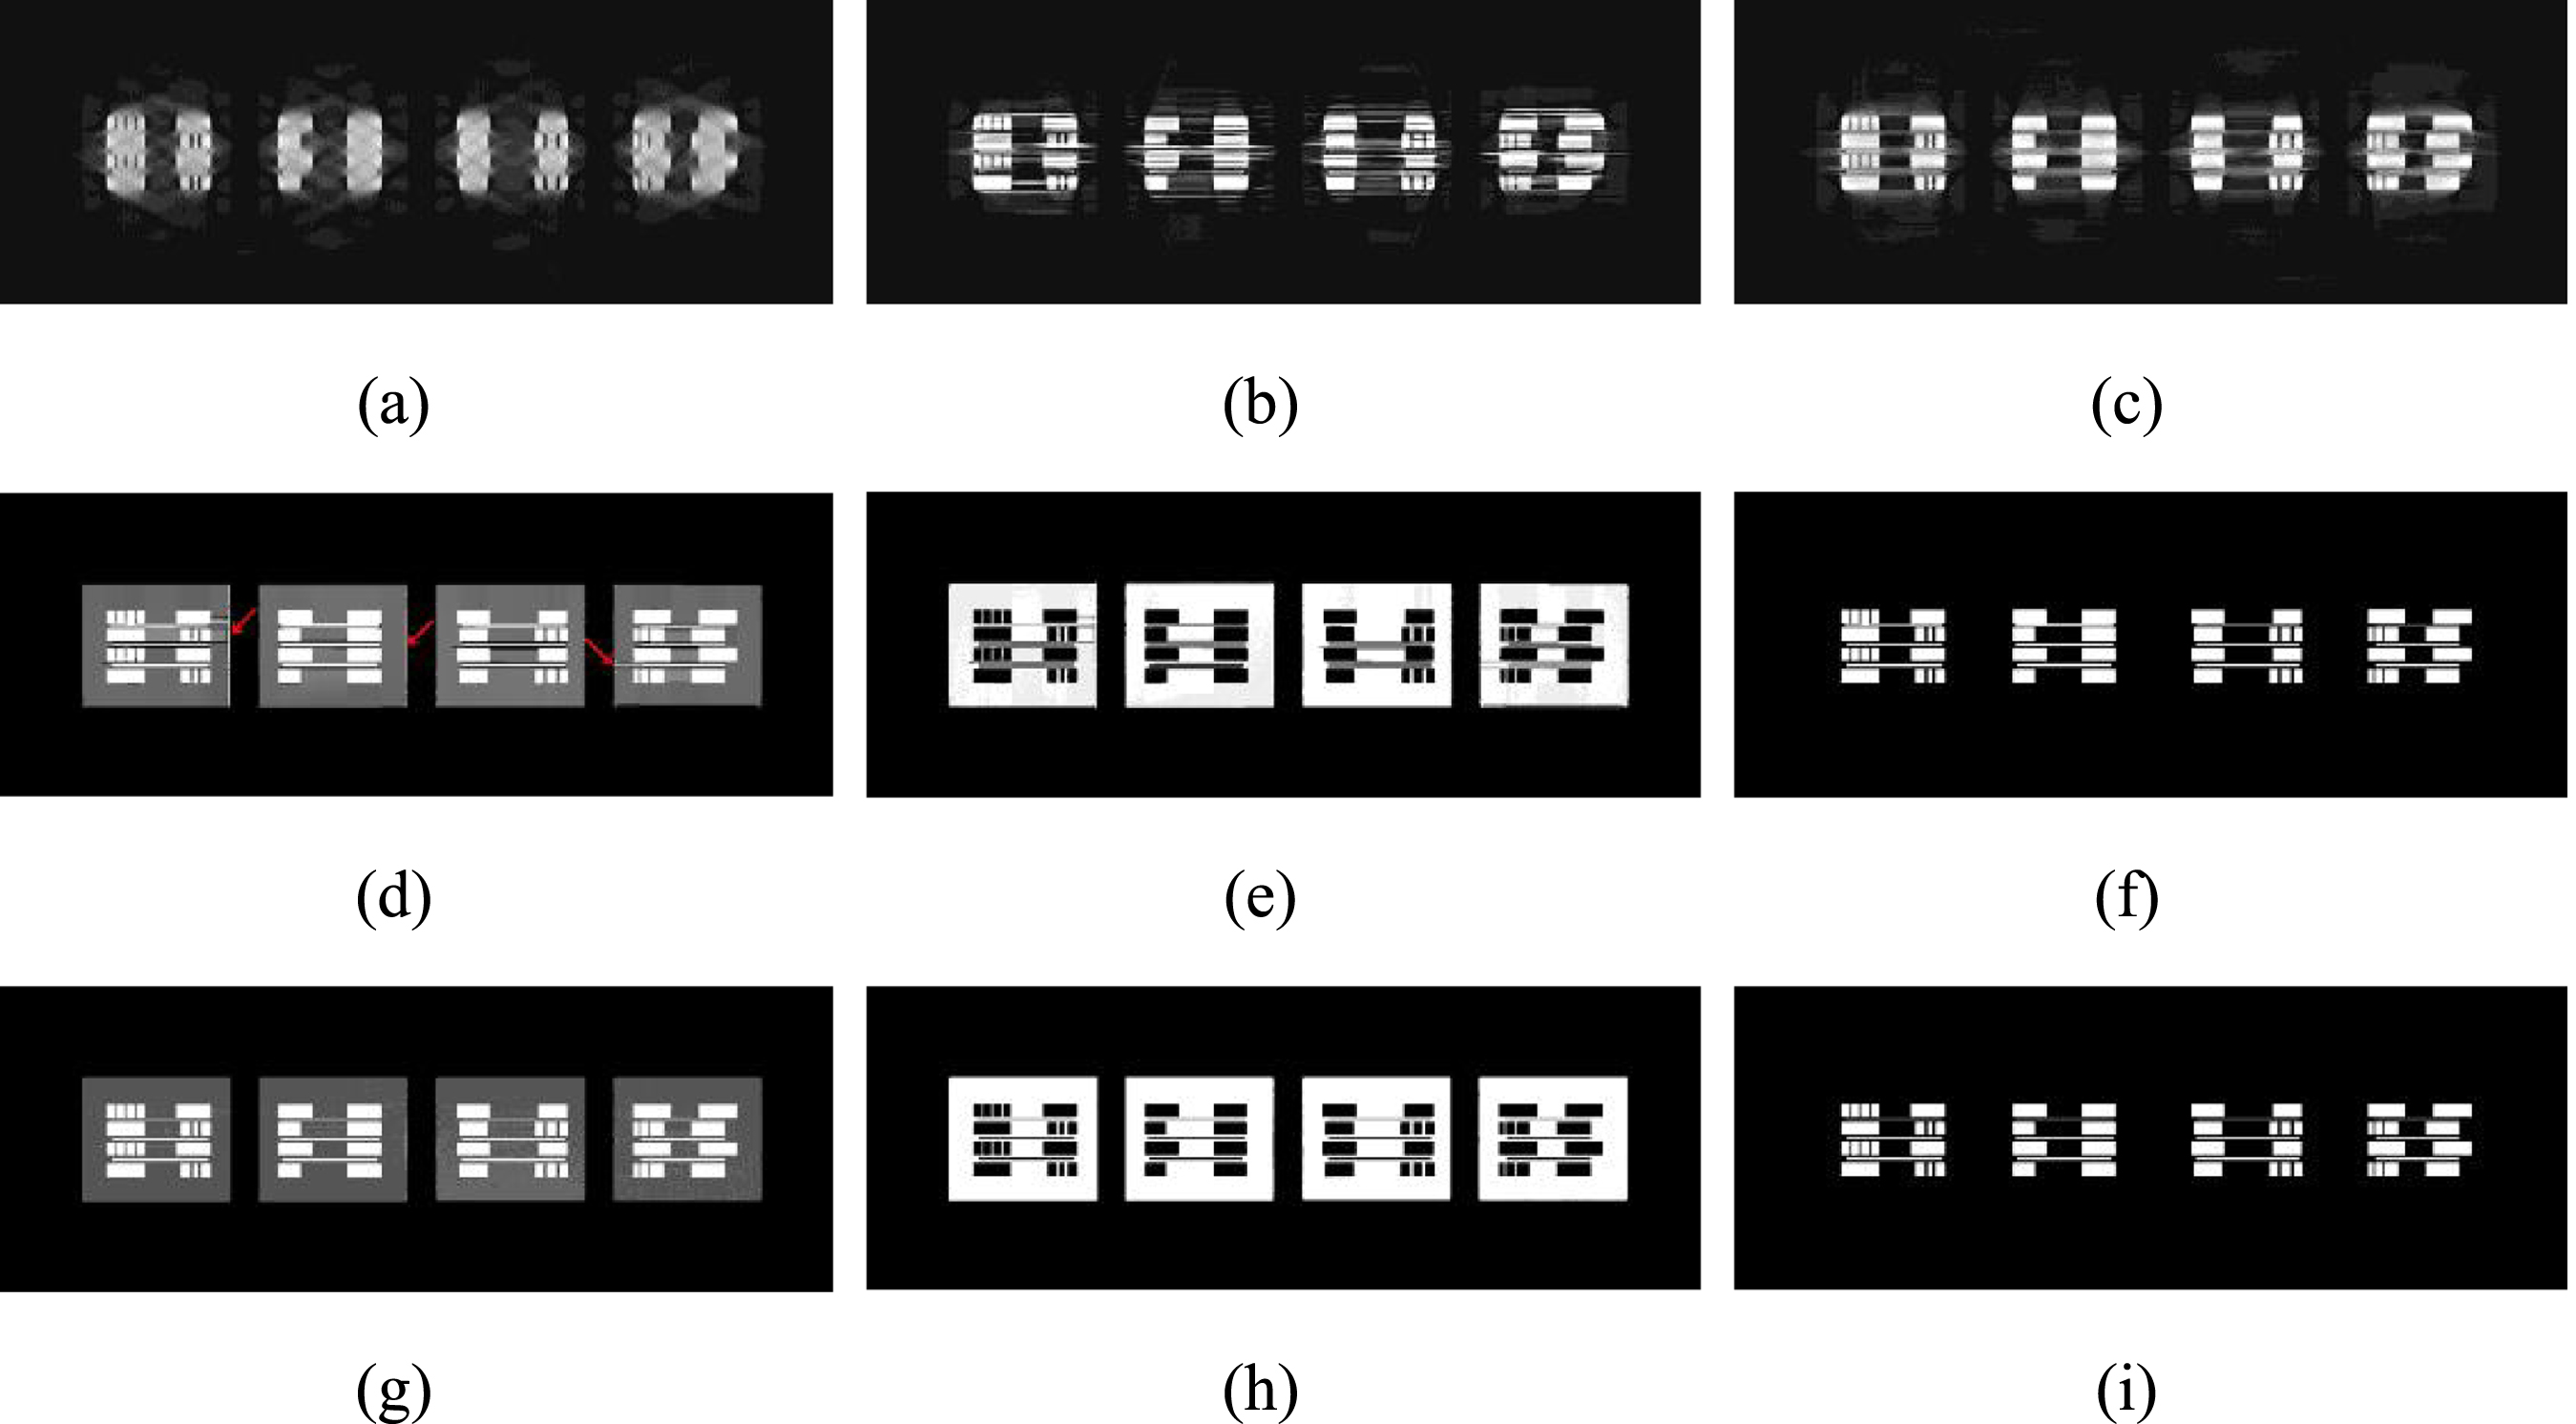
The reconstructed results from noisy projections, other descriptions and display window levels are the same as those in Fig. 6.
It can be seen from Fig. 6(a)that both beam hardening artifacts and limited-angle artifacts are so severe that the gray value distribution of the metal region in the reconstructed image is not uniform and horizontal image edges are blurred. In addition, due to the effects of the two types of artifacts, the copper routes of 0.015 mm, 0.03 mm and 0.045 mm are completely invisible in the reconstructed result. As shown in Fig. 6(b), AEDS has alleviated the limited-angle artifacts, and several blurred edges are recovered. But, as the polychromatic characteristic of the projections is not considered in AEDS, the model fails to reconstruct all the copper routes, and fake edges are even introduced. The DTV reconstructed result in Fig. 6(c)cannot clearly show the thin copper routes, and the corners indicated by the arrows are not very sharp, due to the effect of beam hardening. Newton+AEDS and the proposed DS-AEDS obtain satisfactory reconstructed results as shown in Fig. 6(d) and (g), where no obvious visual differences exist. But from Table 6, we can see that the quantitative measurements of the results of the proposed algorithm are better than those of Newton+AEDS.
Reconstructed results of the proposed DS-AEDS algorithm and comparative algorithms from noisy data are shown in Fig. 7, from which similar conclusions could be drawn. Similar to noise-free cases, SART, AEDS and DTV still fail to recover the thin copper routes and sharp corners of thick metal. Moreover, due to the high sensitivity to noise, the Newton+AEDS method cannot obtain accurate line integrals of basis material, fake edges are produced by the AEDS method as indicated by the red arrows in Fig. 7(d). But from Fig. 7(g), we can see that our proposed method is robust to noise, limited-angle artifacts and beam hardening artifacts are both well suppressed and all the copper routes are correctly reconstructed.
Figure 8 shows the profiles of the reconstructed results by different algorithms of noise-free and noisy cases. The obvious cupping shape can still be seen in the line profiles of SART, AEDS and DTV’s results, indicating that these methods could not effectively suppress beam hardening artifacts. This is in accordance with our intuition, since they do not take the polychromatic property of the X-ray into consideration. The black dotted lines in Fig. 8 show the results of DS-AEDS. It can be seen that the results of the DS-AEDS match the references very well, even for noisy case, indicating that beam hardening artifacts are effectively eliminated.
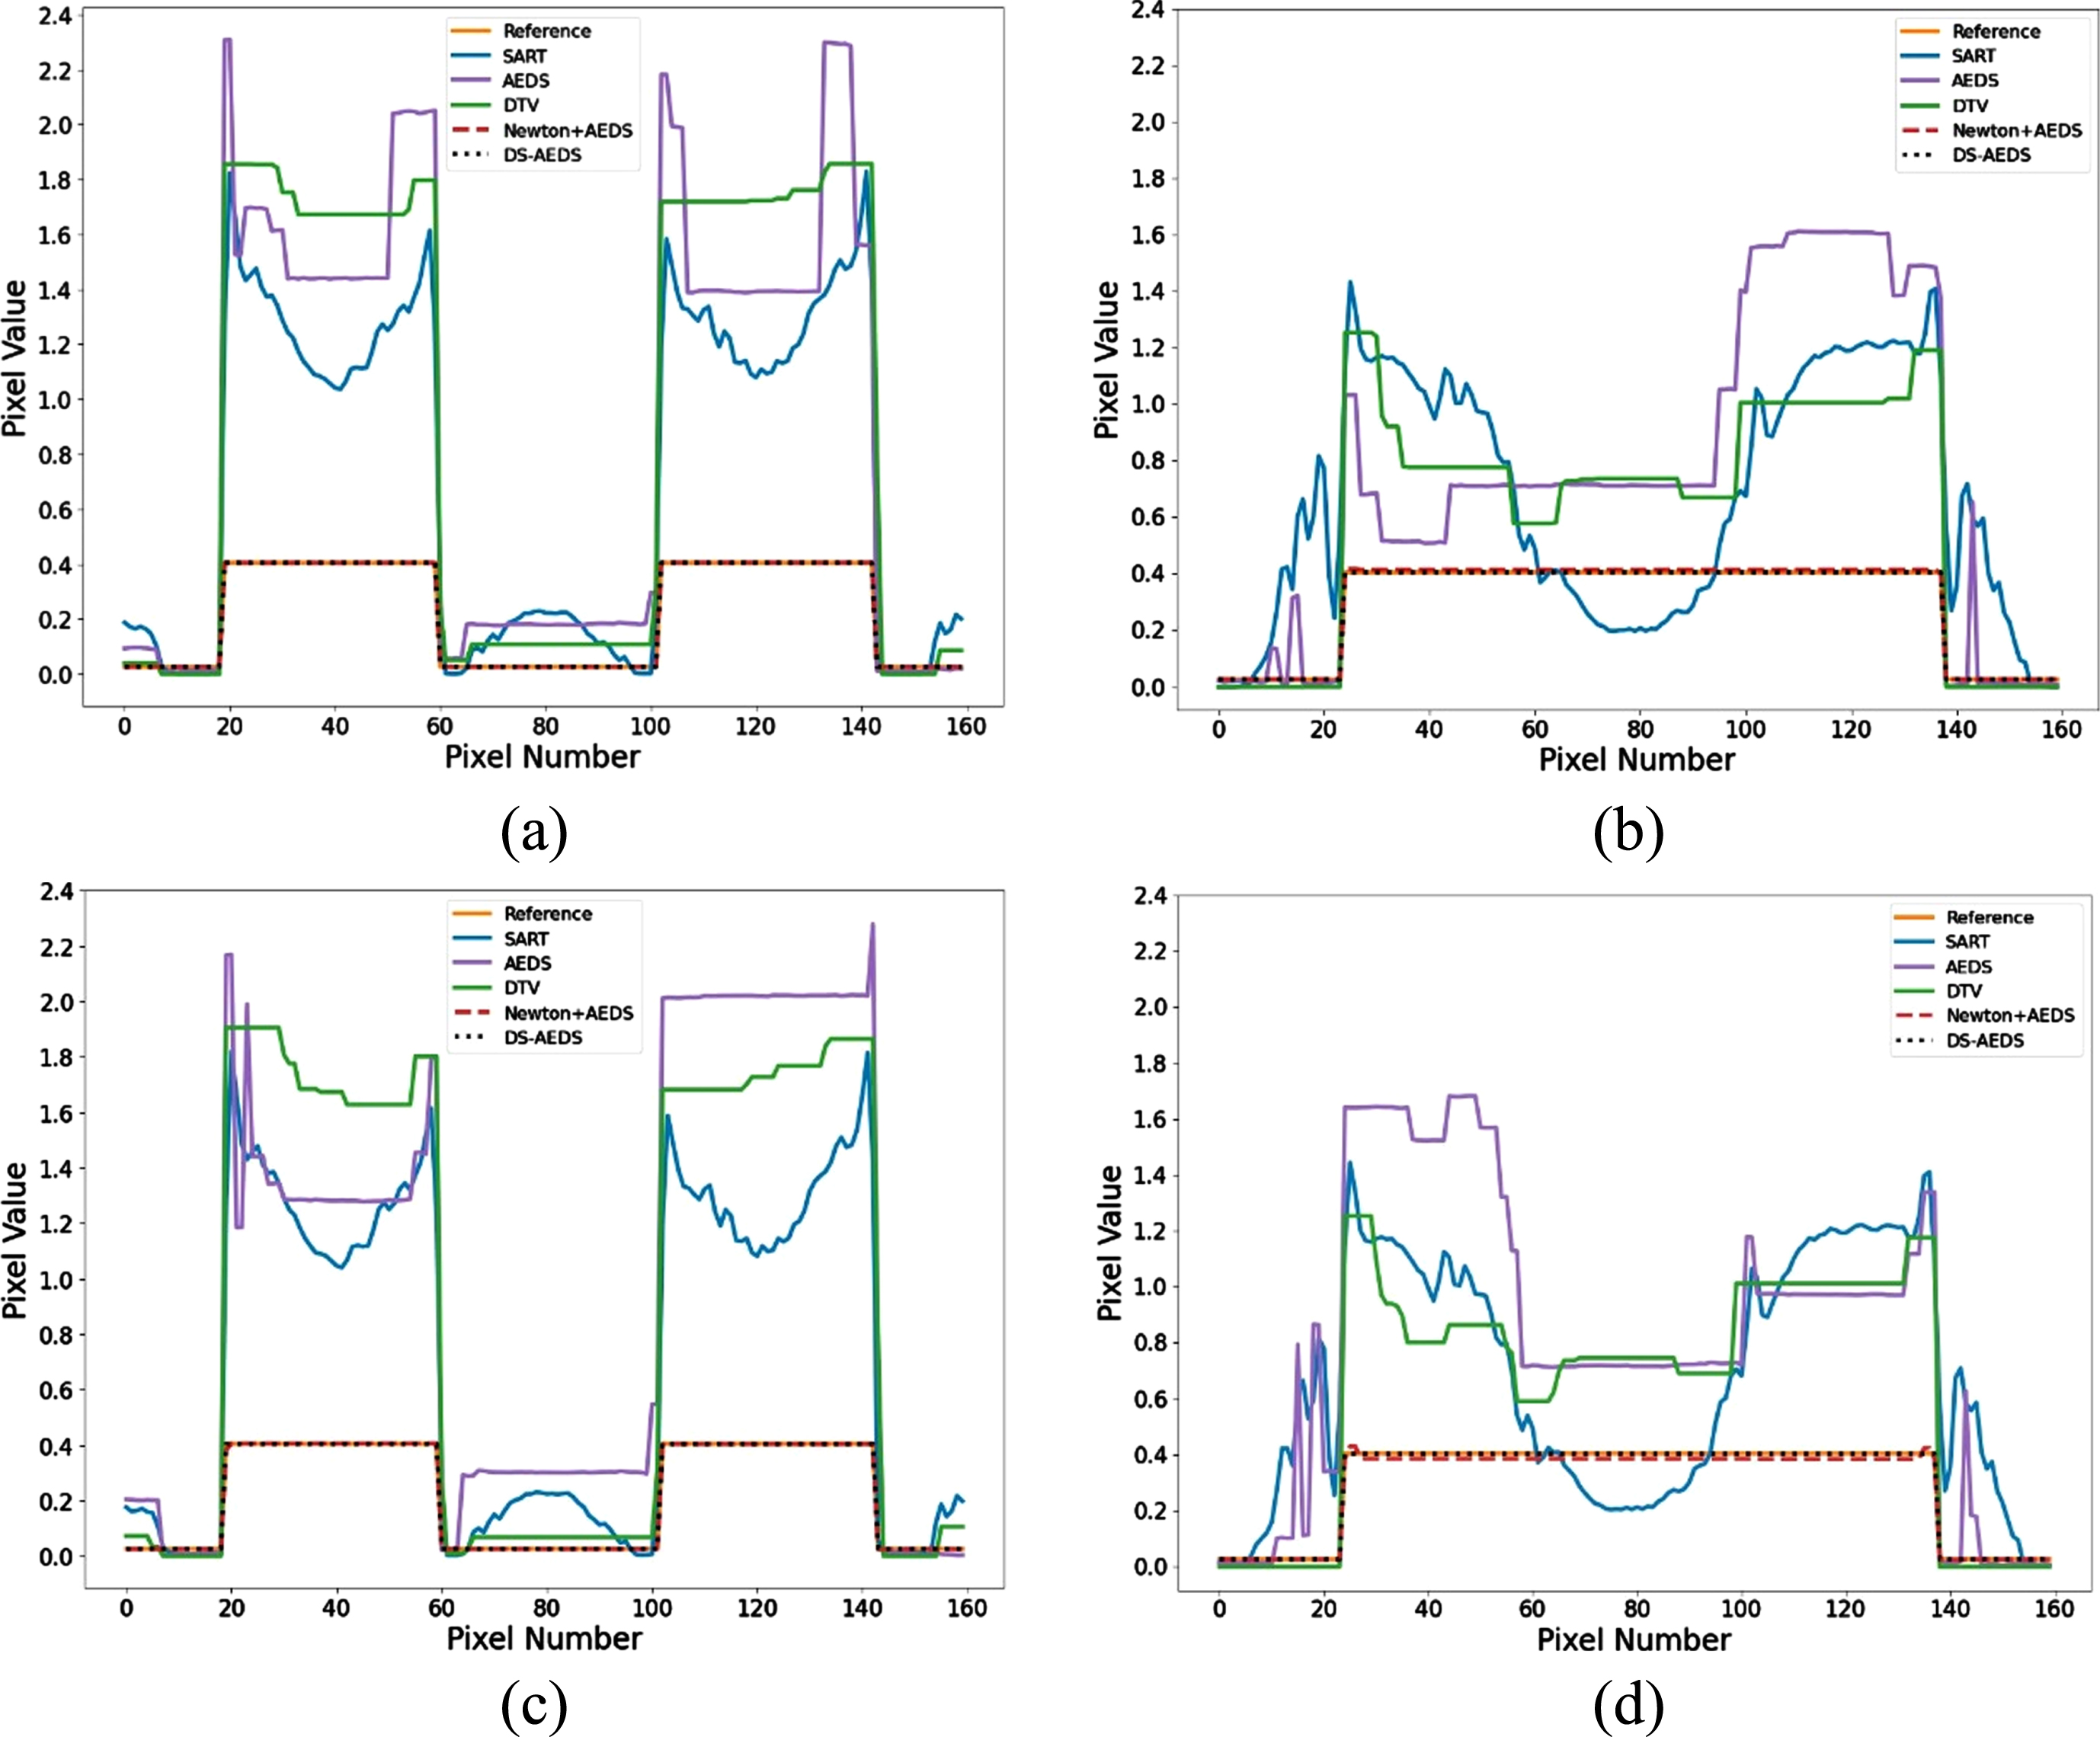
The profiles of the reconstructed results by different algorithms of noise-free and noisy cases. (a) and (b) are the profiles corresponding to noise-free results in Fig. 6(a)(b)(c)(d)(g) along the lines in Fig. 5(a), respectively; (c) and (d) are the profiles corresponding to noisy results in Fig. 7(a)(b)(c)(d)(g) along the lines in Fig. 5(a), respectively.
The real data experiments are performed on the industrial CT system of our laboratory, as is shown in Fig. 9(a), which is equipped with a YXLON Y.TU-450-D11 (YXLON GmbH, Hamburg, Germany) X-ray source and an IRay NDT 1616HE detector (IRay Technology, Shanghai, China).
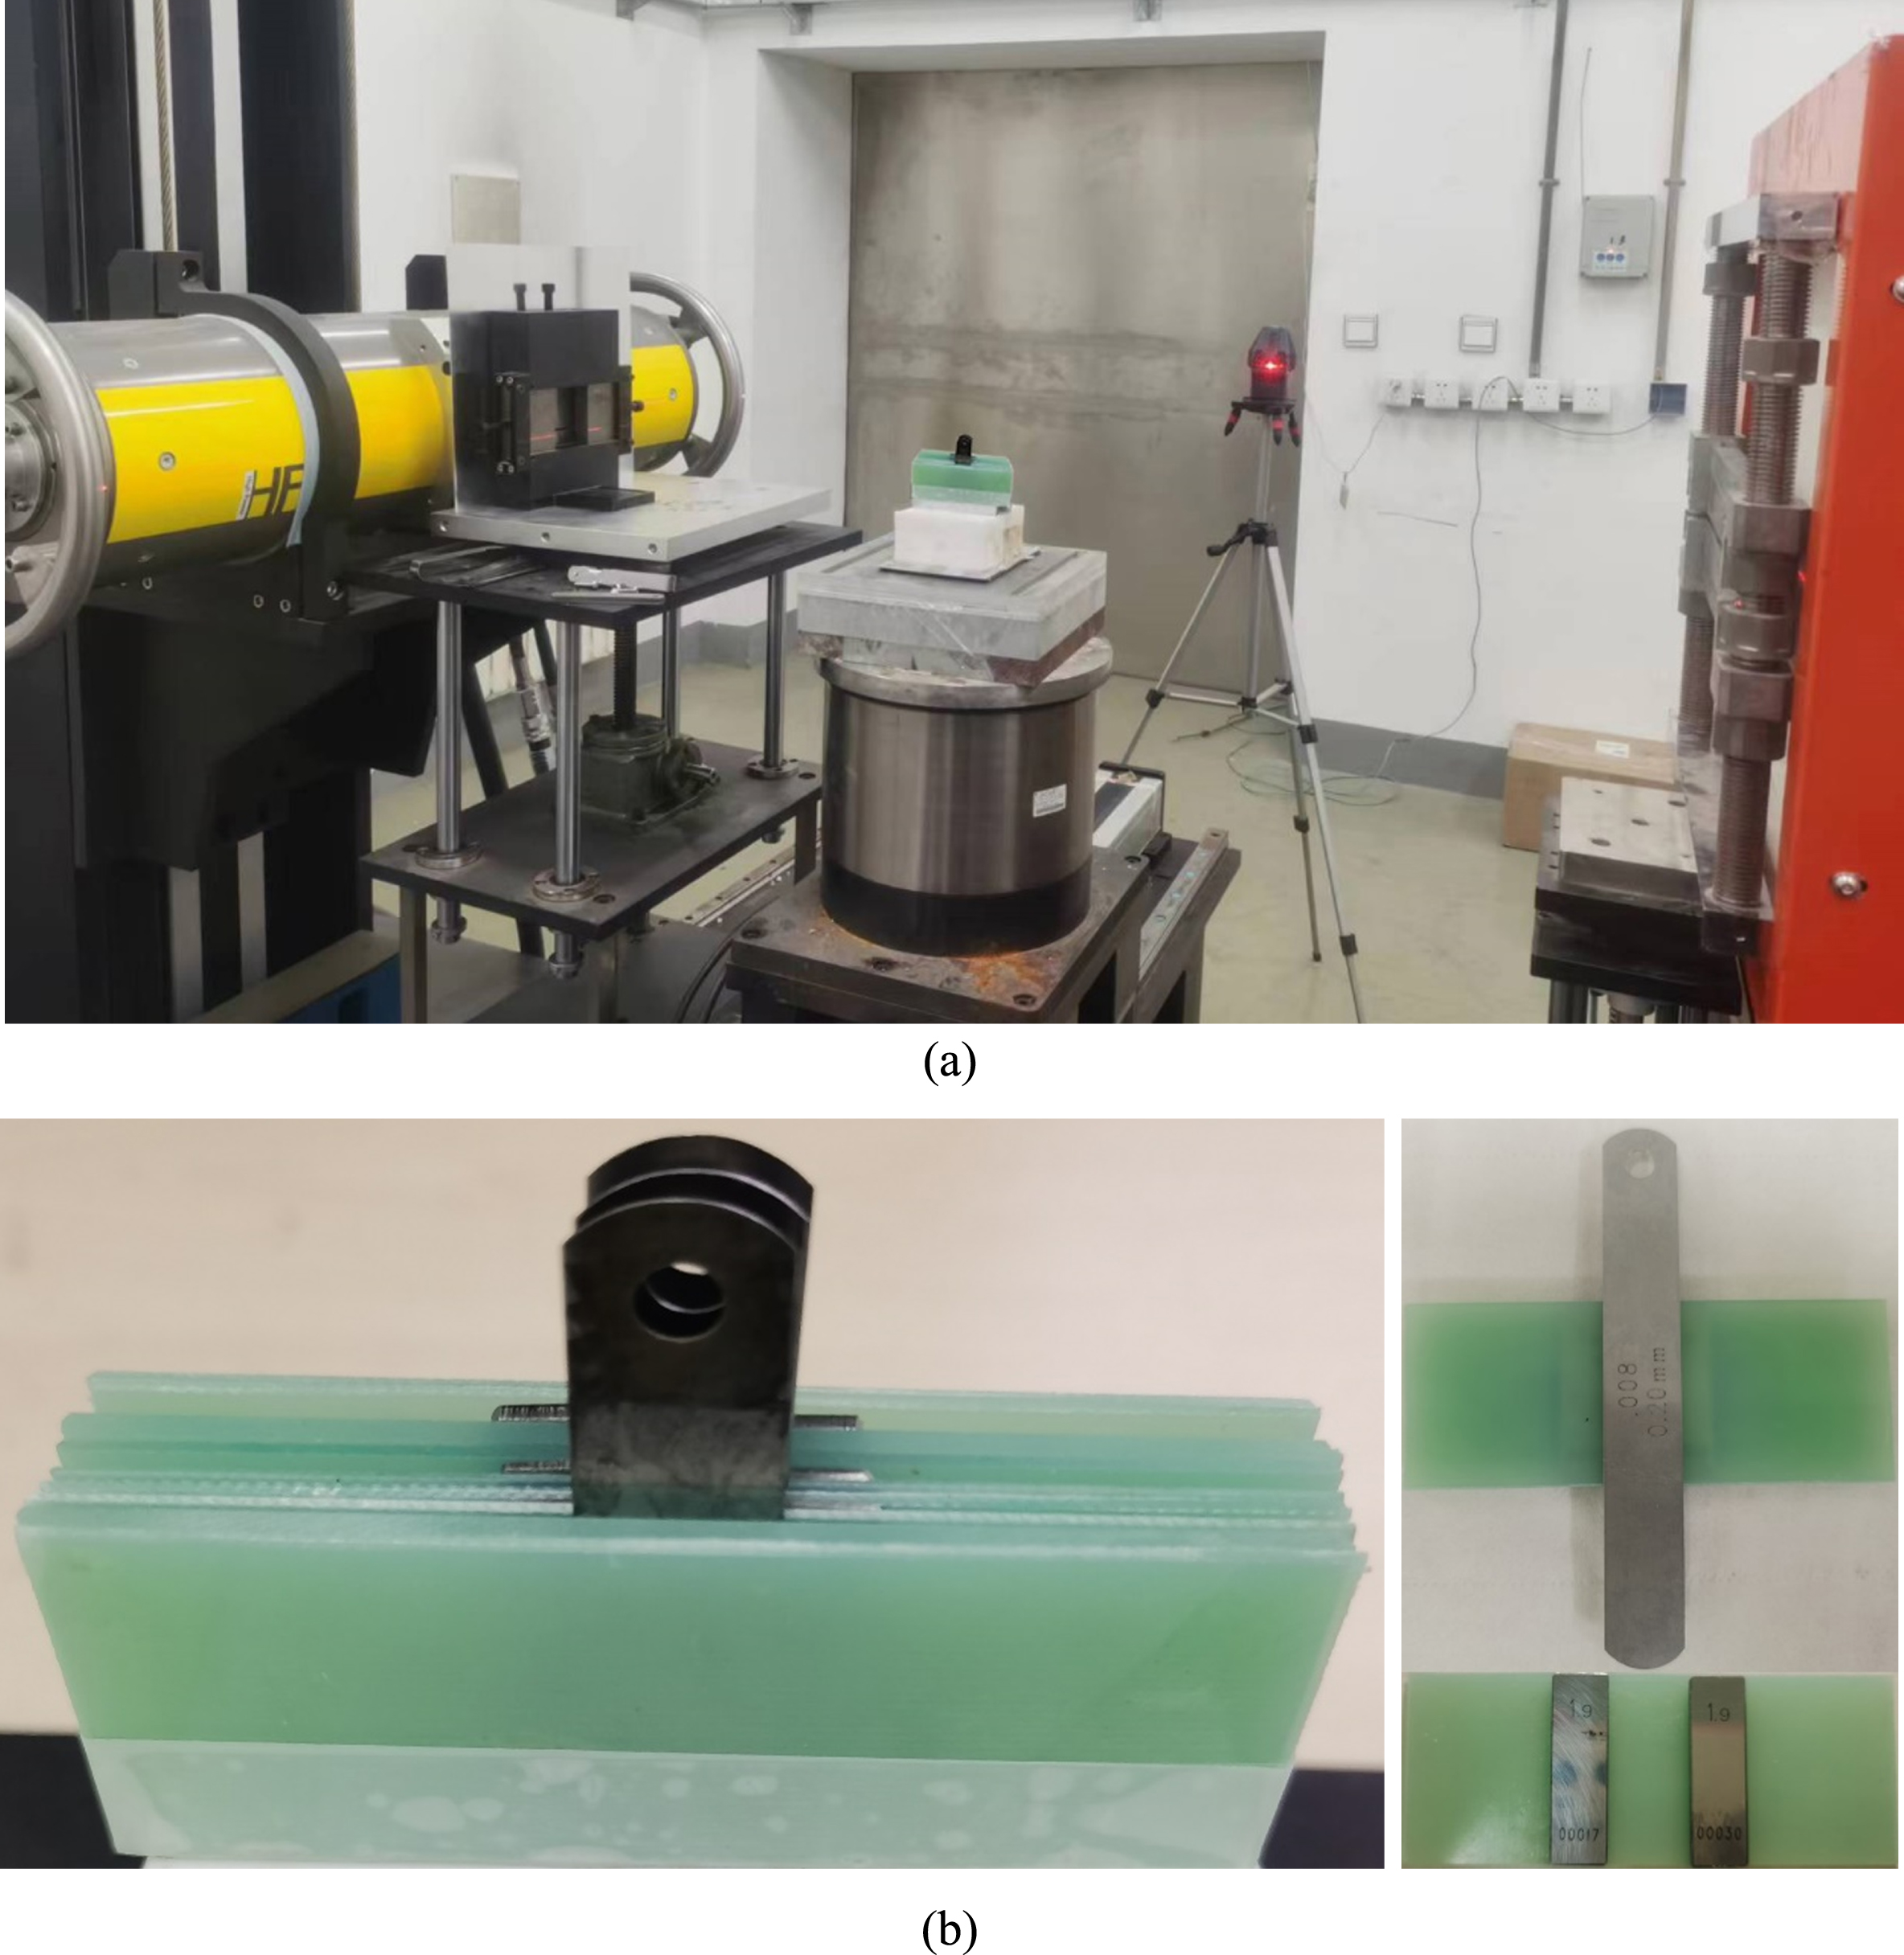
(a) shows the CT system. (b) is the scanned sample, which is sandwich-shaped, composed of alternately stacked aqua green FR4 plates and thin iron sheets.
The sample is sandwich-shaped, composed of alternately stacked Flame Retardant 4 (FR4) thin plates and thin iron sheets to simulate the circuit board, as shown in Fig. 9(b). The density of FR4, a common circuit board material, is about 1.02g/cm3, and the density of iron is about 7.85g/cm3. The overall length and width of the sample are 80mm and 16.5mm. The thicknesses of FR4 board and iron sheets are shown in Fig. 10. Three sets of scan data are acquired at voltages 250kV, 350kV and 300kV, where the first two are used in Newton+AEDS and DS-AEDS, while the last one is used in SART, DTV and AEDS. The parameters of the scanning configuration are shown in Table 7. The resolution of the reconstructed image is 1024 * 300, with a pixel size of 0.1mm. The parameters for the real data experiments are shown in Tables 8, 9 and 10. The relaxation factor for the SART algorithm is 0.2. For the sake of fairness, AEDS, DTV and DS-AEDS all use 12000 iterations. The number of iterations is smaller than that used in the simulated data because the thinnest iron routes reconstructed in the real data is 2 pixels theoretically (1 pixel in simulated data) and the sample’s physical structure is relatively simple.
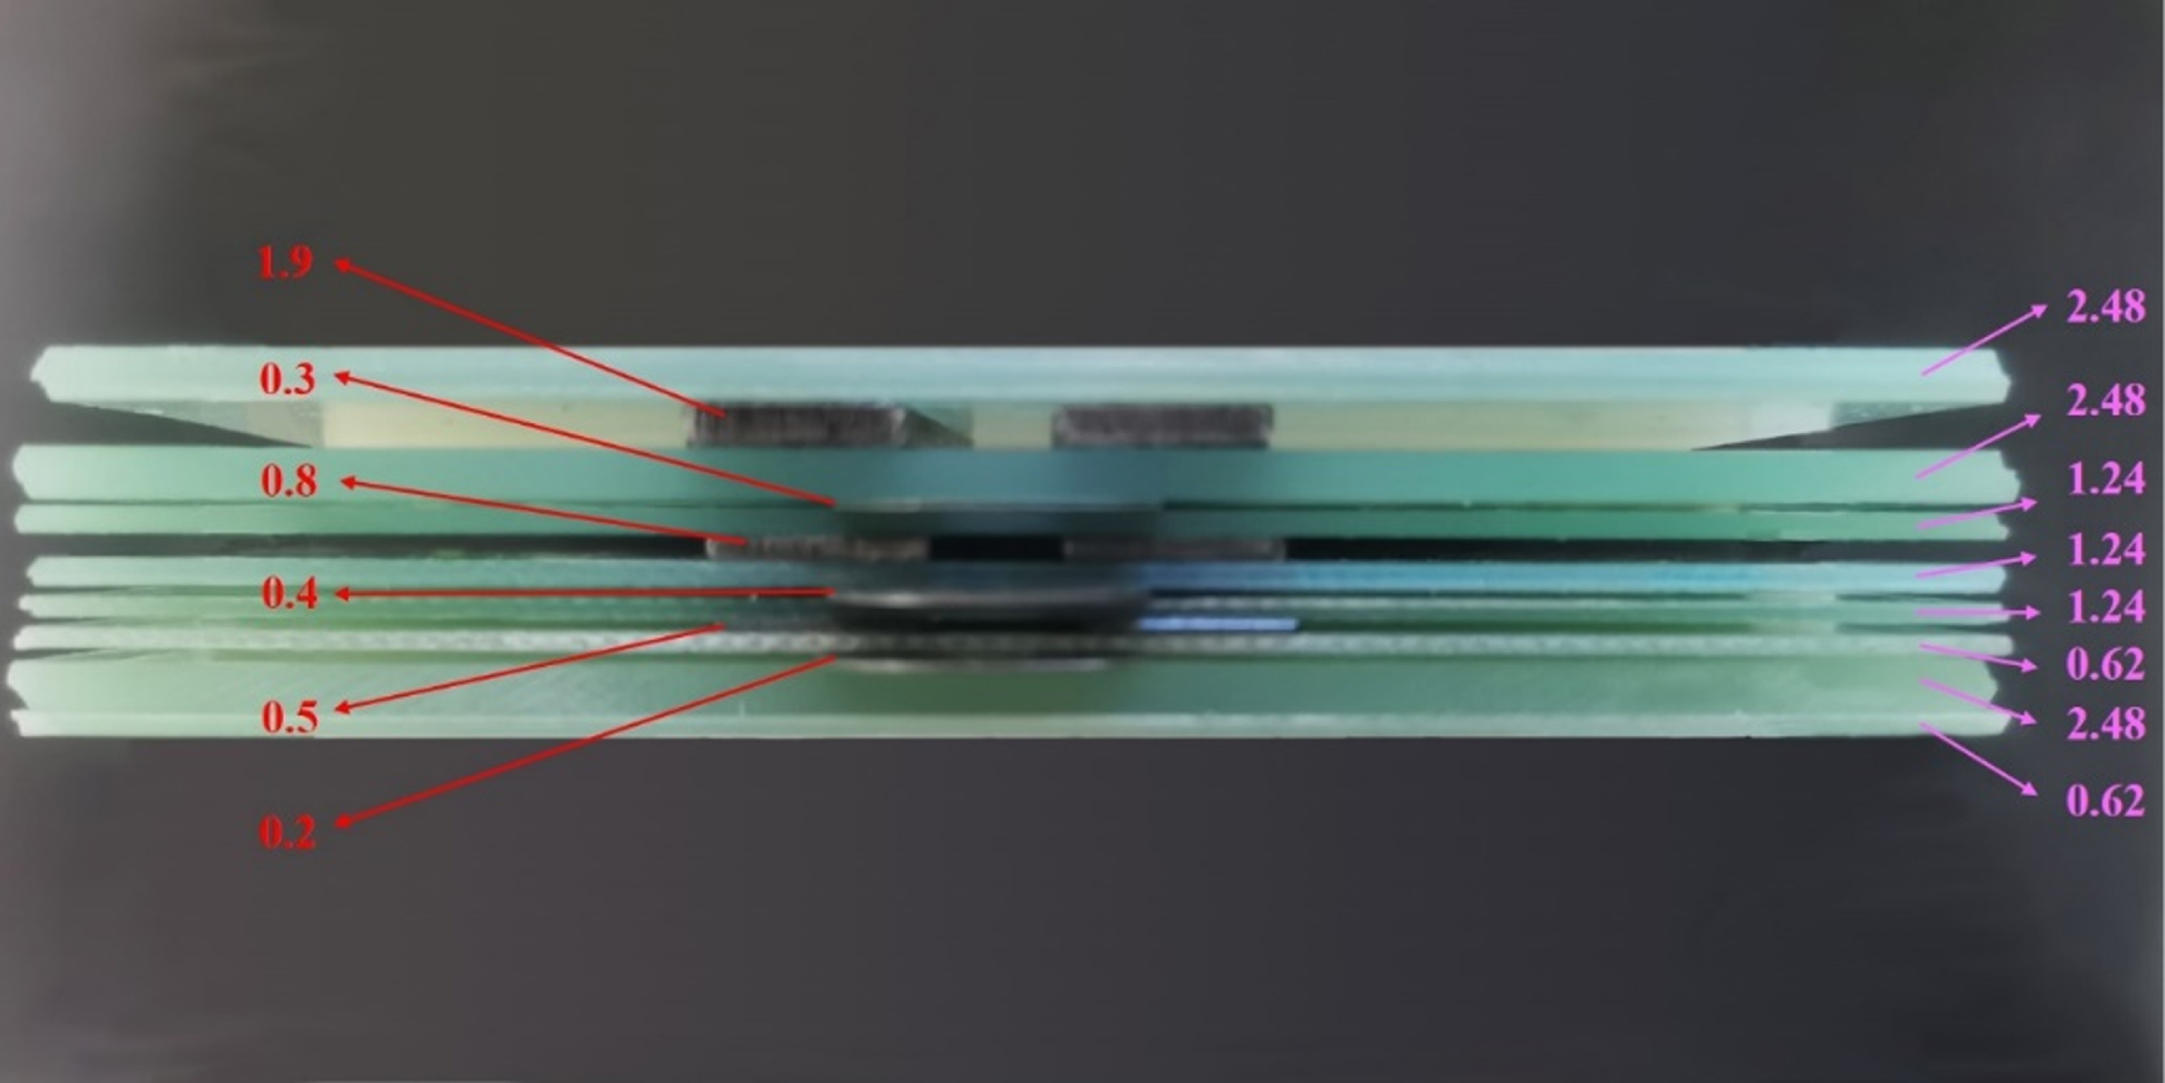
The top view of the scanned sample (mm).
The scanning configuration parameters for real data
Reconstruction parameters used by the AEDS algorithm on real data
Table9
Reconstruction parameters used by our proposed algorithm on real data
The reconstructed results of real data are shown in Fig. 11 and Fig. 12. Figure 11(a) is the reconstructed result with SART from full-angle projections, Fig. 11(b) and (c)are line profiles along the red lines in Fig. 11(a). From the reconstructed results as well as the line profiles, beam hardening artifacts can be clearly seen. In Fig. 12(a)-(c), are the results of SART, AEDS and DTV, (d) is the 300 keV monochromatic image synthesized from basis material images (e) and (f) that are reconstructed with DS-AEDS. The noise level of the real data is much higher than that of noisy simulated data, so Newton method cannot converge in our experiments. We did not put the Newton method experimental results in Fig. 12.
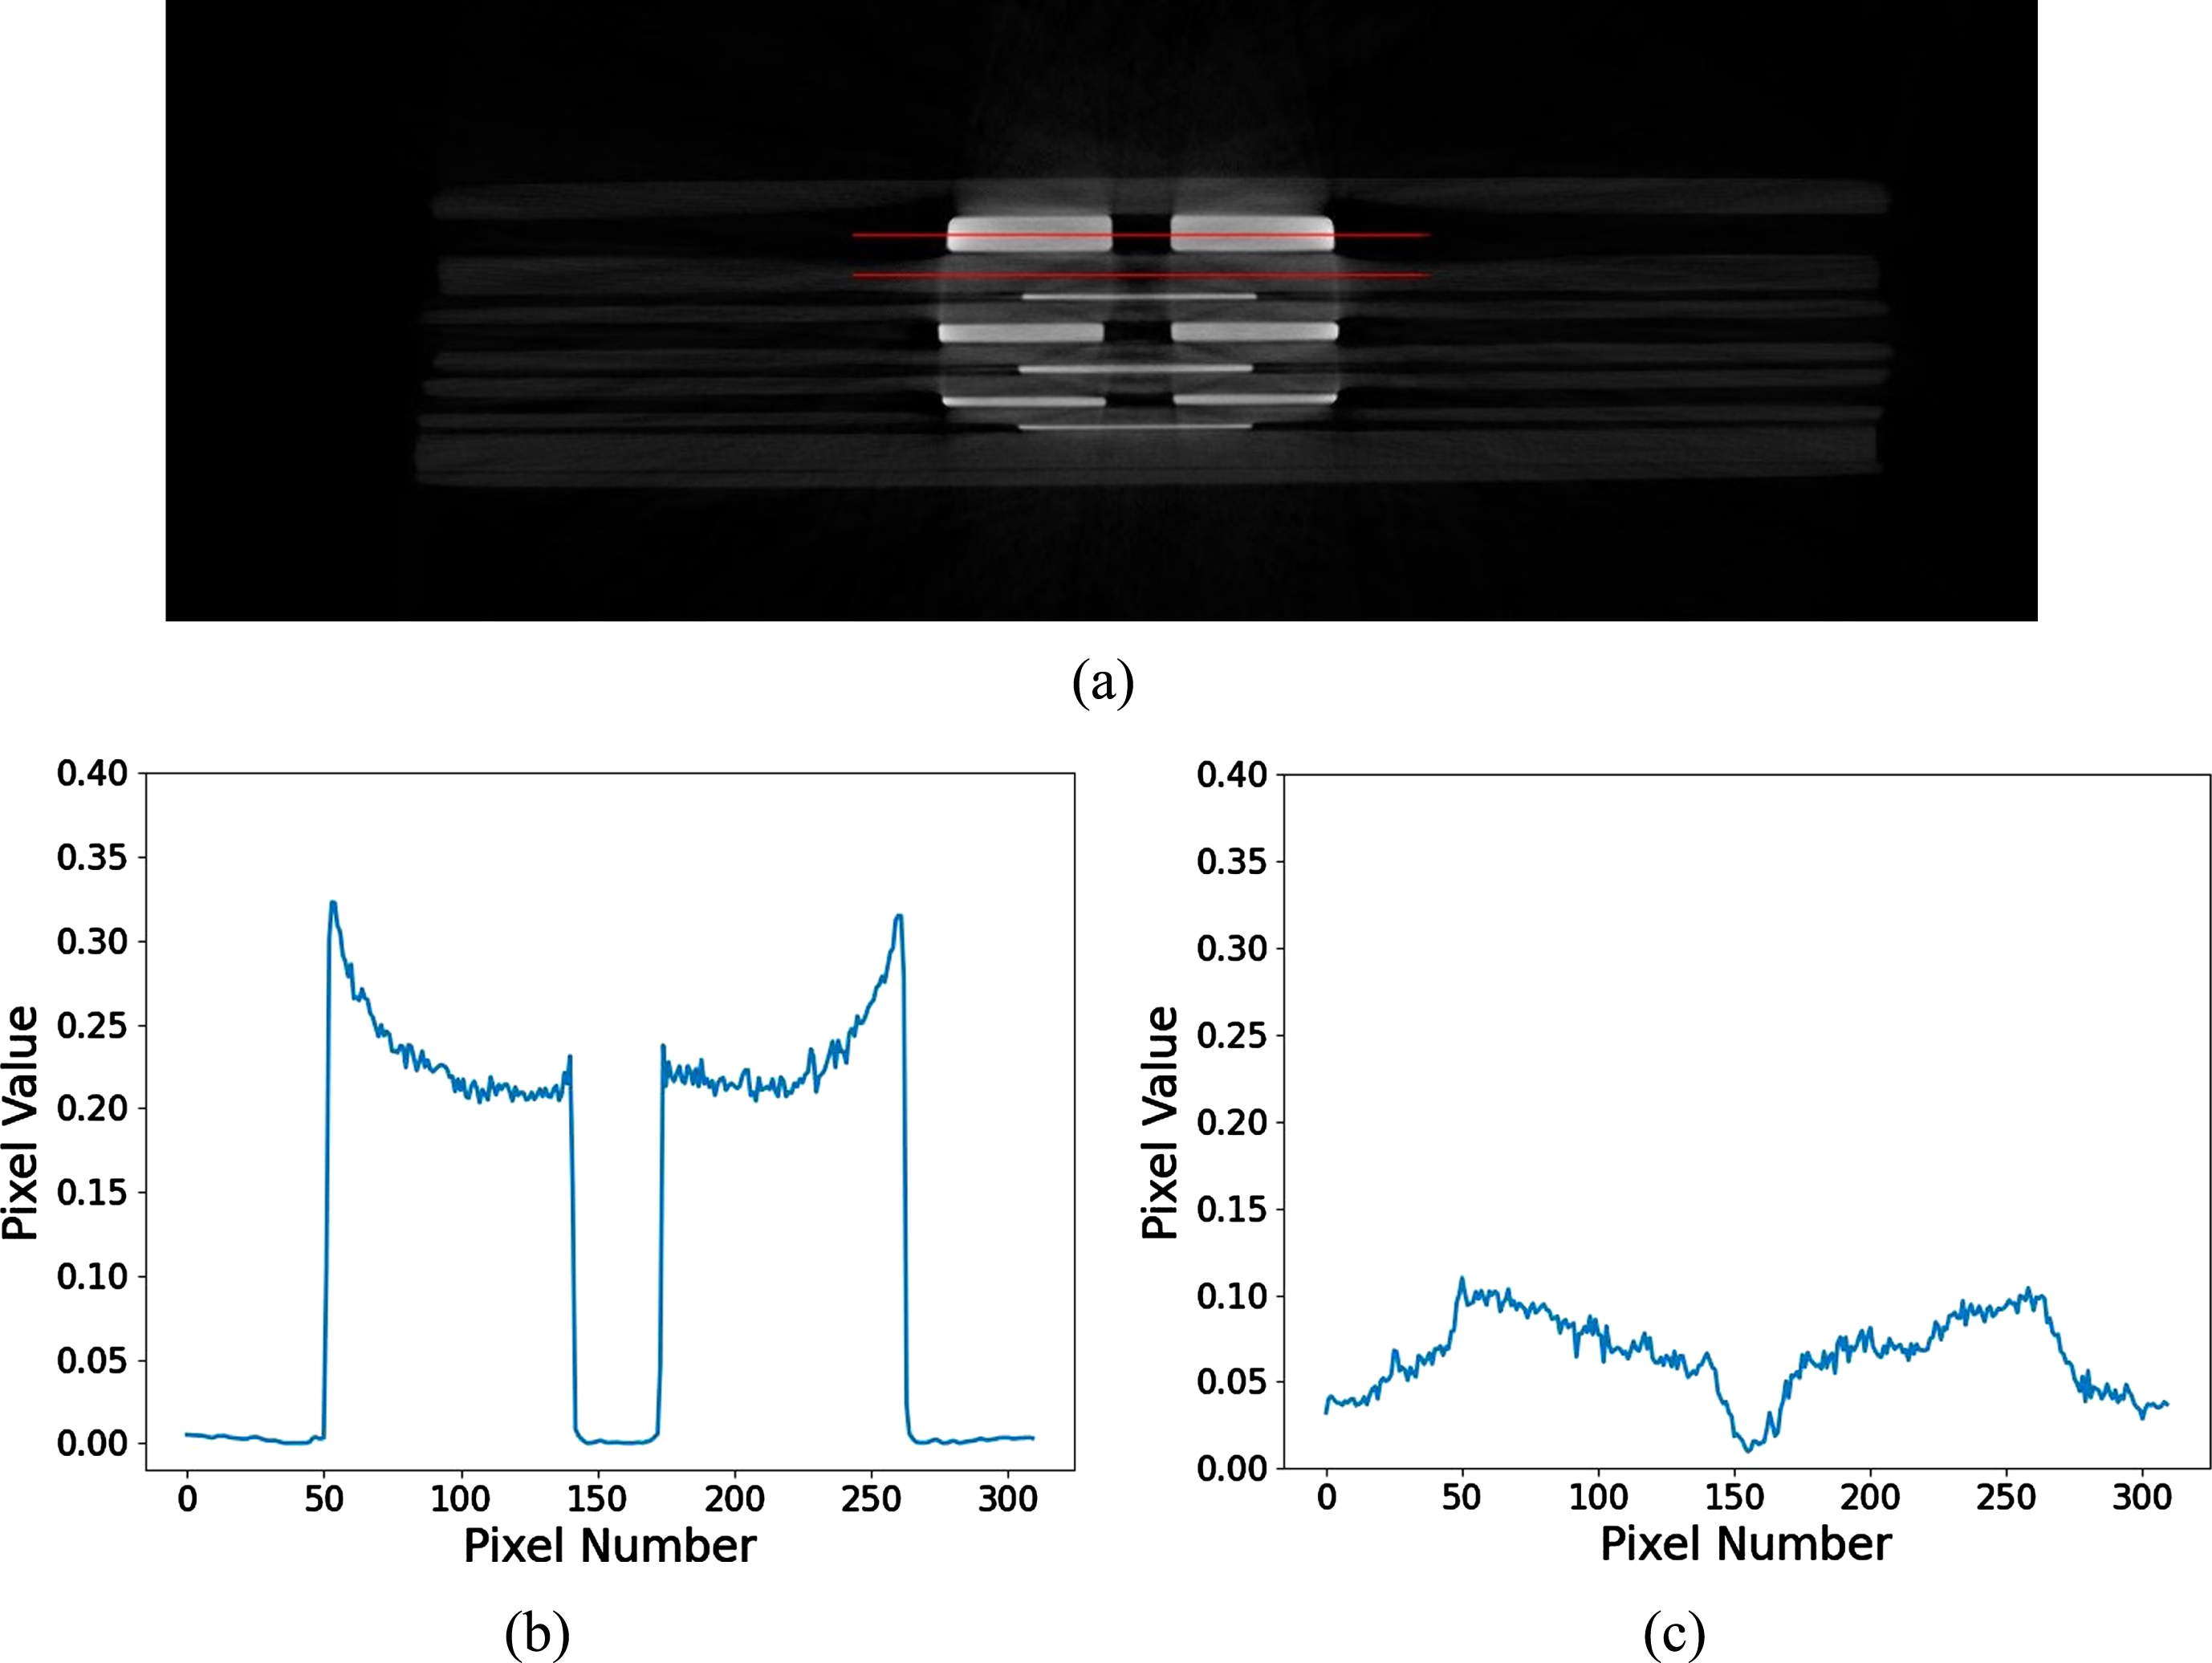
(a) The reconstructed result of real data with SART from 300kVp full-angle polychromatic projections; (b) The profile along the top red line in (a); (c) The profile along the bottom red line in (a).
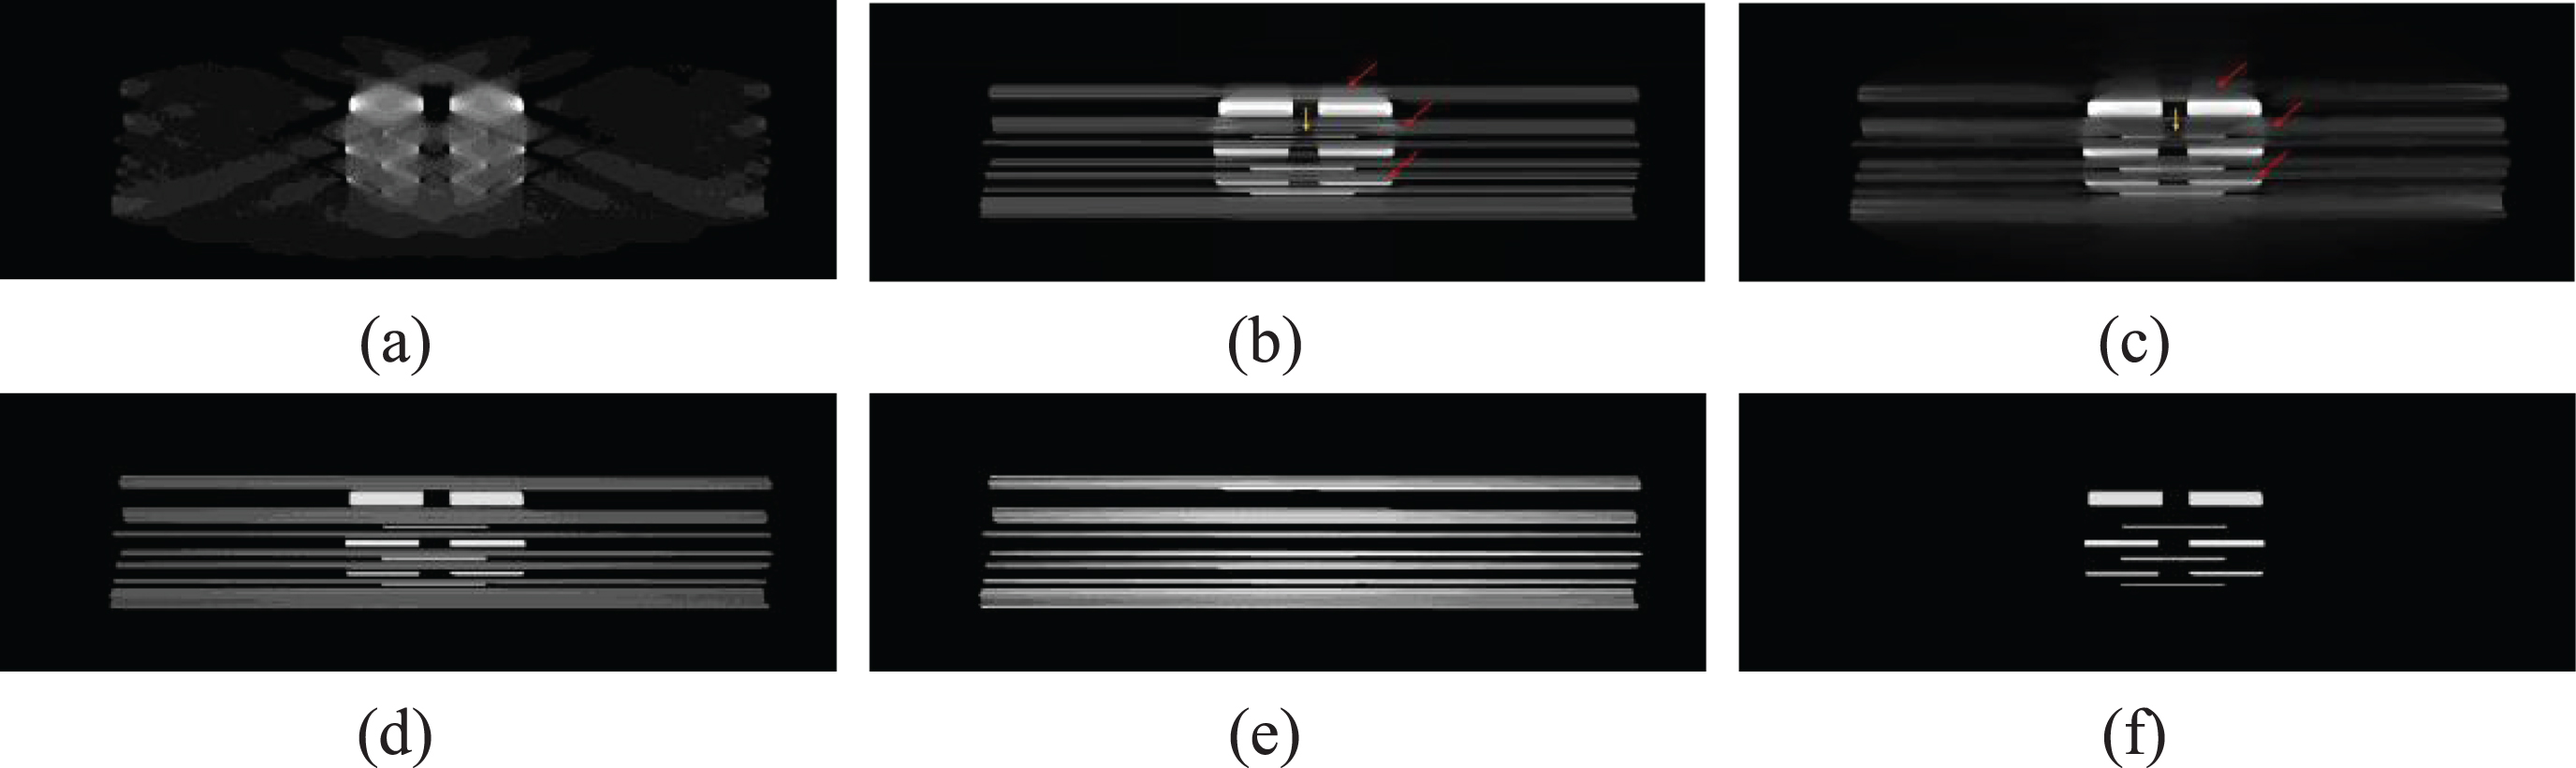
The reconstructed results from real data. (a) is the result of SART from 300kVp polychromatic projections after 10 iterations; (b) is the result of the AEDS algorithm from 300kVp polychromatic projections; (c) is the result of the DTV algorithm from 300kVp polychromatic projections; (d) is DS-AEDS algorithm’s synthesized 300keV monochromatic result. The display window of (a)-(d) is [0, 0.3]; the corresponding basis material images of (d) are (e) and (f); the display window of (e) is [[0.635, 1.365] and the display window of (f) is [0, 4.0].
From Fig. 12(a), we can see that the limited-angle artifacts and beam hardening artifacts are intertwined in the reconstructed results by SART. For AEDS and DTV, both of them recover the main structures of the sample as shown in Fig. 12(b) and (c). But the beam hardening artifacts indicated by the red arrow cannot be eliminated, and the thin iron sheet indicated by the yellow arrow is not accurately reconstructed. AEDS and DTV with other parameters either fail to remove limited-angle artifacts or introduce fake horizontal edges. From Fig. 12(d), (e) and (f), we can see that our proposed algorithm can effectively remove both hardening artifacts and limited-angle artifacts, and can accurately reconstruct thin iron sheets.
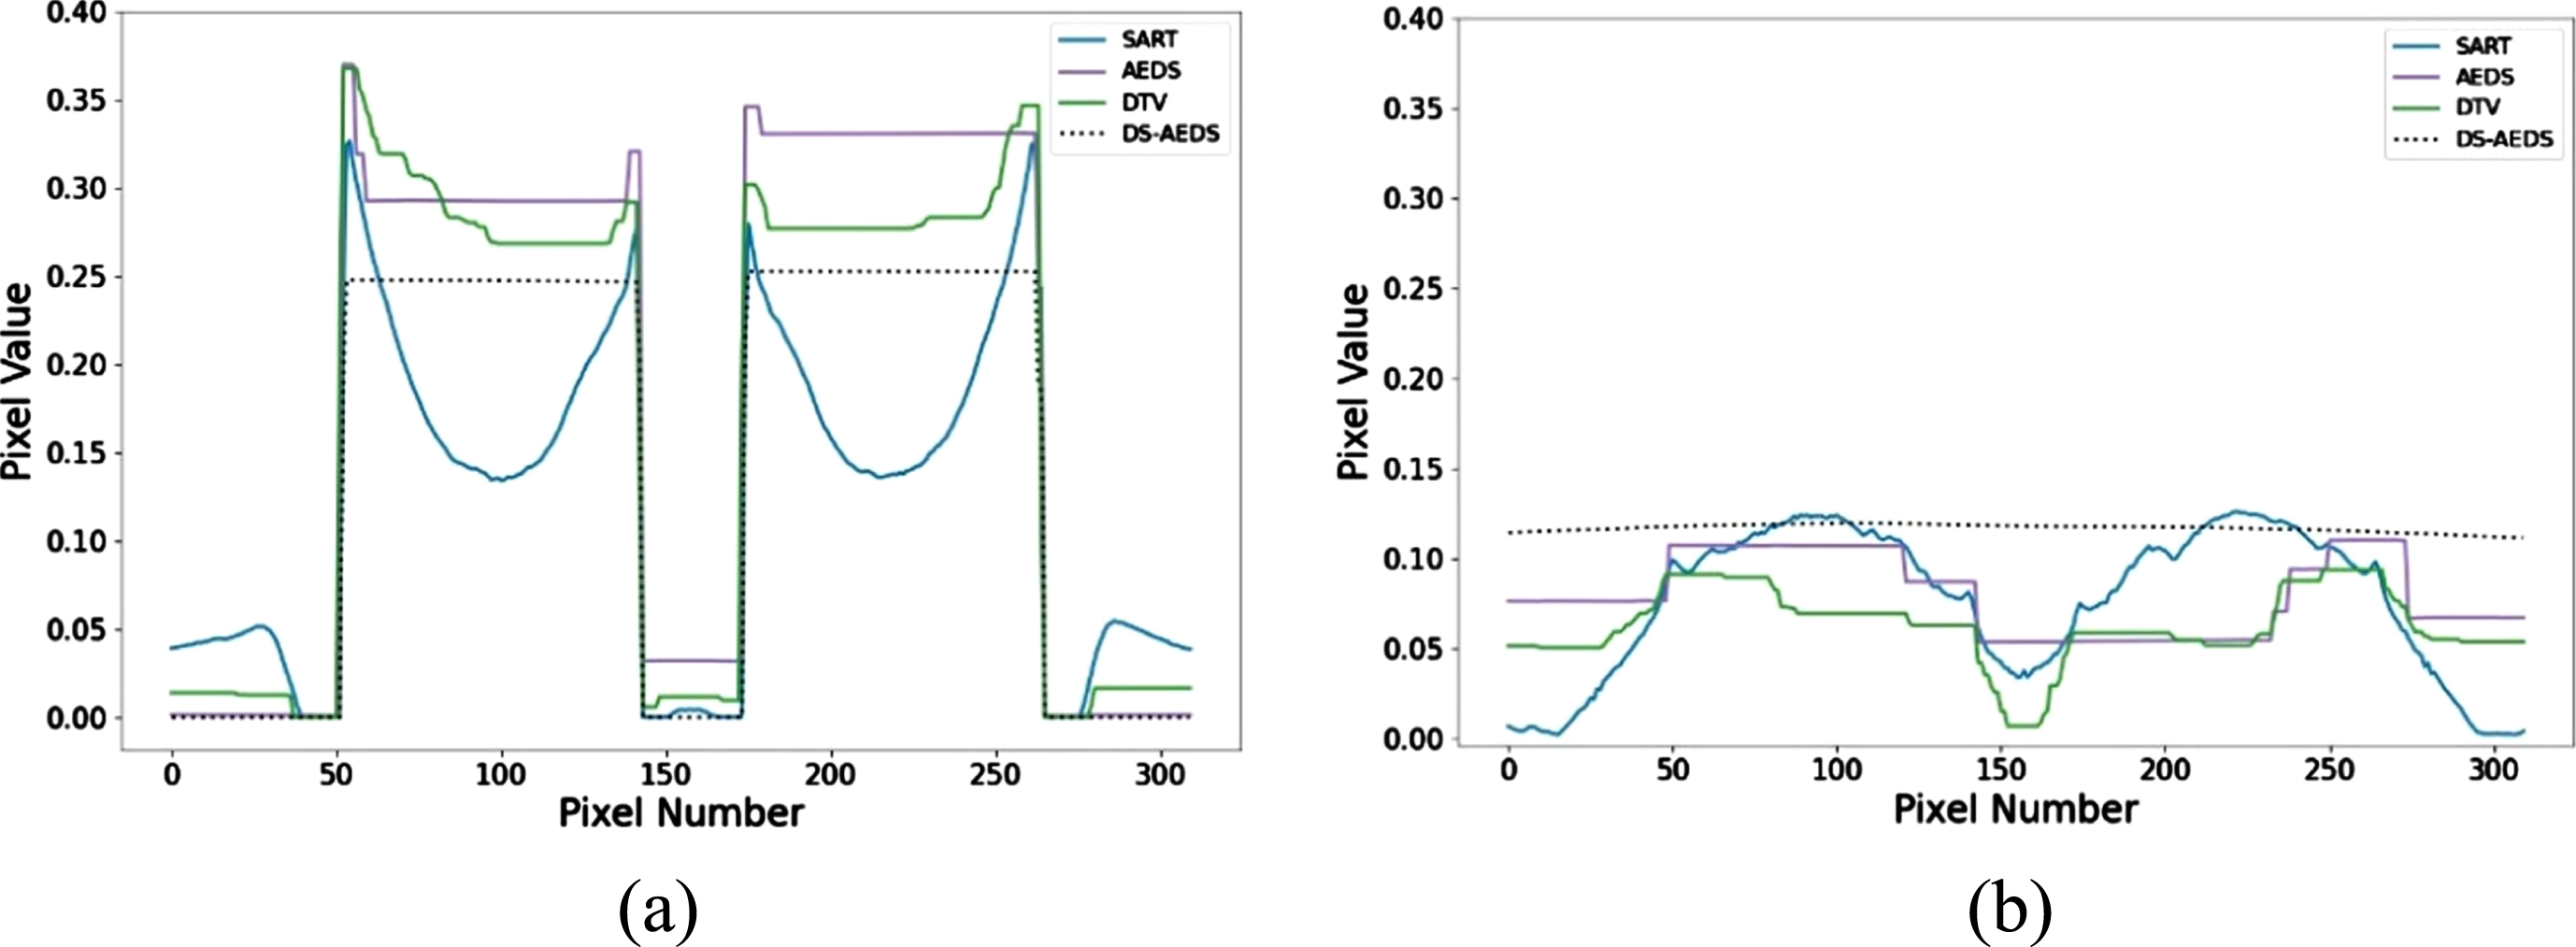
Figure 13 shows the profiles of the reconstruction results of different algorithms along the red lines in Fig. 11(a). From the profiles, a similar conclusion with the simulated experimental results can be drawn, i.e., the proposed method eliminated beam hardening artifacts very well, while other comparison methods failed to suppress beam hardening artifacts as the polychromatic property of X-rays is not considered.
This paper proposes the DS-AEDS model and algorithm for DSLACT imaging, which simultaneously suppresses limited-angle artifacts and beam hardening artifacts effectively. Preliminary experiments on simulated PCB data verify its validity. It is important to note that although only one PCB phantom’s reconstructed results are illustrated in this paper due to space limitation, multiple different PCB phantoms are tested and positive results are obtained.
In our model, a constraint
Footnotes
Acknowledgments
This work was supported by the National Natural Science Foundation of China under Grant 62271330, Grant 61971292, Grant 61871275, Grant 61827809, Grant 61771324; National Key Research and Development Program of China under Grant 2020YFA0712200; and Major Technologies R & D Program of Shenzhen (JSGGZD20220822095600001). The authors would like to thank Professor Peng Zhang and Professor Hongwei Li, for the instructions on constructive suggestions on the modification of the manuscript.