




Abstract
BACKGROUND:
Molecular breast imaging uses Tc-99 m sestamibi to obtain functional images of the breast. Determining the Tc-99 m sestamibi uptake in volumes of interest in the breast may be useful in assessing the response to neoadjuvant chemotherapy or for the purposes of breast cancer risk assessment.
PURPOSE:
To determine, using Monte Carlo simulation, if emission tomography can be used to quantify the uptake of Tc-99 m sestamibi in molecular breast imaging and if so, to determine the accuracy as a function of the number of projections used in the reconstruction process.
METHODS:
In this study, two voxelized breast models are implemented with different ratios of fibroglandular to fatty tissue and tumoral masses of varying dimensions. Monte Carlo simulation is used to calculate sets of projections, which assumes that each tumoral mass contains a given Tc-99 m activity. Projections are also calculated for a calibration phantom in order to correlate the known activity with the image pixel value. For each case, the total number of calculated projections is 36 and the reconstruction is carried out for 36, 18, 9, 7 and 5 projections, respectively, using an open source image reconstruction toolbox.
RESULTS:
Study data show that determination of Tc-99 m sestamibi uptake with and average error of 7% can be carried out with as little as 7 projections.
CONCLUSIONS:
Molecular breast emission tomography enables to accurately determine the Tc-99 m sestamibi tumoral mass uptake with the number of projections very close to the number of images currently acquired in clinical practice.
Introduction
Molecular breast imaging (MBI) is a nuclear medicine procedure that employs semiconductor detectors to obtain functional images of the radiotracer Tc-99 m sestamibi uptake by tumoral masses [1]. For the MBI study, typically 7 –10 mCi of the radiotracer are intravenously administered to the patient, and a craniocaudal (CC) and a mediolateral oblique (MBO) projections are obtained, each over a period of 7 –10 minutes, for each breast under light compression. The accumulation of the radiotracer in the tumoral masses is independent of the breast density and, therefore, MBI is particularly well suited for the examination of dense breasts, for which a conventional mammogram may yield an inconclusive result with regards to the presence of tumoral masses. Current commercial technology employs cadmium zinc telluride (CZT) detectors in an opposing dual-head configuration [2] and, therefore, for each projection two opposing views are obtained for a total of 4 images per MBI study for each breast examined. This type of detectors offers the advantage that scatter rejection based on energy discrimination can be carried out, thus enhancing the resultant images.
Because it has been proposed that the activity uptake by a tumoral mass may be useful to discriminate between benign and malign masses as well as in assessing treatment responses [3], several methods have been proposed to quantify uptake from the set of two projections that are routinely taken as part of an MBI study. The problem is challenging as both scatter and attenuation corrections must be calculated from a set of only two projections in order to determine the source strength. In addition, contribution to the signal from the activity uptake by the background tissue can be substantial. The scatter correction, to account for small-angle scattered photons that may pass through the collimator apertures along with the 140 keV photons emitted by the activity source, is usually performed with the dual energy window method [4] while the attenuation correction is calculated by assuming a known spatially independent attenuation coefficient and approximating the path traversed by the emitted radiation by a geometric mean [5]. As these methods deal with 2D images, assumptions must me made about the geometric shape of the tumoral masses and the methods do not generally work well when such masses are irregularly shaped.
Tomographic imaging, in the transmission or emission modalities, yields cross sectional views whose pixel values correlate with a given unique property of the point in the imaged object that they represent. Therefore, with an adequate calibration, the reconstructed images can be used to measure the spatial distribution of the property in question, this being the linear attenuation coefficient or, in the case of emission tomography, the strength of the activity source present in the imaged object. Several groups have attempted to quantify functional breast images using SPECT. In particular, Li et. al. used a dual x-ray/SPECT device to quantify both the lesion size and radiotracer uptake, achieving accuracies of 10% and 20% in each task respectively [6]. Perez et. al. used a dedicated SPECT system with non-traditional trajectories and with a previous calibration to quantify uptake, reporting accuracies in the order of 10% [3].
Following these ideas, the purpose of this work is to determine if an approach to the measurement of Tc-99 m sestamibi tumoral uptake based on few-projection emission tomography imaging is feasible, and if so, to determine its accuracy as a function of the number of projections used in the reconstruction process. The latter is relevant given that in principle, each projection requires from 7 to 10 minutes of data acquisition and therefore, in order for the technique to have clinical application, it must be able to use as few projections as possible in order not to have acquisition time significantly longer than what is needed in current MBI studies.
Materials and methods
Phantoms
A realistic mathematical breast phantom was used [7] in this work to develop two breast models with different tissue composition and different sizes. Among the main anatomical characteristics, the phantom contains the Cooper’s ligaments, breast lobule and extralobular duct, skin, blood vessels and fatty tissue. One of the models has been previously used by our group [8] and has a composition of 57% fatty tissue and 43% fibroglandular tissue. The total volume of this breast model is 260.18 cm3. This phantom will be referred to as the medium-density phantom. The second model, which will be referred to as the high-density phantom, has a composition of 15% fatty tissue and 85% fibroglandular tissue and has a total volume of 337.61 cm3. In each phantom, two irregularly shaped spiculated tumoral masses were digitally added, with volumes ranging from 0.12 cm3 to 1.47 cm3. Both phantoms were developed with a resolution of 500μm. Among the materials included in the simulations were glandular tissue, adipose tissue, connective tissue (Cooper ligaments), soft tissue, blood, CsI, and tungsten for the detector and collimator. The atomic composition for each of the materials present was taken from the literature [9]. Figure 1 shows volumetric views of both phantoms, with the spiculated masses and Cooper ligaments clearly visible on the right side of the panel. The calibration phantom is a water cylinder 9 cm in diameter and 4 cm in length with eight 1 cm diameter spherical vials embedded in it, each with a different level of Tc-99 m activity, these being: 1, 5, 10, 25, 50, 100, 125 and 150μCi, assumed to be in a water-like solution. Considering the vial volume, these activities correspond to concentrations in the range of 2 to 286μCi/cm3.

Volumetric views of the medium (upper panel) and high-density phantoms. The spiculated masses and Cooper ligaments are visible.
Reported Tc-99 m sestamibi uptake concentration values in tumoral mass and background tissue vary significantly, with ratios between tumors and background in the range from of 10:1 up to 40:1 [10]. Absolute uptake measurements were carried out by Li et al. [6], as mentioned above, using a breast imaging device combining both x-ray and SPECT tomography. They reported background uptake in the order of 2μCi/cm3 and lesion-to-background ratios in the order of 12. Considering that ratios of up to 40:1 have been reported, one could argue that tumoral mass uptakes of at least 80μCi/cm3 are in principle feasible. Therefore, in order to test the accuracy method under a variety of scenarios, we chose the following concentrations in the tumor masses and background: in the medium density phantom, a test case with concentrations of 50 and 25μCi/cm3 in the tumoral masses and 2.5μCi/cm3 in the background was modeled, to evaluate the method at low concentration ratios; a second testcase with concentrations of 150 and 40μCi/cm3 in the masses and 5.0μCi/cm3 in the background was modeled in order to test both high, 30:1, and low, 8:1, concentrations ratios.
This test case was designed to evaluate the effect of relatively high background concentrations. In the high-density phantom, a test case with 40 and 20μCi/cm3 in the tumoral masses and 2μCi/cm3 in the background was modeled and a second case with 50μCi/cm3 and 125μCi/cm3 in the tumoral masses and 3.3μCi/cm3 in the background was also tested, so that both the low and high-end of observed concentration ratios were evaluated as well. While concentrations above 100μCi/cm3 may seem excessive, they were included in order to assess the robustness of the method against the noise inherent to lower activity measurements. We believe that based on the concentration ratios modeled, results for other uptakes could be extrapolated from our simulations, provided that adjustments are made to the acquisition time in order to obtain on average the same image noise.
Detector and collimator modeling
MBI is currently carried out with commercially available equipment that makes use of cadmium zinc telluride (CZT) detectors in a dual-head configuration [2]. This type of detector allows for the implementation of energy-based scatter correction as mentioned above. However, in this work, we chose to carry out or modeling by assuming that the detector is based on more traditional CsI crystals such as those found in conventional mammographic detectors. No energy discrimination is assumed to be taking place, as such, the scatter removal ability rests solely on the geometric design of the collimator coupled to the detector, which in our case was assumed to consist of a tungsten block with a thickness of 5 cm on which 2 mm×2 mm holes have been machined interspaced from each other by another 2 mm. From a geometric perspective, this collimator is equivalent to a 2.5 cm thick collimator with 1 mm×1 mm apertures, but which would require 4 times the number of surfaces to be defined with the geometric packages implemented in the Monte Carlo code to be described below, thus increasing the computer memory requirement and decreasing the speed of the simulation.
The lateral dimensions of both the detector and collimator were modeled as 20 cm×20 cm, and the whole detector-collimator assembly is positioned 3 cm away from the breast phantom at every angular position. No breast compression is assumed to occur. If the proposed method is implemented with CZT detectors and the ability to correct for scatter based on energy discrimination is available, the accuracy is only bound to improve. For each projection, two simulations were run with the collimator laterally displaced by 2 mm from each other, in order to obtain images without the collimator pattern visible on them. Note also that both the scatter generated in the collimator as well as the random nature of the photon interaction with the detector active layer are therefore being considered in our work.
Monte Carlo code, simulations details and normalization
The Monte Carlo code PENELOPE [11] with the auxiliary set of subroutines from the PenEasy suite [12] were used in all the simulations performed in this work. As it is not practical to implement a separate geometry file for each of the projections simulated, in this work the following simulation logistic was adopted: the detector is fixed as shown in Fig. 2 and for each angular projection, the emitted radiation is stopped at the rotation surface shown and then both its position and direction cosines are rotated an angle Δθ = θ - θo, with θ being the current projection angle, 0° for the illustration in Fig. 2, and θo being the angle of the real detector, 270° always as shown in the figure. Once the rotation is performed, the particle is allowed to move in its new direction of flight. Several subroutines were incorporated into the PenEasy suite to carry out these transport mechanics. In all our simulations both photon and electron cutoff energies were set at 10 keV and, following the recommendations of the code developers, transport parameters C1 and C2 were both set at 0.1.

Mechanics of the Monte Carlo simulation of the MBI projections. Particles reaching the rotation surface are rotated an angle equal to the difference between the real detector angle, 270° always, and the angle of the current projection.
All the interaction cross sections used in the simulations are from the standard PENELOPE implementation used in this work. Because radioactive emission is a time-dependent process and therefore the total signal detected is a function of the acquisition time, we need to normalize the dose matrices not in terms of the number of histories simulated, as is typically done by PENELOPE and most other Monte Carlo codes, but in units of time. For this end, the number of histories used in each of the simulations presented was chosen such that a total of 100 s of data acquisition are modeled. For example, if a total activity of 100μCi is present in a given simulation and 150μCi in another, the total number of histories used to calculate the detector dose matrices would respectively be 3.7E+08 and 5.55E+08 histories for each projection. The results presented are not dependent on the 100 s time interval chosen for the simulations, provided that the signal from both the calibration curve and phantom simulations are obtained under the same time interval. For each uptake distribution, the absorbed dose to the breast was calculated.
The Michigan Image Reconstruction Toolbox (MIRT) [13] was used in this work to process the absorbed dose matrices that for each projection were calculated with PENELOPE. More specifically, we used the Emission Maximum Likelihood Expectation Maximization (EML-EM) algorithm as implemented in the MIRT distribution developed for MATLAB (The MathWorks, Inc. Natick, Massachusetts). In the EML-EM algorithm, if y(j) represents the set of collected data for j = 1, . . . , J detectors, x(i) is the radiation emission from source i, and a(i,j) gives the probability that emission from i reaches detector element j, then assuming that the measurement is a Poison process with expectation
The solution for x(i) is found iteratively from Equation (2):
In this work, 20 iterations were used in the solution process, with an initial image estimate of unit uniform emission. Each reconstruction consists of 120 slices 1 mm thick (the pixel size in the modeled detector) and 512×512 pixels with a field of view of 12 cm in diameter. The voxel size in each reconstruction is therefore 1.0×0.23×0.23 mm3. Reconstruction was carried out for 36, 18, 9, 7 and 5 projections for all the cases presented, except for the calibration, where only one reconstruction with 36 projections was obtained, as in this case trying to minimize the number of projections in order to reduce data acquisition times is not of relevance. Using more than 36 projections did not improve the accuracy of the uptake determination although the visual quality of the images was indeed better with respect to the 36 or less projections reconstruction. A MATLAB script for manipulating of the dose matrices as yielded by PENELOPE, feeding them to the MIRT in the proper format and analyzing the resultant images was implemented.
In order to analyze the reconstructed images, box-shaped volumes of interest (VOI) around the vials or tumoral masses were provided by the user, from which the total signal was integrated and, in the case of the calibration curve, plotted against the activity. As we do not know beforehand the signal values in a given image, an automatic threshold was defined to separate the vial or mass signal from background in each VOI as follows: first in each VOI box, the total signal is integrated and averaged with respect to the number of pixels; subsequently the signal at each image pixel within the VOI is compared against the average scaled by a factor to be described below. If this pixel value is greater than the scaled average signal, the pixel belongs to a tumoral mass and therefore its value is treated as such. In this work, the scaling factor was determined by using a VOI box of size such that it encompassed all the tumoral masses present in our phantoms and using the known activity uptake in the calibration image, with added background. The scaling factor thus obtained was 1.67 and it remained the same for all the image analysis to be shown, regardless of the phantom, absolute uptake or uptake ratio modeled. This method eliminates the variations that are bound to occur when the tumoral mass is manually contoured, which are particularly severe for irregularly shaped masses such as the ones modeled in this work. Although in this work we only used one VOI box, we believe that in a potential application of the proposed method, VOI boxes of different sizes could be used, each of which would have a scaling factor determined from a calibration image as was done in this work.
Calibration curve
The left panel of Fig. 3 shows a reconstructed cross-sectional view of the calibration phantom used to obtain the calibration curve. The total activity in the calibration phantom is distributed among the eight vials. The right panel shows the resultant calibration curve using the sum of the pixel values inside each VOI enclosing the activity vials. This calibration curve was used to convert pixel values integrated over a certain VOI into activity uptake in all the simulated tomographic reconstructions that follow.
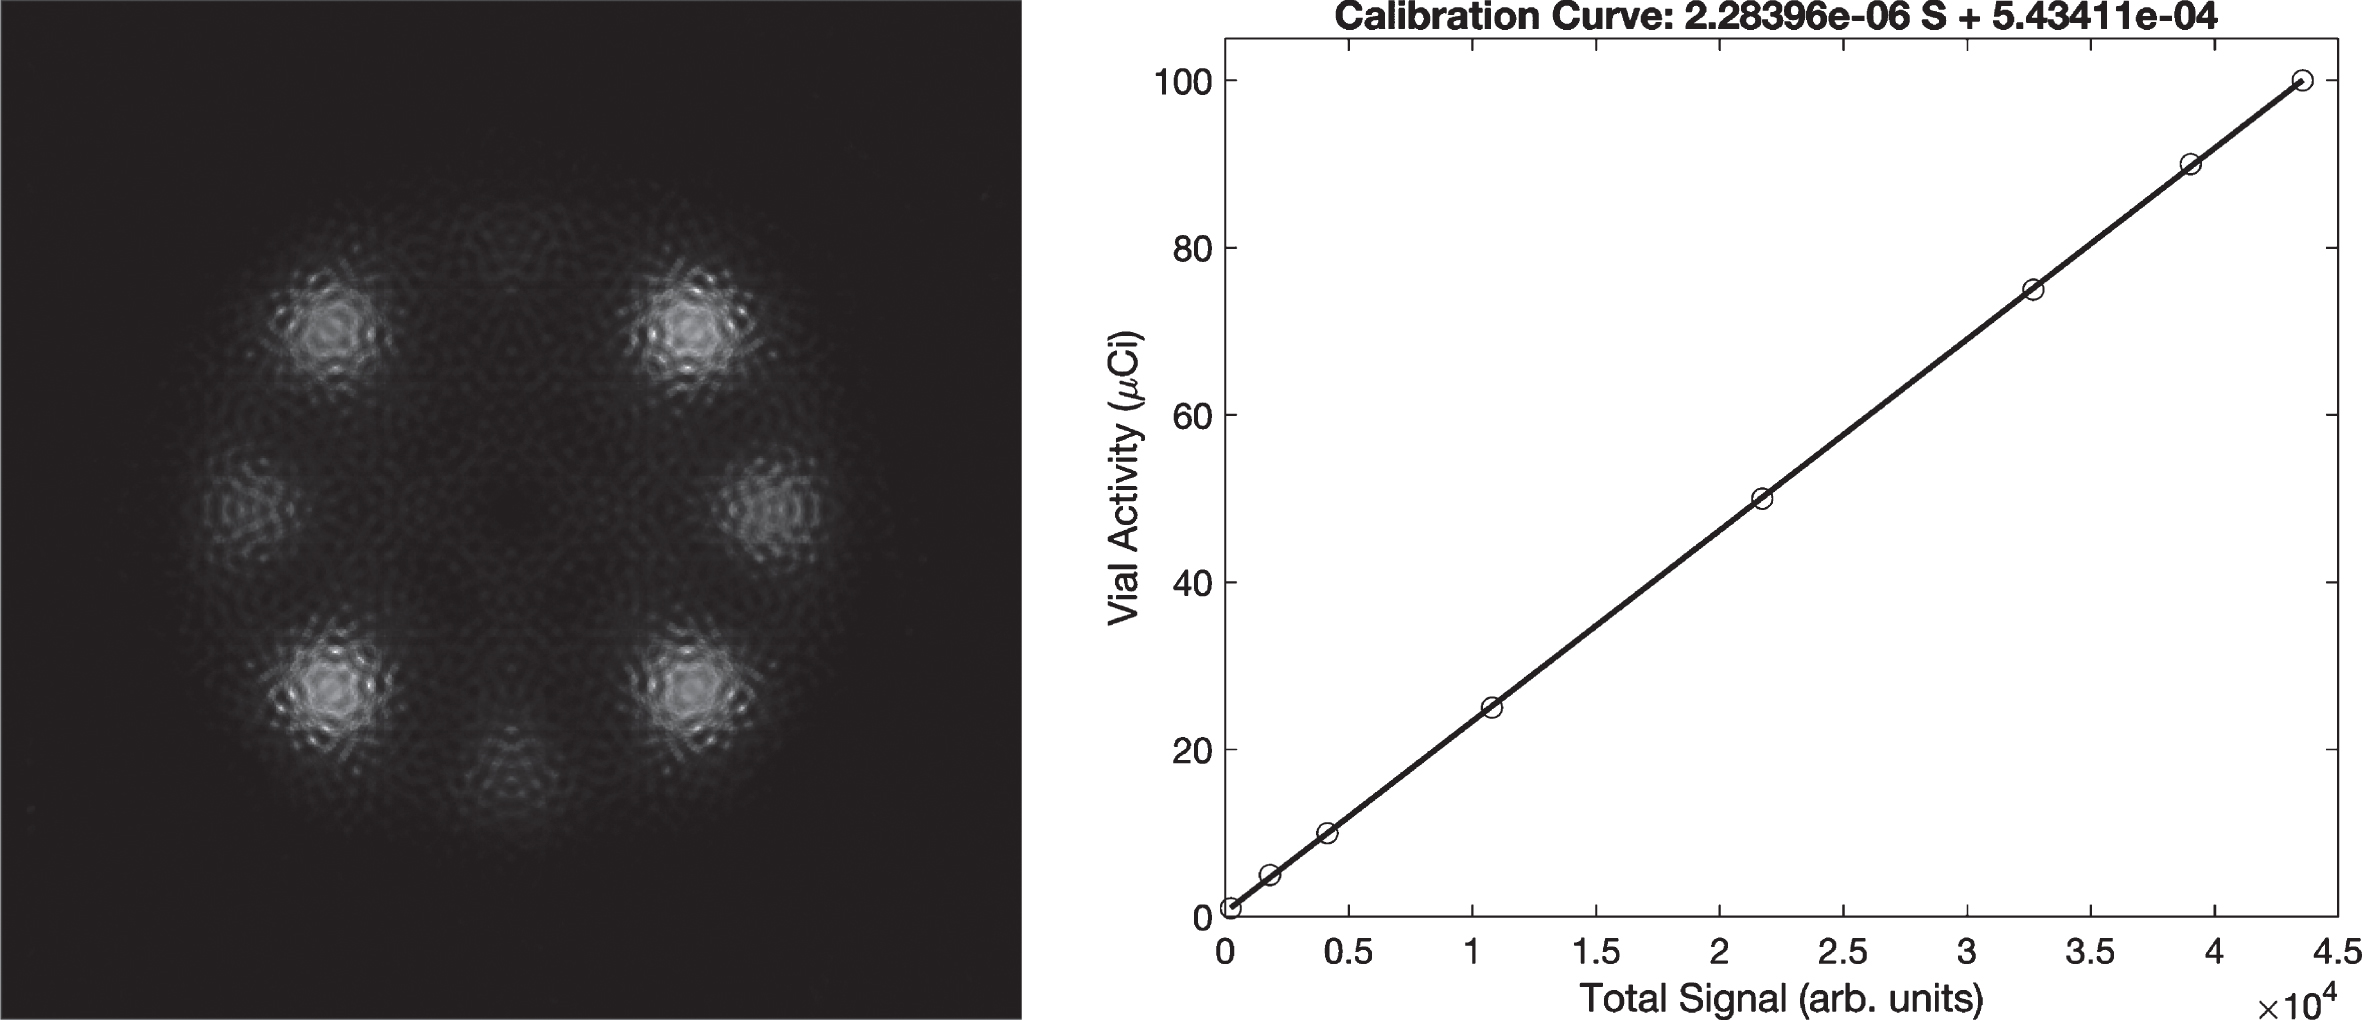
Left panel: reconstructed cross-sectional view of the calibration phantom. The activities in the vials range from 2 to 286μCi/cm3. Right panel: calibration curve for total signal vs. activity obtained from the analysis of the images on the left.
The left panel of Fig. 4 shows a series of projections of the medium-density phantom as calculated by PENELOPE for the concentrations of 150, 40 and 3.3μCi/cm3 in the two tumoral masses and background respectively, while the right panel shows several reconstructed slices for this same phantom and concentrations. Similar visual appearance results for the other set of concentrations modeled for this phantom. Figure 5 shows a cross-sectional view as a function of the total number of projections used by the reconstruction algorithm, with the same cross-sectional view being displayed in all these images. The concentrations in this case are 150, 40 and 3.3μCi/cm3 in the two tumoral masses and background respectively resulting in uptakes in the tumoral masses of 17.68 and 11.83μCi. Again, similar visual appearance resulted for the other uptake distribution modeled. Streaks due to the presence of the activity sources in the tumoral masses are clearly visible when 18 or less projections are used to reconstruct the image, but it is worth keeping in mind that the purpose of the present method is to quantify the tumoral mass uptake and not to qualitatively asses the characteristics of the resultant images.
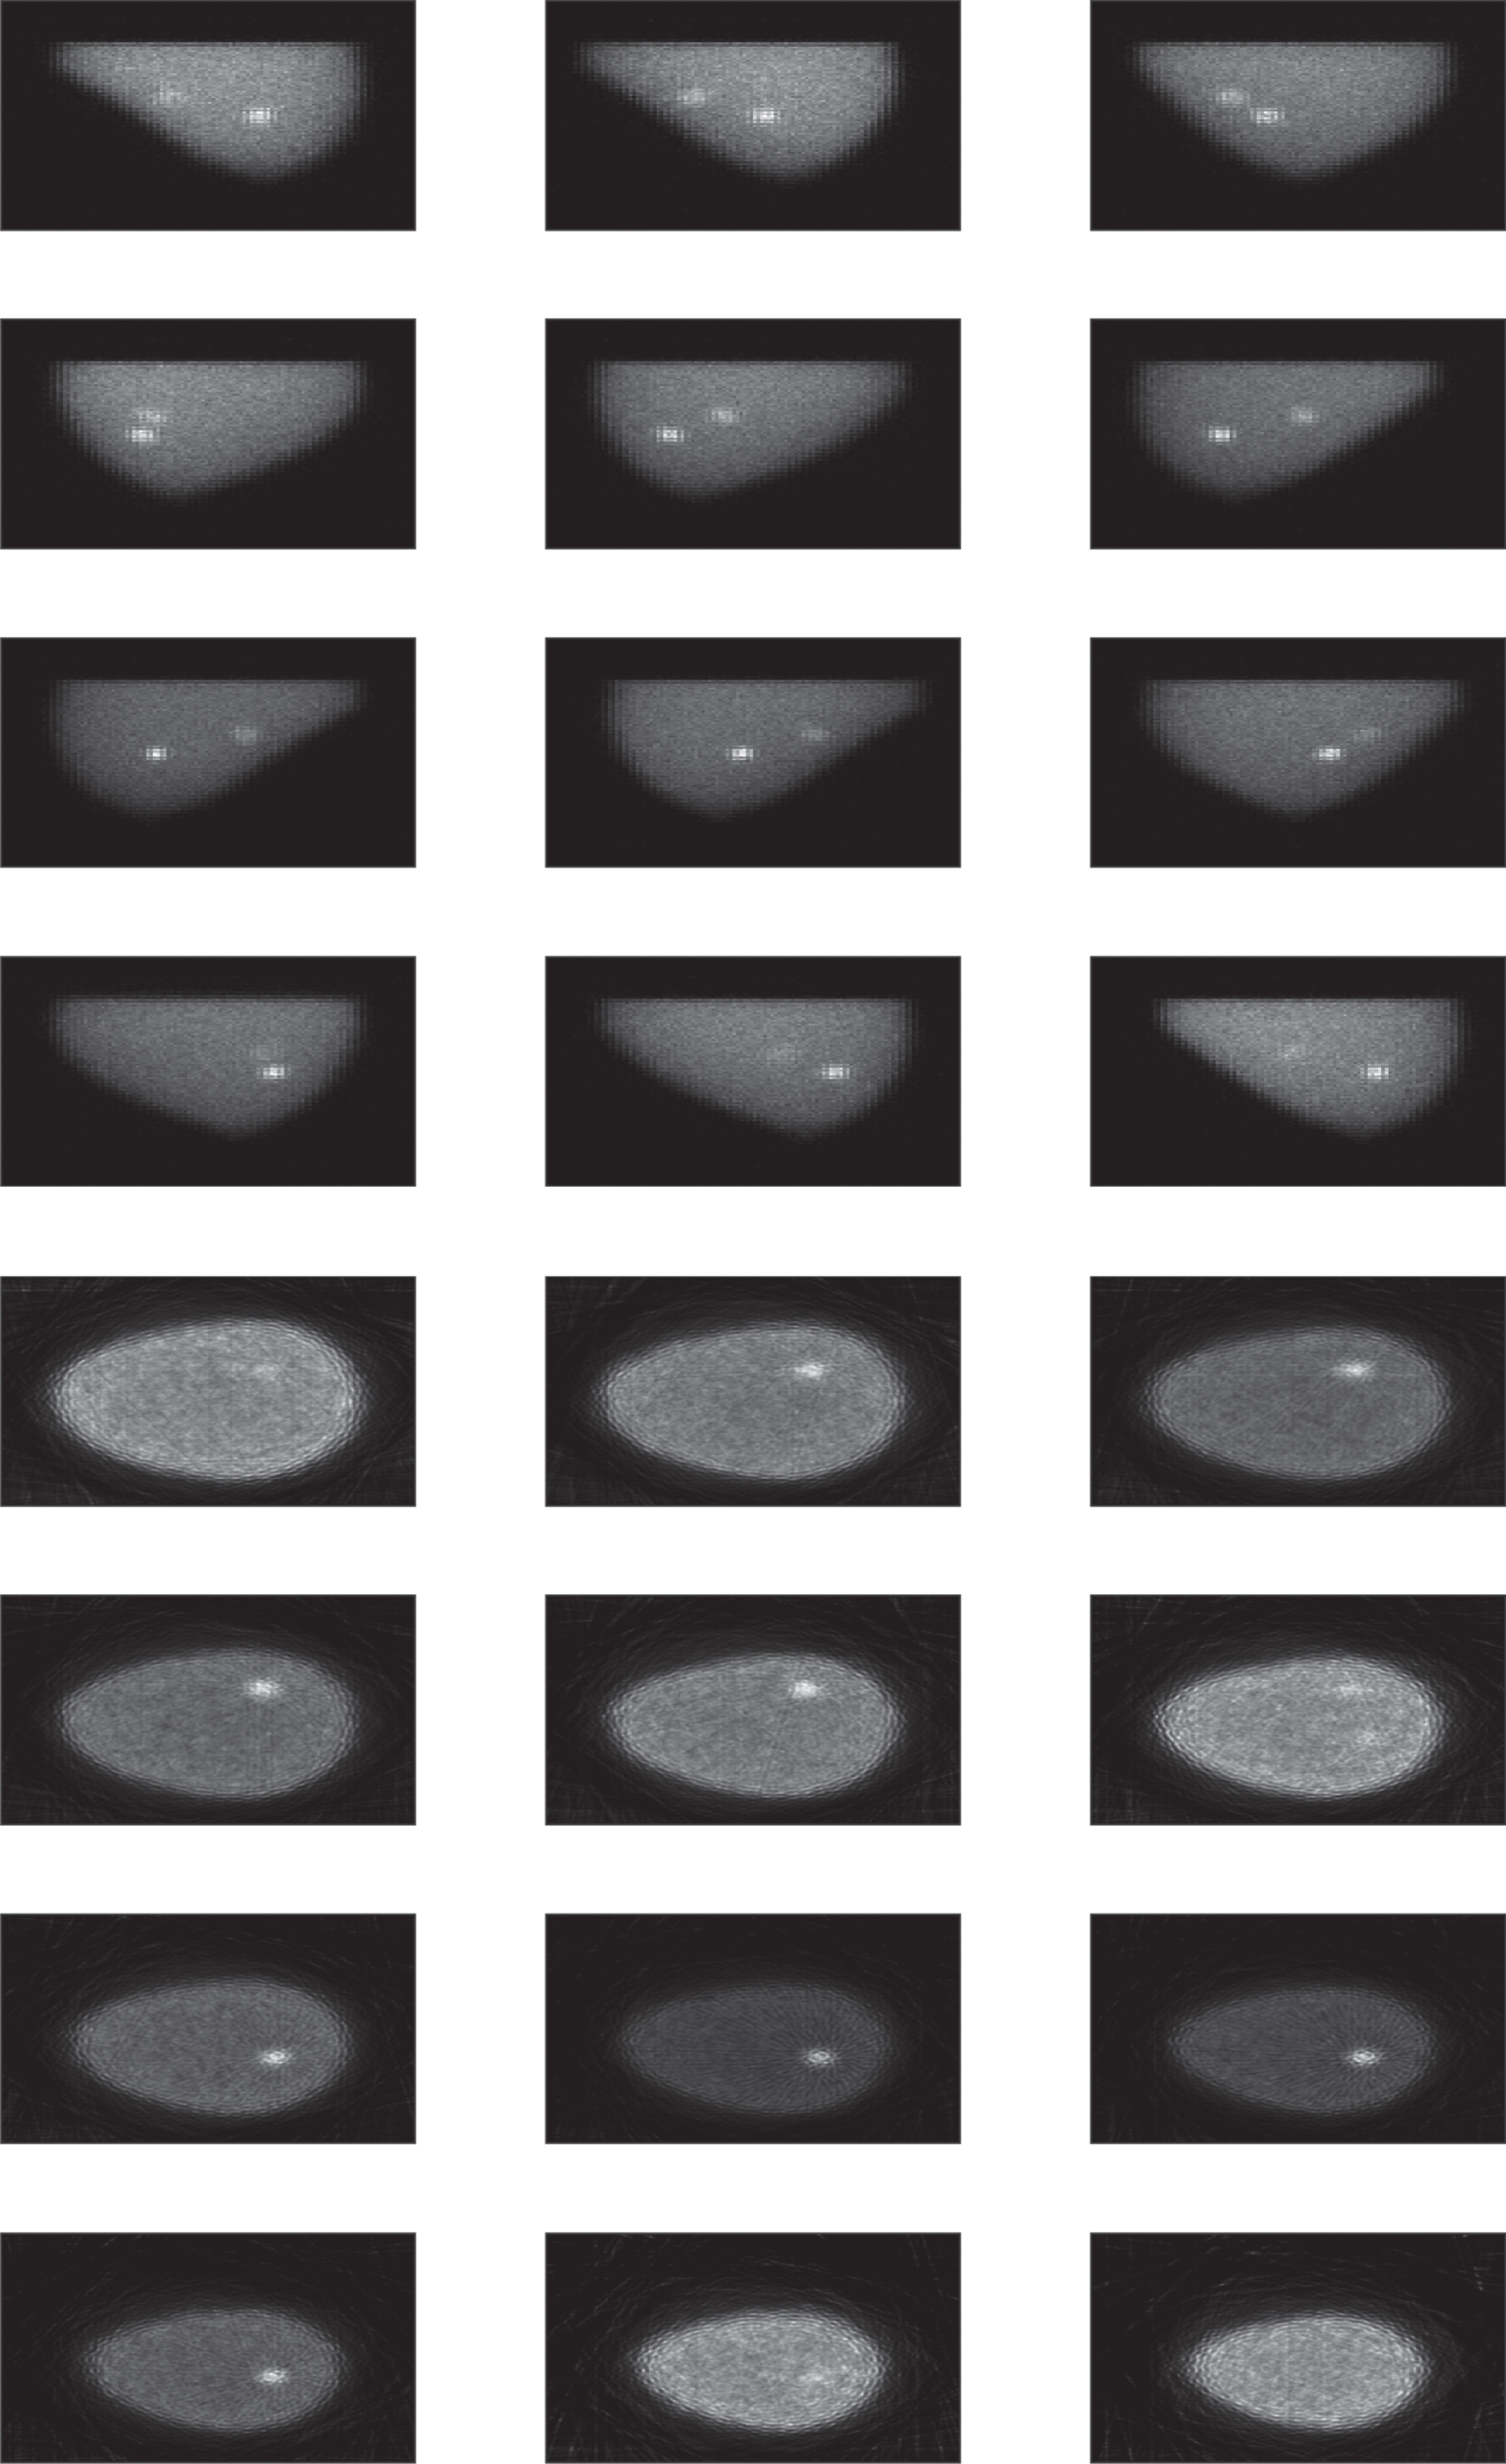
Upper panel: projection views of the medium-density phantom from different angular positions; lower panel: reconstructed slices. The activity concentrations are 150 and 40μCi/cm3 in the tumoral masses and 5μCi/cm3 in the background.
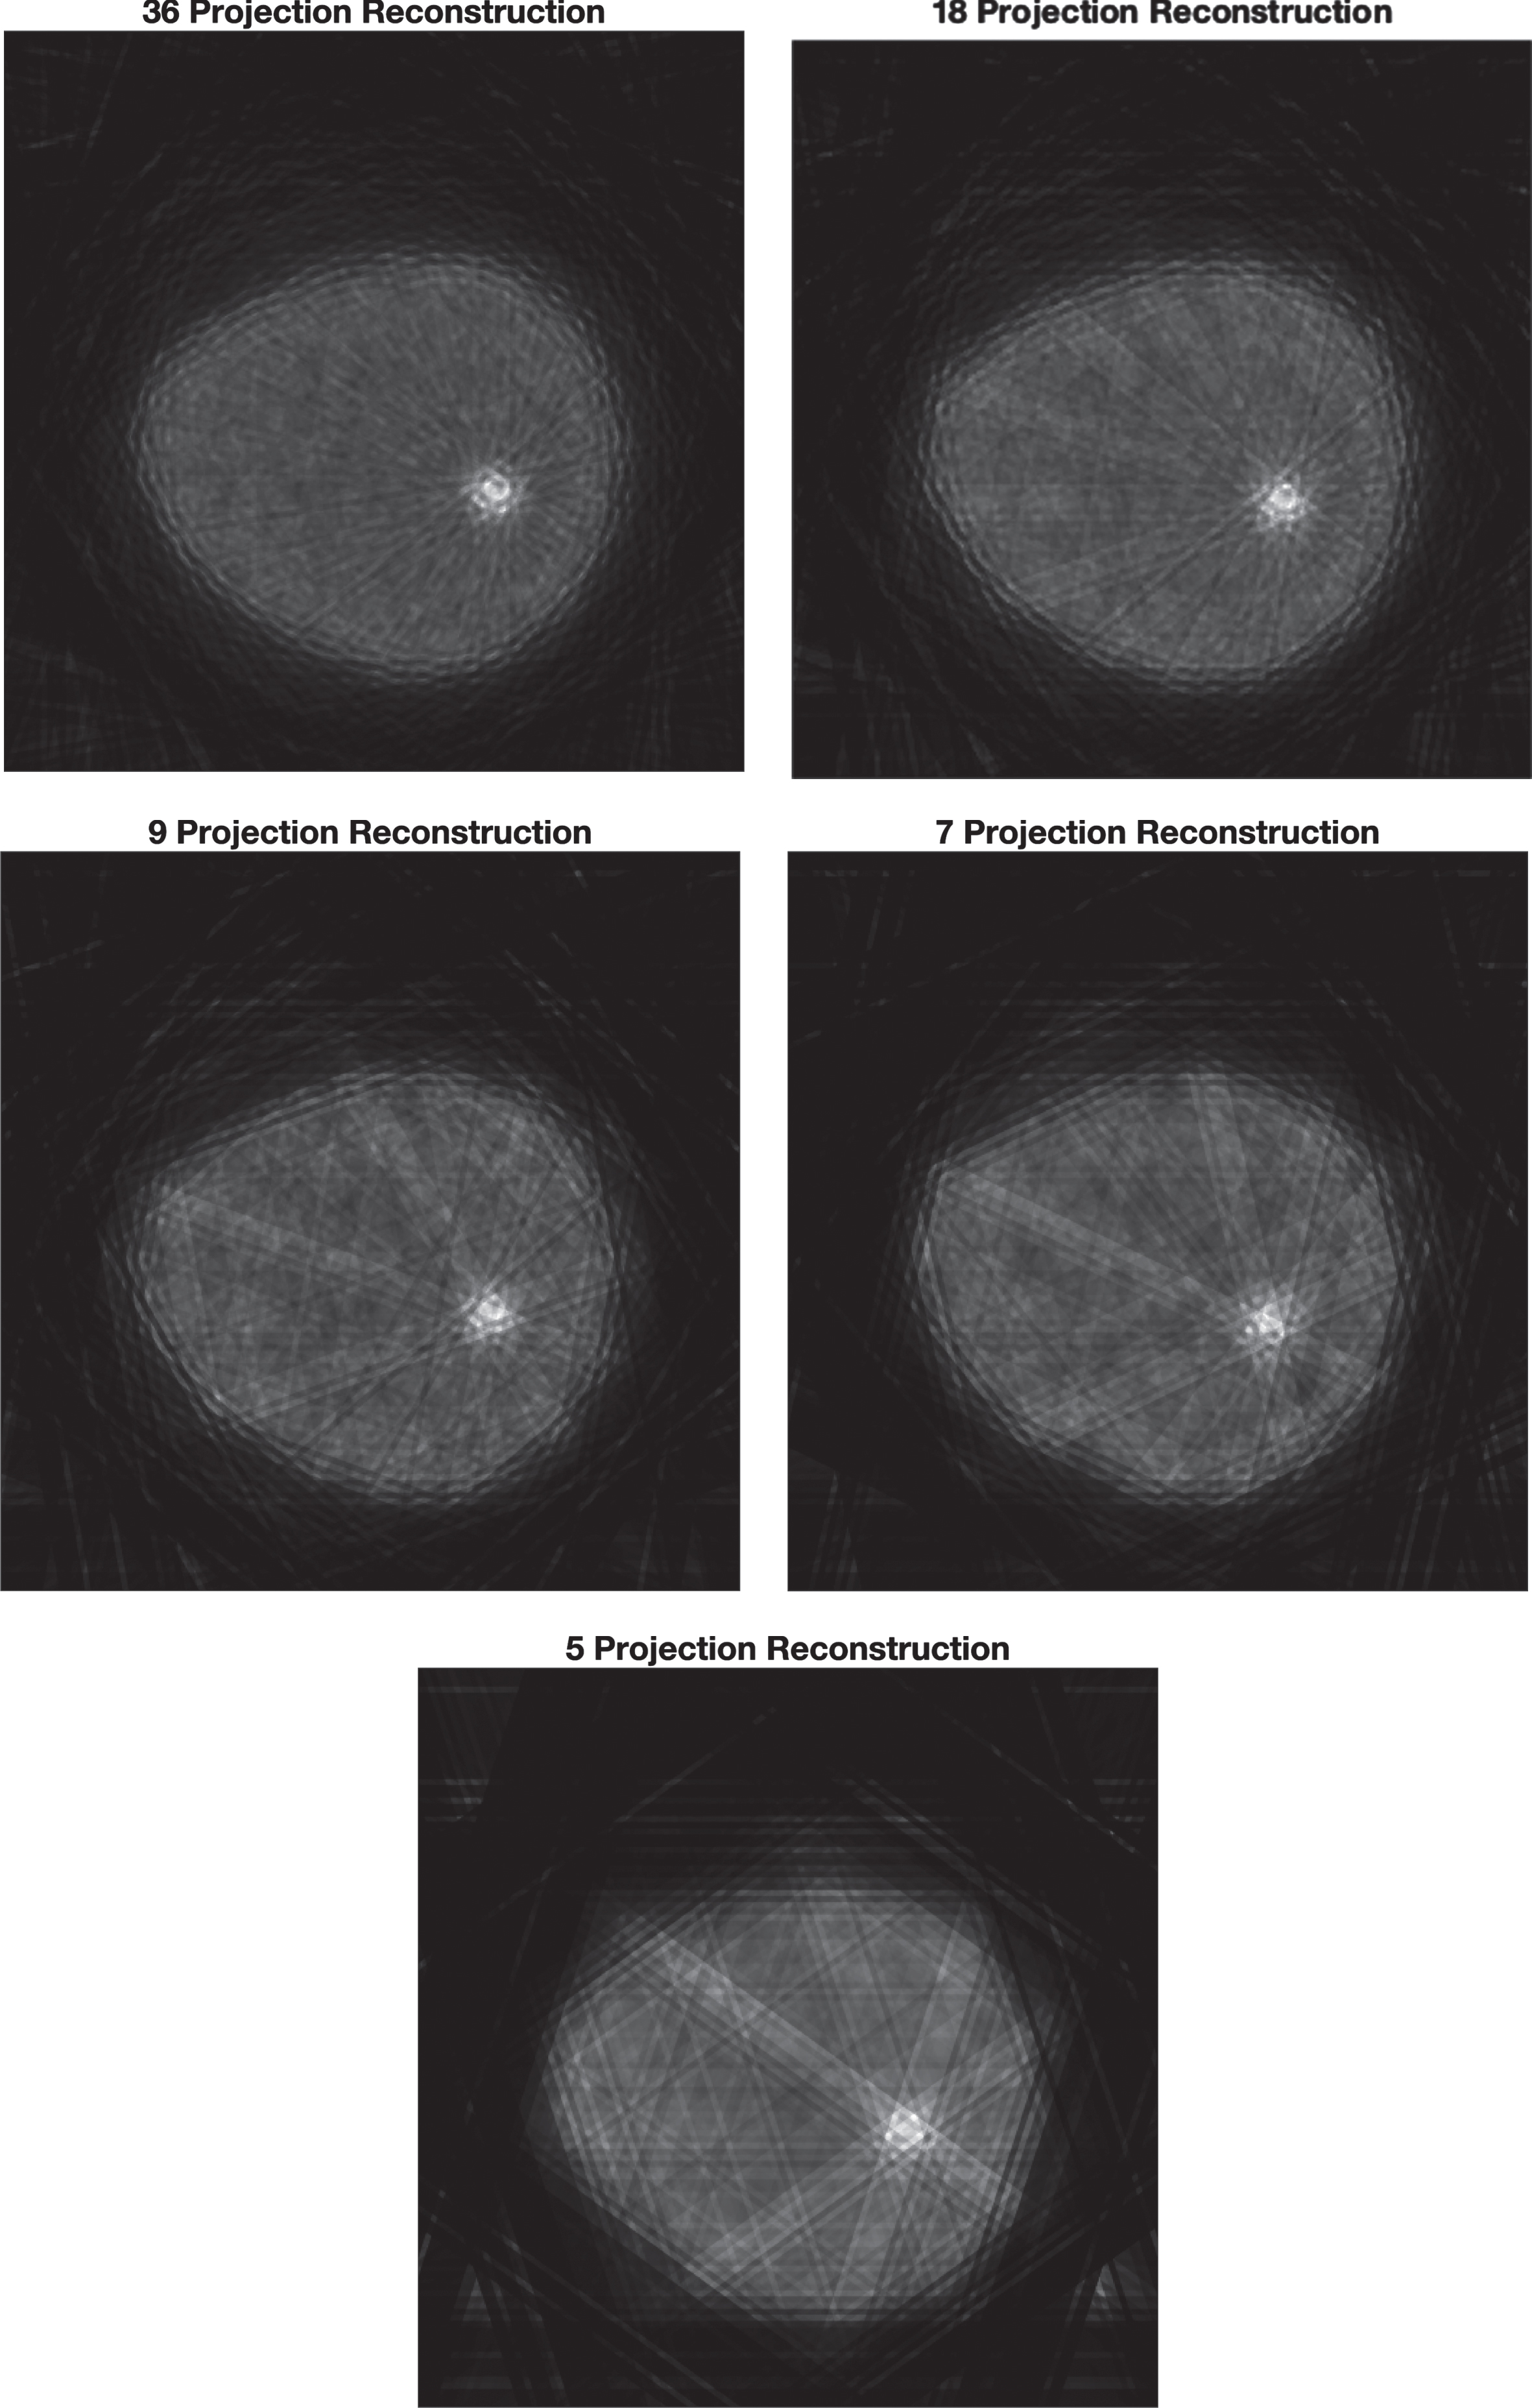
Cross-sectional view of the same slice as a function of the number of projections used in the reconstruction, for medium-density phantom with concentrations of 150, 40 and 5μCi/cm3 in the two tumoral masses and background respectively.
In this regard, Table 1 shows the total activity uptake in each mass as a function of the number of projections for the two configurations of activity distribution modeled for this phantom, obtained with the calibration curve shown in Fig. 3. For concentration ratios of 10:1 or more, fom 7 up to 36 projections, the uptake can be determined to well within 10% of the true activity uptake, regardless of the particular magnitude of such an uptake. However, for concentration ratios below 10:1, errors greater than 10% can be seen regardless of the number of projections used to reconstruct the images.
Activity uptake in μCi as determined using the calibration curve and total signal integrated in the VOI for each mass, as a function of the number of projections, in the medium-density phantom
Figure 6 shows a set of projections and reconstruction slices of the high-density phantom for the test case with 40 and 20μCi/cm3 in the tumoral masses and a background concentration of 2μCi/cm3. Figure 7 shows a cross-sectional view of this phantom as a function of the total number of projections used to reconstruct the images, for the same reconstructed slice. The activity concentration in this case is 30 and 20μCi/cm3 in the tumoral masses with a 2μCi/cm3 uniformly distributed in the background. A similar visual appearance resulted for the other uptake distribution modeled. Streak artifacts can be observed for the reconstruction with less than 18 projections. Table 2 shows the measured uptake obtained through the application of the calibration curve shown in Fig. 3, for both uptake configurations simulated for this high-density phantom. As can be seen from the table, again, from 7 up to 36 projections the uptake can be determined to within 10% of the real uptake value but for the 5-projection reconstruction the error can reach up to 20%.
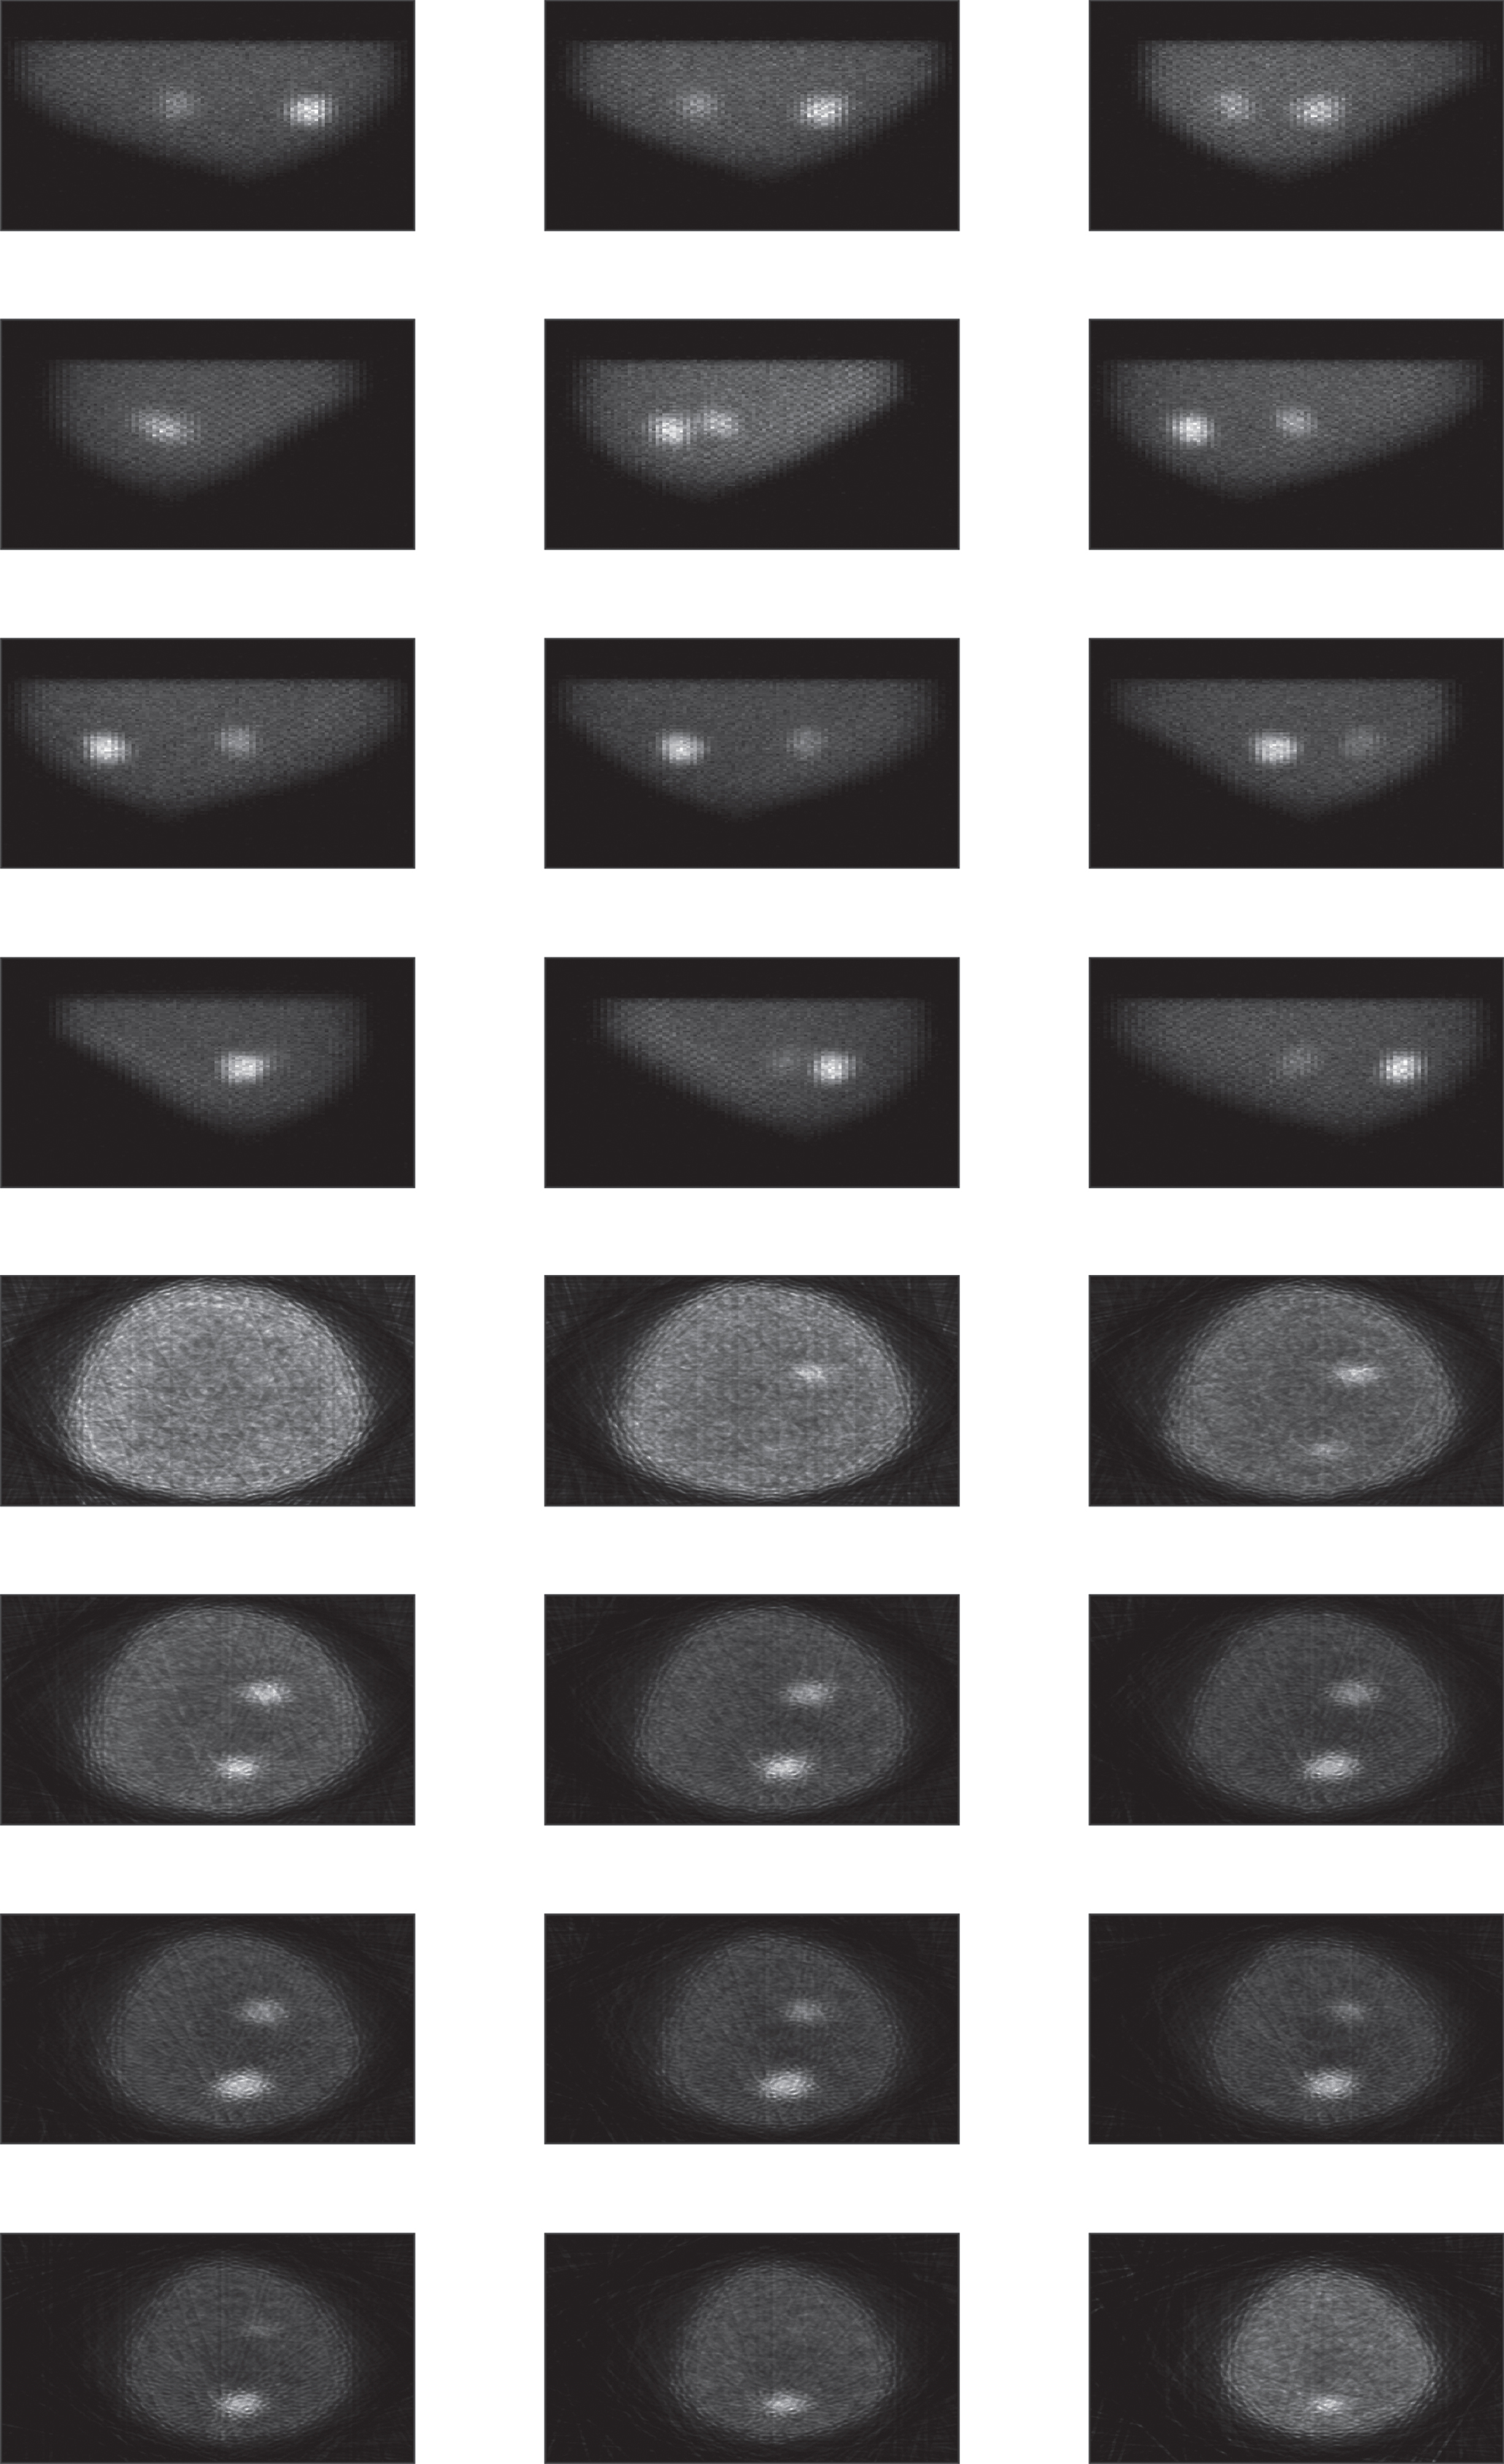
Upper panel: projection views of the high-density phantom at twelve different angles for the concentrations of 40, 20 and 2μCi/cm3 in the two tumoral masses and background respectively. Right panel: reconstruction slices at different position along the breast obtained for the same concentrations.
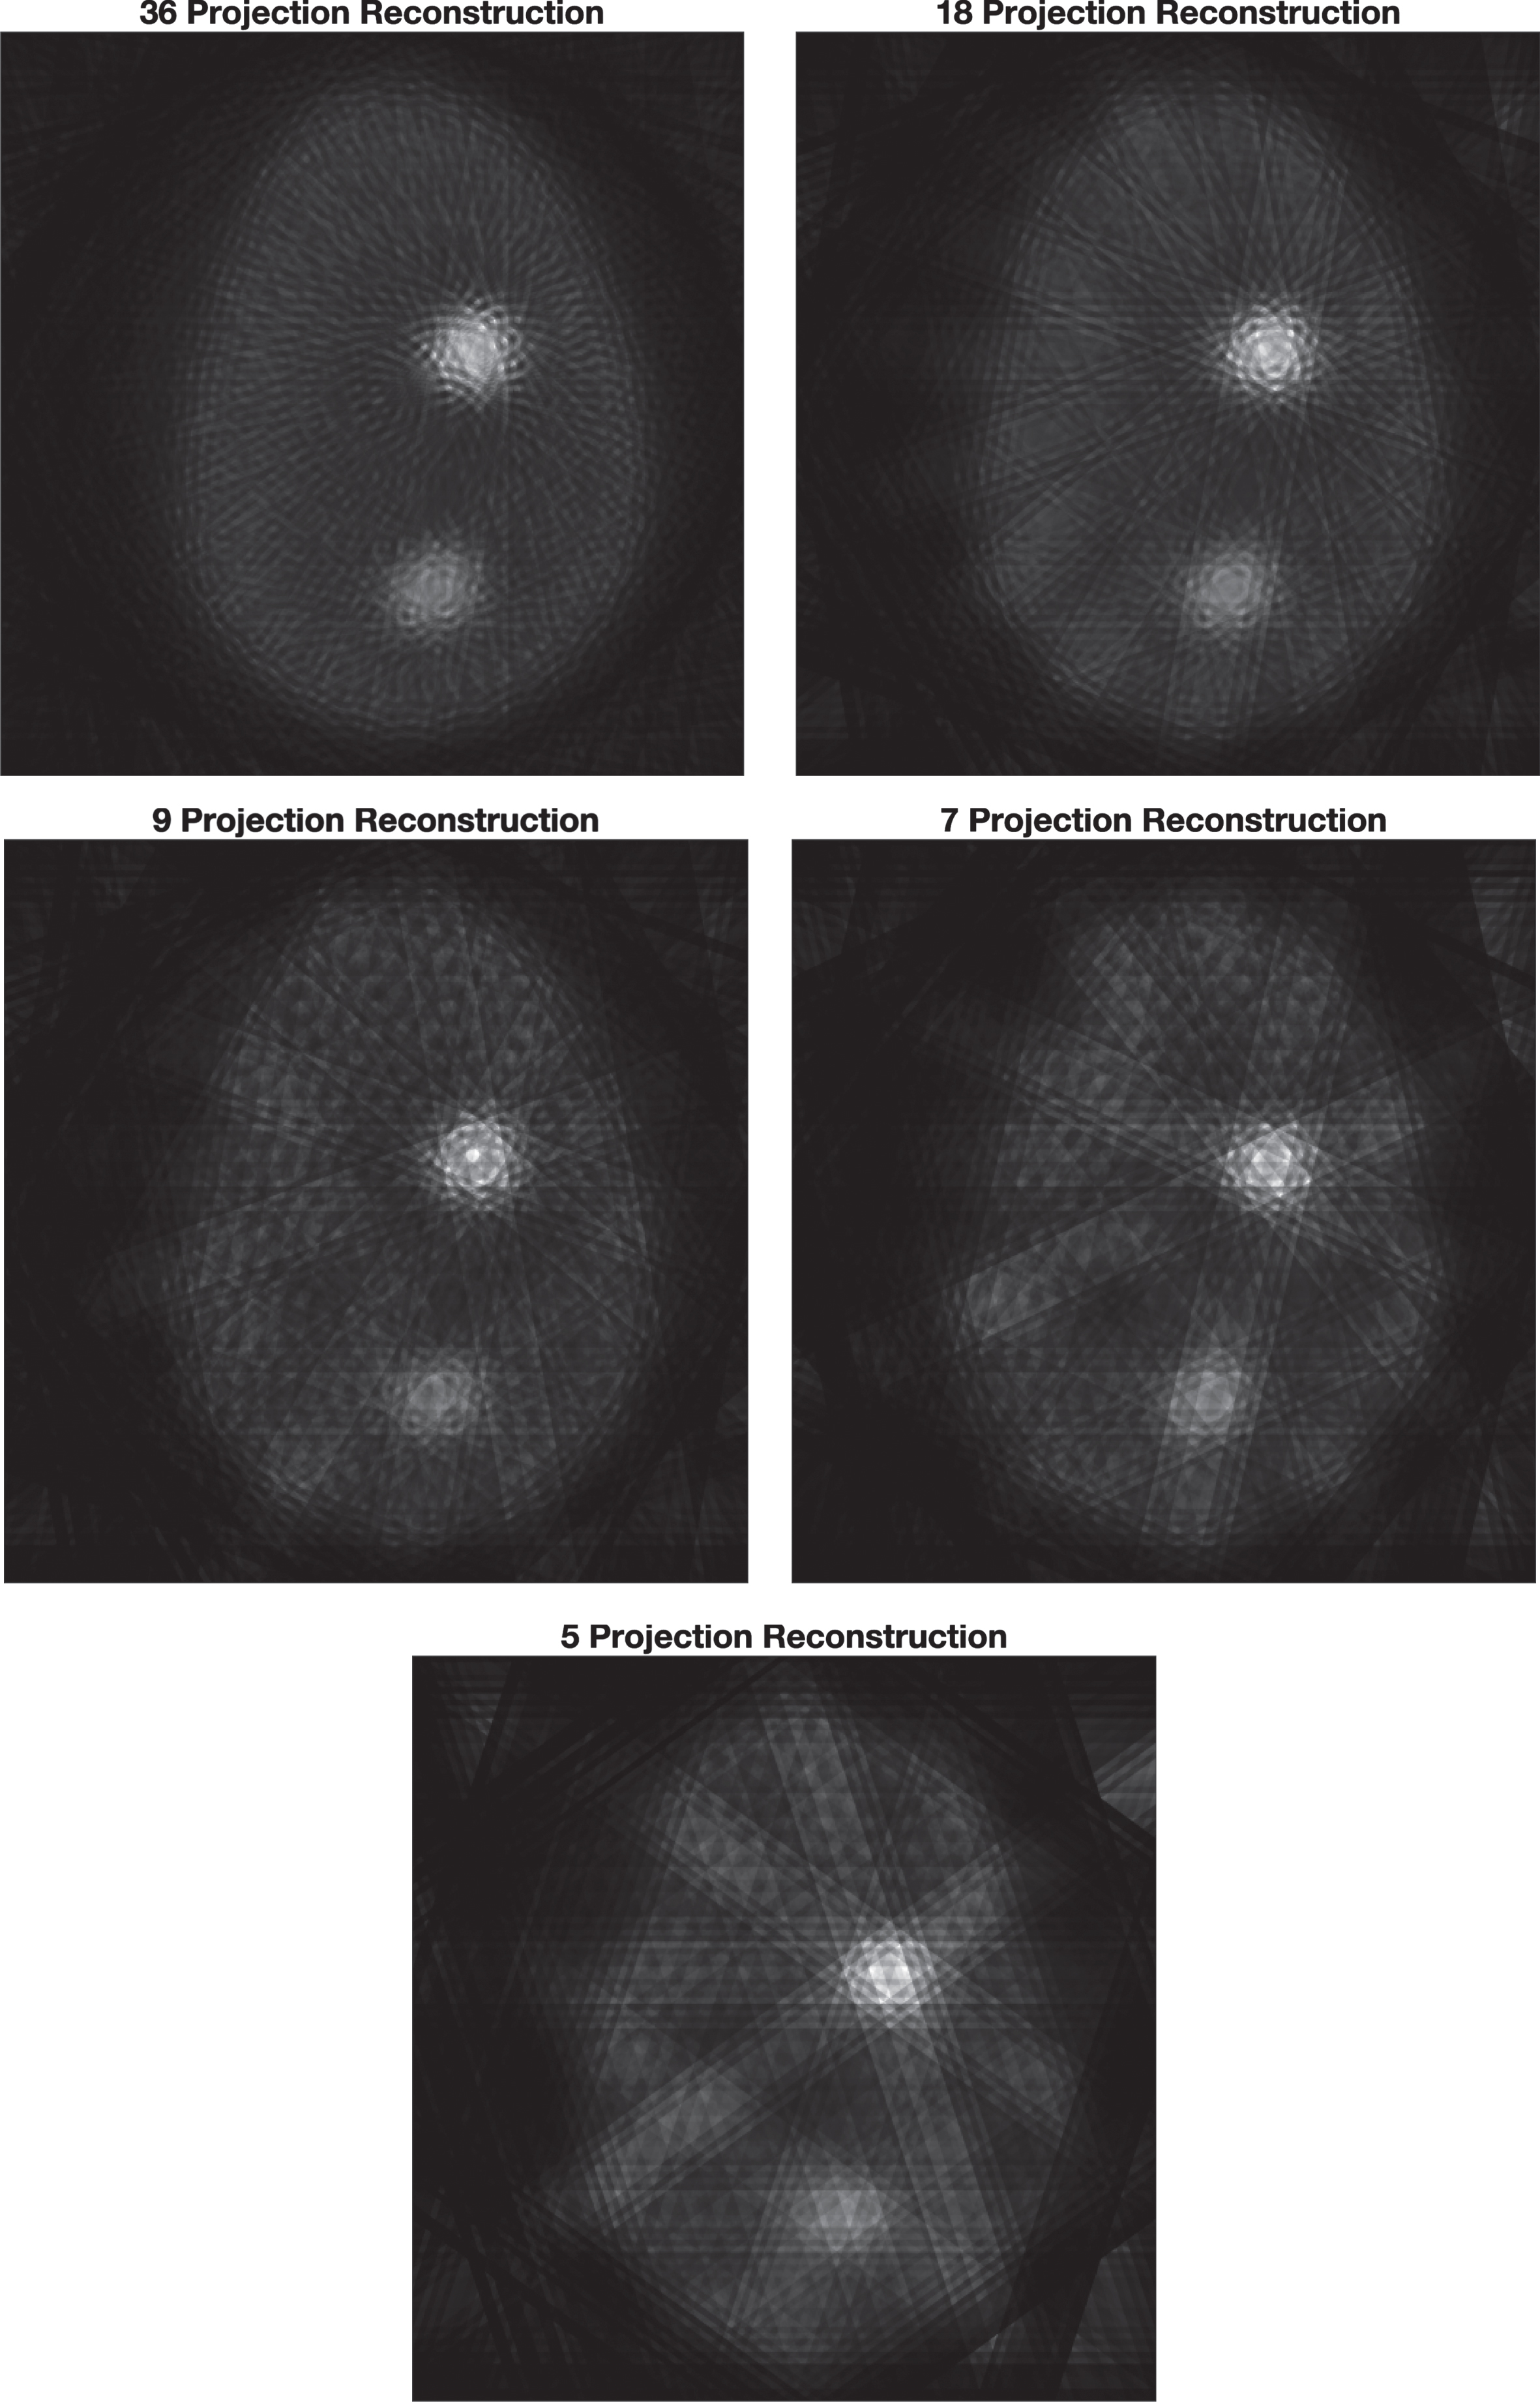
Cross-sectional view of the same slice as a function of the number of projections used in the reconstruction for the high-density phantom. The concentrations are 50, 125 and 3.3μCi/cm3 in the two tumoral masses and background respectively.
Tumoral mass uptake in μCi determined using the calibration curve and total signal integrated in the VOI for each mass as a function of the number of projections, in the high-density phantom
In the simulations carried out with both the medium- and high-density phantoms we have modeled tumoral mass uptakes ranging from about 5μCi/cm3 up to 145μCi/cm3, and in all cases, for concentration ratios of 10:1 or higher, when at least 7 projections are used to reconstruct the volumetric images, the error in the uptake determination using the calibration curve has been lower than 10%.
Table 3 shows the dose rate for each of the uptake distributions modeled in this work. The statistical uncertainty in these calculations is in the order of 0.5%. In general, the absorbed dose rate is highly dependent on the background activity distribution within the breast, but as shown in Table 3, when the dose rate is normalized by the total breast uptake, the results for each phantom are fairly independent of the particular details of the uptake distribution.
Dose rate and dose rate normalized by total breast uptake for all the distributions modeled in this work
Dose rate and dose rate normalized by total breast uptake for all the distributions modeled in this work
In the late 1990 s SPECT for breast imaging was thoroughly studied as it was believed to be more sensitive than planar imaging in the detection of breast tumors. While some studies did show an improvement in sensitivity [15], others did not [16]. However, in line with previous work from several groups [3, 6], what we propose is the use of SPECT as a tool in the quantification of tumoral mass uptake, thus not replacing but complementing the information yielded by the planar images obtained in an MBI study. Practical implementation of the proposed method would require of a calibration curve such as the one modeled in this work, for a range of activities that cover the potential uptake range. The calibration can be performed once, and the resultant curve stored for future use. In order for the calibration to be applied to the reconstructed molecular breast tomography images, it must be normalized in terms of each projection acquisition time, as must be the images reconstructed in the MBI study.
While the visual quality of the reconstructed images is obviously degraded as the number of projections made available to the reconstruction algorithm is reduced, the estimation of the activity uptake can still be made with a maximum error of around 10% or better regardless of the activity level within the tumoral mass, provided that at least 7 projections are used by the reconstruction algorithm and that concentration ratios between the tumoral mass and the background are at least 10:1 or greater. Using only 5 projections for the reconstruction process can result in errors that can be as high as 20%, for concentration ratios 10:1 or larger, and even higher, 33%, for lower concentration ratios. Previous work using 2D images to carry out uptake quantification reported errors in the order of 2% with confidence interval in the range ±16% to ±20%, but it should be pointed out that this was done for tumors with simple geometric shapes [5]. In this work, for reconstructions with 7 projections and regardless of the uptake concentration ratio, the average error from all the test cases examined is 7% with a standard deviation of ±6.6%. For concentration ratios above 10:1, the average error for 7-projection reconstructions is 4.3% with standard deviation of ±2.9%. Previous work using SPECT to quantify tumoral mass uptakes reported errors in the order of 10% [3] and 20% [6]. We believe that conclusions drawn from this work could be generalized for other concentration ratios and absolute uptake values. For example, on average a 5μCi/cm3 background concentration and a 40μCi/cm3 tumoral mass concentration could be equivalent to a 1.25μCi/cm3 and 10μCi/cm3 in the background and tumoral mass respectively, provided that the acquisition time for the lower concentrations is increased by a factor of 4.
As mentioned above, current technology used in MBI already employs dual head detectors to obtain two opposing views of the examined breast at two different angles [2]. Therefore, a total of 4 projections are already available in MBI imaging studies, with the caveat that, unlike what was modeled in this work, those 4 projections may not be evenly distributed in the angular direction and therefore a different imaging technique would be required to obtain the projections needed for the tomographic reconstruction. Based on our results, three more projections would be needed to obtain accuracies with an average accuracy around 7% or better. One obvious solution would be to increase the number of detectors available for the MBI study so that the overall study time remains the same. This is one of the reasons we chose to simulate a conventional CsI detector as they are significantly less expensive than CZT detectors used in currently available MBI commercial technology. The method proposed could be readily evaluated experimentally with current technology because, as mentioned above, the use of CZT detector technology available in commercial MBI systems, can only improve the scatter removal compared to what was achieved with the parallel tungsten collimator, yielding in principle more accurate reconstructions.
Conclusions
It has been shown that determination of Tc-99 m sestamibi uptake can be carried out using molecular breast tomography techniques with as few as 7 projections and an average accuracy of 7%, provided that a calibration curve relating pixel values, integrated over a VOI, with activity uptake has been previously obtained and that concentration ratios of at least 10:1 between the tumoral mass and the background are achieved. For lower concentration ratios, errors in the order of up to 20% may occur, even for reconstructions with more than 7 projections.
Footnotes
Acknowledgments
A. M. García-Esparza wishes to acknowledge the financial support from the National Council of Science and Technology (CONACyT, México) throughout her M.Sc. in Biomedical Physics and Engineering studies at Cinvestav Monterrey.